Article

Numerical and Techno-Economic Analysis of Batch Annealing Performance Improvements in Tinplate Manufacturing

1
College of Physical Sciences and Engineering, Cardiff University, Queen’s Buildings, 14-17 The Parade, Cardiff CF24 3AA, UK
2
Tata Steel UK Ltd., Trostre Works, Maes-Ar-Ddafen Road, Llanelli SA14 9SD, UK
*
Author to whom correspondence should be addressed.
Energies 2023, 16(20), 7040; https://doi.org/10.3390/en16207040
Submission received: 25 August 2023 / Revised: 28 September 2023 / Accepted: 6 October 2023 / Published: 11 October 2023
(This article belongs to the Section C: Energy Economics and Policy)

Abstract

:
The present study examines the performance improvement in the batch annealing process used in tinplate manufacturing by enhancing the heat transfer towards the steel coils and altering annealing cycle parameters. Presently, the heat transfer in the furnace is non-uniform, resulting in non-uniform temperature profiles and recrystallisation inside the coils, affecting the final coated steel quality. This study modelled a current furnace and four improvement proposals utilising transient computational fluid dynamics, to produce coil temperature profiles and rank the cases by the highest coil temperature uniformity achieved at the end of soaking. By increasing the soaking temperature and time, as well as the coiling tension before annealing and altering the coil size, the aim was to achieve higher and more uniform coil temperatures that could ensure successful recrystallisation with less defects, especially at the cold spot area in the middle of the coil. Then, a techno-economic analysis compared the cost-effectiveness of the scenarios based on the associated costs and the improvement in the scratching defects of the batch-annealed steel. Overall, most cases exhibited positive results regarding temperature uniformity enhancement, but increasing the coiling tension was considered the most promising option, due to the combination of a large defect reduction potential and cost savings per cycle.

1. Introduction

Steel is one of the key materials in today’s society, as it is crucial for manufacturing, construction, transportation, and most other aspects of everyday life, with its demand steadily growing. One well established use of steel is to produce tinplate, which is a thin, tin-coated, and low-carbon steel strip, used commonly in the packaging industry [1,2]. Tinplate manufacturing consists of several steps, starting with the pickling, cold reduction, cleaning, annealing, and temper rolling of steel coils and ending with the electrolytic tin coating process [3]. After cold rolling, steel becomes hard and strong but also more brittle; in order to restore the crystallography and the required ductility and relieve stresses, steel is annealed either in a continuous line or in batches, depending on the required properties [3].
Batch annealing, which is examined here, is a non-continuous process, where four or five steel coils are annealed at once, each time for around three days. The coils are arranged in stacks with convector plates between them, are enclosed in an inner cover containing a protective atmosphere (93% nitrogen–7% hydrogen), and then are surrounded by an outer cover furnace, where natural gas burners produce the required heat for the process (Figure 1) [4]. The annealing cycle comprises three segments: heating, high temperature soaking at over 600 °C, and cooling. In the heating stage, point defects and dislocations, which previously contributed to the substantial lattice distortions during cold rolling, are reorganised into a lower energy arrangement, resulting in the internal residual stresses being mostly relieved [5]. When the temperature increases further, recrystallisation commences with the nucleation and growth of new grains and the dissolution of the rest of the dislocations [6] and it is successfully concluded when the steel mechanical properties resemble the pre cold rolling properties, usually before the end of soaking [7]. For the examined batch annealing furnace and steel grade in tinplate manufacturing, recrystallisation is successfully completed when all coils have reached above 580 °C throughout their mass [8].
This temperature also creates the conditions for an interlap bonding or welding between adjacent coil laps, as a consequence of the temperature-led diffusion of the sodium silicate layer that was deposited previously on the strip surfaces in the cleaning line. This controlled breaking down of the silicate layer results in the desired level of sticking between laps, which will hold the coil tightly together and create some tension when it is uncoiled later at the start of the tempering mill [8].
Inside the inner cover of the batch annealing furnace all heat transfer modes occur: radiation between the high-temperature inner cover and the steel coil surfaces, conduction through the solids (coil and convector plates stack), and forced convection between the flowing protective atmosphere (induced by the base fan) and the cover and coil stack surfaces [10]. Nevertheless, batch annealing exhibits an inherent inefficiency; the non-uniformity in the heating of the steel coils, where the outer coil reaches higher temperatures faster and is subjected to heat for longer while waiting for the cold spots in the coil that lag behind in achieving the desired recrystallisation temperature [11]. This is caused by the large mass of steel being heated up and the much slower radial heat conduction inside the coil, due to thermal resistance by the silicate and air gap layers between steel coil laps [11]. The non-uniformity in the coil temperatures can result in non-uniform material properties and surface defects, such as defects from the sticking of adjacent laps caused by too much interlap bonding or scratching, due to the relative movement of coil laps not held tightly together caused by insufficient interlap bonding [12,13,14]. These can negatively affect the final tinplate product quality and result in substantial amounts of material being rejected and removed [8]. Enhancing the heat transfer inside the furnace and modifying the annealing cycle operating parameters could possibly reduce the non-uniformity of coil temperatures, thus, minimising defects, material rejection, and financial losses [15].
Increasing the soaking temperature could guarantee that the steel recrystallisation concludes successfully throughout the coil before the soaking stage finishes, because of the higher temperatures reached inside the coils due to the higher heat flux and the temperature-driven nature of interlap welding [16]. However, there is a limit to how much the soaking temperature can increase, as extreme temperatures can result in over-annealing and undesired steel mechanical properties, especially for the outer coil that is subjected to high heat for longer [8]. Moreover, increasing the soaking time by a number of hours could also lead to the same outcome, as this could provide more time for heat to be transferred through the coil and ensure the colder spots ‘catch up’ with the hotter outer coil; nevertheless, if they are soaked at high temperature for too long, over-annealing could again occur and batch annealing furnace productivity could be impacted significantly [16].
Successful recrystallisation and more uniform coil temperatures could also be accomplished by improving the convection heat transfer from the protective atmosphere to the coils. This could be achieved by increasing the hydrogen percentage in the furnace nitrogen–hydrogen protective atmosphere. When increasing the hydrogen percentage, the overall atmosphere gas thermal conductivity increases, since the thermal conductivity of hydrogen is seven-times higher than that of nitrogen, resulting in a more efficient heat transfer from the fluid to the outer coil surfaces and inside the coil air gaps where it also flows [17].
Finally, the conduction heat transfer inside the coil could also be improved, by increasing the total equivalent thermal conductivity of the coil. This could result in the cold spots achieving the necessary temperatures more quickly and possibly result in efficient interlap welding. The literature proposes that an increase in the coiling tension of the cleaning line before annealing could force coil laps closer together, accelerating surface recrystallisation and bonding reaction kinetics during annealing due to more contact points, while the reduction in the air gap thickness between adjacent laps would decrease the thermal resistance in the radial heat conduction [15]. However, tensions are significantly reduced inside the coils during annealing; thus, the actual outcome of this scenario is uncertain but could be successful if the interlap welding commences before tensions are relieved [12]. Finally, altering the size of the coils could also influence the conduction heat transfer rate. For instance, smaller coils would allow the heat to reach the inner coil much faster, ensuring higher temperatures at those problematic areas and better interlap bonding [12].

2. Materials and Methods

This study will expand on previous research work in a conference paper [18] that included a steady-state computational fluid dynamics (CFD) analysis of the current batch annealing furnace and four proposed improvements, including an increased soaking temperature, increased hydrogen content in the furnace atmosphere, increased coiling tension, and altered silicate layer thickness cases. Specifically, a more accurate and computationally expensive transient CFD model was first developed for the current furnace and validated with more recent industry thermocouple data from the Tata Steel Trostre Works, this time, instead of coil 2, concerning the steel coil temperature profile of the coil in position 3, which is the third from the bottom of the coil stack. Grid and time independence studies were also performed, to ensure that the CFD solution did not change depending on the mesh and time step sizes. Next, the most promising of the cases examined in the steady-state was also examined in a transient analysis, to confirm the positive impact on the coil temperature profile. Two new improvement proposals were also investigated in a transient CFD analysis, and a techno-economic analysis was employed in order to compare the cost-effectiveness of the proposals.

2.1. Computational Fluid Dynamics (CFD) Analysis

In computational fluid dynamics, several physical phenomena such as the fluid flow and heat transfer are estimated numerically by computing the mass, momentum, and energy conservation equations shown below for transient (unsteady) flows [19]. According to the following governing equation for the conservation of mass, the inlet rate of a mass into a system is equal to the total of the outlet rate of the mass departing the system and the mass accumulation rate within it, with ρ being the density and u, v, and w representing the cartesian fluid velocities [20]:
ρ t + ρ u x + ρ v y + ρ w z = 0
In the momentum conservation equations, it is shown that the rate at which the momentum of fluid particles changes in a controlled volume is equal to the sum of forces on those particles, with the left side of the equations representing the rates of change of momentum, the ρf components being the buoyancy and gravity body forces on the fluid, the τ x x x + τ y x y + τ z x z terms being the surface forces on the fluid, P the pressure upon the compressible fluid flow, and μ the fluid’s dynamic viscosity [20,21]:
x - dimension :   ρ D u D t   = p x + τ x x x + τ y x y + τ z x z + ρ f x = p + μ 2 u + ρ f x  
y - dimension :   ρ D v D t   = p y + τ x y x + τ y y y + τ z y z + ρ f y = p + μ 2 v + ρ f y
z - dimension :   ρ D w D t   = p z + τ x z x + τ y z y + τ z z z + ρ f z = p + μ 2 w + ρ f z
According to the following equation for the conservation of energy, the rate at which the fluid’s energy changes is equal to the total of the net rates of addition of heat and work into the fluid, where the first term represents the energy change, k 2 T represents the conduction of heat across the boundaries, S h represents any extra energy sources, and where the remaining terms are the net work, with the . ( ρ u ) component being body forces and the second term being surface stresses on the fluid [22]:
ρ D E D t = k 2 T + S h . ρ u + u τ x x x + u τ y x y + u τ z x z + v τ x y x + v τ y y y + v τ z y z + w τ x z x + w τ y z y + w τ z z z
A model geometry is converted to a mesh by dividing it into a large number of small control volumes and, commonly, the finite volume method is used to create discretised equations by integrating the partial differential governing equations over the mesh’s control volumes, with the variable of interest located at the centroid of each one (node) [23]. To transform the partial differential equations into linear algebraic equations, the unknown variables are approximated and the algebraic equations are solved iteratively, to derive a final solution for all nodal points [22]. The proximity to the exact solution of the differential equations dictates the accuracy of the CFD solution, and usually this increases with higher mesh quality and number of control volumes [23]. To derive a final CFD solution, at each iteration, the approximate solution should move progressively closer to the exact solution, until they are deemed ‘close enough’, or in other words achieve convergence [24]. Convergence is reached when predetermined convergence criteria are satisfied, mainly concerning several monitoring variables, such as the outlet temperature, and residuals reach certain values [24]. The residuals represent tolerances that the conservation equations must adhere to in all domain mesh cells and that are used to assess the imbalance of the CFD solution [24]. Finally, the nature of the phenomenon and time-dependence of fluid motion and temperature dictate if a transient (time-varying/unsteady) or steady-state (time-averaged) solution is selected [25]. For a transient analysis, the governing equations must be discretised both in space and time, with the temporal (time) discretisation including integration of every equation term over a specified time step (Δt) using implicit or explicit time-stepping schemes [26]. The time step value dictates the frequency of extracting data for the time-varying variables, the solution must converge at each time step after a specified number of inner iterations, and the time step must be small enough to capture the transient changes and maintain stability [27]. The Courant number is often used to determine the time step, that is the number of cells the fluid passes through in one time step, and for implicit schemes this can be higher than 1 (typically 1–10); however, it should not be too high in most of the domain, as this could lead to solution instability or inaccuracy [27,28]:
C o u r a n t = ( c h a r a c t e r i s t i c   f l o w   v e l o c i t y × Δ t ) / ( c h a r a c t e r i s t i c   c e l l   l e n g t h )  

2.1.1. Transient CFD Analysis of Current Furnace and Model Validation

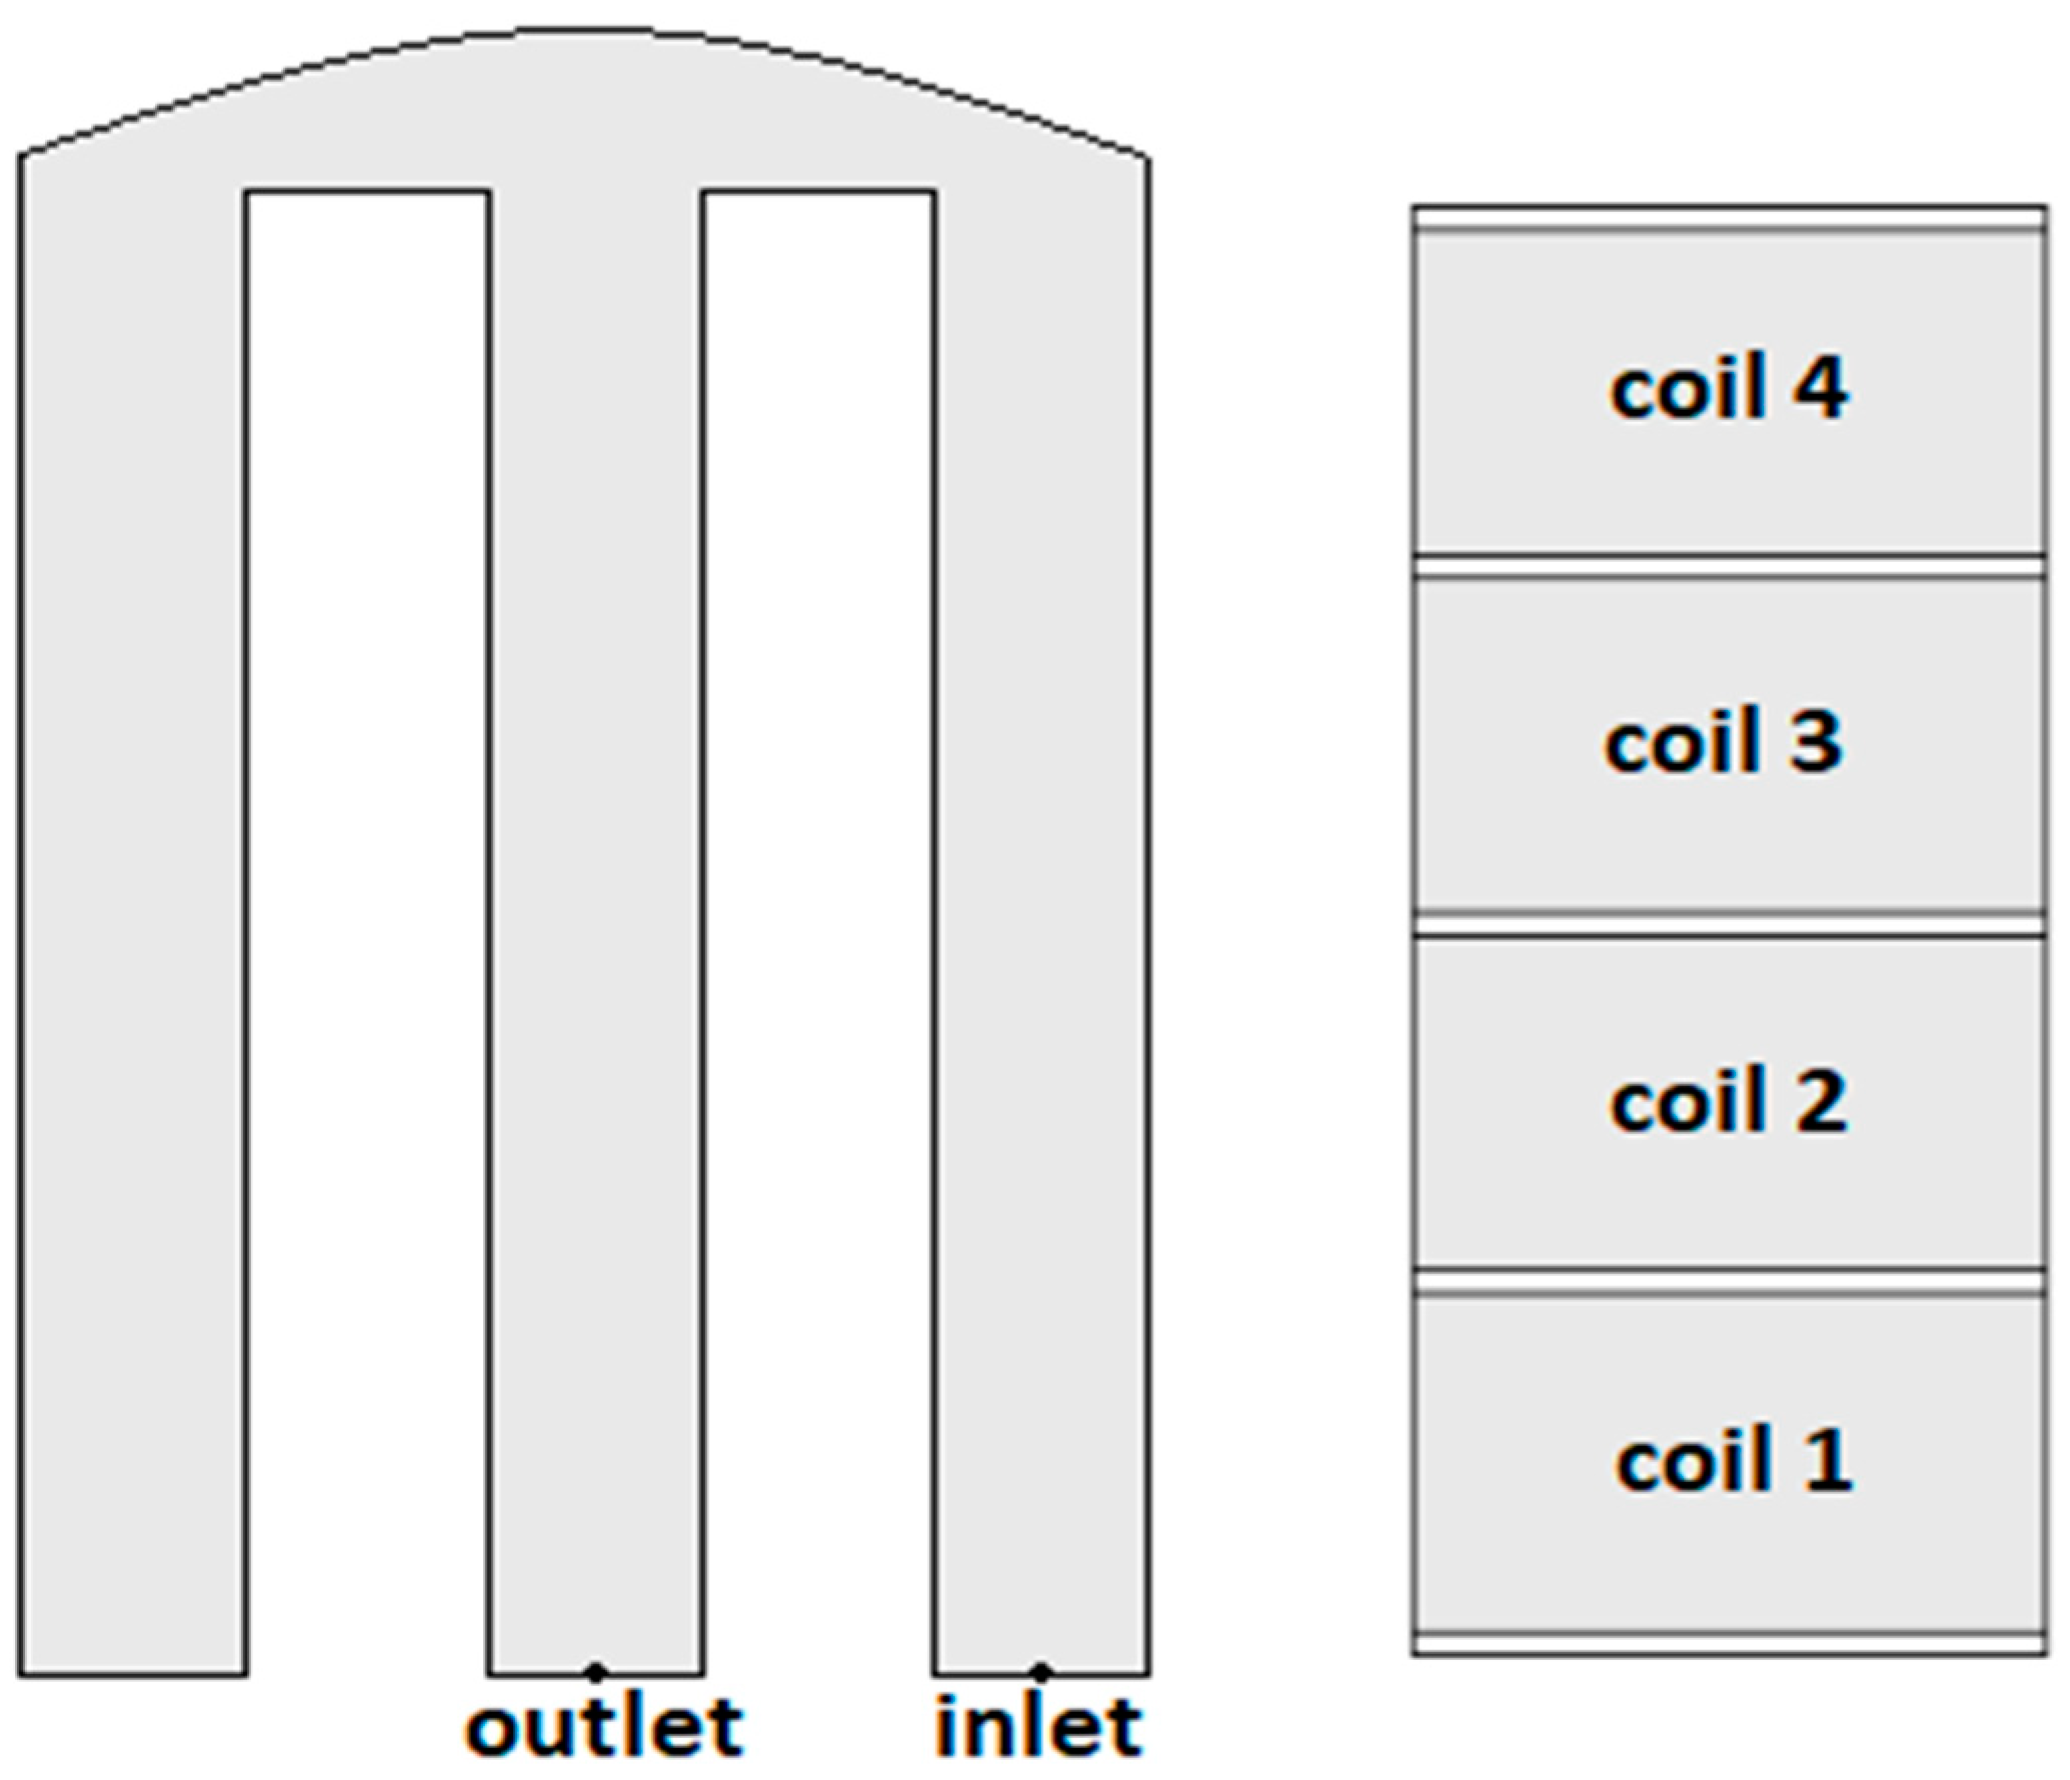
CFD analysis of a batch annealing furnace investigates a model geometry comprising only the space inside the inner cover, where the protective atmosphere flows, four steel coils, and the five convector plates between them. This study examined the most problematic furnace and steel types, namely a furnace with a 93% nitrogen–7% hydrogen protective atmosphere and T57 3564 steel coils with 1700 mm diameter, 1017 mm steel sheet width, and 0.180 mm strip thickness [8]. Further important furnace geometry information is presented in Supplementary Material Table S3 Constraints on computer resources and time, and the focus on steel recrystallisation during soaking, resulted in the investigation being limited to the soaking segment of the annealing cycle, where the soaking temperature is mostly constant with time, and resulted in the CFD model geometry being split into a fluid-only and a solid-only model, examined separately in ANSYS Fluent 2019R1 (Ansys Inc., Canonsburg, PA, USA) and STARCCM+ 2019.3 (Siemens, Munich, Germany) software, respectively. The fluid-only model geometry comprised the protective atmosphere flowing around and inside the coil stack, whereas the solid-only geometry consisted of the four-coil and five-convector plate stack (Figure 2). The fluid model results were first obtained and then input, in the form of heat fluxes (W/m2), as boundary conditions for the individual outer and core surfaces of the coil stack in the solid-only model, so that finally the coil temperature profiles could be derived. The nature of the annealing process, where temperatures and boundary conditions varied with time, dictated that a transient, time-varying analysis was most suitable for both models.

Fluid-Only CFD Model

A tetrahedral mesh was used for the fluid, for a better solution accuracy, with refined mesh and inflation layers near the fluid boundaries [24]. The first order implicit scheme was employed for the transient formulation in Ansys Fluent. The realisable k-ε turbulence model was used for this study, where k is the turbulent kinetic energy and ε the turbulence dissipation, as it is more accurate in the prediction of turbulence than the standard k-ε, while still having reduced computational expense, and the focus remained on heat transfer calculations [25]. Wall functions were used to determine the velocity gradients at the layer adjacent to the wall and the unsteady state transport equations for k and ε are as follows [25]:
t ρ k + x j ρ k u j = x j μ + μ t σ k k x j + G k + G b ρ ε Y M + S k
t ρ ε + x j ρ ε u j = x j μ + μ t σ ε ε x j + ρ C 1 S ε C 2 ρ ε 2 k + ν ε + C 1 ε ε k C 3 ε G b + S ε
with ρ being the density; μt the turbulent viscosity; uj the fluid velocities; σk and σε the turbulent Prandtl terms for k and ε, respectively; Sk, Sε, and the C terms being predetermined empirical components; G k and G b the production of turbulent kinetic energy from velocity gradients and buoyancy; and YM the impact of fluid flow ‘dilatation dissipation’ on turbulence [25].
A surface-to-surface radiation model was used, as it was assumed that the protective atmosphere has zero optical thickness, radiation is exchanged only between the inner cover and the coil surfaces, and all surfaces are ‘grey’ and diffuse, with the radiation calculations based on the view factors method [25]. The view factors method takes into account the size, distance, and orientation of surfaces to express the fraction of radiation reaching from surface i to surface j, as shown below, where δij is the visibility of dAj by dAi, with a value of 1 if it is visible and a value of 0 if it is not [25]:
F i j = 1 A i A i   A j   cos θ i cos θ j π r 2   δ i j d A i d A j
The radiation equation solved for a surface k, dictating that the energy leaving the surface equals the energy emitted and reflected, is presented below, where σ is the Stefan–Boltzmann constant, T the temperature, ε emissivity, and ρ absorptivity [25].
q o u t , k = ε k σ T k 4 + ρ k j = 1 N F k j q o u t , j
Due to computer and time constraints and the focus being on heat transfer inside the coils, some assumptions and simplifications were made, such as a simplified geometry, no heat loss to the environment, and removal of the furnace base fan from the CFD geometry with its turbulence effect of increased fluid velocity integrated into the inlet flow turbulent intensity parameter, changing from 5.069% to 4.93% according to these equations for the turbulence intensity and Reynolds number [29]:
T u r b u l e n t   i n t e n s i t y   % = 0.16 × R e 1 / 8 × 100 %   ,   with   R e = ρ u L / μ
The heat generated by the natural gas burners in the outer cover was translated into a constant temperature of the inner cover during the soaking segment at 635 °C, a value determined through a simplified CFD model of the outer furnace (presented in Supplementary Material Section S1). The time step value for this transient simulation was estimated using an empirical expression for fluid domains, where the characteristic cell length used was the smallest cell of the domain [27]:
Δ t = 1 / 3   ( ( c h a r a c t e r i s t i c   c e l l   l e n g t h ) / ( c h a r a c t e r i s t i c   f l o w   v e l o c i t y ) )  
The transient CFD model was initialised based on data from industry regarding the coils and protective atmosphere, the total time of the simulation was 28,800 s (8 h), and the final time step chosen was 0.0006 s (from the time step independence study). The maximum Courant number was found to be 0.3232 close to the inlet where the velocity was highest (2.693 m/s) for the smallest cell size cells of the mesh (0.005 m). More information on the fluid-only CFD model mesh, setup, and boundary conditions is presented in Supplementary Material Table S4.

Solid-Only CFD Model

A hexahedral mesh was used for the solid coils and convector plates, which decreased the total cell number of the model [24]. For a non-moving, solid-only model the energy Equation (5) was limited to just Fourier’s law for conduction ( k 2 T ) plus any enthalpy sources (Sh) [30]. For the calculation of a time step size for the solid bodies, an empirical formulation concerning the heat conduction within solids was employed, using the model’s smallest mesh refinement size and the material properties of the solid (thermal conductivity, density, heat capacity) [27]:
Δ t = L 2 / ( ( k / ( ρ C p   ) )   )
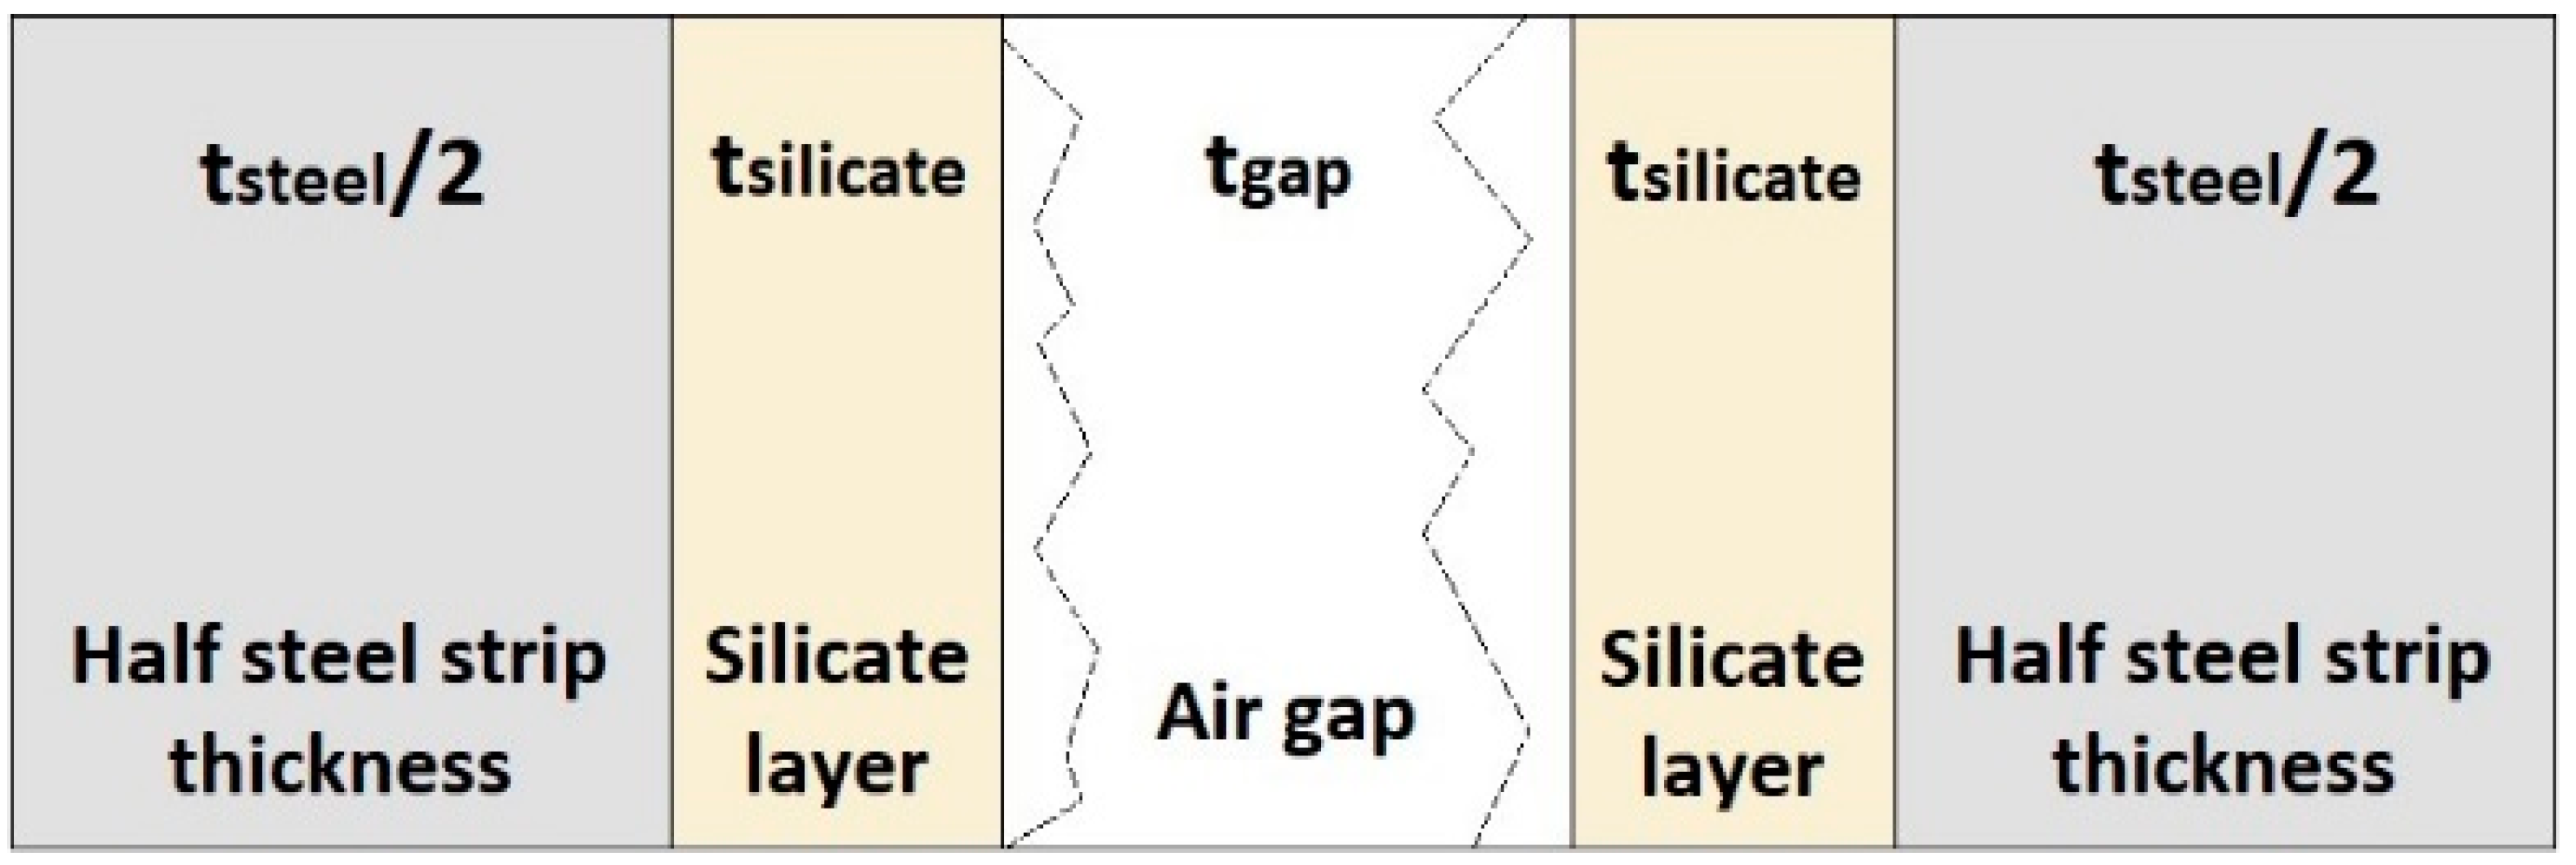
The transient CFD model was initialised in StarCCM+ based on temperature data from industry, the total time of the simulation was 28,800 s (8 h), and the final time step chosen was 12 s (from the time step independence study). More information on the solid-only CFD model mesh, setup, and boundary conditions is presented in Supplementary Material Table S5. The heat flux boundary conditions used for all coil stack surfaces are presented in detail in Supplementary Material Table S8. The coil was simulated as a single solid body, comprising steel, silicate, and interlap air gap layers, with material properties calculated as the average of the three materials, based on the relative thicknesses and anisotropic thermal conductivity [31]. From the literature, the thermal conductivity in the axial direction was assumed to equal that of the specific steel, as the heat conduction in that direction mostly takes place through the steel layer and not the other two materials [31]. The thermal conductivity in the radial direction was determined based on thermal resistance circuits (Figure 3), which suggests that, as in electrical circuits, the total resistance in conduction heat transfer is equal to the sum of individual resistances, where each resistance is equal to the ratio of the length to the thermal conductivity of the material [13,17,32]. Here, conduction takes place between the layers of steel, silicates, air gap, and gap contact points; therefore, the equivalent coil radial conductivity was calculated from the following formulation, with t and k being the material thicknesses and thermal conductivities, correspondingly; kr,eq the total equivalent coil thermal conductivity in the radial direction; and Acontact% the interlap contact inside the coil [13,17,32]:
t t o t a l k r , e q = t s t e e l k s t e e l + 2 t s i l i c a t e k s i l i c a t e + t g a p k s t e e l A c o n t a c t % + k g a s 1 A c o n t a c t %
To calculate the equivalent thermal conductivity in the radial direction of the coil for the current furnace, the following calculations were performed first for the air gap between coil laps, where convection and radiation is ignored due to the small space resulting in a stationary protective gas [13,32]. First, the dimensionless contact strain ε c * , elastic-plastic micro hardness Hep, elastic-plastic parameter fep and non-dimensional relative separation distance λ were calculated as follows, where η = 3.55 μm is the effective surface roughness, σy = 250 MPa is the steel yield stress, m = 0.032 rad is the effective mean asperity slope, E = 210 GPa is the Young’s modulus, and P = 50 MPa is the radial stress (coiling tension here) [13,32]:
ε c * = 1.67 m E σ y
H e p = 2.76   σ y 1 + 6.5 ε c * 2
f e p = 1 + 6.5 / ε c * 2 / 1 + 13 / ε c * 1.2 1.2
λ = 2   e r f c 1 2   P f e p   H e p
Then, the average separation distance t g a p , gap conductance hgap, and gap conductivity through contact points k g a p were calculated, as follows [13,32]:
t g a p = λ × η
h g a p = k s t e e l   m η x 1 2 2 π x f e p · e λ 2 / 2 1 f e p 2   e r f c λ 2 1.5
k g a p = t g a p × h g a p
Finally, the percentage contact between adjacent coil laps A c o n t a c t % was determined from the following equation, where ksteel was the thermal conductivity of steel [13,32]:
k s t e e l A c o n t a c t % = k g a p
The contact area percentage (Acontact%) between the coil laps was calculated at 580 °C and the coil lap expansion due to temperature was ignored due to simplification and to the constant nature of the soaking segment; therefore, the calculated Acontact% remained constant. A value of 0.53% was derived for the current furnace, which is less than 1%, therefore agreeing with the literature [33]. For the improvement scenarios, Acontact% was only changed for the increased tension cases, by changing the value of the radial stress P accordingly in the above calculations.

Validation of CFD Models

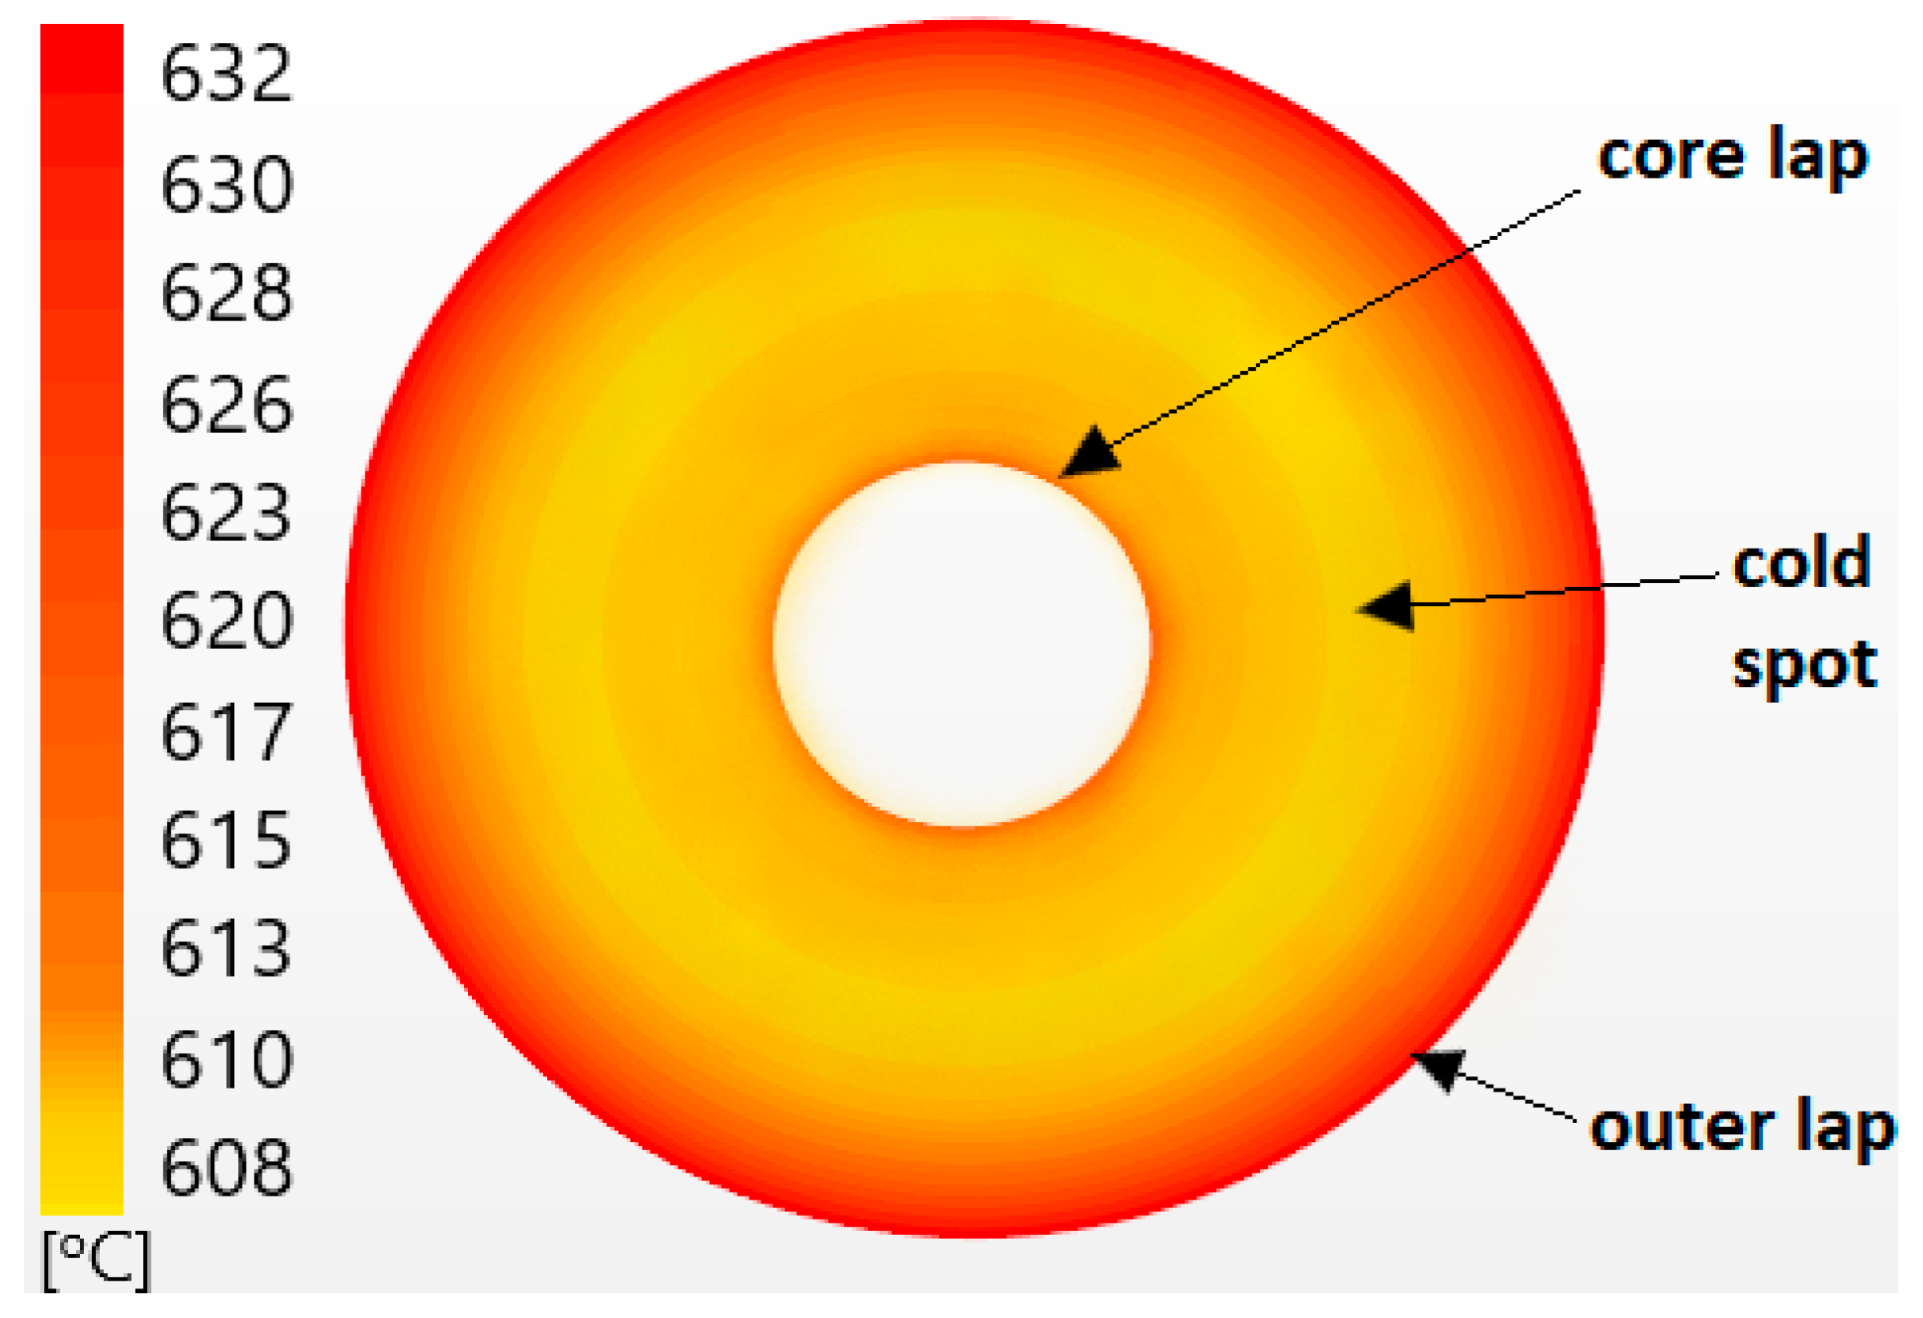
Furthermore, this study focused on the temperature profile of coil 3, the third from the bottom of the coil stack, since this is one of the worst product quality performance furnace positions and recent 2021 thermocouple data are available for it from industrial trials separate to this study. To validate the CFD models using the thermocouple data, three coil areas were monitored in the simulation: the outer coil lap, the core lap, and the cold spot area, located at the same spots in coil 3 as where the thermocouples were inserted for the industrial measurements campaign (Figure 4). The solid model was validated first, directly from the thermocouple data for coil 3, validating at the same time the heat fluxes used as boundary conditions and, therefore, indirectly the fluid model using its results (boundary heat fluxes). It is worth mentioning that the thermocouples used to obtain the data were Type K Class 2, the data recorder used was a Eurotherm 6100 A, the software used to extract the data was Eurotherm Review, and the quoted accuracy (error) of the K-type thermocouple was given by the manufacturer as a maximum of ±2.2 °C or ±0.75% [8]. The three thermocouples were manually inserted into the top of coil 3 using a ladder to access the top of the coil at the following positions [8]:
  • Outer thermocouple—3 cm from coil outer edge and depth of 19.5 cm into coil
  • Middle thermocouple—32 cm in from coil outer edge and depth of 32 cm into coil
  • Core thermocouple—7 cm in from coil core edge and depth of 18.5 cm into coil
The thermocouples monitored the temperatures for the entire annealing process (heating, soaking, and cooling) and produced temperature–time profiles, from which only the soaking data were utilised for this study. It is worth noting that, for the CFD model validation, the cold spot area was represented by a circle that was 32 cm into the coil from the outer edge, and the cold spot temperature was calculated as the average temperature across all points of the circle. Finally, even though both the thermocouple measurements and the CFD modelling had inherent calculation errors, if the CFD model closely approximated the obtained thermocouple data, then the transient current furnace CFD results would be considered acceptable and the CFD model would be valid for use for the enhanced cases.
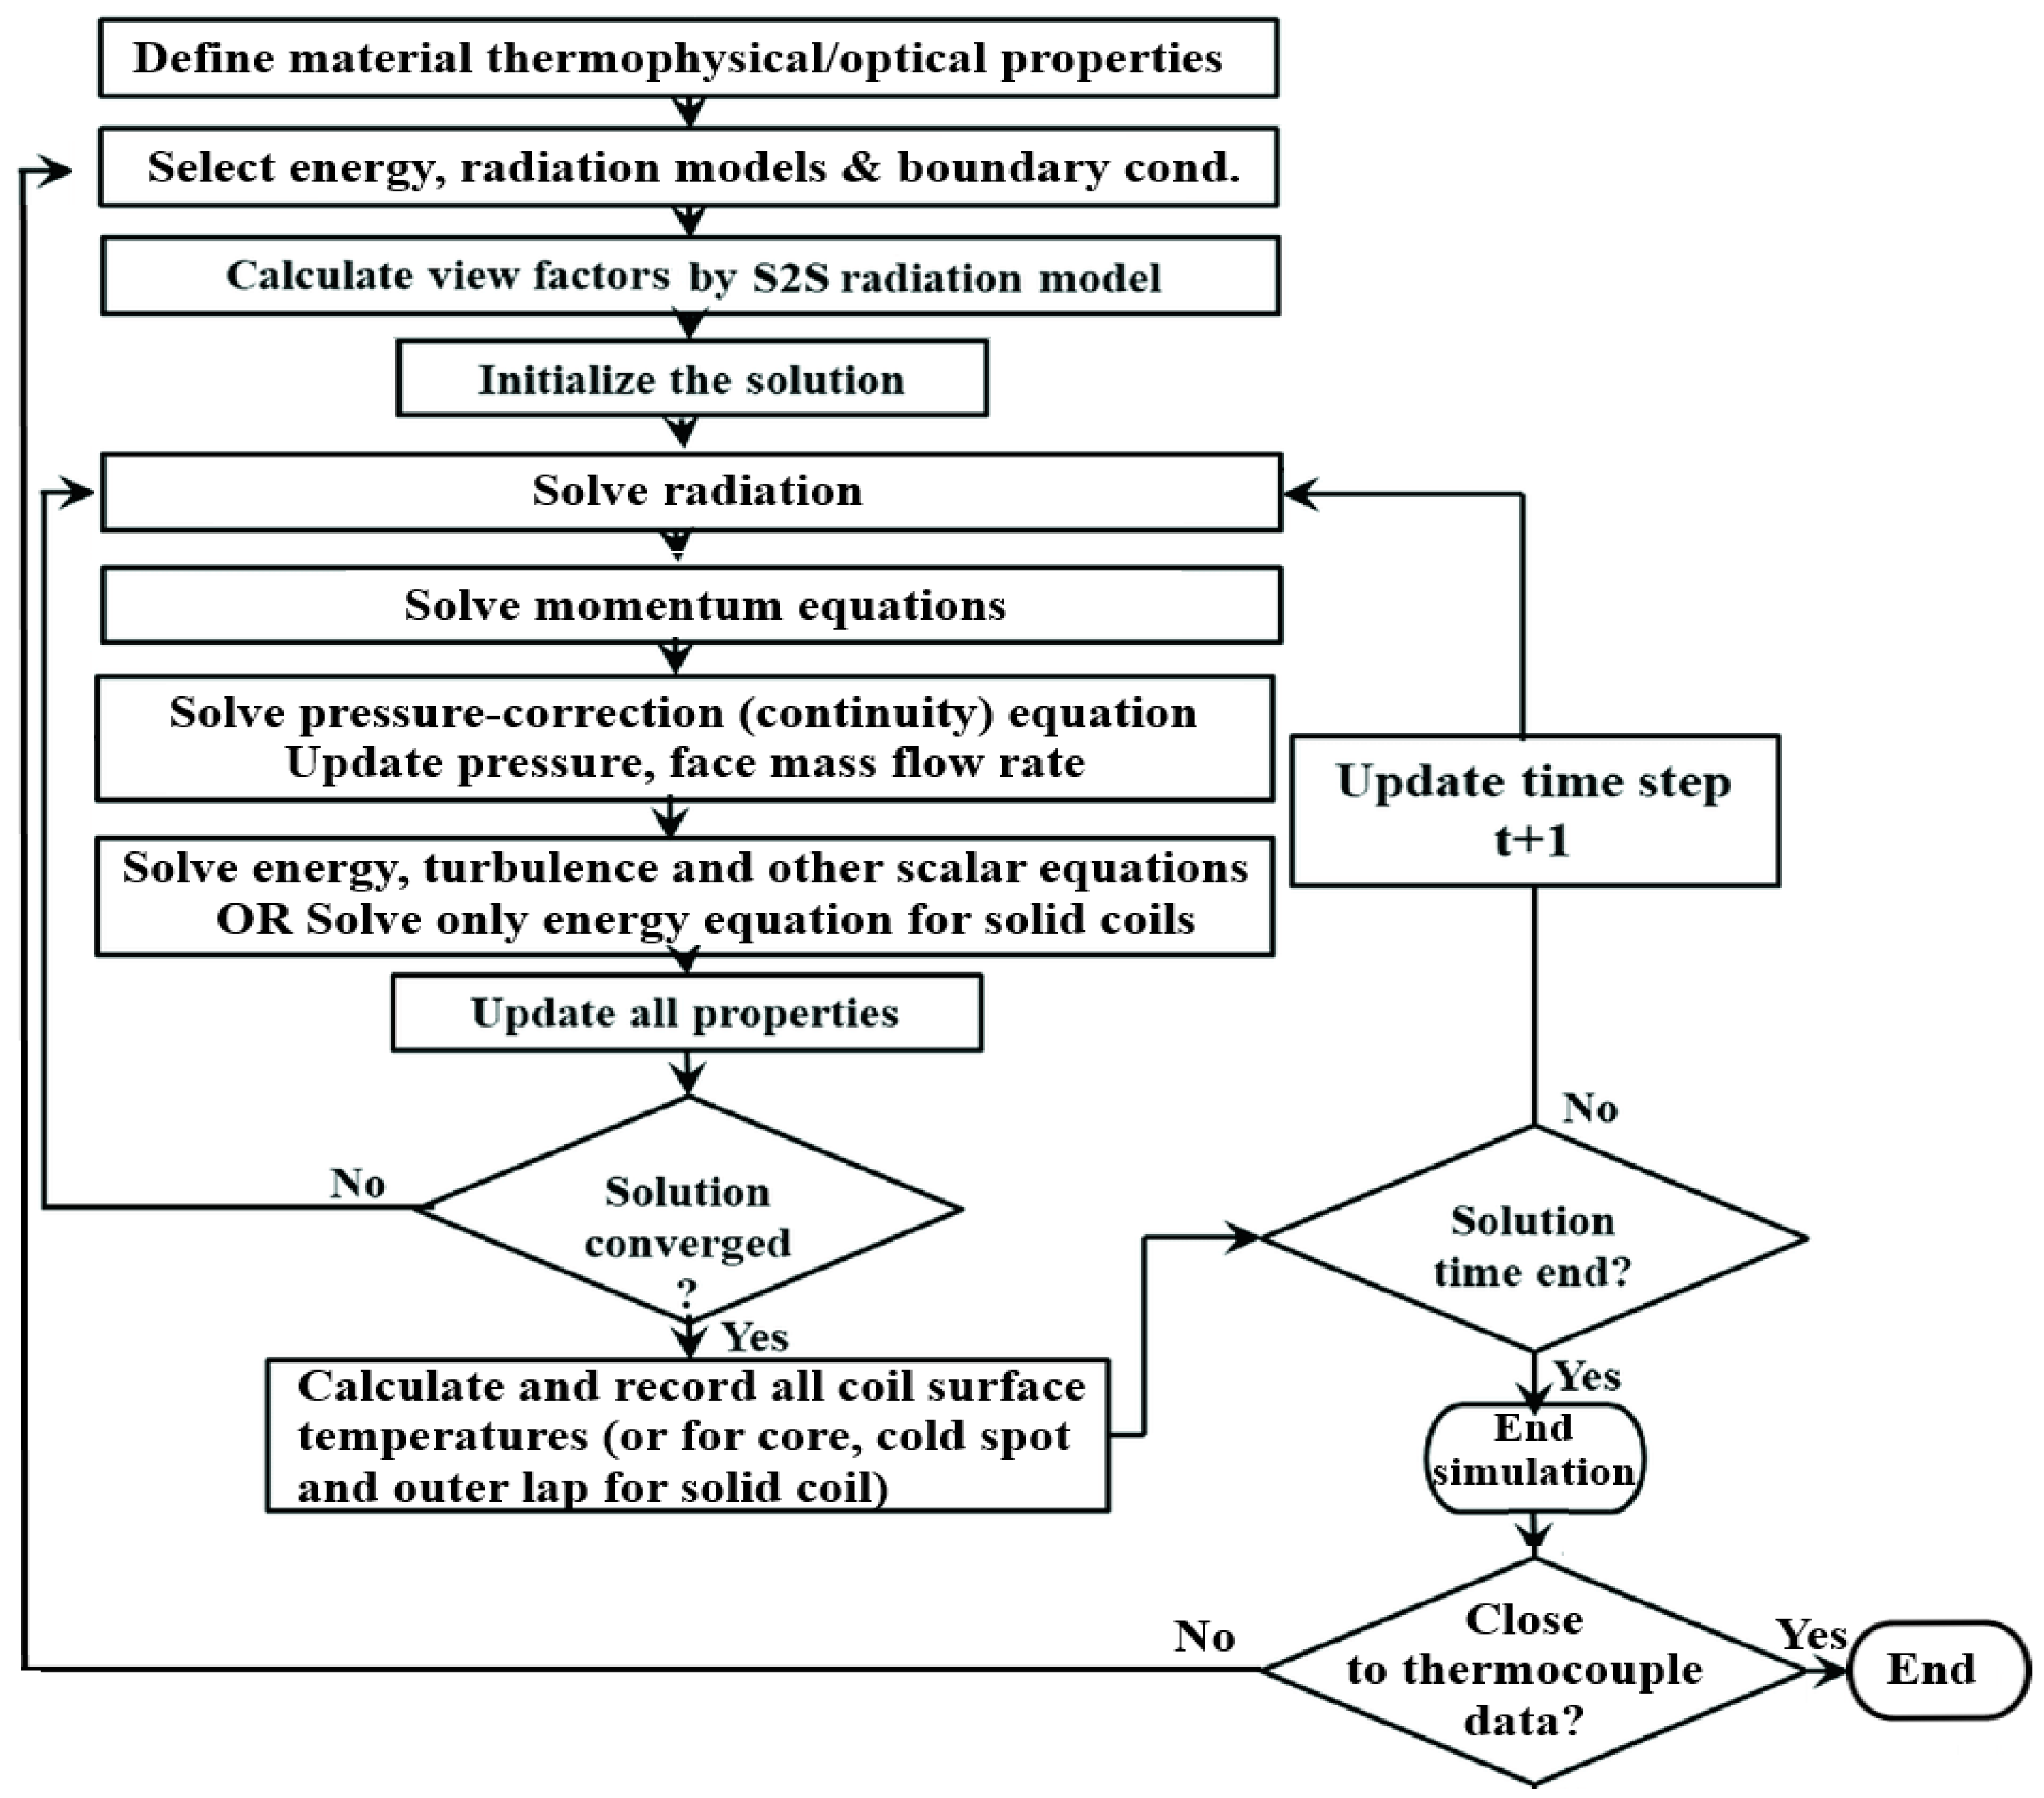
To better understand the calculation workflow for the transient CFD analysis of the current furnace, the following flowchart (Figure 5) is presented that is based on the literature [34,35], where a segregated algorithm for the fluid and the solid models leads to the calculation of the required coil temperatures and finally to the thermocouple validation.

2.1.2. Grid and Time-Step Independency Study

To achieve true convergence of the transient CFD solution, the solution also had to remain unchanged with mesh size/structure changes and time-step changes [24,36]. If the solution changes, then it is incorrect and a new solution process has to take place with a finer mesh/timestep size, with the domain divided into more cells, or smaller time step, respectively, to improve accuracy [36,37]. To examine this, a grid independence study was conducted by investigating at least three mesh sizes, while monitoring the value stability of output variables of interest, with the solution considered acceptably converged when there was less than 1% difference from one mesh size to the next for the output variable solutions [37]. The grid independence study was performed while maintaining a constant time step for each model. Next, a time-step independence study was performed using the same process, while maintaining constant the chosen mesh sizes for each CFD model from the grid independence study [36]. For both models, the computational expense of each mesh size model was exhibited as the real running time (hours) of the simulation on the computer, while the computational effort for each time step size case was expressed by the number of steps, obtained by dividing the total time by the time step size [38]. The combination of the two studies indicated the acceptable mesh and time step sizes for the fluid and solid models.

2.1.3. Transient CFD Analysis of Furnace Improvement Scenarios

The validated transient fluid and solid CFD models were then used in combination to assess the most promising of the previously examined steady-state enhancement cases [18], as well as the two new improvement proposals. Specifically, from previous work, the soaking temperatures increased by 5 °C and 10 °C and the 100% and 200% increase in the coiling tension before batch annealing were the most promising cases regarding the coil temperature profile [18]. The two new improvement proposals concerned an increased soaking time by 2 and 4 h for the current furnace and an alteration in the coil batch size, with a batch of smaller size and weight coils weighing 13.38 tonnes each (soaking for 7 h) and a batch of larger coils weighing 16.21 tonnes each (soaking for 9 h) being examined. The fluid model of each case produced the boundary heat fluxes used by the corresponding solid-only model, with all the boundary heat fluxes for the individual surfaces and cases listed in detail in the Supplementary Material Tables S8–S14. The boundary heat fluxes remained the same as the current furnace for all the altered tension cases, as the only changes in these cases occurred inside the solid coils and not in the fluid model. Finally, the temperature profile of coil 3 was produced for each case, and the CFD results for the end of soaking were compared to the current furnace case and ranked in terms of the temperature uniformity achieved inside the coil, which can be linked to improved and more uniform steel recrystallisation and product properties [16]. The temperature uniformity was here expressed by the maximum temperature difference Δ T m a x   between the hottest and coldest areas inside coil 3, with a smaller temperature difference indicating a more uniform coil temperature profile [15]:
Δ T m a x = T c o i l , m a x T c o i l , m i n ,
where the maximum temperature would be the outer coil lap temperature, whereas the minimum would be the average temperature of the cold spot area (the average of the points across the circle of chosen radius of the thermocouple measurement procedure).

2.2. Technoeconomic Analysis of Promising Improvement Scenarios

After the CFD modelling, a technoeconomic analysis of the proposed improvements was deemed necessary in this case, to estimate the cost-effectiveness of the proposals. The most promising scenarios in the CFD analysis were examined by calculating all the costs associated with the batch annealing process for each case. For this analysis, only a specific defect, scratching (or rough steel), was investigated, since the available industry information and data from large-scale trials are mainly focused on this recurring issue [8]. The proposed scenarios for improving product quality in the batch annealing process, apart from possible savings regarding the decrease in the specific defect, could also generate increased costs (e.g., longer time to reach higher furnace temperature) [8,39]. Specifically, the cost calculations included the operational costs of equipment and fluid streams, furnace availability and productivity costs, the cost of material rejection due to the scratching defect, and the capital investment cost for any new equipment. All the calculations were performed for one annealing batch of four coils and one heating cycle of the annealing process, consisting of the heating and soaking segments, which totalled to 32 h for the specific current furnace case examined [8].
The operational costs per one heating cycle included the equipment running cost of the base fan and combustion air fan and the stream costs for combustion and the furnace protective atmosphere of nitrogen and hydrogen [8]. The total operating cost was calculated using the sum of the above costs. The running cost for both the base fan and the combustion air fan is expressed as follows [40]:
C e q u i p m e n t = W × t h e a t i n g × c e l e c t r i c i t y
where W is the equipment capacity, and heating time refers to the total heating and soaking segment time. The stream cost for the natural gas (NG) combustion process that provides the heat to the furnace and the volumetric flow of natural gas for each burner are calculated as follows, with N being the number of burners [41,42]:
C c o m b u s t i o n   s t r e a m   = N × Q ˙ N G × t h e a t i n g × c N G
Q ˙ N G = W / ( q × η / 100 )
with W referring to the burner capacity, q to the specific calorific value of natural gas (8320 kcal/m3 here [43]), and η to the burner energy efficiency (80% here for 700 °C outlet temperature and 40% air preheat [44]). The stream cost for the nitrogen–hydrogen furnace protective atmosphere inside the inner cover is calculated as a sum of the individual nitrogen and hydrogen stream costs, which are expressed as follows [41]:
C N 2 = Q ˙ N 2 × t h e a t i n g × c n i t r o g e n
C H 2 = Q ˙ H 2 × t h e a t i n g × c h y d r o g e n
where the volumetric flows of the two gases are calculated as [45]:
Q ˙ N 2 = N 2 % × Q ˙ p r o t e c t i v e   a t m o s p h e r e
Q ˙ H 2 = H 2 % × Q ˙ p r o t e c t i v e   a t m o s p h e r e
Next, the furnace availability and loss of productivity costs were determined based on any hours added to the heating cycle, which are translated into loss of revenue from reduced productivity, and based on less or more product annealed per batch also being translated into loss or gain of revenue from the reduced or increased productivity, correspondingly [8]. The total furnace availability cost is the sum of the two costs. The furnace availability cost due to time added to the annealing cycle is calculated as follows [8,39]:
C a v a i l a b i l i t y ,   t i m e = t a d d e d × %   l e s s   p r o d u c t   p e r   h o u r   a d d e d 100 × L × c s t e e l
where % less product per hour added = 1.24% (from industry data) [8]. The furnace availability cost due to less product being annealed per batch was determined using the following equation, where the value becomes negative when more product is annealed per batch than the current furnace, indicating savings instead of costs [8,39]:
C a v a i l a b i l i t y ,   p r o d u c t = L n o r m a l L a l t e r e d × c s t e e l
Moreover, the material rejection cost due to the scratching defect was computed based on a rejection percentage per annealing batch, which is expressed by the percentage of meters of steel strip removed from the total length of the four coils in the batch load, and on the average price per tonne of the tin coated steel examined, as follows [8]:
C m a t e r i a l   r e j e c t i o n = r e j e c t i o n   % 100 × L × c s t e e l
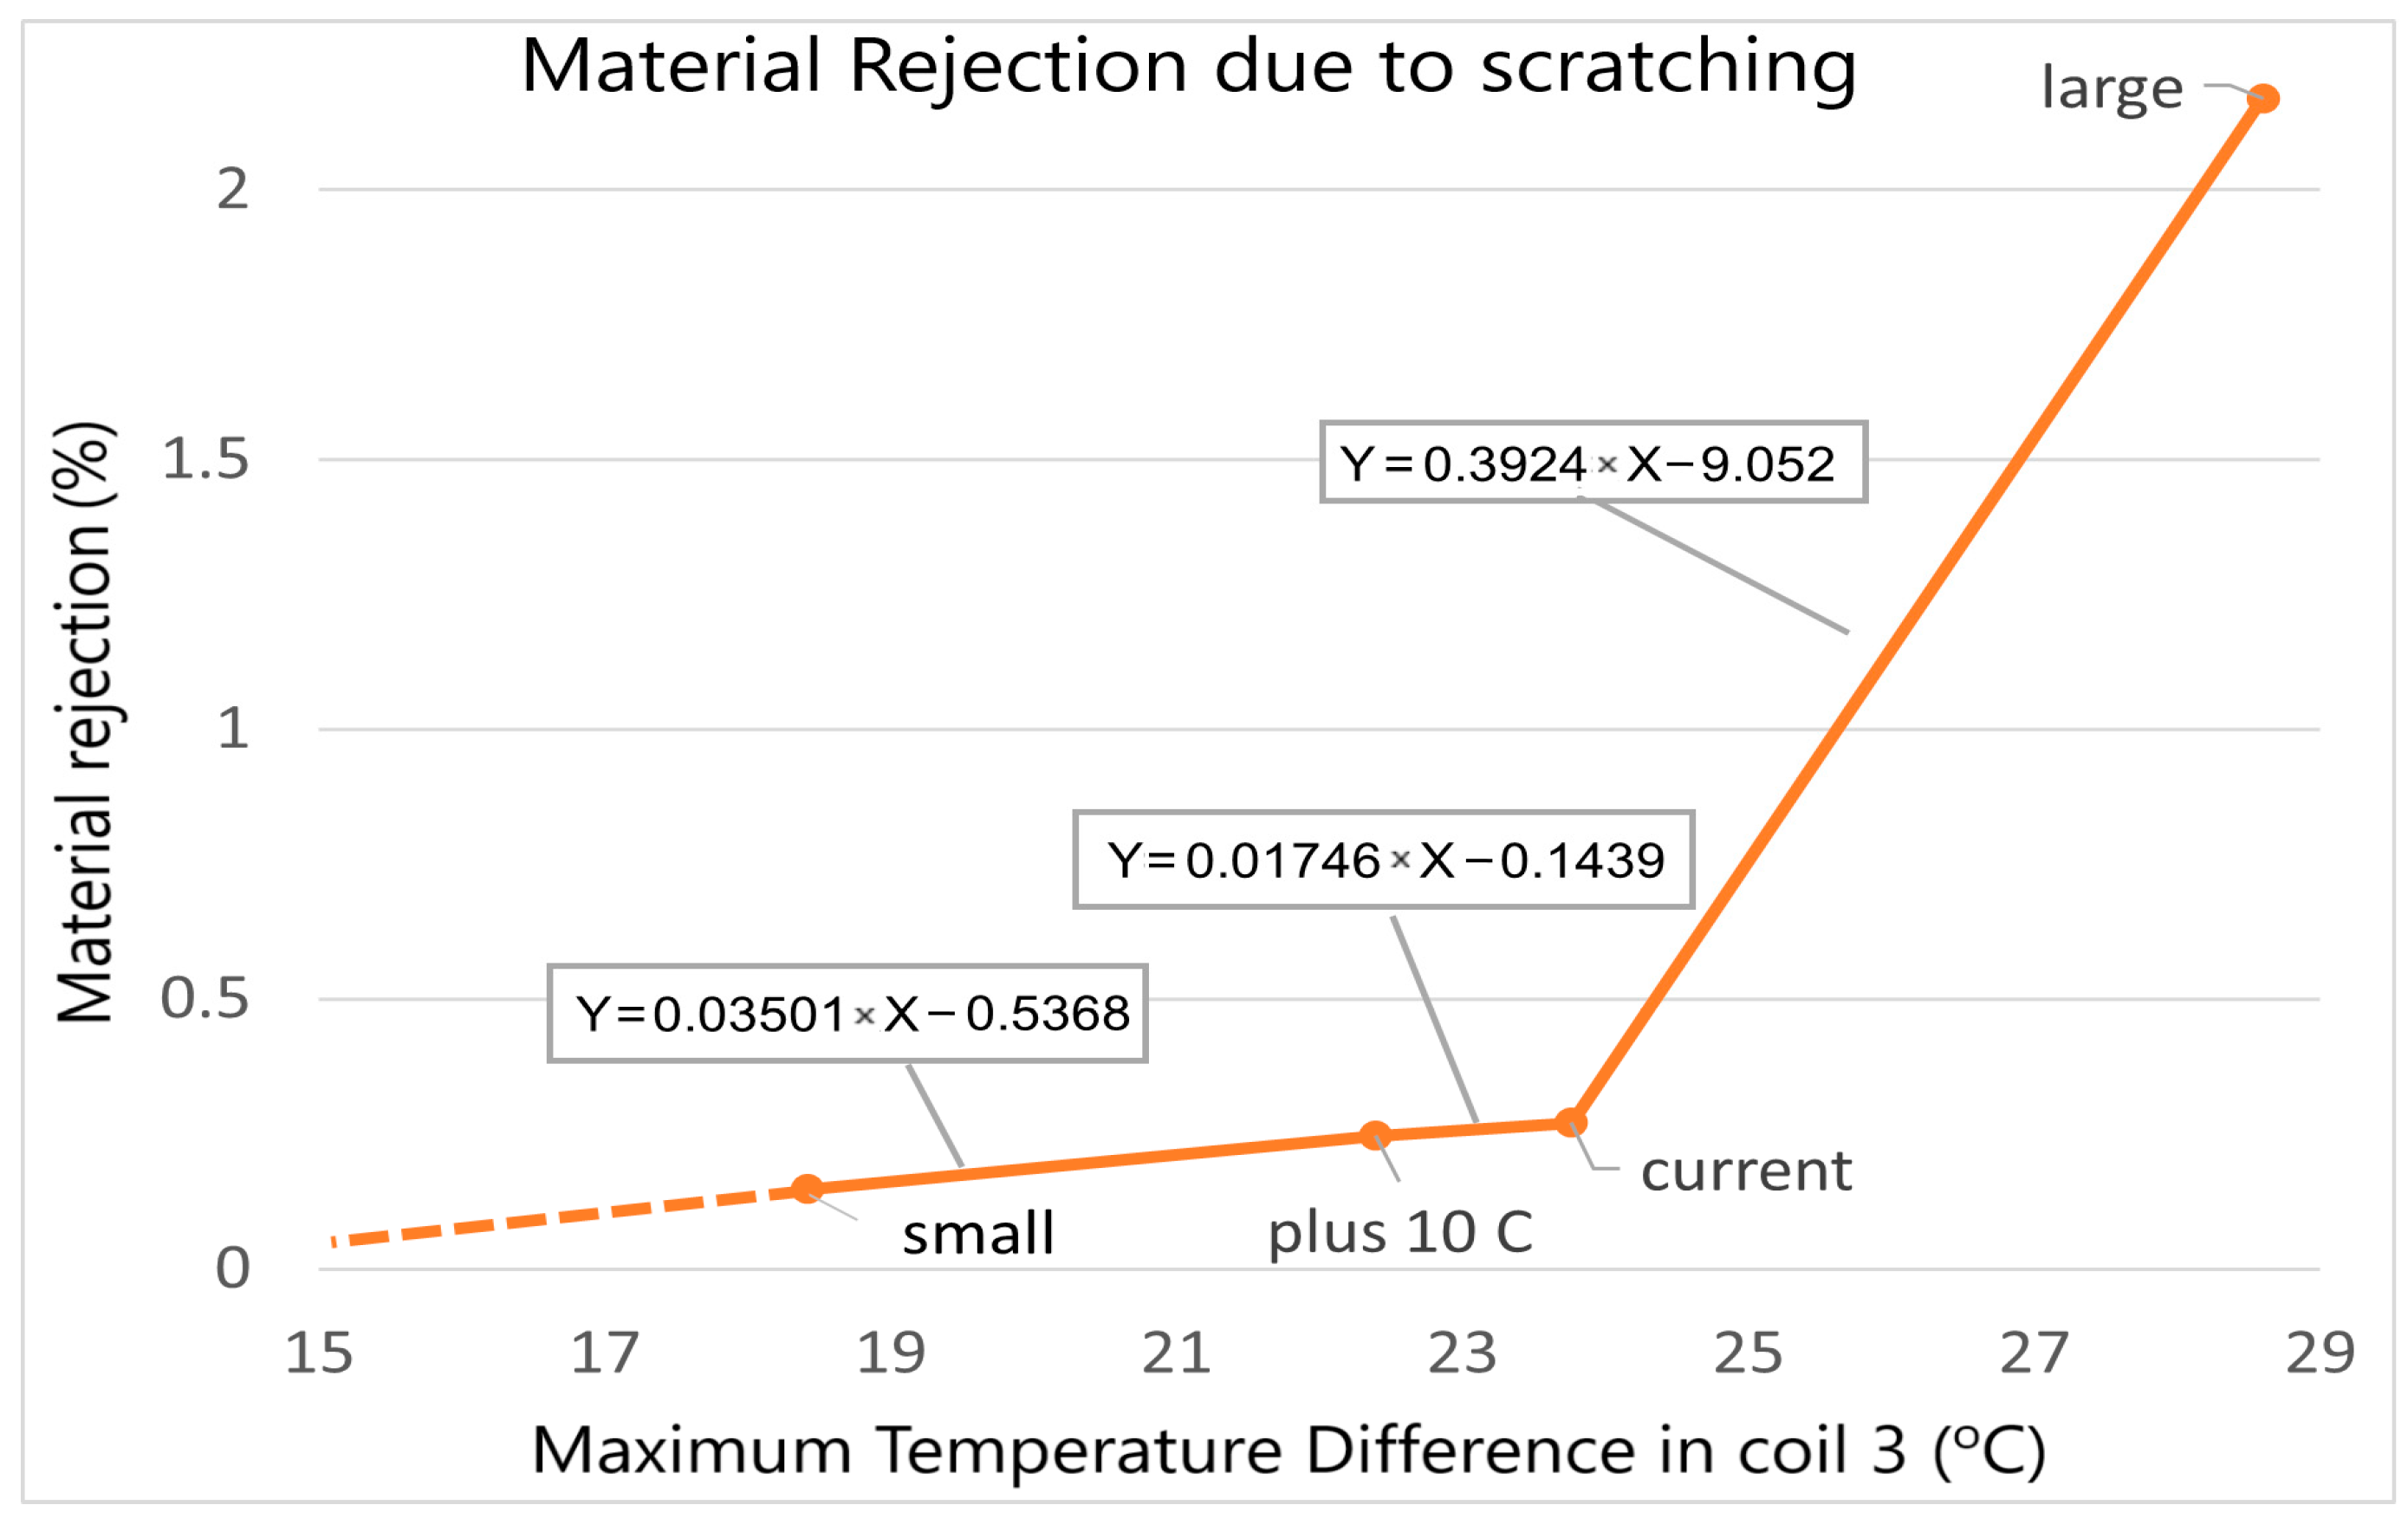
The rejection percentage of the current furnace, the 10 °C increased soaking temperature case, and the small and large coil batch cases were taken from industrial trial data, whereas the rejection for the remaining cases was calculated theoretically, due to a lack of industry figures (Figure 6). The calculation of the remaining rejection percentages was based on the literature, where coil temperature uniformity during annealing was strongly linked to better product quality and uniform properties [12,13,14,15]; therefore, a relationship was assumed between the maximum temperature differences inside the coils and material rejection percentages, by linking linearly the data points from the existing rejection data mentioned above and their maximum temperature differences from the CFD analysis as shown below. The rejection percentages for the rest of the enhanced cases were determined by interpolation in their corresponding maximum temperature difference range.
The total net cost per 1 heating cycle and batch was finally calculated as the sum of the above costs. Any negative individual cost values would mean savings instead of costs and were subtracted from the rest of the positive values to give the net cost.
The increased coiling tension cases also represented the need for capital investment to accommodate for the proposed changes, but with no extra investment costs needed in the batch annealing furnaces and the whole cost associated with changing the coiling equipment in the cleaning line before annealing to accommodate that increase in tension. According to the industry, the 100% and 200% tension increase cases would require a complete change of coiling equipment in the cleaning line, with a broadly estimated figure of GBP 1.5 million needed for purchasing, delivering, installing, and calibrating the new system, based on past work done in the cleaning line [8]. Finally, further analysis of these cases was performed using the simple payback method to determine the number of years needed to start making a profit after the investment. Based on an annual production of coated steels at 400,000 tonnes [46] and an average 60 tonne steel load per batch in the batch annealing furnace [8], the number of annealing batches per year, the incurred annealing cycle savings per year (£), and the break-even point of the investment (years) were calculated as follows [47]:
b a t c h e s   p e r   y e a r = a n n u a l   p r o d u c t i o n / L a v e r a g e
S a v i n g s   p e r   y e a r = C n e t ,   c u r r e n t C n e t ,   e n h a n c e d × b a t c h e s   p e r   y e a r
B r e a k   e v e n   p o i n t   y e a r s = I n v e s t m e n t   / S a v i n g s   p e r   y e a r
It is worth noting that, for these calculations, it was assumed that the annual production, the steel price, and the operational costs remained constant (e.g., electricity, gas, gases unit costs, etc.).

3. Results

The results of the transient CFD modelling of the current furnace case and the four improvement proposals are demonstrated in this section. The results are then compared on the basis of the coil temperatures and temperature uniformity reached at the end of soaking inside coil 3, in order to determine promising options for batch annealed steel product quality enhancement. A techno-economic evaluation analysed the cost-effectiveness of the proposals based on the incurred associated costs and the improvement in the scratching defect of the batch annealed steel.

3.1. Computational Fluid Dynamics (CFD) Analysis

3.1.1. Transient CFD Analysis of Current Furnace and Model Validation

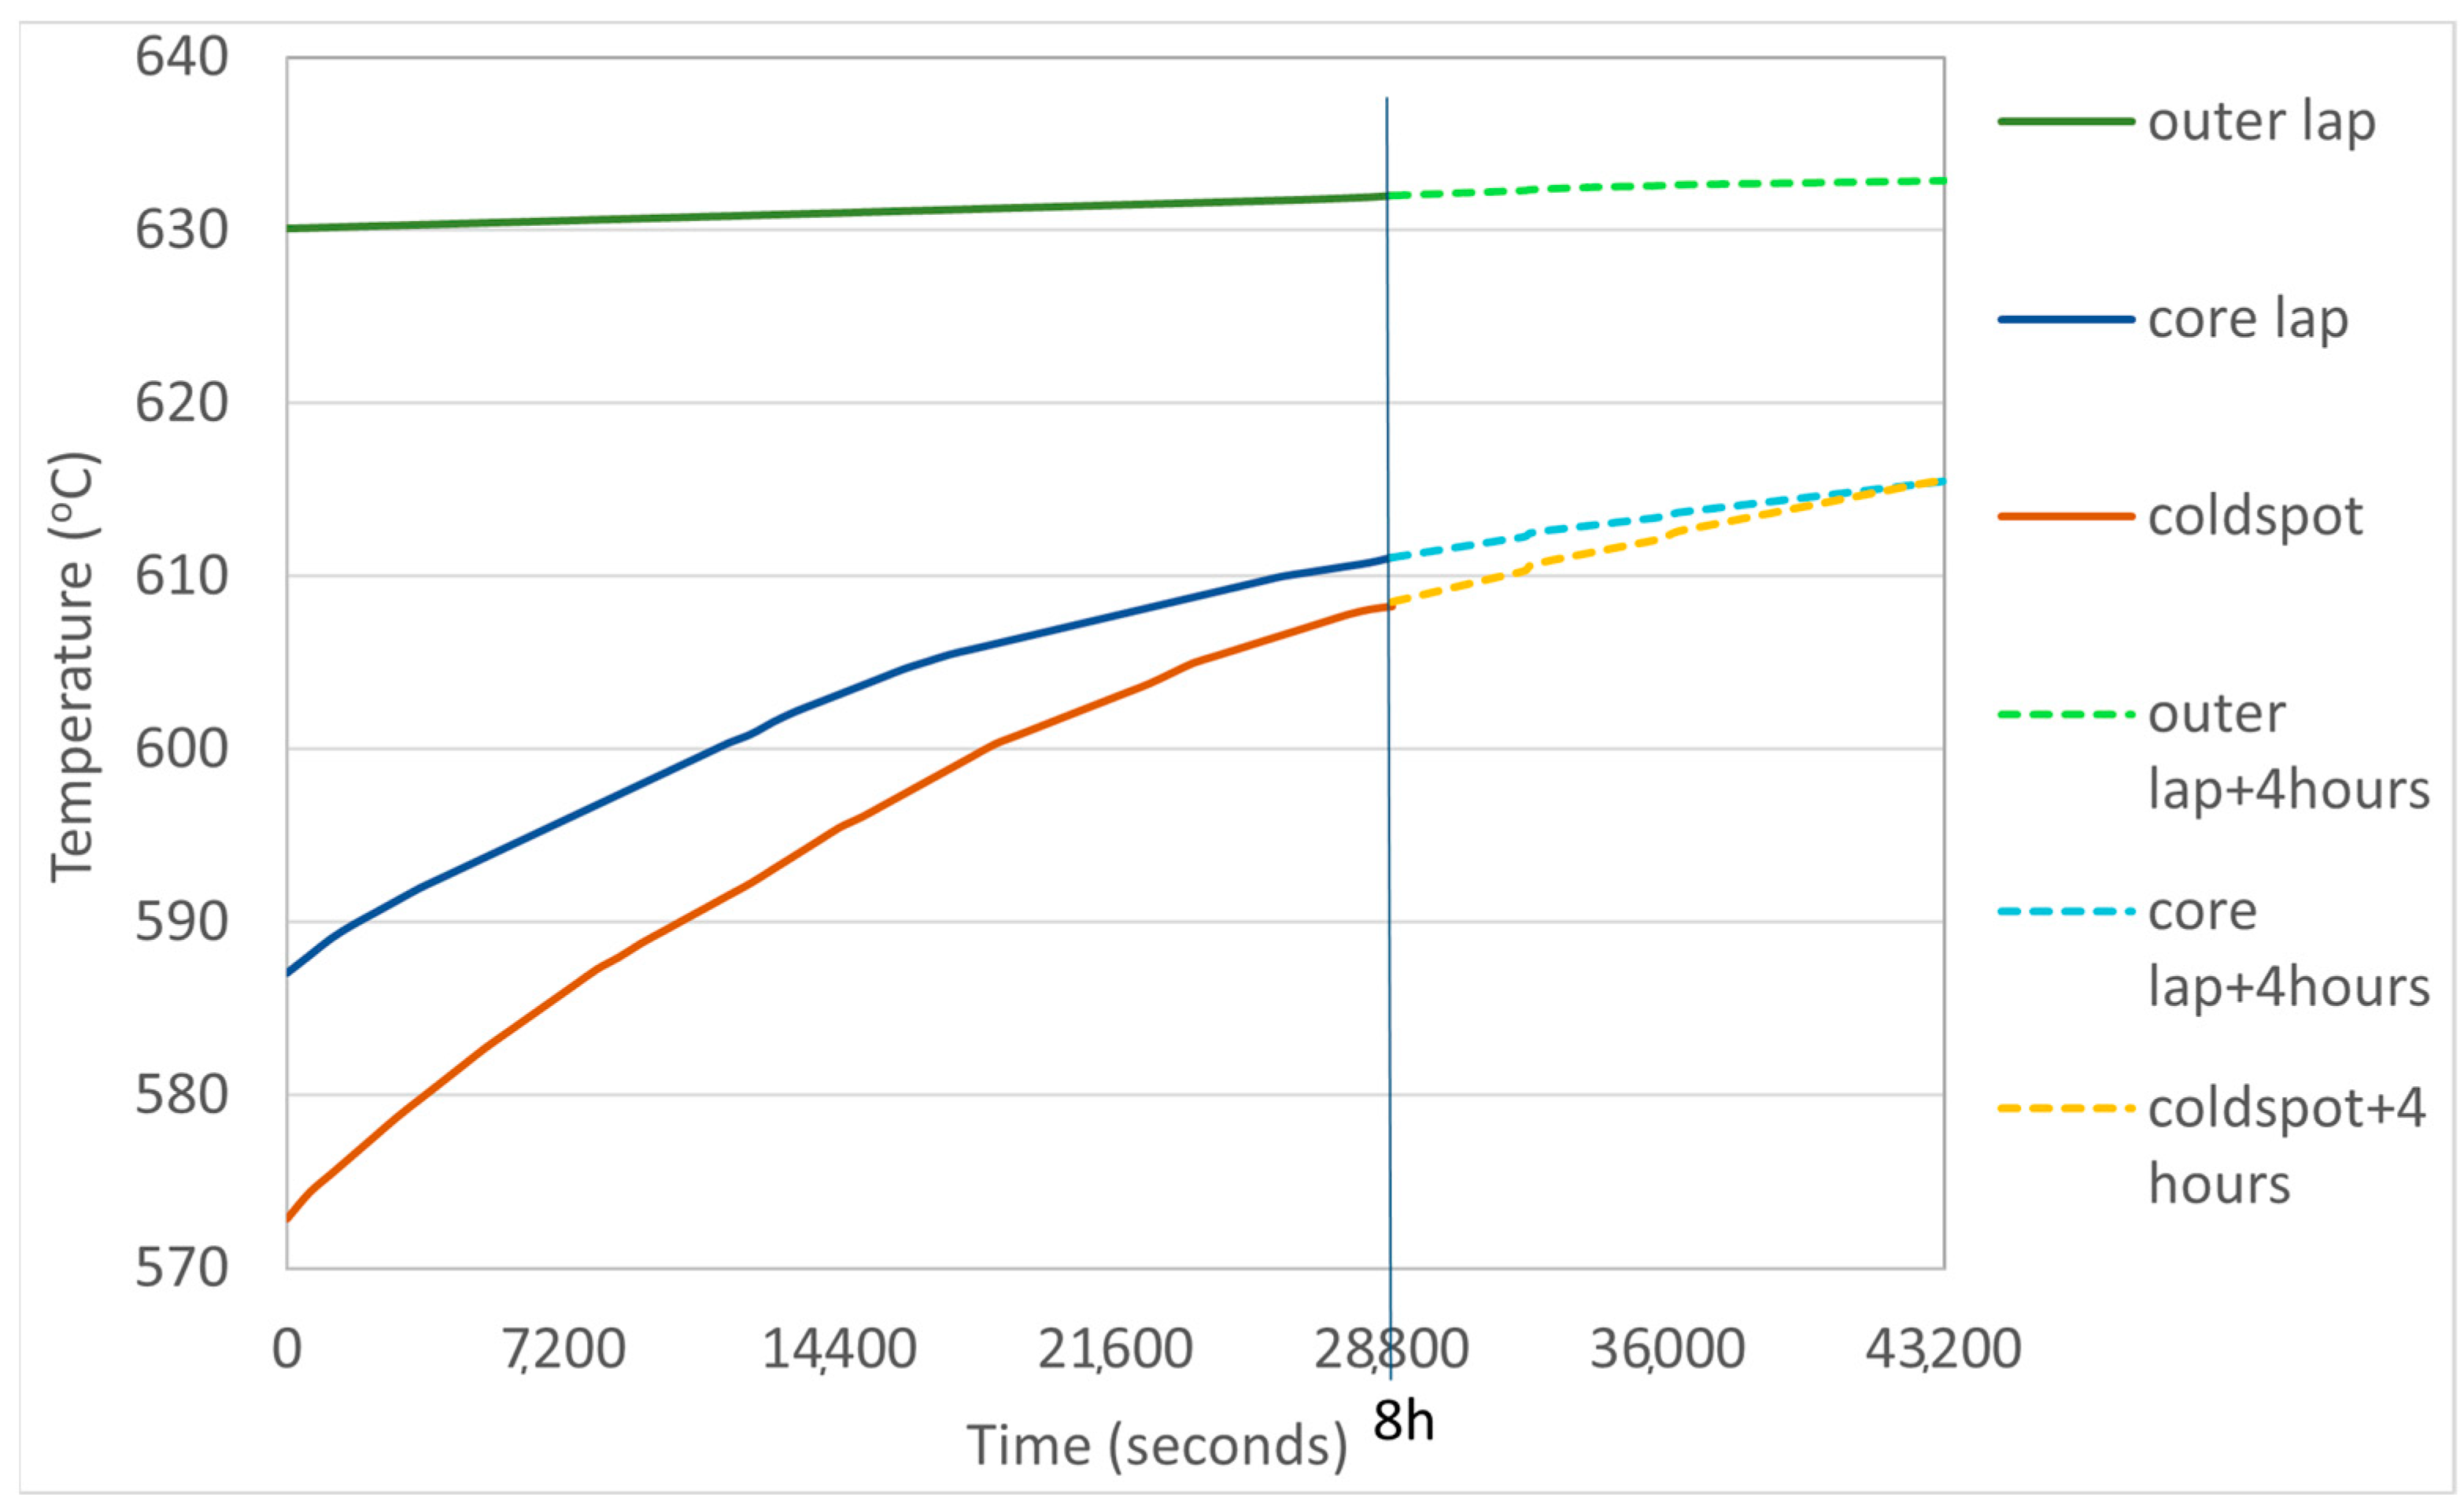
The results of the transient CFD analysis of the current batch annealing furnace are presented below. Both the fluid and solid models of the current annealing furnace converged adequately at every time step, according to the specified convergence criteria, which were the monotonous decrease in residuals (10−6 for energy, 10−4 for rest) and achievement of constant monitor values at every time step (total mass and heat transfer rates and outlet temperature for the fluid model, and heat transfer rate for the solid model). The results of the fluid model were used as transient boundary conditions for the solid-only model and are presented in the Supplementary Material Table S8 in the form of the surface-average boundary heat fluxes (W/m2) for each coil and convector plate surface. The results of the solid-only model are presented below as a comparison between CFD and thermocouple data temperature profiles for the outer lap, core lap, and cold spot area of coil 3 during the soaking segment, with Figure 6 examining the whole segment and Figure 7 and Table 1 focusing on the final soaking results.
Figure 6 suggests that the CFD coil temperature profiles do not exactly match the thermocouple data; however, they do follow the data quite closely, with a maximum difference of 0.84 °C between the profiles for the outer lap and 0.8 °C between the profiles for the core lap and cold spot areas. This means that the error of the current furnace CFD solid model (and fluid model by association due to the boundary conditions) had a maximum of 0.133%, which is considered acceptable for this case.
From Figure 8 and Table 1, it can be seen that the temperatures at the three coil areas do not perfectly match the thermocouple data for coil 3 at the end of soaking; however, a small deviation was anticipated and the solution presents a realistic approach to furnace data, as the deviation was a maximum of 0.09 °C for the outer lap, 0.38 °C for the core lap, and 0.04 °C for the cold spot area. This means that the error for the end of soaking results was a maximum 0.063%, and thus, from all the above, the CFD solution and furnace models are considered acceptably valid, and the thermocouple measurement error is not deemed critical, especially since the current furnace CFD model acts as a baseline case with which the enhancement cases are compared.

3.1.2. Grid and Time-Step Independence Study

A grid independence study was performed to demonstrate the CFD solution’s independence of mesh size changes. The total time of the transient simulations was 28,800 s, three mesh sizes were investigated for the fluid and solid models at a time step size of 0.001 s and 18 s, respectively, and three output variables were used to monitor each model’s solution convergence. Table 2 and Table 3 below present the grid independence study results for the fluid and solid models, respectively. The medium and fine meshes achieved almost the same result for all three variables for both models, indicating the strong convergence of the CFD solution [37]. The combination of accuracy and computational expense results suggests that the medium mesh of 8.74 million elements for the fluid model and 3.46 million elements for the solid model should be used as the optimal compromises, especially due to the time constraints of this research.
A time-step independence study was performed next to ensure that the CFD solution remained unchanged with smaller time step values, with a total time of 28,800 s for all models. Three time step sizes were investigated for the fluid and solid models, for the respective chosen medium mesh size, and the same output variables were used to prove solution independence as used previously. Table 4 and Table 5 below present the time-step independence study results for the fluid and solid models, respectively. The two smaller time step sizes achieved almost the same result for all three variables for both models, indicating the strong convergence of the CFD solution [37]. The combination of the accuracy and computational expense (number of steps) results suggests that the medium time step size of 0.0006 s for the fluid model and 12 s for the solid model should be used as the optimal compromises.

3.1.3. Furnace Improvement Scenario 1: Increased Soaking Temperature

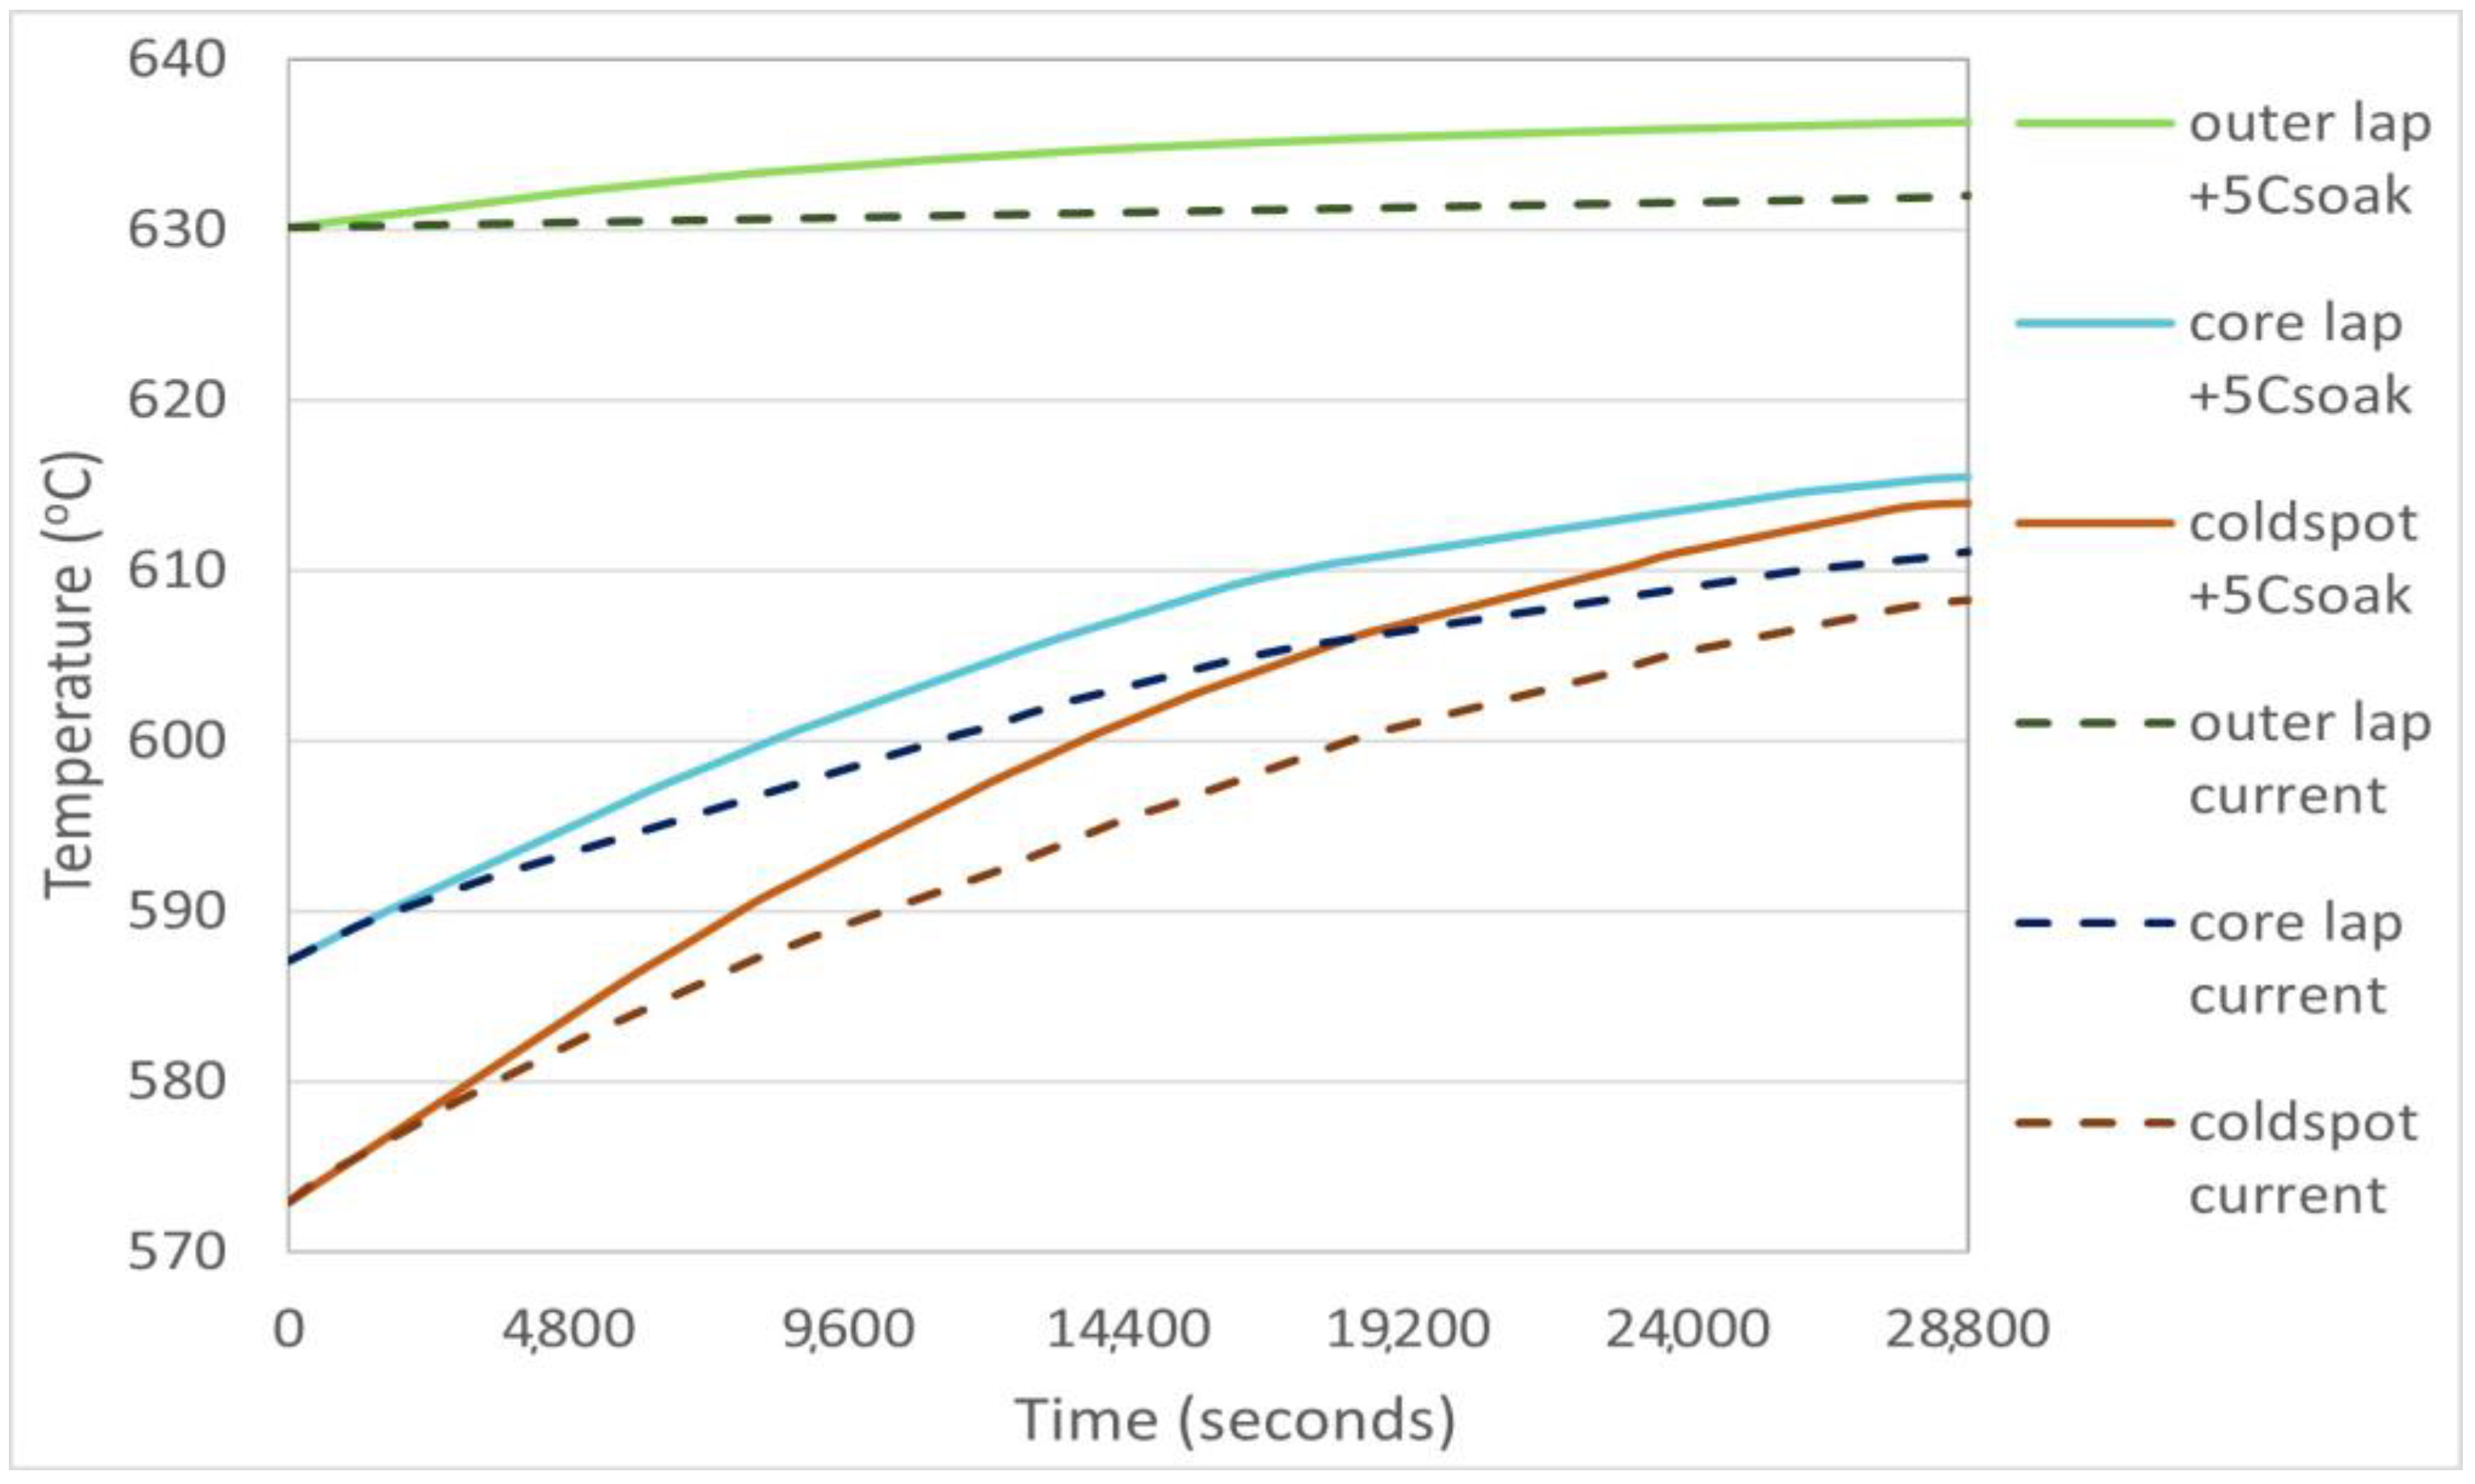
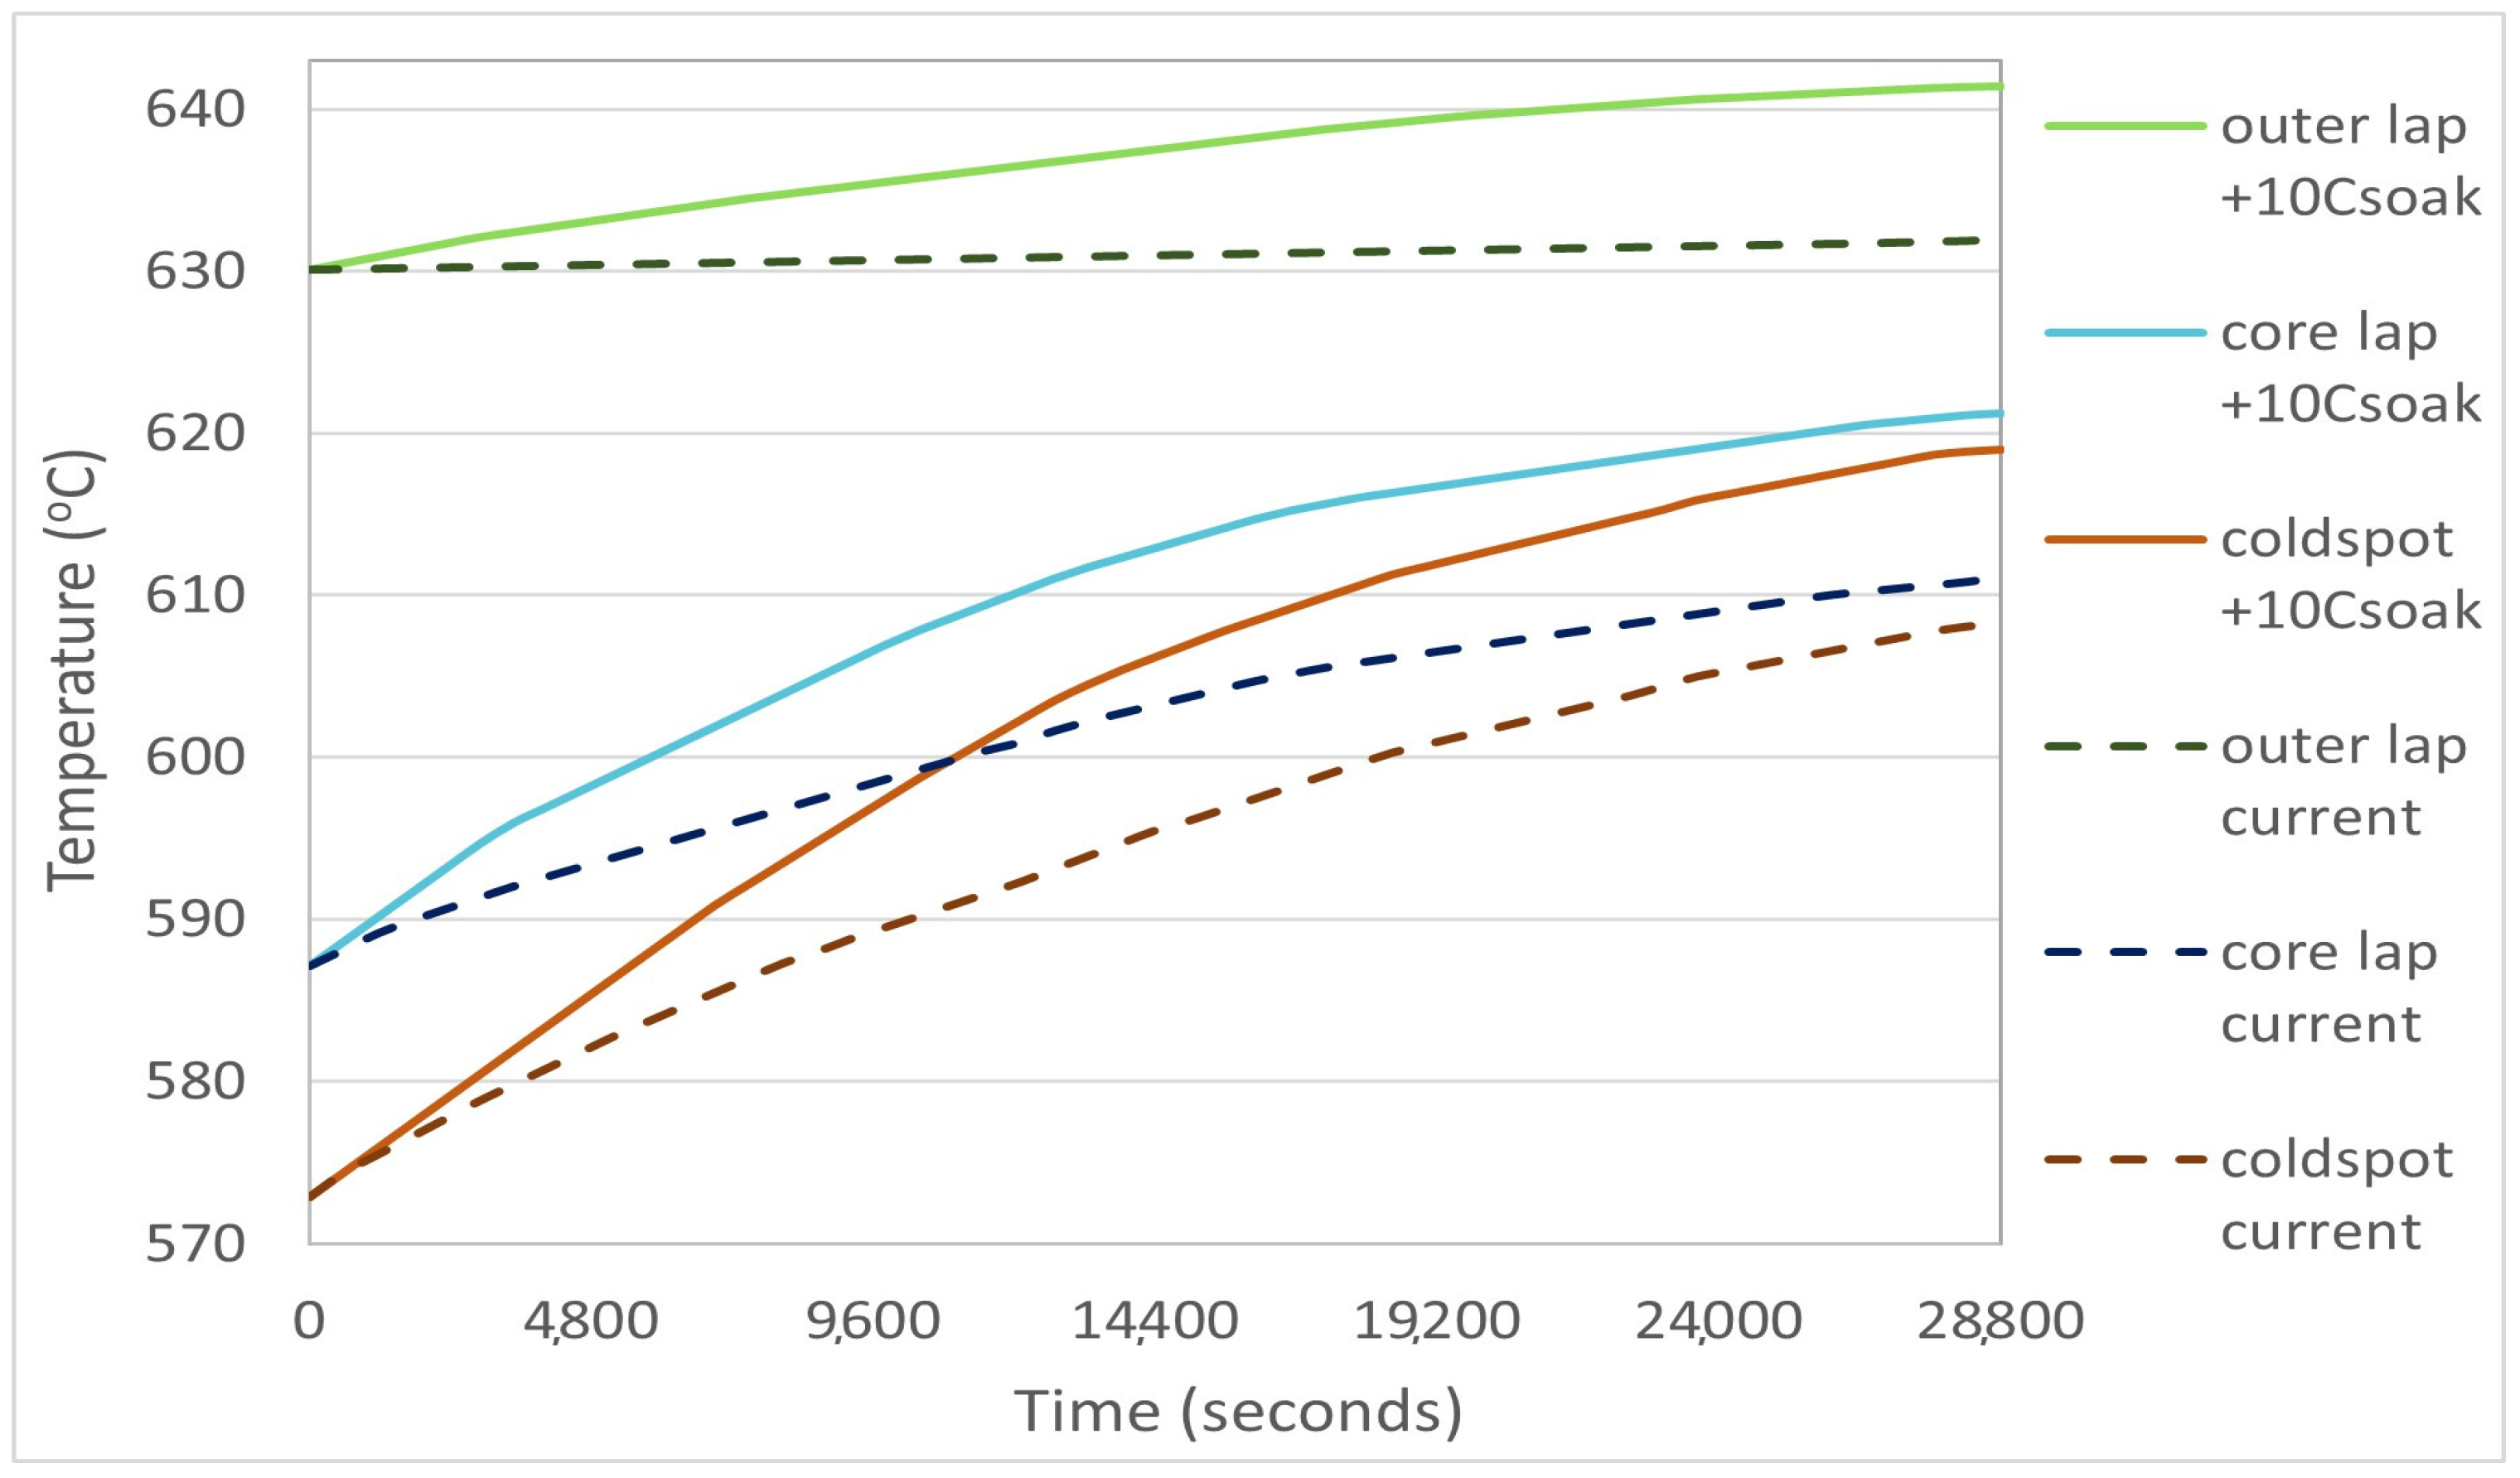
From previous work in steady state analysis [18], it was found that 5 °C and 10 °C higher soaking temperatures could lead to higher inner temperatures for coil 2, potentially improving the steel recrystallisation and interlap welding during annealing [16]. It was thought necessary to also examine these in a more accurate transient analysis, in order to obtain a better picture of the coil 3 temperature profile throughout the soaking segment. The results of the fluid-only model, used as transient boundary conditions for the solid-only model, are presented in the Supplementary Material Tables S9 and S10, in the form of boundary heat fluxes (W/m2) for each case. The transient analysis temperature profile results of the solid-only model for the two increased soaking temperature cases are shown in Figure 9 and Figure 10 for the outer lap, core lap, and cold spot area of the coil in furnace position 3.
The results seem to confirm the almost linear nature between the increase in soaking temperature and the increase in the coil 3 temperatures at the end of soaking, possibly ensuring successful steel recrystallisation throughout the coil due to the potential acceleration of temperature-driven surface reactions taking place during annealing, and thus achieving an enhanced product quality [12,16].

3.1.4. Furnace Improvement Scenario 2: Increased Coiling Tension

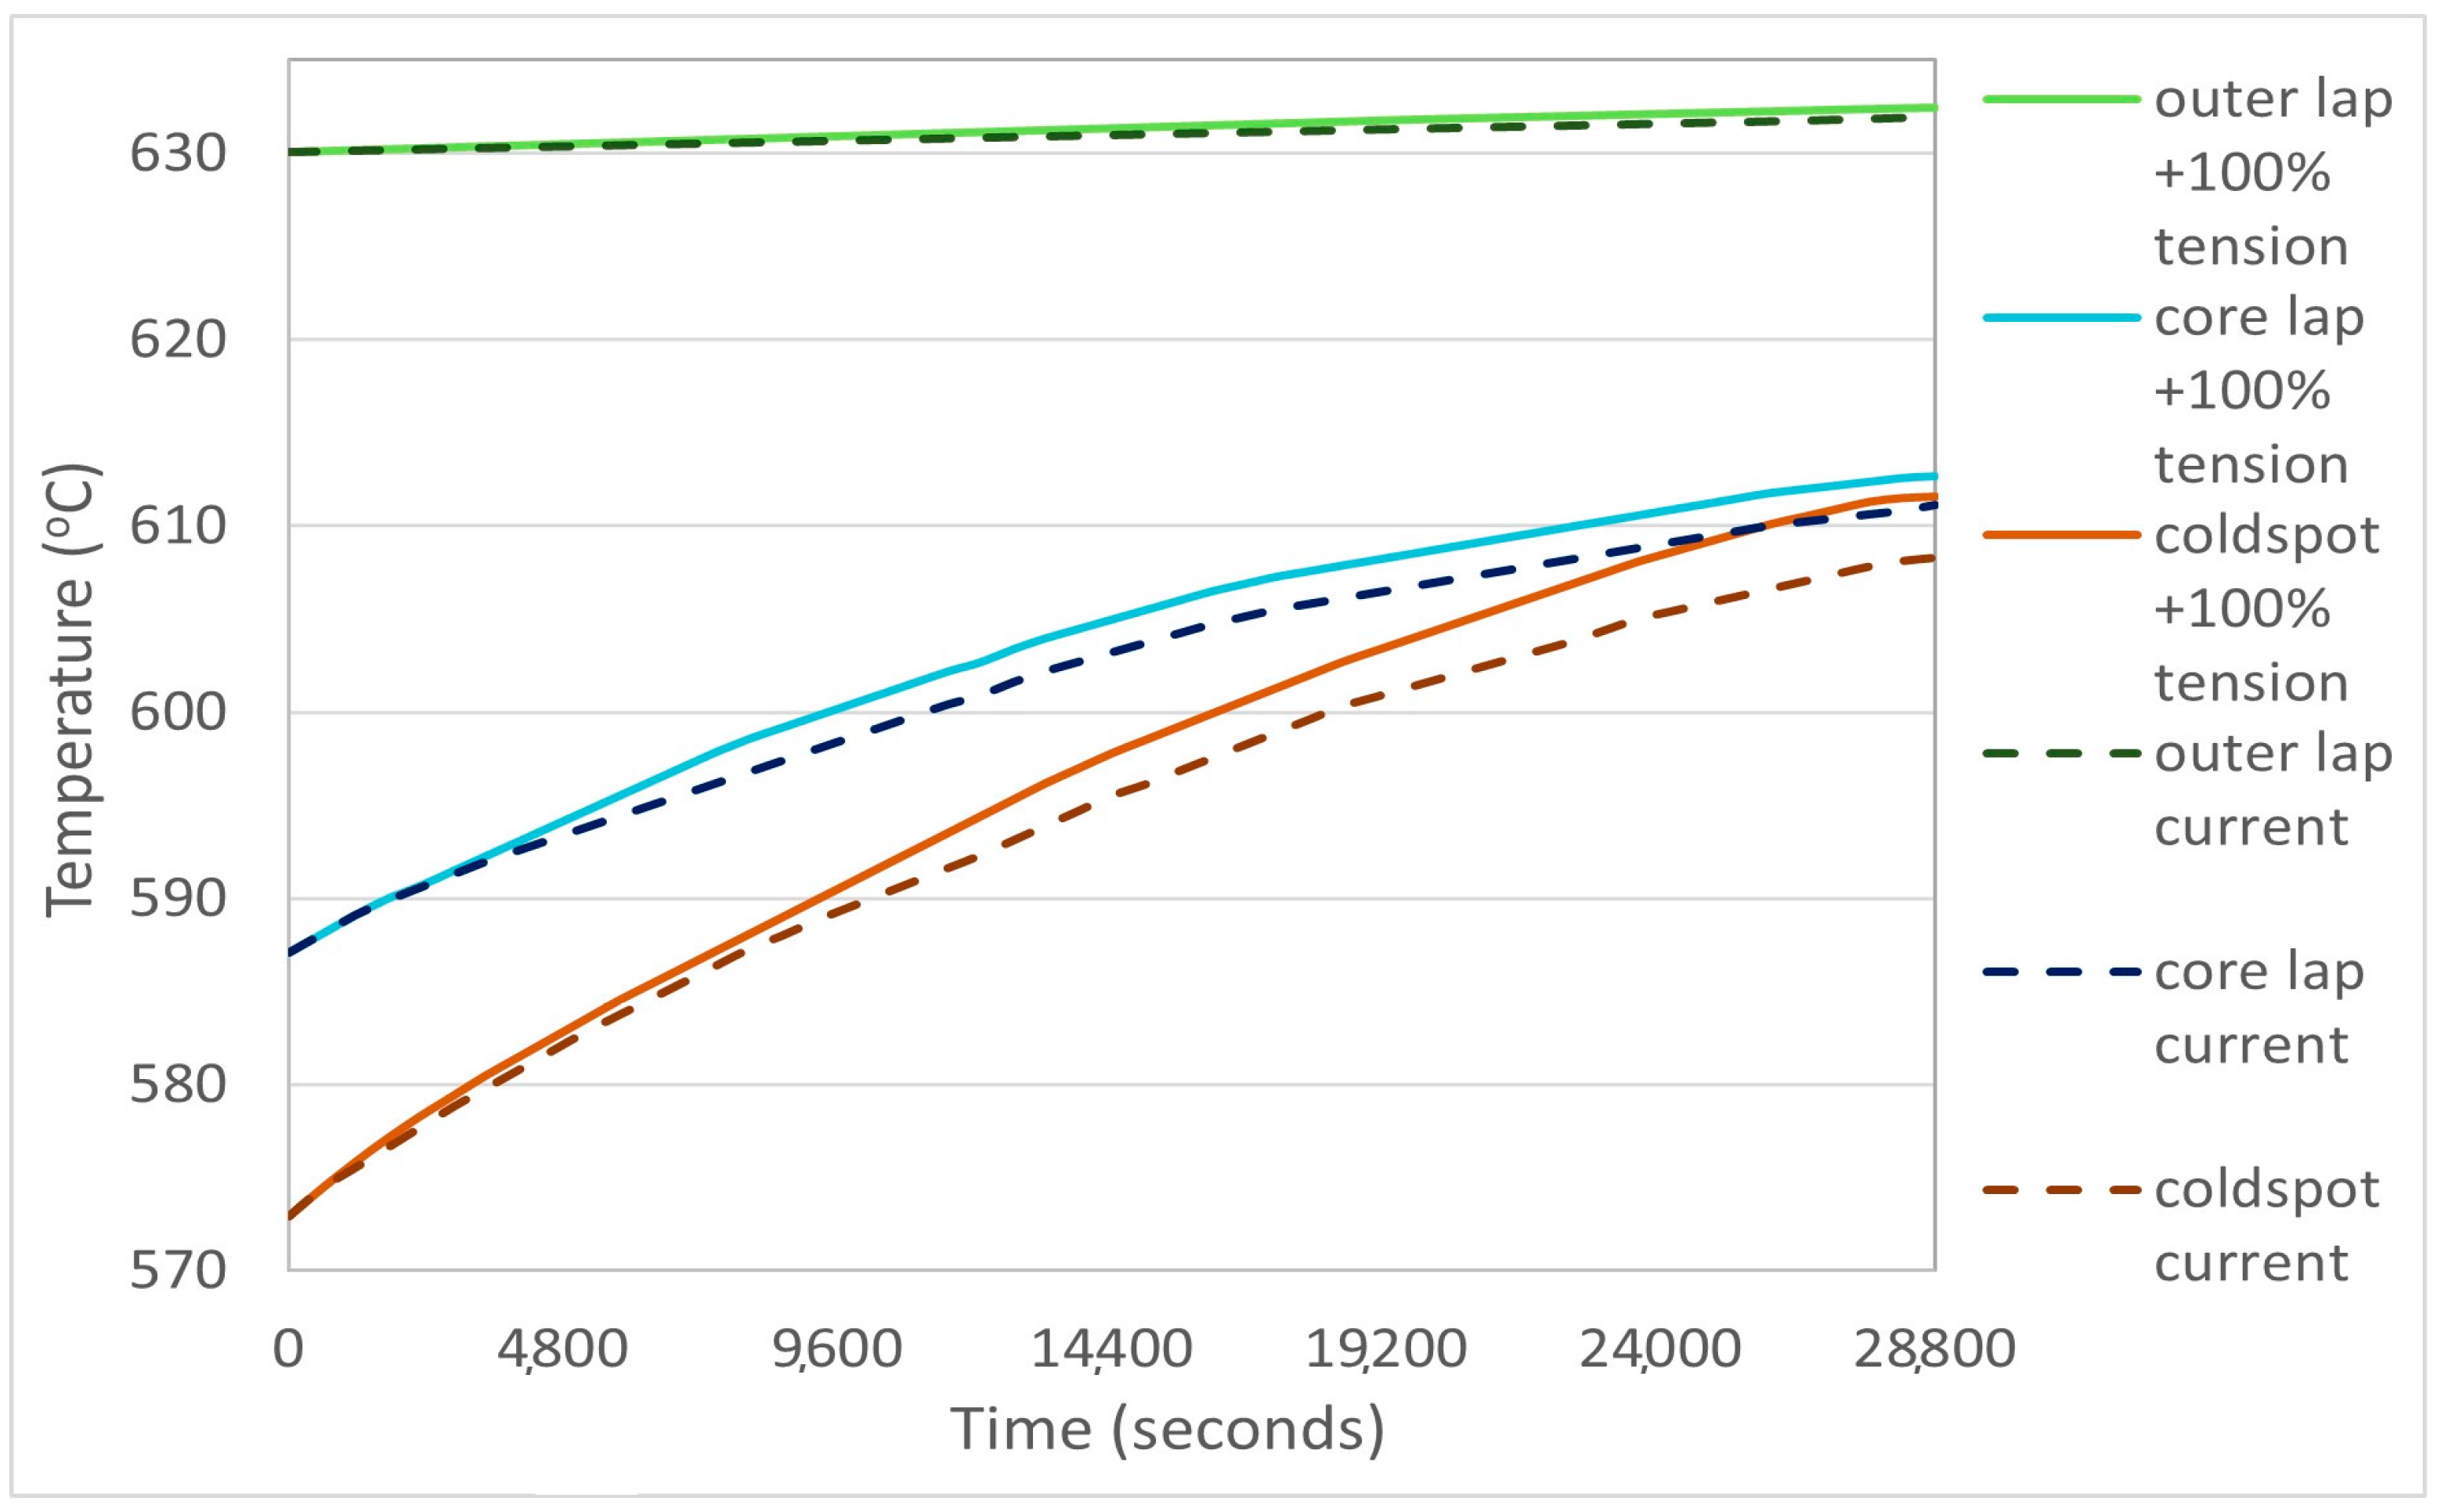
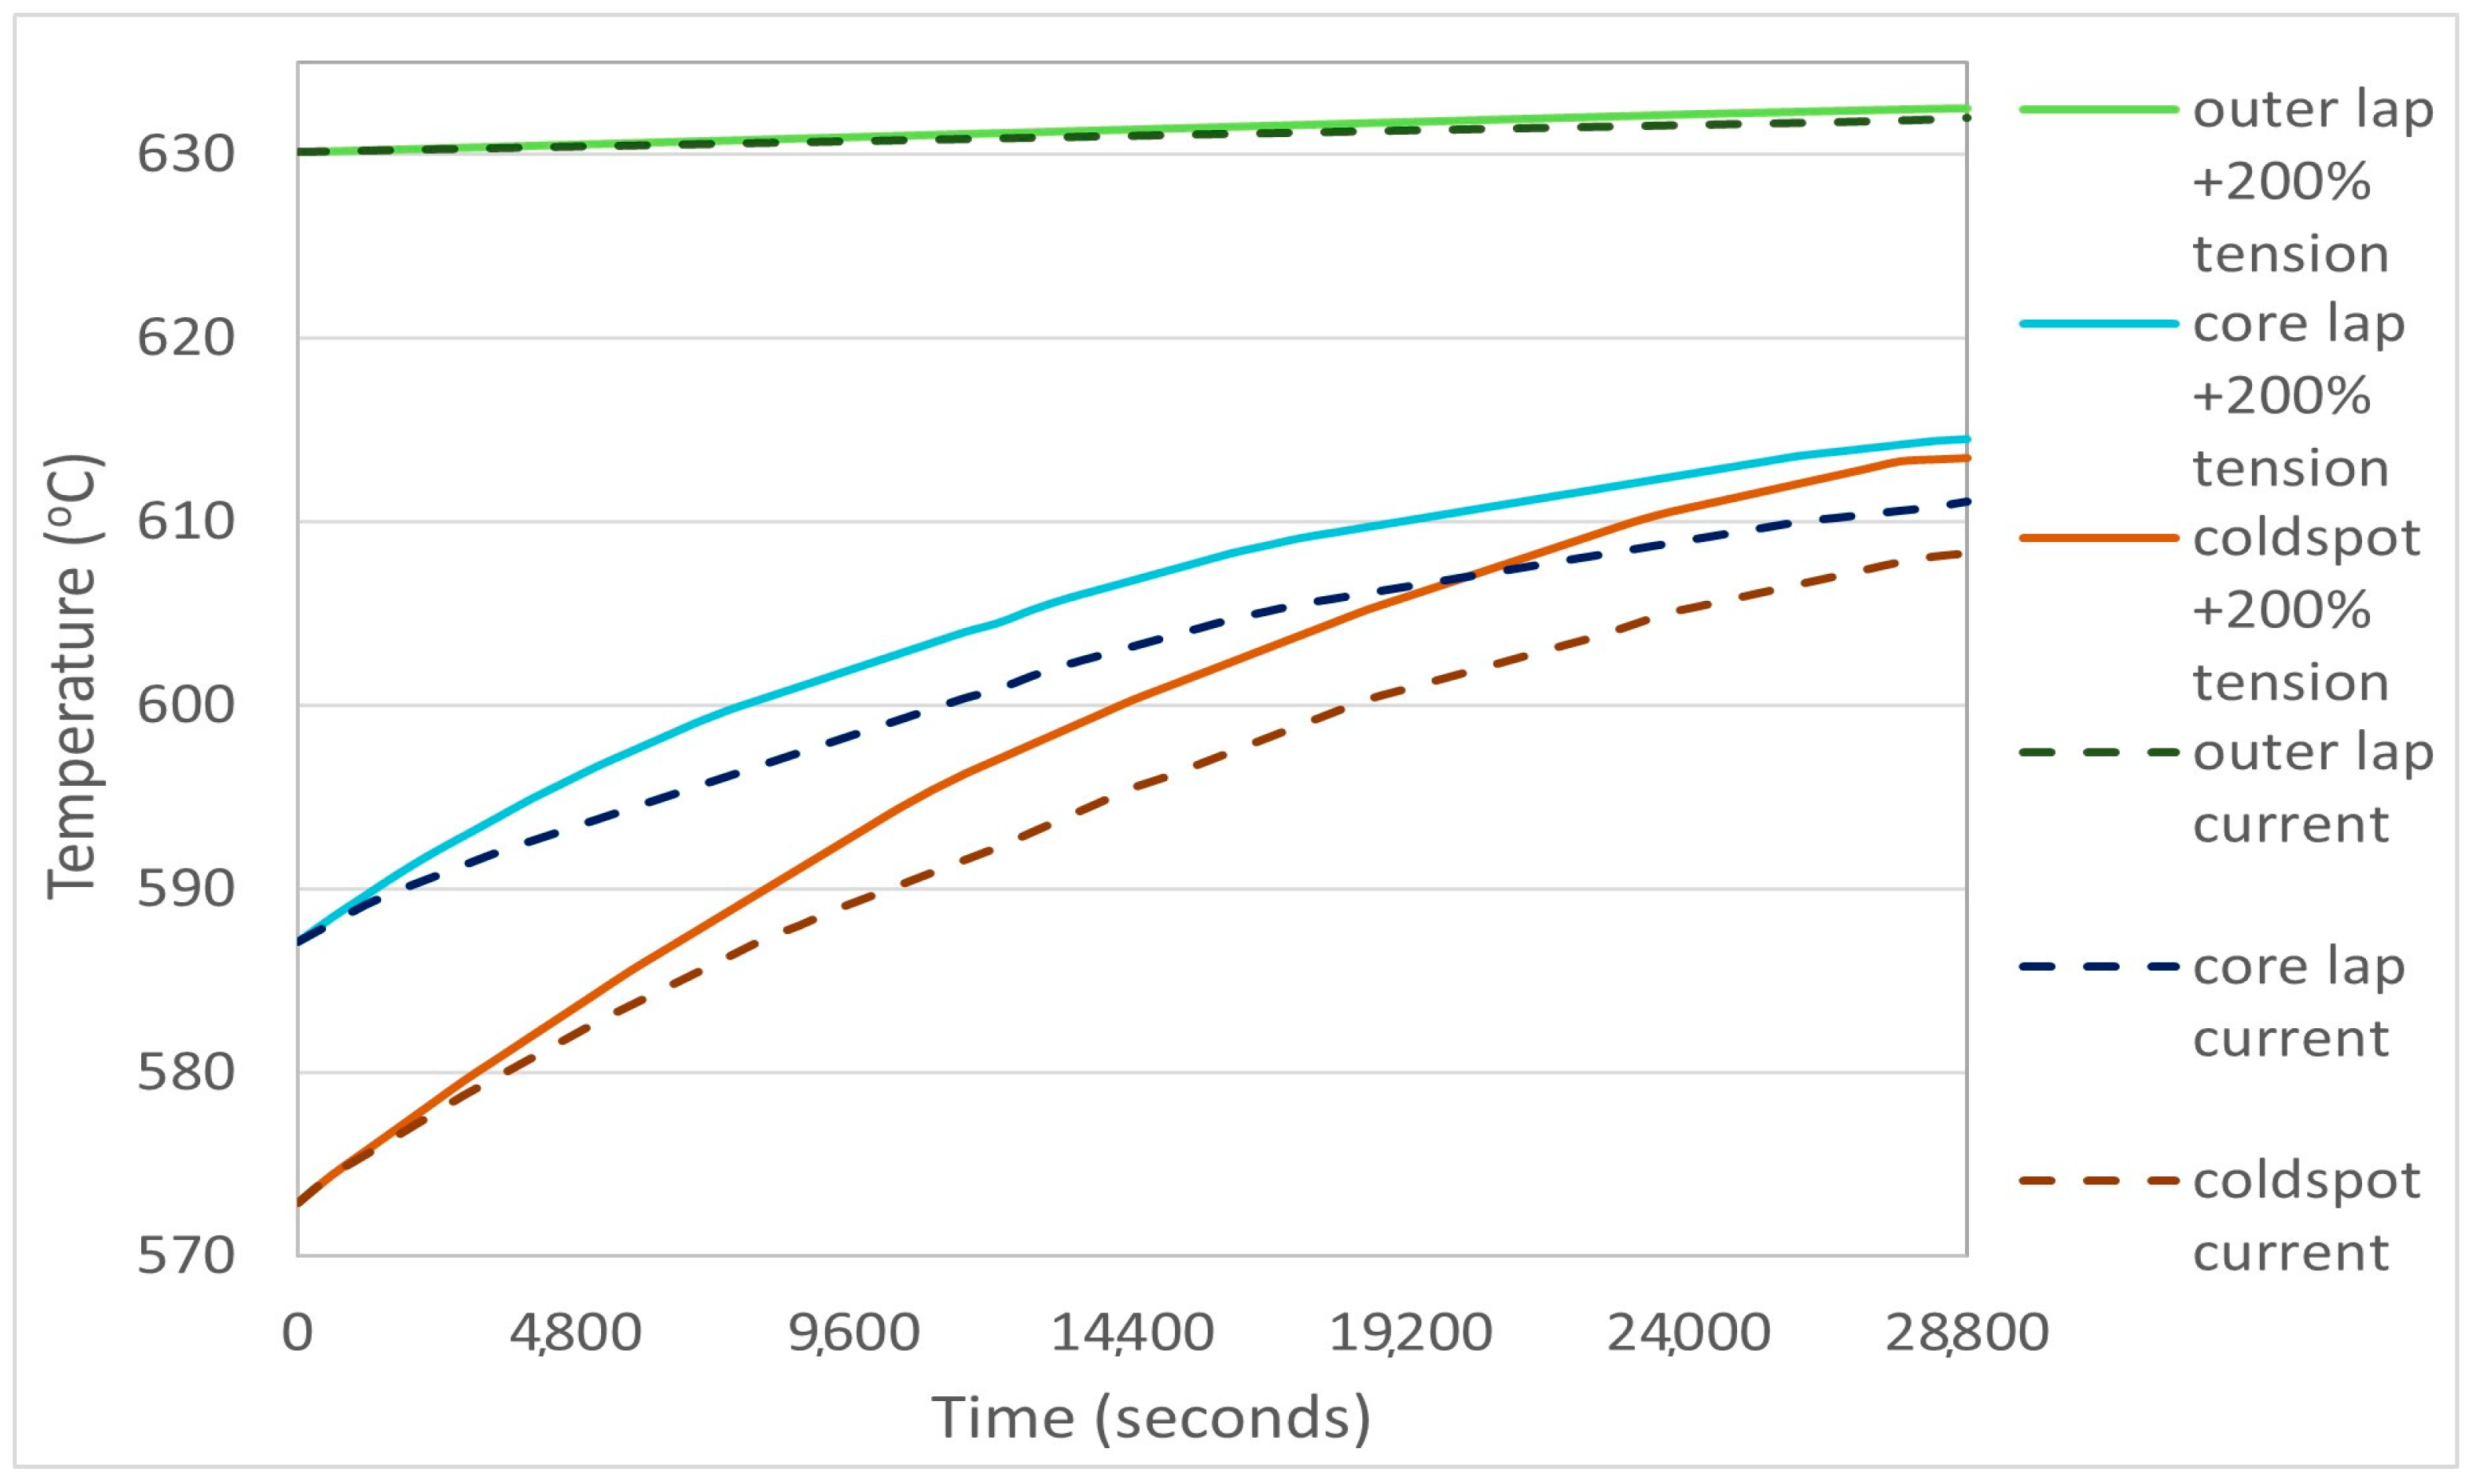
Aditionally from previous steady-state CFD work [18], higher coiling tensions at the cleaning line prior to annealing were deemed promising for the enhancement of the radial conduction of heat through the coil and the achievement of higher inner coil temperatures. The two tensions previously examined in steady-state and now investigated in transient CFD analysis were 100% (100 MPa) and 200% (200 MPa) higher coiling tensions. The fluid model boundary heat fluxes for both cases were the same as in the current furnace case, since nothing changed in the fluid model (Supplementary Material Table S8). The air gap thickness and interlap contact percentage for each case are presented in the Supplementary Material Table S6. The solid model CFD results presented in Figure 11 and Figure 12 exhibit a relatively unaltered temperature profile for the outer lap compared with the current case for both tensions. The 100% and 200% increase cases showed 2–5 °C higher temperatures for the inner coil areas at the end of soaking. This agrees with the supposed impact of higher coiling tensions on the improvement of the batch annealing process, as proposed by literature [12], with the higher inner coil temperatures potentially ensuring better product quality.

3.1.5. Furnace Improvement Scenario 3: Altered Coil Size

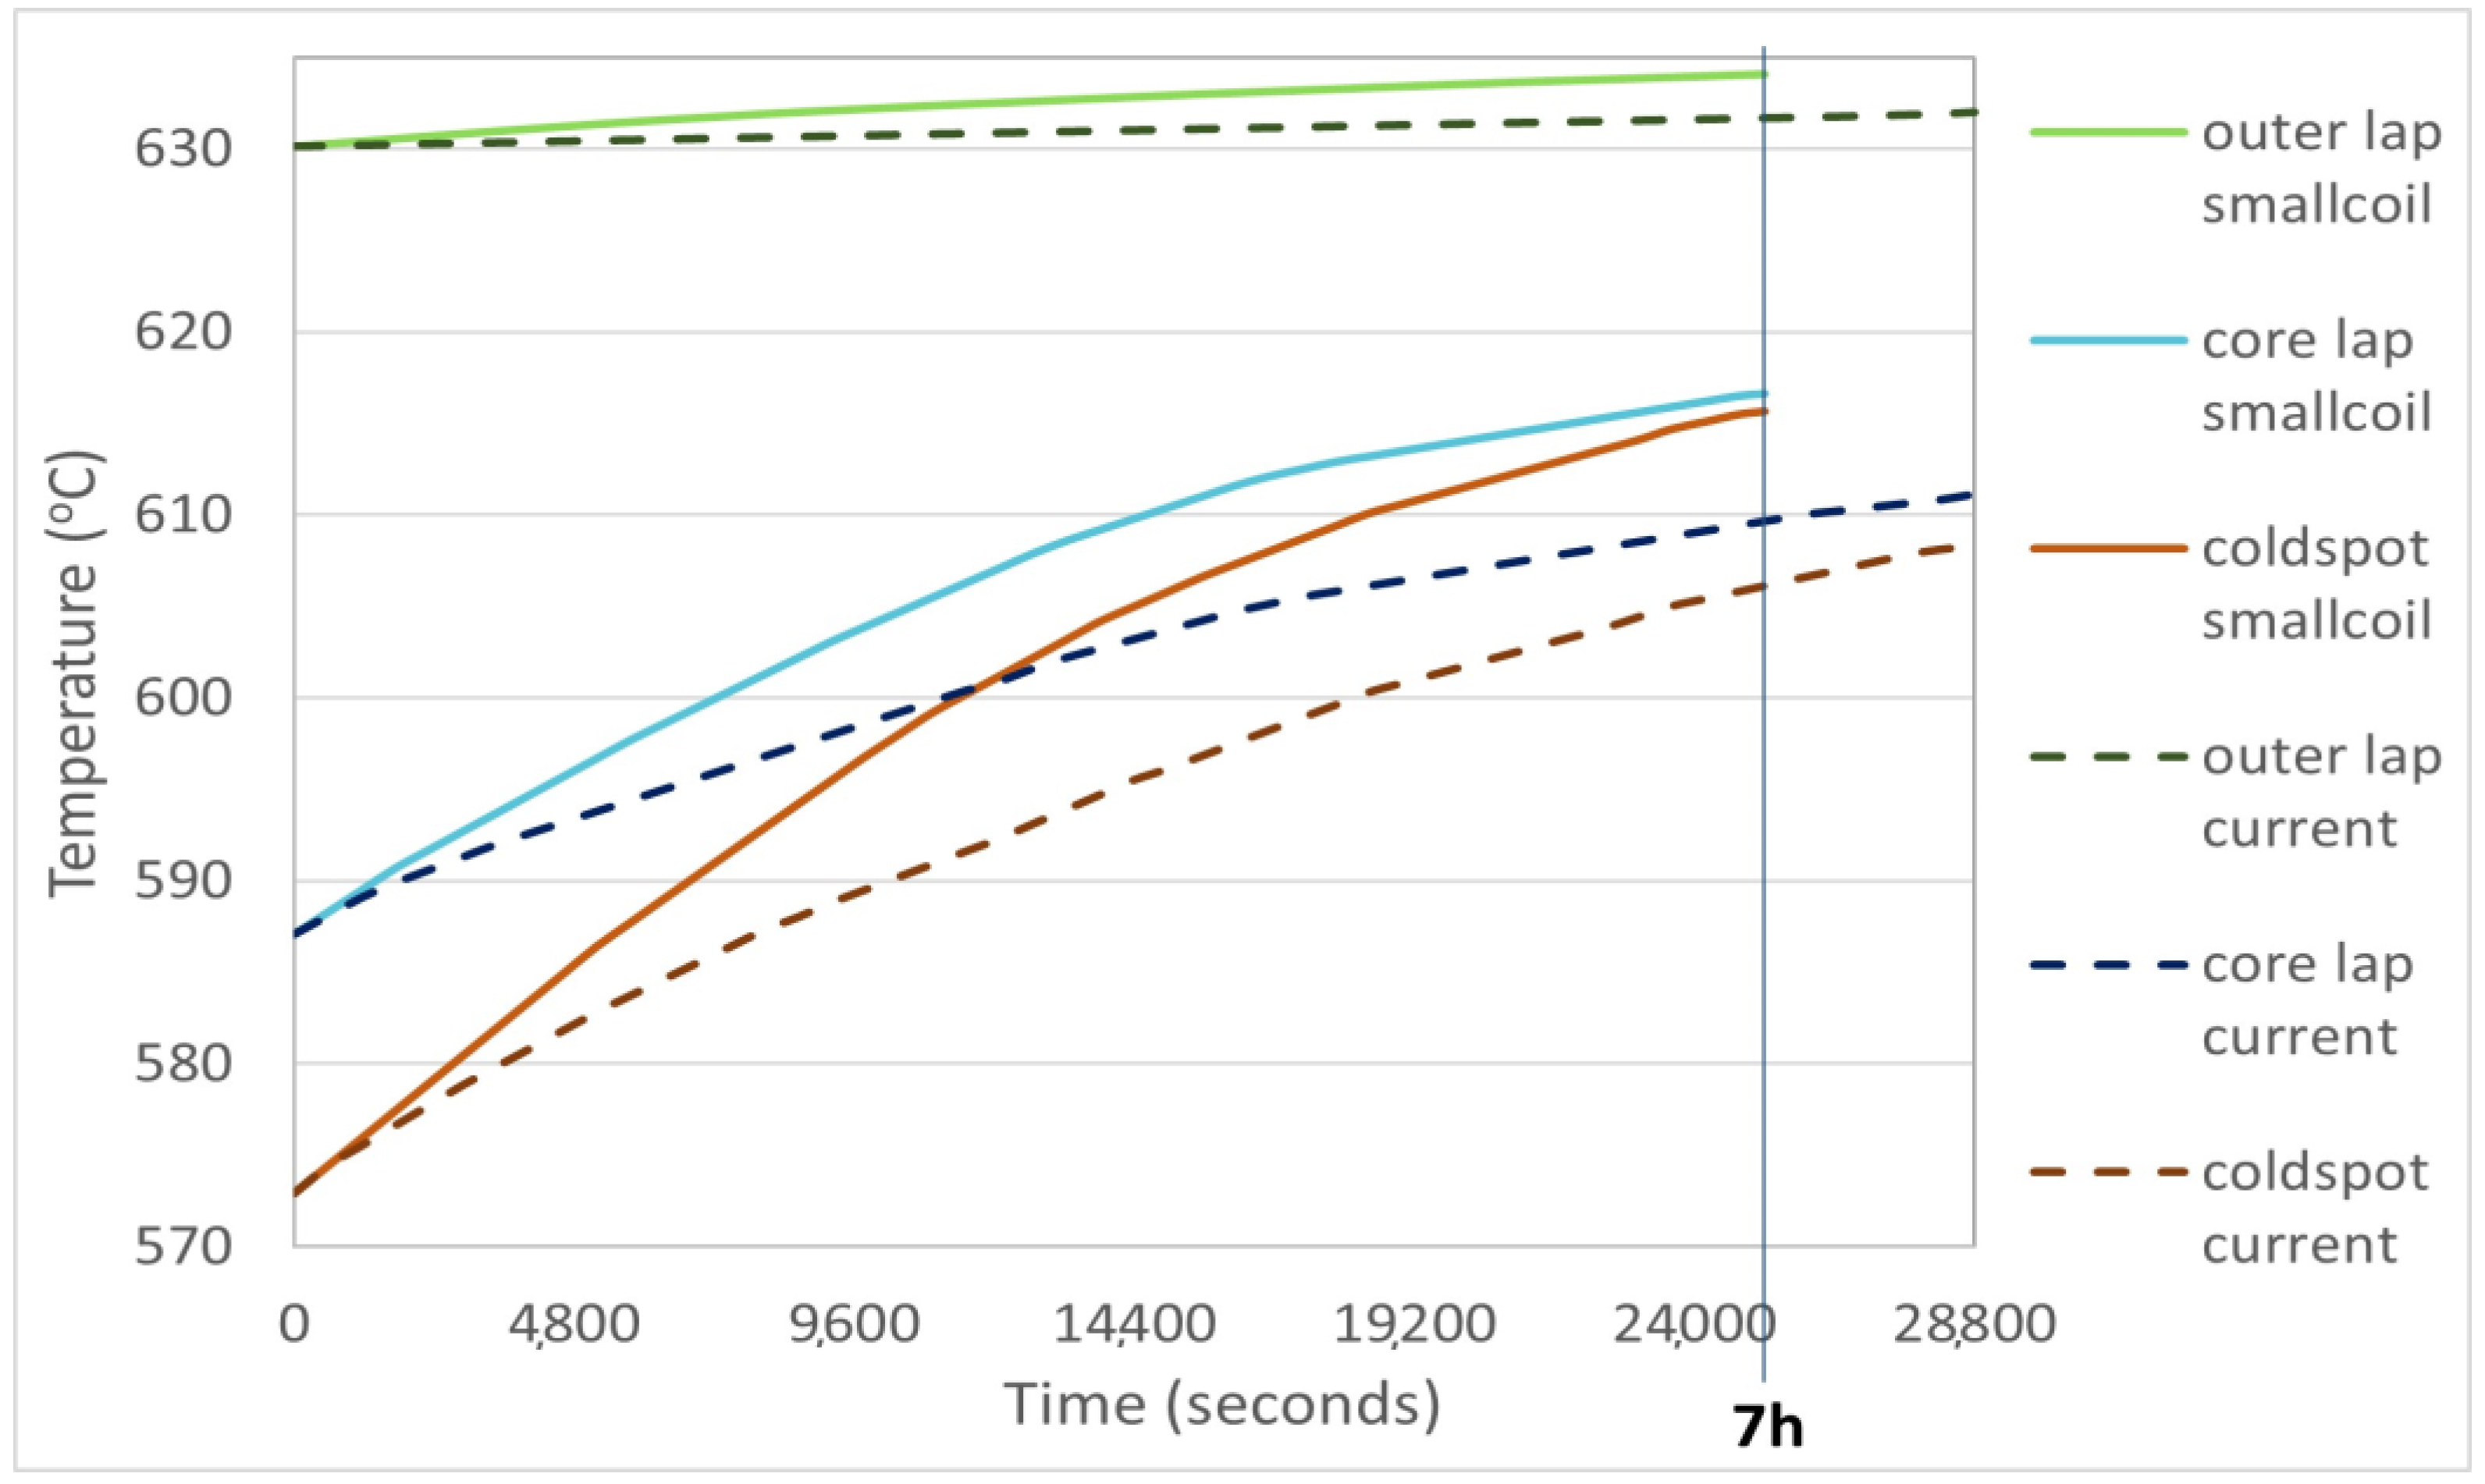
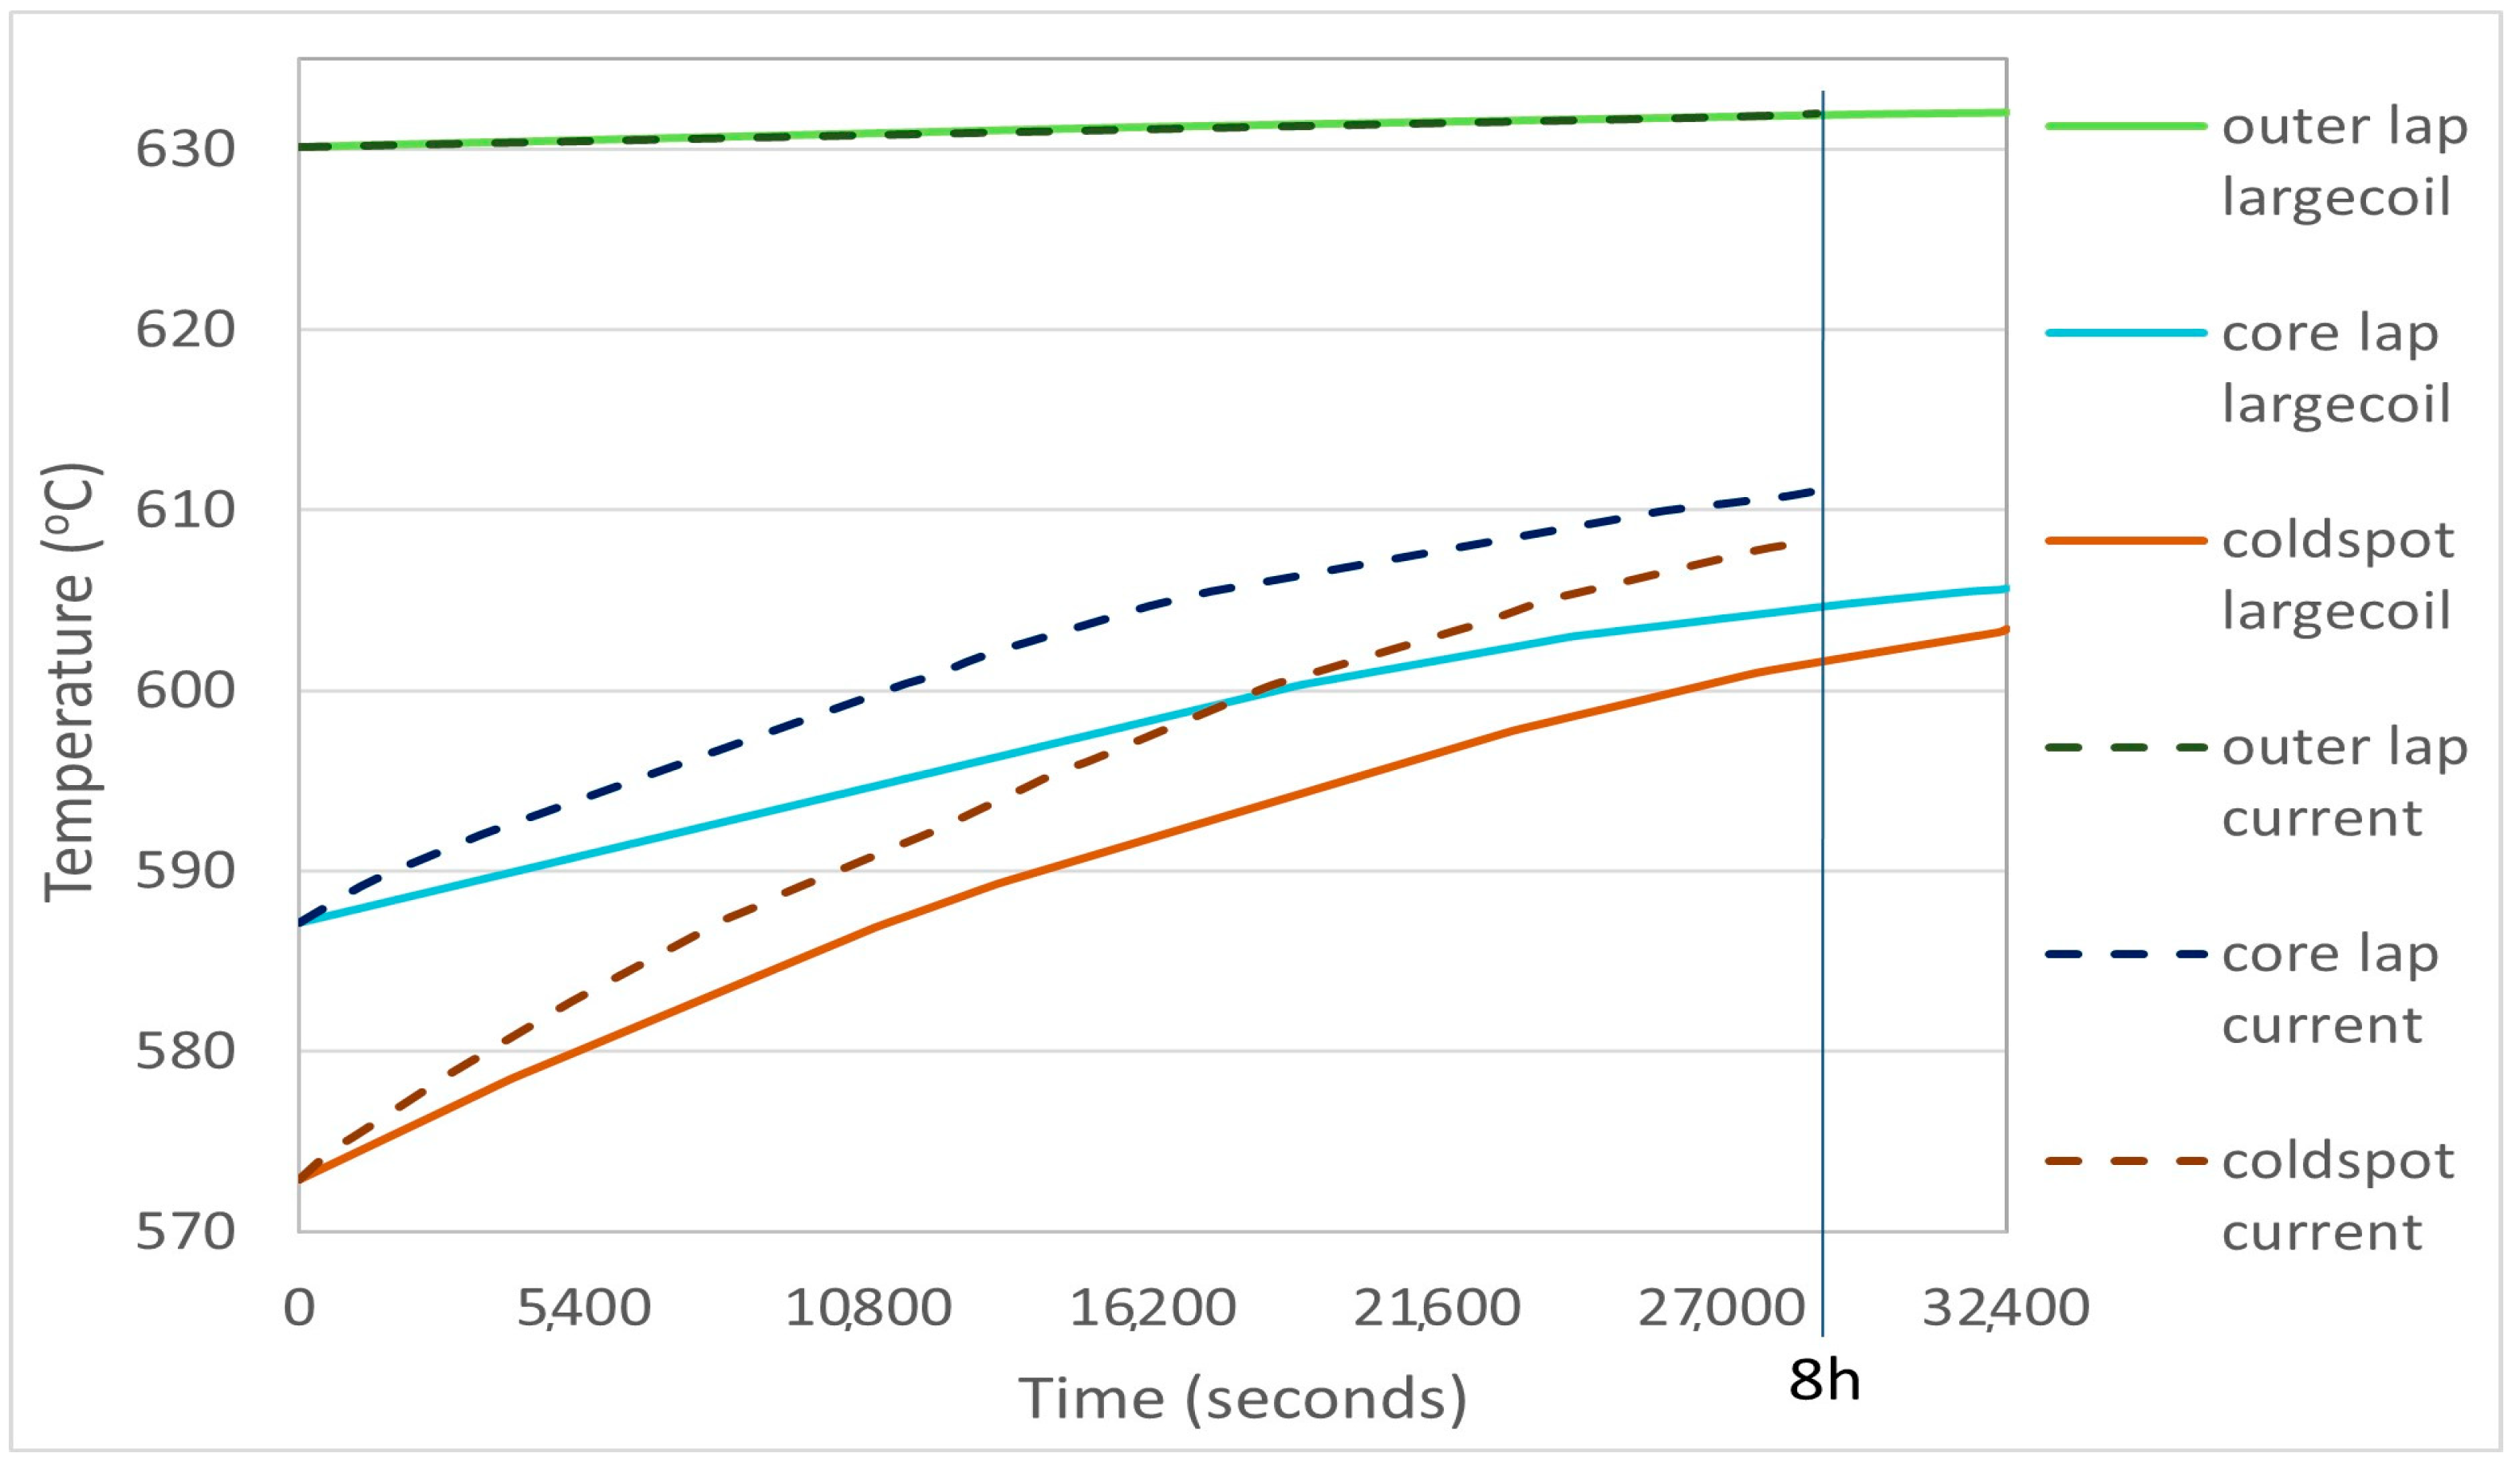
A new improvement scenario examined here was altered coil sizes, where two cases were modelled: a batch of smaller size and weight coils weighing 13.38 tonnes each (7 h soak) and a batch of larger coils weighing 16.21 tonnes each (9 h soak). The fluid CFD model boundary heat flux results for both cases are presented in Supplementary Material Tables S11 and S12, respectively, and the solid model results are presented below in Figure 13 and Figure 14.
The solid CFD model temperature profiles showed that the temperatures at the three areas of coil 3 in the small coil case were a lot higher due to the faster radial heat transfer, possibly leading to more uniform coil temperatures and properties and less defects, whereas in the large coil case the outer coil temperature remained almost the same as the current case and the inner coils temperatures were much lower, possibly due to the slower conduction of heat [12,48].

3.1.6. Furnace Improvement Scenario 4: Extended Soaking Time

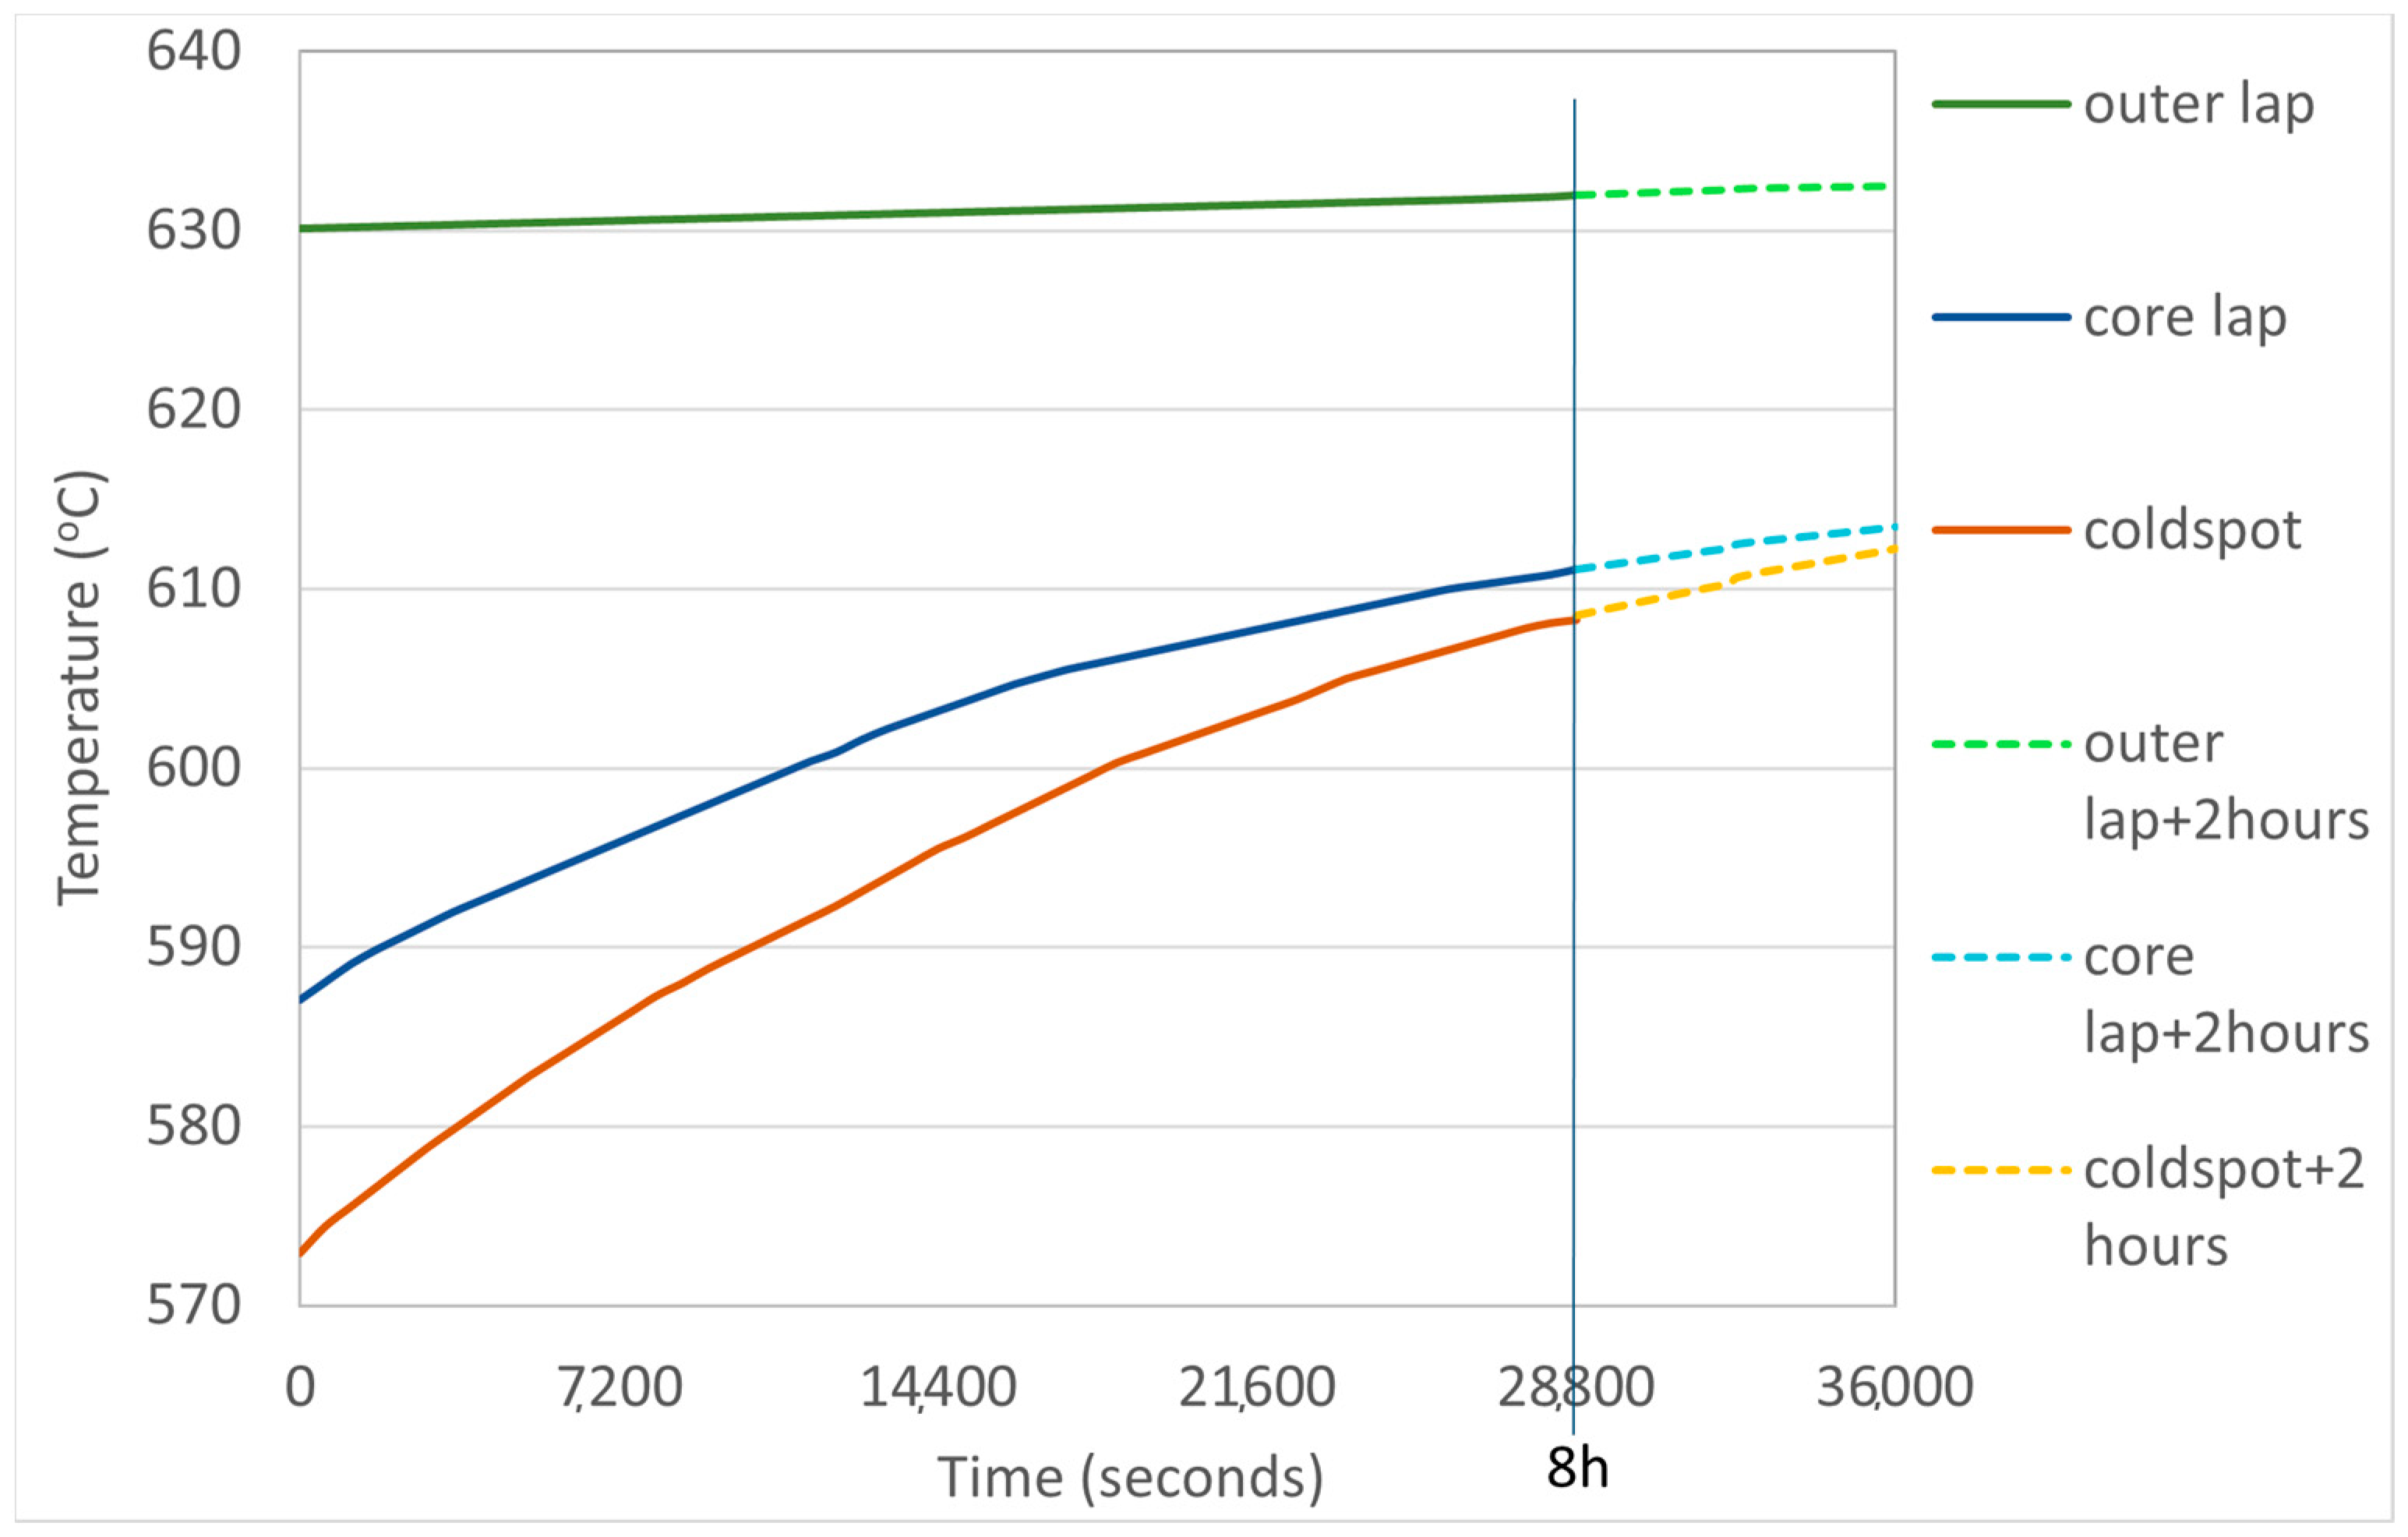
A final improvement scenario investigated in this study was the addition of extra soaking time to the annealing cycle. Two cases were examined: two and four additional hours for the soaking segment. The fluid CFD model boundary heat flux results for both cases are presented in Supplementary Material Tables S13 and S14, respectively, and the solid model results are shown in Figure 15 and Figure 16. The solid CFD model temperature profiles showed that the temperatures at the three areas of coil 3 increased with the addition of soaking time, with the outer lap temperature exhibiting only a small increase for both cases, and the cold spot temperatures increasing by 4 °C and 7 °C, respectively for the 2 and 4 extra hours cases by the end of soaking. This significant increase agrees with literature suggestions of more soaking time allowing heat to be conducted efficiently all through the coils [12] and possibly leading to positive effects on the final product quality of the steel product, due to enhanced surface reaction kinetics and steel recrystallisation [16].

3.1.7. Comparison of Temperature Profiles and Temperature Uniformity

For a comprehensive understanding of the impact of the furnace improvement proposals on the annealing process performance, the cases were compared in Table 6 below on the basis of the core lap and cold spot temperatures and the coil temperature uniformity achieved at the end of soaking, expressed as the maximum temperature differences between the hottest and coldest spots in the coil.
As can be seen in the Table 6, the 10 °C increased soaking temperature case exhibited the highest core lap and average cold spot temperatures, around 10–10.7 °C higher than the current furnace scenario, possibly leading to successful steel recrystallisation everywhere by the end of soaking. The second highest temperatures in the core lap and cold spot areas were achieved by the small coil case, with an increase of 5–7 °C compared to the current case. Next were the 4 h additional soaking time to the current furnace case and the 5 °C higher soaking temperature case, followed by the 200% and 100% higher coiling tension and 2 h additional soaking time cases. Finally, the larger coil case had a negative effect on the temperatures at the cold spot and core lap areas, lowering them by about 5 °C, which is explained by the larger coil radiuses slowing down radial conduction through the steel.
Regarding the temperature uniformity comparison, a smaller temperature difference possibly means that the steel recrystallisation and batch annealed steel properties are more uniform, with less defects and an enhanced final product quality [15]. The scenario presenting the smallest temperature difference, therefore the highest temperature uniformity at the end of soaking, was the current furnace case with 4 extra hours of soaking time, with a 17.34 °C maximum temperature difference, which is about 6.3 °C lower than the current furnace case. This was closely followed by the small coil case, with a 18.43 °C difference in temperature between the hot and cold spots, the 200% higher coiling tension case with 19.02 °C difference, the current case with 2 additional soaking hours with 20.26 °C difference, and the 100% higher coiling tension case with 20.85 °C difference. Finally, the increased soaking temperature cases presented a smaller improvement, whereas the large coil case exhibited the lowest temperature uniformity, much worse than the current case.

3.2. Technoeconomic Analysis of Promising Improvement Scenarios

A techno-economic evaluation was also deemed essential, to take into account the economic feasibility and performance of the furnace enhancement proposals compared to the current case, with the investigation limited to the scratching defect and a 32 h baseline heating cycle (heating and soaking) for the current furnace. The 5 °C and 10 °C higher temperature cases were accompanied by a 1 and 2 h increase in the heating cycle time, correspondingly, due to the longer time needed for the furnace atmosphere to reach the higher soaking temperatures at the end of the heating segment, therefore influencing both the operational and furnace availability costs [8]. The higher coiling tension cases have no effect on the operational costs of the batch annealing process, but a capital investment is needed to completely change the coiling equipment in the cleaning line before annealing [8]. The small coil batch case requires one hour less in the heating cycle, whereas the larger coil batch case requires one hour more, both therefore influencing the operational and furnace availability costs [8]. The longer soaking time cases added 2 and 4 h, respectively, to the current furnace soaking time, also influencing the operational and furnace availability costs. Some important information used for the cost calculations are presented in Supplementary Material Table S7, with the unit costs for electricity and natural gas taken from a June 2022 UK government report (March 2022 prices) [49], the hydrogen and nitrogen gas from online prices (August 2022) [50,51], and the price of steel determined from the 2021/22 financial year industry figures [8].
The material rejection percentages due to the scratching defect from industry data and the ones calculated by interpolation from the temperature uniformity graph introduced previously in the Methodology are presented in Table 7 below. The total operational cost, total furnace availability cost due to the extra time added and less steel produced, and the expected material rejection costs due to scratching for one batch annealing heating cycle (heating and soaking), as well as the total cost per cycle, are also presented for the current and enhanced cases.
The lowest rejection percentage due to the scratching defect was shown by the small coil batch case, closely followed by the 4 h extended soaking time case; therefore, these cases exhibited the largest improvement in batch annealing performance regarding product quality. This was followed by the 200% and 100% increased coiling tension cases. On the other hand, the highest rejection percentage by far was shown by the large coil batch case.
The only operational cost lower than the current furnace case was the small coil batch case, due to 1 h less annealing time. The highest total operational cost was shown by the 4 and 2 h extended soaking time and 10 °C increased soaking temperature cases, followed by the 5 °C increased soaking temperature and large coil batch cases. The highest total furnace availability cost was exhibited by the small coil batch, due to less steel being annealed each time, whereas the lowest availability cost was shown by the large coil case, due to more steel being annealed per batch, deeming it more cost-effective as it actually produced savings (negative value in Table 7). The 4 h extended soaking time case also produced a very high furnace availability cost. The highest material rejection cost was exhibited by the large coil case, while the rest of the cases all exhibited lower material rejection costs than the current furnace, with the lowest shown by the small coil batch case, with only GBP 27 per batch, followed by the 4 h extended soaking time and 200% higher coiling tension cases. The highest total net cost for one heating cycle and batch was exhibited by the small coil case at GBP 4456.72 per heating cycle, due to the much lower furnace availability and productivity caused by the small annealing batch, followed by the 4 h extended soaking time case. The lowest net total cost (costs minus furnace availability savings) was shown by the large coil batch case, which resulted in net savings due increased cost effectiveness. From the rest of the low net cost cases, the 200% increased coiling tension case exhibited the best economic performance, with GBP 222.29 per heating cycle.
Finally, regarding the necessary GBP 1.5 mil capital investment to implement the coiling tension cases, the smallest payback period was shown by the 200% increased tension case, at 2.96 years, which is short-term for the industry, and after that period the savings from this scenario would be significant. The payback period of the 100% increased tension case was 5.48 years, which is still a realistic, short–medium-term investment for the industry, with significant savings at over GBP 40 per heating cycle after the investment is paid back.

4. Discussion

Overall, the transient CFD analysis results indicated that most of the examined options could potentially create the conditions for enhanced steel recrystallisation and improved product quality with less defects, with the 4 h extended soaking time, the small coil, and 200% higher coiling tension cases deemed more promising, due to their enhanced uniformity of coil temperatures and steel recrystallisation properties.
A techno-economic evaluation next examined the cost-effectiveness of the proposed cases, to weigh the improvements in the scratching defect against any higher incurred costs. The large coil batch case seemed to be the most promising regarding the net total cost for one heating cycle, as it presented actual savings in the batch annealing process due to more cost-effective larger annealing batches and does not require any capital investment to be implemented. However, this probably would not constitute an attractive option for industry implementation, due to having the worst product quality performance regarding scratching and possibly requiring a large scale defect removal operation if implemented for all furnaces, in order to cope with the amount of quality issues, as well as much higher steel strip inspection and associated removal costs [39]. The higher soaking temperature and longer soaking time cases were also deemed non-cost-effective due to the much higher net costs per one heating cycle, even after large improvements in the defect material rejection costs. The small coil batch and 4 h extended soaking time cases showed the greatest potential for temperature uniformity and material rejection improvement; however, they also presented the largest net costs per cycle.
Therefore, from a holistic comparison, the only realistic options for industrial implementation to decrease the total cost and improve product quality in batch annealing are the 100% and 200% increased coiling tension cases, with the 200% case being the more preferable of the two, due to having the lowest total cost, payback period, and material rejection, for the same initial investment [47]. This option would result in over GBP 75 savings in cost per heating cycle compared to the current case, with an attractive and realistic short-term payback period. However, this case proved too much in reality for the coiling equipment and the steel coils, leading to sticking or distortion problems, while the 100% coiling tension is still a very attractive option, with a short–medium-term payback period, considerable savings in total costs, and significantly improved material rejection, as would be any other tension increase between 100% and 200%. The small coil batch and 4 h extended soaking time cases could also be contenders, due to their superb product quality performance and lack of need for capital investment, if ways were found to mitigate the high furnace availability and productivity costs (e.g., more coils per batch).
It is finally worth noting here that, even though the improvements in temperature uniformity were only up to 6.3 °C, it has been shown that such small improvements can translate into large savings in material rejection due to defects and in overall cost, and since the maximum errors of the transient simulations and the end of soaking results are considered to be one and two orders of magnitude smaller, respectively, this study offers a valid approach to suggesting solutions for a real industrial problem. However, it should be highlighted that the CFD modelling, and part of the techno-economic evaluation, were based on assumptions and simplifications and can only approach the real conditions; therefore, large scale industrial trials in a batch annealing furnace would be essential, especially for the cases not previously tested, to verify any positive impact on coil temperature profiles, material rejection due to scratching, and net costs. Future work will also include a more detailed capital investment analysis and a sensitivity analysis for the steel, electricity, and gas prices.

5. Conclusions

The present study examined a real industrial problem and employed CFD modelling to investigate the impact of several batch annealing variables on the process performance, concerning the inner coil temperatures and temperature uniformity and the resulting batch annealed steel quality. Four enhancement proposals were investigated in a transient CFD analysis and were ranked in terms of inner coil temperatures and temperature uniformity achieved at the end of soaking. A techno-economic analysis was used to compare the cost-effectiveness of the enhancement proposals for a specific steel defect, scratching, which is currently prominent in batch annealed steel and incurs hundreds of thousands of pounds of costs every year. It was found that
  • The 10 °C increased soaking temperature case resulted in the highest inner coil temperatures, possibly ensuring successful steel recrystallisation across the coil;
  • The 4 h extended soaking time case showed the highest temperature uniformity, closely followed by small coil batch and the 200% increased tension cases;
  • The lowest material rejection was shown by the small coil batch case, followed by the 4 h extended soaking time and 200% increased coiling tension cases, whereas the highest rejection was presented by the large coil batch case;
  • The highest total net cost for one heating cycle was exhibited by the small coil case. The lowest total net cost was shown by the large coil batch case, followed by the 200% increased coiling tension case;
This study concluded that the 200% increased tension case is the most promising option for industrial implementation, due to the combination of defect reduction potential and highest savings after the payback period, if the industry can accommodate a large initial investment. The 100% increased coiling tension, or any increase between them, would be the second best option. Finally, the small coil batch and 4 h extended soaking time cases could become the best options, due to best defect reduction performance and no need for capital investment, if the furnace availability costs could be mitigated.
Overall, even though the conclusions of this research are based on modelling work that included assumptions and simplifications, and although industrial large-scale trials would be needed to confirm the improvements, the importance of the above results lies in the fact that they provide a strong indication of new directions that the industry can pursue in order to improve the efficiency of the whole batch annealing process and to eliminate, or at least reduce significantly, a long-standing issue that impacts both the economic and environmental sustainability of steelmaking today.

Supplementary Materials

The following supporting information can be downloaded at: https://www.mdpi.com/article/10.3390/en16207040/s1, Figure S1: Simplified outer furnace CFD model; Table S1: CFD model geometry and setup information [8,52,53,54,55]; Figure S2: Temperature profile of inner cover with ‘perfect combustion’ flue gas composition; Table S2: Grid independence study; Table S3: Additional CFD geometry information; Table S4: Additional ANSYS fluid-only CFD furnace model mesh and setup information [56]; Table S5: Additional STRACCM+ solid-only CFD furnace model mesh and setup information; Table S6: Interlap air gap and contact percentage between the current and coiling tension cases; Table S7: Input information for techno-economic analysis; Table S8: Fluid-only transient CFD model results as boundary heat fluxes (W/m2) for outer lap and core surfaces of coils and convector plates for the current furnace case (also applies for all increased coiling tension cases due to no changes in fluid domain); Table S9: Fluid-only transient CFD model results as boundary heat fluxes (W/m2) for outer lap and core surfaces of coils and convector plates for the 5oC increased soaking temperature case; Table S10: Fluid-only transient CFD model results as boundary heat fluxes (W/m2) for outer lap and core surfaces of coils and convector plates for the 10oC increased soaking temperature case; Table S11: Fluid-only transient CFD model results as boundary heat fluxes (W/m2) for outer lap and core surfaces of coils and convector plates for the small coil case; Table S12: Fluid-only transient CFD model results as boundary heat fluxes (W/m2) for outer lap and core surfaces of coils and convector plates for the large coil case; Table S13: Fluid-only transient CFD model results as boundary heat fluxes (W/m2) for outer lap and core surfaces of coils and convector plates for the current furnace case with 2 extra hours of soaking time (Total = 10 h); Table S14: Fluid-only transient CFD model results as boundary heat fluxes (W/m2) for outer lap and core surfaces of coils and convector plates for the current furnace case with 4 extra hours of soaking time (Total = 12 h).

Author Contributions

L.S.: Conceptualisation, Methodology, Software, Formal analysis, Investigation, Writing—Original Draft, R.J.: Conceptualisation, Supervision, Writing—Review and Editing, S.B.: Conceptualisation, Supervision, D.V.: Conceptualisation, Supervision, L.A.: Conceptualisation, Supervision, Writing—Review and Editing, A.F.: Conceptualisation, Supervision, A.V.M.: Conceptualisation, Supervision, Writing—Review and Editing. All authors have read and agreed to the published version of the manuscript.

Funding

This project was supported by the European Social Fund through the Welsh Government and Tata Steel UK Ltd. (Tata Steel Packaging, Trostre Works).

Data Availability Statement

Data are contained within the supplementary material: The data presented in this study are available in the file “Supplementary Materials”. Any additional information is available upon request.

Acknowledgments

First, the authors would like to thank all the people from Tata Steel Trostre Works that supported and contributed to this study, as well as academic supervisors Valera Medina and Richard Marsh of Cardiff University for their continuing support over the last four years. This project is a Materials and Manufacturing Academy project and has been financially supported by the European Social Fund through the Welsh Government and Tata Steel Packaging.

Conflicts of Interest

The authors declare that they have no conflict of interest and no known competing financial interests or personal relationships that could have appeared to influence the work reported in this paper.

Nomenclature

CFDComputational Fluid Dynamics
NGNatural Gas
N 2 Nitrogen
H 2 Hydrogen
Variables
ΡPressure (Pa)
u, v, wThree-dimensional fluid velocities (m/s)
ρ (Du,v,w/Dt) Rates of change of momentum in 3 dimensions (N)
ρfBody forces on the fluid (N)
μ Dynamics   viscosity   of   fluid   ( P a · s )
τShear stress (Pa)
ρ   D E / D t Rate of change of energy (W)
TTemperature (°C or K)
kThermal conductivity (W/mK)
k 2 T Net rate of heat conduction through boundaries in 3 dimensions (W)
S h Other sources of energy (W)
t t o t a l Total thickness (m)
k r , e q Total equivalent coil radial thermal conductivity (W/mK)
t s t e e l Thickness of steel strip (m)
t s i l i c a t e Thickness of silicate layer deposit (m)
t g a p Thickness of air gap between coil laps (m)
k s t e e l Thermal conductivity of steel (W/mK)
k s i l i c a t e Thermal conductivity of silicates (W/mK)
k g a s Thermal conductivity of protective atmosphere gas (W/mK)
A c o n t a c t % Percentage contact between coil laps (%)
Δ T m a x Maximum temperature difference inside coil (°C)
T c o i l ,   m a x ,     m i n Maximum and minimum temperatures inside coil (°C)
CCost (£)
t h e a t i n g Sum of heating and soaking segment time (hours)
WFurnace equipment capacity (kW)
c e l e c t r i c i t y ,     N G Unit cost of electricity (£/kWh) and gas (£/m3)
c n i t r o g e n ,     h y d r o g e n Unit cost of nitrogen and hydrogen gases (£/m3)
NNumber of burners in Batch annealing furnace
ηBurner efficiency (%)
qSpecific calorific value of natural gas (kWh/m3)
Q ˙ Volumetric flow (m3/h)
t a d d e d Time added to annealing cycle (hours)
LCoil batch load (tonnes)
c s t e e l Unit price of tin coated steel (£/tonne)

References

  1. Morgan, E. Tinplate Manufacture. In Tinplate & Modern Canmaking Technology, 1st ed.; Pergamon Press: Exeter, UK, 1985; pp. 5–73+200–222. [Google Scholar]
  2. JFE Steel Corporation. Tin Mill Products; JFE Steel Corporation: Tokyo, Japan, 2020; Available online: https://www.jfe-steel.co.jp/en/products/sheets/catalog/b1e-006.pdf (accessed on 8 June 2020).
  3. ITRA Ltd. Guide to Tinplate, 2nd ed.; ITRA Ltd.: Uxbridge, UK, 2000. [Google Scholar]
  4. SMS Group GmbH. Efficient Production of Tinplate Packaging Material out of Cold-Strip; SMS Group GmbH: Hilden, Germany, 2015. [Google Scholar]
  5. ASM International. Subject Guide: Heat Treating; ASM International: Novelty, OH, USA, 2015; Available online: www.asminternational.org (accessed on 23 March 2020).
  6. Llewellyn, D.T.; Hudd, R.C. Low-carbon strip steels. In Steels, 3rd ed.; Llewellyn, D.T., Hudd, R.C., Eds.; Butterworth-Heinemann: Swansea, UK, 1998; pp. 1–136. [Google Scholar]
  7. Alaneme, K.K.; Okotete, E.A. Recrystallization mechanisms and microstructure development in emerging metallic materials: A review. J. Sci. Adv. Mater. Devices 2019, 4, 19–33. [Google Scholar] [CrossRef]
  8. Trostre Works Tata Steel Packagigng. Personal Communication. Llanelli, 2020. [Google Scholar]
  9. Eurotherm Limited. Single and Multi-Stack batch Annealing; Eurotherm Limited: Worthing, UK, 2006; Available online: https://www.eurotherm.com/download/ht-single-multi-stack-batch-annealing-app-note-hr084054u003/ (accessed on 20 March 2020).
  10. Sahay, S.S.; Mehta, R.; Raghavan, S.; Roshan, R.; Dey, S.J. Process analytics, modeling, and optimization of an industrial batch annealing operation. Mater. Manuf. Process. 2009, 24, 1459–1466. [Google Scholar] [CrossRef]
  11. Clifford, J.A. The Partial Annealing of Low-Carbon Steel Strip. Master’s Thesis, McGill University, Montreal, QC, Canada, 1969. [Google Scholar]
  12. Bertrandie, J.J.; Bordignon, L.; Putz, P.D.; Volger, G. Hot and Cold Rolling Processes—Sticking and Scratching Problems after Batch Annealing, Including Coil Compression Stress Effects; European Commission: Luxembourg, 2006. [Google Scholar]
  13. Saboonchi, A.; Hassanpour, S. Simulation of cold rolled steel coil heating during batch annealing process. Heat Transf. Eng. 2008, 29, 893–901. [Google Scholar] [CrossRef]
  14. Mazur, V.L.; Timoshenko, V.I.; Prikhodko, I.Y. Efficient Cold Rolling and Coiling Modes. Steel Transl. 2019, 49, 548–558. [Google Scholar] [CrossRef]
  15. Buckley, A.; Moses, A.J.; Trollope, L. Study and redesign of high temperature batch annealing furnace for production of grain oriented electrical steel. Ironmak. Steelmak. 1999, 26, 477–482. [Google Scholar] [CrossRef]
  16. Sahay, S.S.; Kumar, B.V.H.; Krishnan, S.J. Microstructure evolution during batch annealing. J. Mater. Eng. Perform. 2003, 12, 701–707. [Google Scholar] [CrossRef]
  17. Zuo, Y.; Wu, W.F.; Zhang, X.X.; Lin, L.; Xiang, S.H.; Liu, T.S.; Niu, L.Y.; Huang, X.L. A study of heat transfer in high-performance hydrogen bell-type annealing furnaces. Heat Transf. Asian Res. 2001, 30, 615–623. [Google Scholar] [CrossRef]
  18. Schoina, L.; Jones, R.; Burgess, S.; Vaughan, D.; Andrews, L.; Foley, A. Impact of annealing cycle parameters on Batch Annealing process performance in tinplate manufacturing. In Proceedings of the 13th European Conference on Industrial Furnace and Boilers, Algarve, Portugal, 19–22 April 2022; pp. 1–12. Available online: https://orca.cardiff.ac.uk/id/eprint/150121/ (accessed on 1 August 2022).
  19. Roache, P.J. Computational Fluid Dynamics, 1st ed.; Hermosa Publishers: Albuquerque, NM, USA, 1972. [Google Scholar]
  20. Anderson, J.D. Governing equations of fluid dynamics. In Computational Fluid Dynamics, 1st ed.; Wendt, J.F., Ed.; Springer: Berlin/Heidelberg, Germany, 2009; pp. 15–51. [Google Scholar]
  21. Childs, P.R.N. Rotating Flow, 1st ed.; Elsevier: Oxford, UK, 2011. [Google Scholar]
  22. Versteeg, H.K.; Malalasekera, W. An Introduction to Computational Fluid Dynamics: The Finite Volume Method, 2nd ed.; Pearson Education Limited: Harlow, UK, 2007. [Google Scholar]
  23. Ferziger, J.H.; Peric, M. Computational Methods for Fluid Dynamics, 3rd ed.; Springer: Berlin/Heidelberg, Germany, 2002. [Google Scholar]
  24. Hadawi Fatla Oula, M. Development of Convection in High-Temperature Coil Annealing Furnaces Using Rotating Cylinders Technique. Ph.D. Thesis, Cardiff University, Cardiff, UK, 2019. [Google Scholar]
  25. Hân, T. ANSYS Fluent Theory Guide 15.0; ANSYS Inc.: Canonsburg, PA, USA, 2013. [Google Scholar]
  26. ANSYS Inc. Temporal Discretization. afs.enea.it. 2023. Available online: https://www.afs.enea.it/project/neptunius/docs/fluent/html/th/node367.htm (accessed on 28 February 2023).
  27. ANSYS Inc. ANSYS Fluent Getting Started Lecture 10: Transient Flow Modeling; ANSYS Inc.: Canonsburg, PA, USA, 2019. [Google Scholar]
  28. Ideal Simulations. Courant Number. Ideal Simulations.com. 2020. Available online: https://www.idealsimulations.com/resources/courant-number-cfd/#:~:text=The%20CFL%20condition,-Let%27s%20discuss%20the&text=Roughly%20speaking%2C%20in%20explicit%20schemes,the%20solution%20of%20an%20ODE (accessed on 17 February 2023).
  29. ANSYS Inc. ANSYS Fluent Getting Started Lecture 9: Turbulence; ANSYS Inc.: Canonsburg, PA, USA, 2019. [Google Scholar]
  30. ANSYS Inc. ANSYS Fluent Heat Trnasfer Modeling Lecture 02: Conduction Heat Transfer; ANSYS Inc.: Canonsburg, PA, USA, 2017. [Google Scholar]
  31. Barry, S.I.; Sweatman, W.L. Modelling heat transfer in steel coils. ANZIAM J. 2008, 50, 668–681. [Google Scholar] [CrossRef]
  32. Karlberg, M. Thermo-Mechanical Modelling of Hot Strip Coil Cooling Process, 1st ed.; Lulea University of Technology: Lulea, Sweden, 2014. [Google Scholar]
  33. Yoshioka, N. Elastic behavior of contacting surfaces under normal loads: A computer simulation using three-dimensional surface topographies. J. Geophys. Res. 1994, 99, 15549–15560. [Google Scholar] [CrossRef]
  34. Fluent Inc. Fluent 6.1 User’s Guide. 2003; Fluent Inc.: Lebanon NH, USA; Available online: https://www.google.com/url?sa=t&rct=j&q=&esrc=s&source=web&cd=&ved=2ahUKEwjK-ZfEl7yBAxXfQEEAHWgwDcIQFnoECBgQAQ&url=https%3A%2F%2Fwww.researchgate.net%2Ffile.PostFileLoader.html%3Fid%3D570bb021cbd5c2adcc30fdfb%26assetKey%3DAS%3A349689057693697%401460383776597&usg=AOvVaw3MmjRwYgddamPvQfnNQhV3&opi=89978449 (accessed on 13 September 2021).
  35. Ahmed, M.; Radwan, A.; Serageldin, A.; Memon, S.; Katsura, T.; Nagano, K. Thermal analysis of a new sliding smart window integrated with vacuum insulation, photovoltaic, and phase change material. Sustainability 2002, 12, 7846. [Google Scholar] [CrossRef]
  36. Ajotikar, N.A. Synthesis of Computations and Experiments for Obtaining Pulsatile Gas Flow Rates from Dynamic Pressure Difference Measurements across an Orifice-plate Meter. Michigan. 2011. Available online: https://digitalcommons.mtu.edu/cgi/viewcontent.cgi?article=1563&context=etds (accessed on 1 September 2022).
  37. Leap Australia. Tips and Tricks: Convergence and Mesh Independece Study. Leading Engineering Application Providers. 2021. Available online: https://www.computationalfluiddynamics.com.au/convergence-and-mesh-independent-study/ (accessed on 8 November 2021).
  38. Supercomputing Wales Portal. Guidance for Completing the Project Application Form on MySCW. Supercomputing Wales Portal: Cardiff, UK, 2021. Available online: https://portal.supercomputing.wales/index.php/getting-access/guidance-for-completing-the-project-application-form-on-myscw/ (accessed on 8 November 2021).
  39. Herring, D.H. Saving Money by Maximizing Furnace Uptime Productivity. Industral Heating, Elmhurst, p. 1, June 2013. Available online: https://www.industrialheating.com/articles/90856-saving-money-by-maximizing-furnace-uptime-productivity (accessed on 4 May 2020).
  40. Office of Energy Efficiency & Renewable Energy. Estimating Appliance and Home Electronic Energy Use. US Department of Energy. Available online: https://www.energy.gov/energysaver/estimating-appliance-and-home-electronic-energy-use (accessed on 10 September 2022).
  41. U.S. Department of Energy. A BestPractices Steam Technical Brief—How To Calculate The True Cost of Steam; U.S. Department of Energy: Washington, DC, USA, 2003.
  42. Borutsky, V. How Much Gas a Gas Stove Consumes: Gas Flow Calculation Procedure. 2019. Available online: https://engineer.decorexpro.com/en/gaz/standart/skolko-gaza-potreblyaet-gazovaya-plita.html (accessed on 20 September 2022).
  43. Fives North American Combustion UK Ltd. FRG Series Gas Burners; Fives North American Combustion UK Ltd.: Wolverhampton, UK, 2009; pp. 1–4. Available online: https://manualzz.com/doc/37339056/frg-series-gas-burners-bulletin-1.1 (accessed on 24 August 2023).
  44. Mickey, S.R.; Efficient Gas Heating of Industrial Furnaces. Thermal Processing, Pelham, p. 1, January 2017. Available online: https://thermalprocessing.com/efficient-gas-heating-of-industrial-furnaces/ (accessed on 12 November 2022).
  45. Rohsenow, W.M.; Hartnett, J.P.; Cho, Y.I. (Eds.) Handbook of Heat Transfer, 3rd ed.; McGraw-Hill: New York, NY, USA, 1998. [Google Scholar]
  46. Can Tech International. Trostre Tinplate Works Celebrates Milestone Anniversary; Bell Publishing Ltd.: Gravesend, UK, 2022; Available online: https://www.cantechonline.com/news/28844/trostre-tinplate-works-celebrates-milestone-anniversary/ (accessed on 20 September 2022).
  47. Javed, R.; Payback Method. Accounting for Management. 2022. Available online: https://www.accountingformanagement.org/payback-method/ (accessed on 20 September 2022).
  48. Qilin, L.; Kai, D.; Weining, L.; Linglei, K.; Jiajia, C.; Daping, S.; Xichao, W. Temperature uniformity of profiled grinding wheel under high-frequency induction brazing. Int. J. Adv. Manuf. Technol. 2021, 117, 1091–1099. [Google Scholar] [CrossRef]
  49. Department for Business Energy and Industrial Strategy. Quarterly Energy Prices June 2022. London. 2022. Available online: https://assets.publishing.service.gov.uk/government/uploads/system/uploads/attachment_data/file/1086569/quarterly_energy_prices_uk_june_2022.pdf (accessed on 30 September 2022).
  50. BOC Ltd. Hydrogen Gas; BOC Ltd.: Guildford, UK, 2022; Available online: https://www.boconline.co.uk/shop/en/uk/gas-a-z/hydrogen (accessed on 1 September 2022).
  51. BOC Ltd. Nitrogen Gas Cylinders; BOC Ltd.: Guildford, UK, 2022; Available online: https://www.boconline.co.uk/shop/en/uk/gas-a-z/nitrogen (accessed on 1 September 2022).
  52. U.S. Environmental Protection Agency. Natural Gas Combustion. U.S. Environmental Protection Agency: Durham, NC, USA, 2020. Available online: https://www.epa.gov/sites/default/files/2020-09/documents/1.4_natural_gas_combustion.pdf (accessed on 17 February 2022).
  53. Testo Ltd. Calculation Formulae, Fuels and Testo Flue Gas Analyzers; Testo Ltd.: Alton, UK, 2020; Available online: https://static-int.testo.com/media/de/3b/f57704ebe71e/testo-Calculation-formulae-fuels-and-parameters-testo-flue-gas-analyzers.pdf (accessed on 11 February 2023).
  54. Arkhazlooa, N.B.; Bouissaa, Y.; Bazdidi-Tehranib, F.; Jadidib, M.; Morinc, J.-B.; Jahazia, M. Experimental and unsteady CFD analyses of the heating process of large size forgings in a gas-fired furnace. Case Stud. Therm. Eng. 2019, 14, 1–12. [Google Scholar] [CrossRef]
  55. Filipponi, M.; Rossi, F.; Presciutti, A.; De Ciantis, S.; Castellani, B.; Carpinelli, A. Thermal analysis of an industrial furnace. Energies 2016, 9, 833. [Google Scholar] [CrossRef]
  56. Transmetra GmbH. Table of Emissivity of Various Surfaces; Transmetra GmbH: Flurlingen, Switzerland, 2020; Available online: https://www.transmetra.ch/images/transmetra_pdf/publikationen_literatur/pyrometrie-thermografie/emissivity_table.pdf (accessed on 17 January 2022).
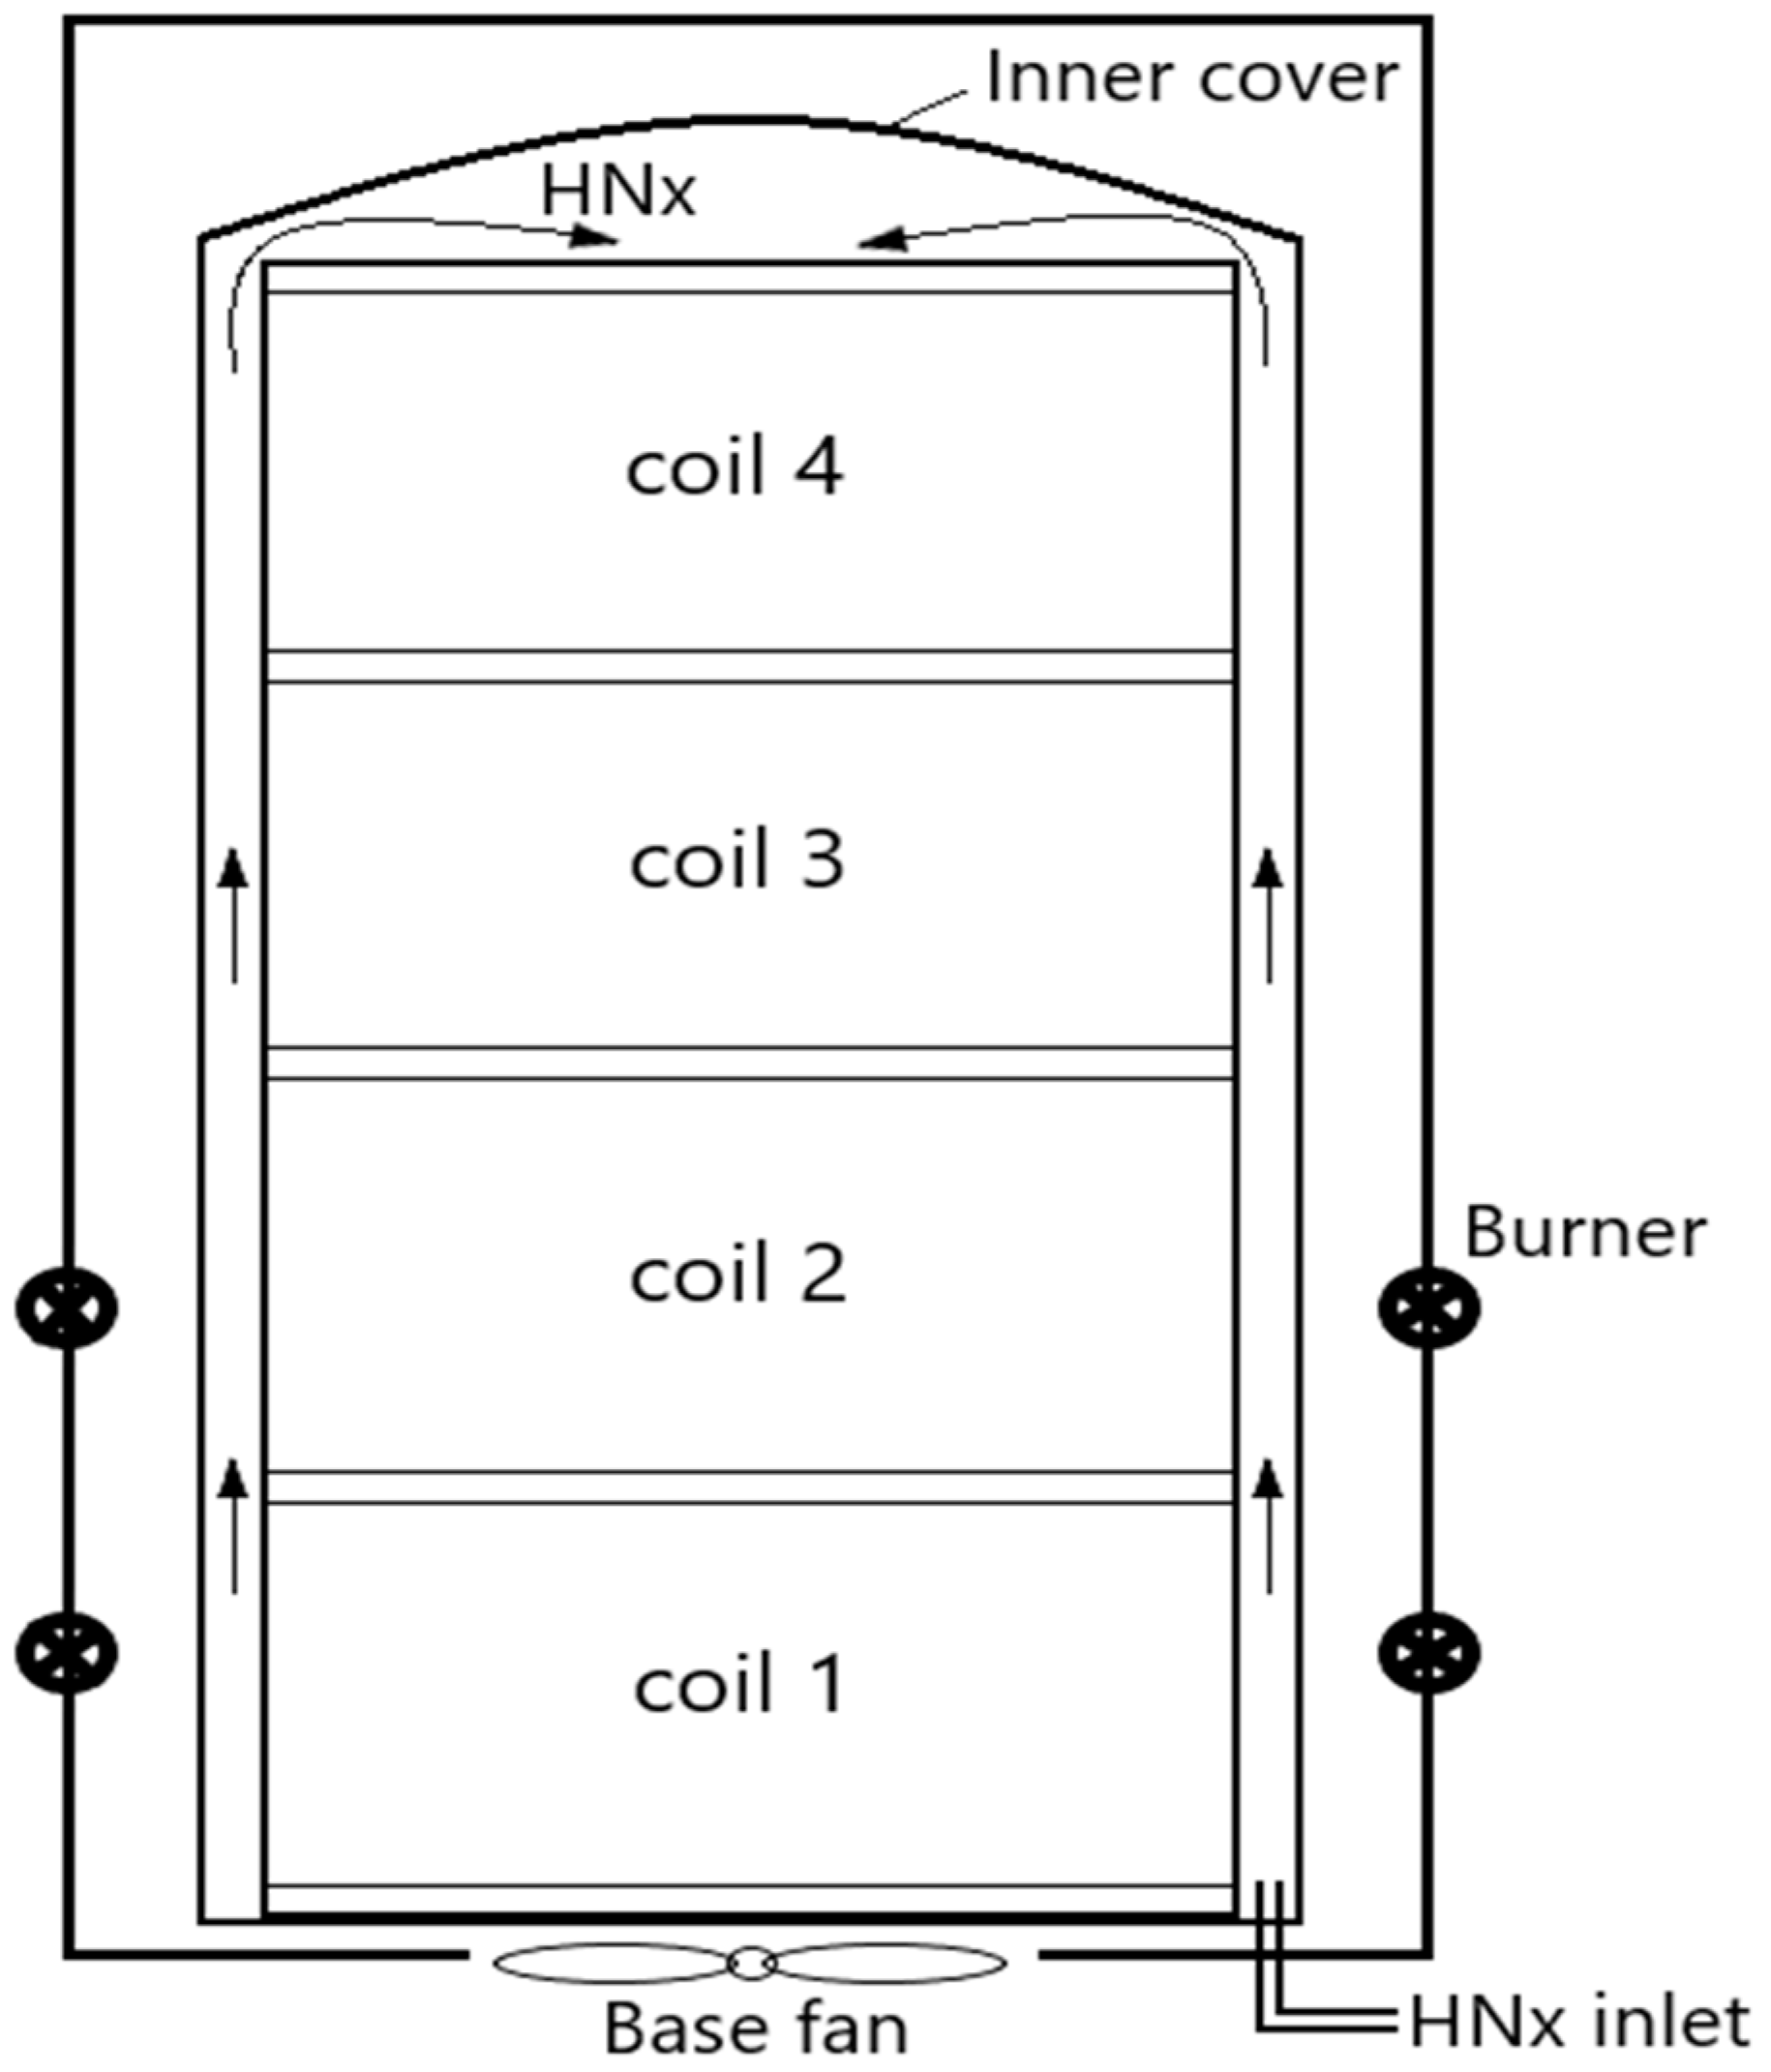
Figure 1. Batch annealing furnace with natural gas burners and nitrogen and hydrogen (HNx) protective atmosphere [8,9].
Energies 16 07040 g001
Figure 2. The fluid-only (left) and solid-only (right) CFD model geometries.
Energies 16 07040 g002
Figure 3. Steel strip, silicate layer, and interlap air gap [32].
Energies 16 07040 g003
Figure 4. Core lap, cold spot, and outer lap areas on coil 3.
Energies 16 07040 g004
Figure 5. Flowchart for CFD calculations and thermocouple validation of the current furnace models [34,35].
Energies 16 07040 g005
Figure 6. Material rejection percentage estimation from industrial trial datasets and maximum temperature differences [8].
Energies 16 07040 g006
Figure 7. CFD and thermocouple data temperature profiles during soaking for the three areas of coil 3.
Energies 16 07040 g007
Figure 8. Coil 3 temperature profile at the end of soaking, showing the core, cold spot, and outer lap areas.
Energies 16 07040 g008
Figure 9. Transient temperature profiles for the 5 °C increased soaking temperature case for the three areas of coil 3.
Energies 16 07040 g009
Figure 10. Transient temperature profiles for the 10 °C increased soaking temperature case for the three areas of coil 3.
Energies 16 07040 g010
Figure 11. Transient temperature profiles for the 100% increased coiling tension case for the three areas of coil 3.
Energies 16 07040 g011
Figure 12. Transient temperature profiles for the 200% increased coiling tension case for the three areas of coil 3.
Energies 16 07040 g012
Figure 13. Transient temperature profiles for the small coil case for the three areas of coil 3.
Energies 16 07040 g013
Figure 14. Transient temperature profiles for the large coil case for the three areas of coil 3.
Energies 16 07040 g014
Figure 15. Transient temperature profiles for the three areas of coil 3 for the current furnace case with 2 extra hours.
Energies 16 07040 g015
Figure 16. Transient temperature profiles for the three areas of coil 3 for the current furnace case with 4 extra hours.
Energies 16 07040 g016
Table 1. Comparison of the end of soaking coil temperatures between thermocouple the data and CFD results.
Temperatures (°C)Thermocouple DataCFD Model
Coil 3—outer lap631.91632
Coil 3—core lap610.72611.1
Coil 3—cold spot608.23av. 608.27
Table 2. Grid independence study results for the coarse, medium, and fine mesh for the fluid model.
Mesh SizeNumber of
Elements
Outlet
Temperature (°C)
Coil 3 Outer Lap
Temperature (°C)
Coil 3 Core Lap
Temperature (°C)
Running Time (hours)
Coarse6.36 million547.9628.68610.65157
Medium8.74 million566.89632611.184.5
Fine12.71 million566.97632.02611.09146.5
Table 3. Grid independence study results for the coarse, medium, and fine mesh for the solid model.
Mesh SizeNumber of
Elements
Coil 3 Outer Lap Temperature (°C)Coil 3 Core Lap Temperature (°C)Coil 3 Average Cold Spot
Temperature (°C)
Running Time (hours)
Coarse2.02 million628.69610.65597.9815.5
Medium3.46 million632.002611.101608.2724.5
Fine6.51 million632.01611.093608.2848.4
Table 4. Time-step independence study results for the medium mesh size fluid model.
Time Step Size (s)Number of StepsOutlet Temperature (°C)Coil 3 Outer Lap
Temperature (°C)
Coil 3 Core Lap
Temperature (°C)
0.00128.8 mil565.91631.86610.95
0.000648 mil566.89632611.1
0.000396 mil566.901632.002611.102
Table 5. Time-step independence study results for the medium mesh size solid model.
Time Step Size (s)Number of StepsCoil 3 Outer Lap
Temperature (°C)
Coil 3 Core Lap
Temperature (°C)
Coil 3 Average Cold Spot Temperature (°C)
181600631.89610.93608.03
122400632.002611.101608.27
64800632.004611.105608.272
Table 6. Comparison of coil maximum temperature differences, indicating the temperature uniformity for each CFD model case.
Enhancement ScenariosCoil 3 Outer Lap Temperature (°C)Coil 3T Core Lap Temperature (°C)Coil 3Average T Cold Spot (°C)ΔΤ = Max − Min (°C)
Current furnace + 4 h632.89615.5615.517.34
Small coil634.09616.62615.6618.43
Coiling tension + 200%632.5614.5613.4819.02
Current furnace + 2 h632.51613.5612.2520.26
Coiling tension + 100%632.43612.7611.5820.85
+10 °C soaking T641.4621.2619.0222.38
+5 °C soaking T636.32615.44613.9222.4
Current furnace632611.1608.2723.73
Large coil632.05605.65603.4328.62
Table 7. Total net cost per heating cycle, estimated capital costs, and payback period for each improvement case.
CasesMaterial
Rejection Due to Scratching (%)
Total Operational Cost (1 Heating
Cycle) (GBP)
Total Furnace
Availability Cost (1 Heating Cycle) (GBP)
Material
Rejection Cost from 1 Batch (GBP)
Total Cost per Heating Cycle (GBP)
Current furnace0.2709179.25-118.93298.18
+5 °C soaking T0.24737185.03544.36108.60837.99
+10 °C soaking T0.24698190.831088.72108.431387.98
+100% tension0.1774179.25-77.88257.13
+200% tension0.09804179.25-43.04222.29
Small coils0.07173.664255.6527.414456.72
Large coils2.17184.86−2953.011029.48−1738.67
Current furnace + 2 h0.15199190.461088.7366.721345.91
Current furnace + 4 h0.0702201.662177.4530.822409.93
Disclaimer/Publisher’s Note: The statements, opinions and data contained in all publications are solely those of the individual author(s) and contributor(s) and not of MDPI and/or the editor(s). MDPI and/or the editor(s) disclaim responsibility for any injury to people or property resulting from any ideas, methods, instructions or products referred to in the content.