Article

Modeling and Experimental Studies of the Photovoltaic System Performance in Climate Conditions of Poland

by
Slawomir Gulkowski
Department of Renewable Energy Engineering, Faculty of Environmental Engineering, Lublin University of Technology, Nadbystrzycka 40B, 20-618 Lublin, Poland
Energies 2023, 16(20), 7017; https://doi.org/10.3390/en16207017
Submission received: 22 September 2023 / Revised: 6 October 2023 / Accepted: 7 October 2023 / Published: 10 October 2023
(This article belongs to the Section A2: Solar Energy and Photovoltaic Systems)

Abstract

:
The polycrystalline silicon photovoltaic system located in Poland has been investigated from a modeling and an experimental perspective. The five-parameter single-diode (SD) model was used to compute the current–voltage (I-V) characteristics of the PV modules for weather conditions measured during one year (2022) of PV system operation. Based on the I-V curves, the PV power output, monthly energy yields, and performance were simulated. Besides the single-diode method, the Osterwald model (OM) was used to estimate the power output of the PV system under scrutiny. The modeling results were compared to the experimental data. The determination coefficient (R2), root mean square error (RMSE), mean bias error (MBE), and relative error (RE) were utilized to quantify the quality of both models. The highest R2 value of 0.983 (power output) was found for March, a relatively cold and sunny month in the analyzed period. The lowest values of the RMSE and the MBE were found to be 5% and 1%, respectively. A high correlation between the modeled and the experimental daily yield was noticed in June, which was the sunniest month of the year. Median values were found to be 5.88 kWh/kW (measurement), 5.87 kWh/kW (SD), and 5.87 kWh/kW (OM). The RE of the monthly array yield was found to be below 1% (summer half-year) in terms of the single-diode method. The strong correlation between the simulated and the experimental findings was also noticed for the medians of the DC performance ratio (PRDC). The median values of the PRDC from May to July were found to be in the range between 0.88 and 0.94.

1. Introduction

Modeling a photovoltaic module involves computations of current–voltage characteristics (I-V curves) for any weather conditions. The accuracy of the I-V curve prediction depends on the number of parameters associated with the diode-based model. The greater this number is the more accurate it is, and thus the more complex the model becomes [1,2,3]. Knowledge of the correlation between the weather conditions and the model parameters is crucial in the photovoltaic (PV) design, operation, and maintenance process. Firstly, it enables precise forecasting of electricity production, which is of great importance in preparing a reliable business plan and the financial risk assessment of the PV investment [4,5,6]. Moreover, it helps the grid operators manage the electric balance between power demand and supply [7]. Finally, it plays a pivotal role in the PV performance evaluation and fault diagnosis, especially when aging effects become significant [4].
A comprehensive description of PV models can be found in the scientific literature [1,8,9,10,11]. Generally, diode-based models can be divided according to the number of diodes in the equivalent electrical circuit, of which the most common are single-diode [12,13,14], double-diode [15,16,17,18], and triple-diode models [19,20]. As was found in the work of Humada et al. [1], the single-diode model is characterized by a good balance between the accuracy and complexity of the implemented procedures. This was also confirmed in our previous study on a four-parameter (4-p) SD model application for a high-quality photovoltaic module [21]. A comparison between the performance of the single-diode (four- and five-parameter) and the double-diode model was shown by Khezzar et al. [22]. Several PV technologies were tested under different operating conditions. Relative errors of the maximum power point prediction were found to be below 1% for each studied case. In the work of Bana and Saini [23], the single-diode and the double-diode model were validated using polycrystalline PV modules under real operating conditions. The authors confirmed the high accuracy of the single-diode approach for high solar radiation levels. In terms of lower radiation intensity, the double-diode model appeared to be more accurate.
Proposed by De Soto et al. [24], the five-parameter (5-p) SD model has been successively validated using a variety of PV technologies, including mono- and polycrystalline silicon. A comparison of predicted I-V curves with the experimental data revealed a good fit for single-junction cells using only parameters provided by the manufacturer. In the work of Ma et al. [25], the I-V curves obtained using the De Soto model were compared with those obtained from commercial software for different solar radiation levels and cell temperatures. The shape of the I-V curves was almost identical. A slight difference was observed in the knee of the curves, which was probably caused by a low value (below one) of the ideality factor.
Several authors have used diode-based models to compare the predicted and measured power output of the PV system for selected days. Celik and Acikgoz [26] examined the four- and five-parameter models for several daily datasets of the summer months. The R2 of the current and the power estimation ranged between 0.976 and 0.995 using the 4-p model and from 0.986 to 0.996 using the 5-p approach. The relative error of energy was found to be lower for the 5-p model (between 0.4% and 4.4%) than for the 4-p model (up to 11.2%). Eke and Demircan [27] applied modeling methods based on the measurement of the I-V curves to analyze the performance of a multi-crystalline silicon PV module under climatic conditions in Turkey. The absolute relative error in monthly energy production varied from about 1.9% in March to 12.1% in November, with an average annual value of 0.98%. Sentruk and Eke (2017) [28] showed the simulation results of the output peak power and the electricity output on different days. The RMSE did not exceed 4.7% (in terms of power) or 3.6% (in terms of energy). Recently, Houssein et al. [20] applied the five-parameter single-diode model to determine the electrical efficiency of the floating PV system.
To the best of the author’s knowledge, there is an insufficient amount of research on long-term analysis of PV systems using the modeling methods combined with the experimental campaign, especially, in high-latitude locations (such as Poland in this case). This paper fills the gap in knowledge in this field by comparing the modeled and experimental results of PV power output and energy production for one year of PV system operation. The five-parameter single-diode model combined with measured weather parameters were applied to compute the I-V curves for power output prediction. The accuracy of the comparison was compared using statistical metrics such as root mean square error and mean bias error.

2. Materials and Methods

2.1. Experimental Setup

The installation of the experimental PV, consisting of 21.25 kW polycrystalline (pc-Si) silicon PV modules (Figure 1), was carried out in the east of Poland at a latitude of 51°84′ north and a longitude of 23°16′ east. The altitude above sea level is 145 m. The PV modules were oriented to the south and tilted at the optimum angle of 34°. The installation was connected to the grid using the inverters equipped with two MPP trackers. The detailed specification of the PV modules as well as the inverter provided by the manufacturer is presented in Table 1.
The plane of array (POA) irradiance was measured using the reference cell based on monocrystalline silicon with an accuracy of ±5% of the final value and in the range of 0–1200 W/m2. The PV module’s temperature was also measured at the site location of the analyzed system as described in previous papers [29,30]. Additional weather parameters were provided by the nearest weather station of the Institute of Meteorology and Water Management [31]. Data collected by the station were as follows: global horizontal irradiance (GHI) measured using a CMP11 pyranometer, ambient temperature, precipitation quantities, and snow depth at ground level. The central data-logging computer system was used for synchronous data collection. Measured values of solar irradiance, DC output power, and temperature were recorded every 5 min and stored for further analysis.

2.2. Single-Diode (SD) Model

The PV module’s current–voltage (I-V) characteristics can be modeled using an equivalent electrical circuit that consists of an ideal current source in parallel with a diode, series, and shunt resistances. This well-known relationship, called the single-diode model (SD), can be defined following the work of De Soto et al. [24] using Equations (1)–(7).
I = I L I 0 e V + I R s a 1 V + I R s R s h
where IL is the light-generated current (in A), I0 is the diode reverse saturation current (in A), R s is the series resistance (in Ω), Rsh is the shunt resistance (in Ω), and a is the modified diode ideality factor given by Equation (2).
a = N s n 1 k T c q
where N s is the number of cells in series, T c is the module temperature (in °C), n 1 is the ideality factor, q is the electron charge, and k is the Boltzmann constant.
To obtain the I-V curve of the PV module (or single photovoltaic cell) for a given irradiance (G) and the module temperature ( T c ), five unknown parameters (IL, I0, a, Rs, Rsh) have to be determined [24]. The light current is directly proportional to the incident solar radiation and can be expressed by Equation (3).
I L = G G r e f I L , r e f + α I s c T c T r e f
I L , r e f is the light current at standard test conditions (STC), i.e., irradiance ( G r e f ) of 1000 W/m2 and PV module temperature ( T r e f ) of 25 °C. The short-circuit current temperature coefficient ( α I s c , in A/°C) is provided by the manufacturer (Table 1).
The diode saturation current can be computed using Equations (4) and (5) based on the energy bandgap ( E g ,   i n   e V ) characteristic of the semiconductor from which the PV module was fabricated.
I 0 = I 0 , r e f T c T c , r e f 3 · e x p E g , T r e f k T r e f E g k T c
E g = E g , T r e f 1 0.0002677 T c T r e f
In terms of crystalline silicon, the bandgap at the reference temperature ( E g , T r e f ) was 1.121 eV. The bandgap energy temperature dependence (in 1/K) was assumed to be −0.0002677 1/K, as it was in [24]. It should be noted that, for other PV technologies (e.g., CIGS, CdTe), both factors are of different values [32].
The dependencies of the modified diode factor ( a ) and the shunt resistance ( R s h ) on temperature and irradiance are expressed by Equations (6) and (7).
a = a r e f T c T r e f
R s h = R s h , r e f G r e f G
R s h , r e f and a r e f denote the shunt resistance and the ideality diode factor at the reference conditions, respectively. The changes in series resistance ( R s ) with temperature or irradiance are assumed to be neglected. Thus, the constant reference value of R s , r e f is used for any conditions.
As can be seen from Equations (3)–(7), before computation of the final I-V curve at given atmospheric parameters, the reference parameters, namely, IL,ref, I0,ref, aref, Rs,ref, and Rsh,ref, have to be determined. They can be extracted using the method described in the work of [24] or directly read by the System Advisor Model (SAM) [33] library reader function provided by PVLIB [34]. Table 2 presents the reference parameters of the PV module under study.
Based on the I-V characteristics simulated for a given irradiance and module temperature, the maximum power point P M (in W) can be determined for performance metric computations.

2.3. Osterwald Model (OM)

The Osterwald method [35] allows for the computation of the output power of a PV module for a given irradiance and temperature using Equation (8).
P M = P M , r e f G G r e f 1 + γ T c T r e f
where P M , r e f is the peak power at reference conditions, and γ is the temperature coefficient of power (in 1/°C). Both values are provided by the manufacturer with the datasheet of the PV module.

2.4. Performance Metrics

The following metrics, defined in the IEC 61724:2021-1 standard [36], were used for the experimental and modeling analysis: daily and monthly reference yield (Yr, in Wh · W−1), daily and monthly array (DC) yield (YA, in Wh · W−1), and monthly DC performance ratio (PRDC).
The reference yield Yr (daily or monthly), defined as the number of reference irradiance hours [37], can be computed using Equation (9).
Y r = H i G r e f
where H i (in Wh∙m−2) is the in-plane irradiation (daily or monthly), determined using numerical integration of irradiance data G i , k according to Equation (10).
H i = k N G i , k · τ k
τ k (in h) is the time interval between adjacent irradiance values, and N is the total number of irradiance values registered during the analyzed period. By analogy, DC energy output (Ei, in Wh) computations are carried out using Equation (11).
E i = k N P i , k · τ k
Pi,k (W) is the measured value of the output DC power. The PV array energy yield (YA) can be determined by Equation (12). This value can be understood as the number of hours over the analyzed period (here, days and months) during which the PV system worked at its rated power ( P 0 ,   i n   W p ) [38].
Y A = E i P 0
Dividing Equation (12) by Equation (9), the DC performance ratio (PRDC) can be obtained (Equation (13)). This dimensionless metric enables evaluation of the PV system regardless of the power capacity and the location [39]. The final form of PRDC is expressed by Equation (14).
P R D C = Y A Y r
P R D C = k m P i , k / P 0 k m G i , k / G r e f

2.5. Experimental vs. Modeling Analysis

Figure 2 shows the flowchart of the procedures used for the PV system analysis. The experimental time series of irradiance and temperature measured during 2022 were used for modeling. Simulations were performed in parallel using the single-diode and Osterwald methods. Quantities obtained using these models were compared to the measured values of the PV output power, daily and monthly DC energy yield, and daily DC performance ratio for the same values of G and Tm. Before computing the characteristic parameters (Table 1), the five reference parameters of the SD model (Table 2) were determined. The SD parameters in the function of G and Tm were computed using the function provided in the PVLIB library [34]. The current–voltage curves were simulated using the procedure that comes from the same source. Both functions were implemented as a part of the designed modeling software created in the Matlab/Simulink® environment (Natick, MA, USA) [40] for PV system analysis.
Based on the modeled and experimental values of the PV output power, the DC energy yield together with the performance metrics were computed and compared, similar to the work of Torres-Ramirez et al. [41]. The root mean square error (RMSE), given by Equation (15), was used to evaluate the scatter of the modeled vs. measured output DC power. The mean bias error showing the average deviation of the modeled values from the measurements was computed using Equation (16).
R M S E = k = 1 N P m o d P m e a 2 N / 1 N k = 1 N P m e a
M B E = k = 1 N P m o d P m e a N / 1 N k = 1 N P m e a
where P m o d and P m e a are the modeled and measured PV output DC power of the analyzed system, respectively, and N is the number of collected irradiance and power values. The relative error between the measured and modeled monthly DC energy output (Ei) was computed by Equation (17).
R E = E m o d E m e a E m e a
where E m o d is the monthly modeled energy output, and E m e a is the experimental energy.

3. Results and Discussion

According to the Köeppen–Geiger classification [42], the studied PV system is located on the border of two climate zones: Cfb (warm temperate, fully humid warm summer) and Dfb (snow, fully humid warm summer). The monthly in-plane irradiation and the average ambient and PV module temperatures are shown in Figure 3a. The highest irradiation during the analyzed period (2022) was in June (190 kWh/m2), whereas the lowest value was in December (barely 11 kWh/m2). Such a significant disparity in the number of sunshine hours over the year is characteristic and was observed in previous studies [29,43] and similar research conducted for high-latitude locations [44,45,46].
The average monthly ambient temperature ranged from −0.6 °C in December to 20.4 °C in June. Minimum and maximum PV module temperatures were found to be 3.4 °C and 29.9 °C, respectively. The highest difference between ambient and module temperature was noticed in sunny months (such as May or June) and relatively cold months (such as March or April). In these cases, differences of about 10 °C were recorded. For the other months, a range of 3.3 °C to 8.3 °C was noticed.
In addition to the previously mentioned weather factors, the following were also significant in the analyzed high-latitude location: precipitation and snow. The first one, if it occurs, supports the natural cleaning of the PV modules, preventing a decrease in the PV system efficiency due to dust accumulation. Indeed, as was discussed in [47], dust deposition adversely affects the energy yield from the solar panels by either absorbing or reflecting the solar radiation. Figure 3b shows the number of days with precipitation. Rainfall was registered in all months of the studied year. On top of that, the highest level of precipitation was noticed in high-sunshine months, which is perfect for improving the efficiency of the solar modules.
Figure 3b depicts a high number of snowy days observed during the winter months (January and December). There were also spring days during which non-zero snow depth was recorded. As was shown in [45], snow cover is a problem that leads to effects similar to inverter breakdowns (total cover) or partial shading (partial cover). Automatic detection of snow cover is a challenging task. For this reason, external snow depth measured on the ground is a reliable source of information about the covering of the PV modules [45]. The influence of snow occurrence on energy yield is discussed later in this section.
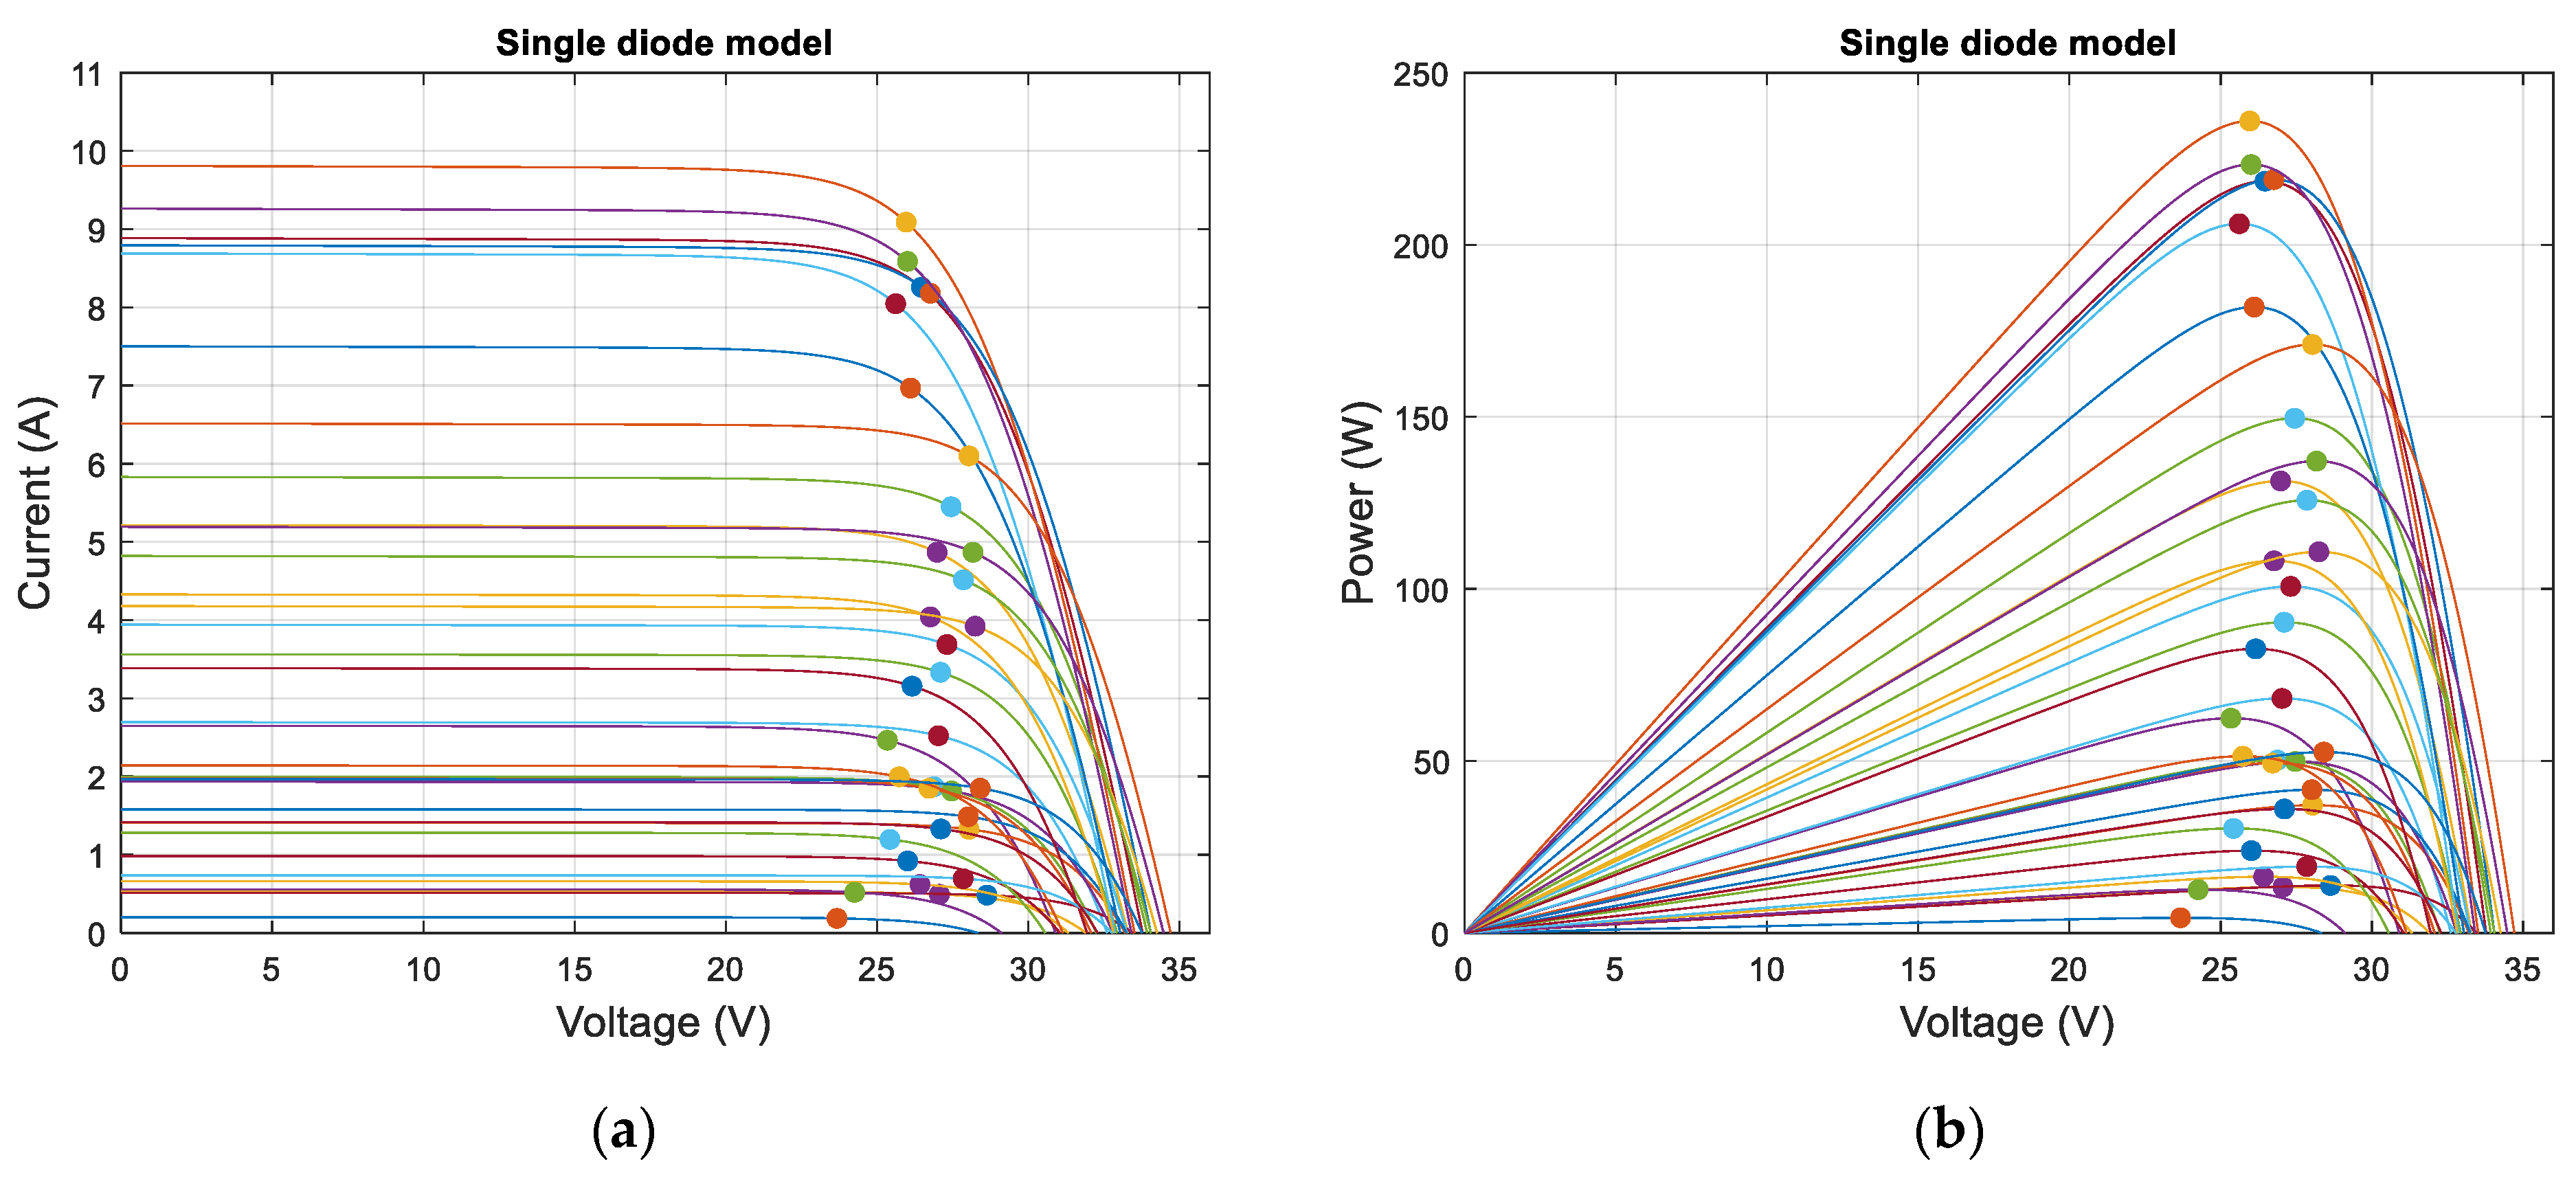
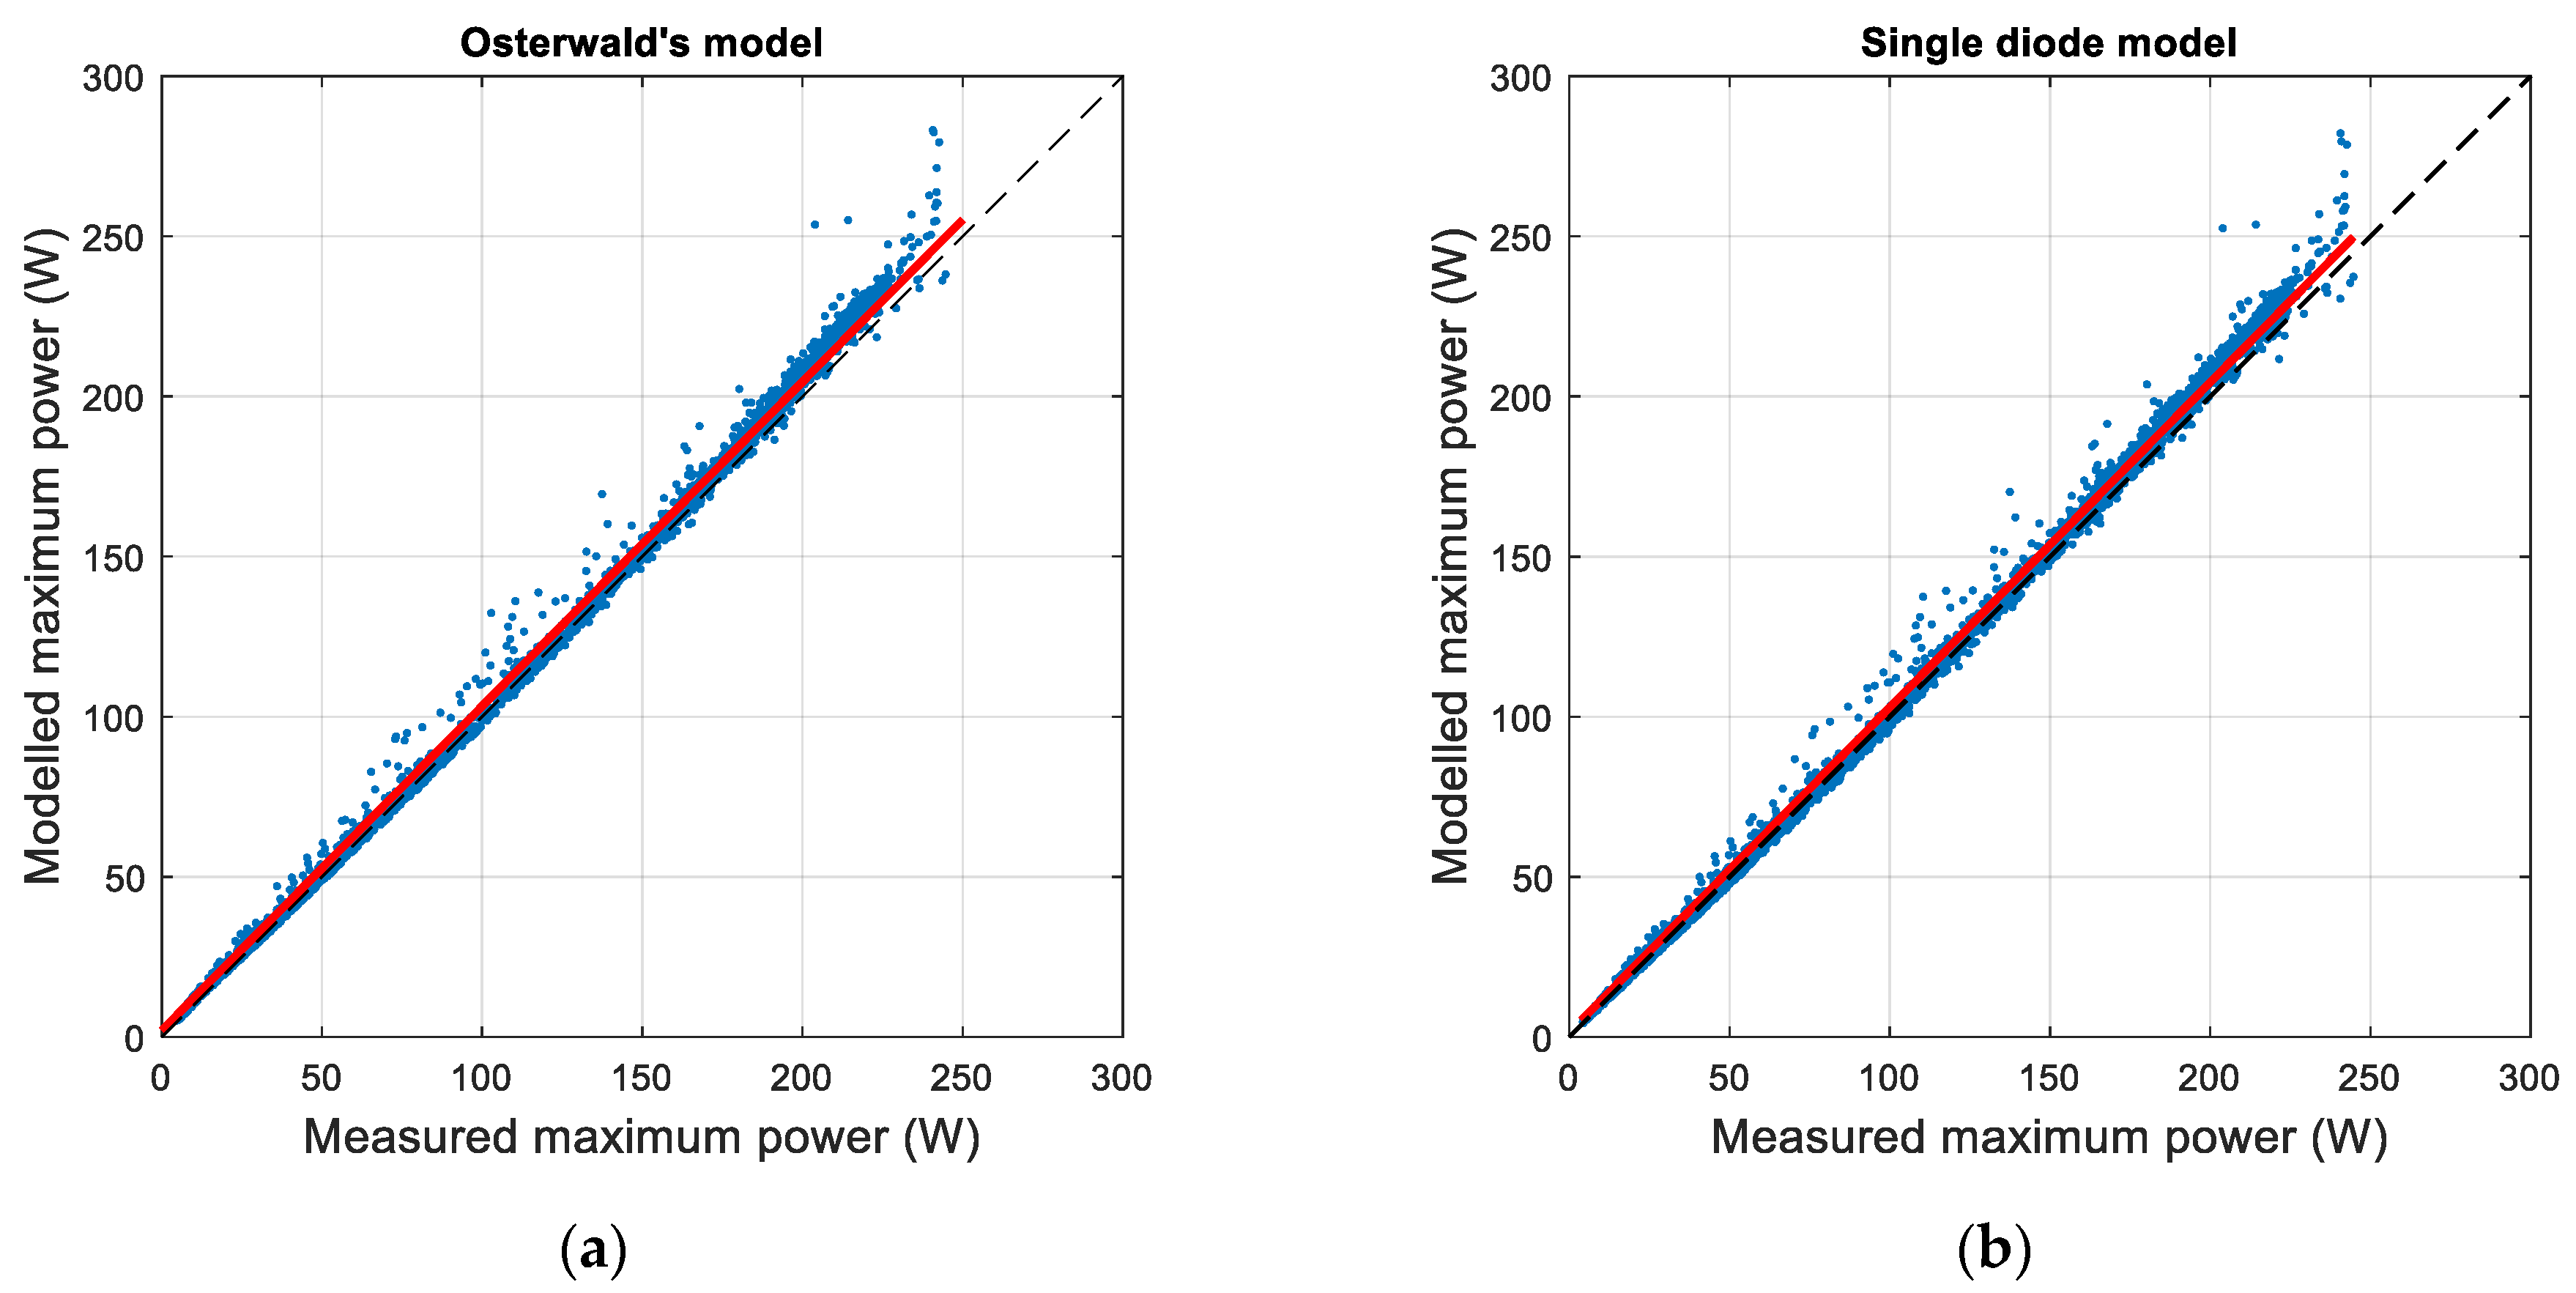
The first step to achieving the PV output power values using the single-diode model was the determination of the I-V characteristics for the whole experimental dataset of in-plane irradiance and module temperature. Figure 4a shows an example of such curves modeled for various irradiances and temperatures. As marked by the dots, the maximum power point was computed in each case of the I-V curve. The corresponding P-V curves are shown in Figure 4b. The determined values of the PV power output were compared with the experimental measurements for the same outdoor conditions. The results of the correlation of an example month (March 2022) are shown in Figure 5a in terms of the Osterwald model and in Figure 5b for the single-diode one.
Both Figure 5a and Figure 5b prove the excellent agreement of the measured PV powers with the modeled values obtained using both the single-diode and the Osterwald model. The determination coefficient (R2) related to SD and OM was found to be 0.983 in both methods and was the highest in the considered period (2022). However, for most months, the R2 factor remained high, ranging from about 0.965 to 0.976. Lower values of the determination coefficient, noticed especially in winter (about 0.62 in December and 0.86 in January), indicate that shading of the PV modules by snow cover occurred in this period. It should be noted that both modeling methods revealed very similar results, which are listed in Table 3. A similar correlation analysis achieving very good agreement between the predicted and the measured PV power output was conducted by other researchers [3,48]. A comparable high value of R2 = 0.989 was found in [49].
The results of the RMSE and the MBE shown in Table 4 confirm a very good correlation between the experimental and the modeled output power. Regarding the Osterwald model, the RMSE value in months free from snow cover ranged from 6.4% to 13%, whereas the MBE was found to be between 1.5% and 8.3%. Better results, especially in terms of MBE, were obtained using the single-diode model for the output power prediction. The RMSE was in the range of 5.0–11.5%, whereas the MBE fell into the range of −0.7% to 6.5%. The overall trend followed the observations presented in the work of [6]. The authors stated that power module models such as Osterwald’s tend to overestimate the PV system power output, resulting in positive values of MBE. In contrast, equivalent circuit-based module models, here, the single-diode method, tend to underestimate the power output, which is expressed by the negative values of MBE (compare May and June in Table 4). The RMSE and the MBE, taking into account the single-diode method of [24] reported by [6], were found to be in the ranges of about 15.1 to 18.4% and −2.1% to −0.2%, respectively (depending on the irradiance model). Various ranges of correlation metrics (RMSE, MBE) can be found in the literature. For instance, in the work of [50], a five-parameter model was tested for the case of sunny and cloudy days, showing different accuracies between the measured and the computed PV power in each case. Regarding sunny days, the MBE was found to be in the range between −0.01% and 2.16%. A similar range of MBE was obtained in this study for the spring and summer months, with the highest number of sunny days compared to the whole year (see Figure 3a). For cloudy days, the RMSE was higher than in the case of sunny days (5.9% compared to about 2.6%, respectively). This can explain the lower level of correlation presented in Table 3 during the late autumn and the winter months, when cloudy days with low insolation dominated. This can be also confirmed in light of the results obtained for the single-diode model presented in reference [2]. The authors observed that the RMSE of the I-V curve data increased from about 1.5% to 11.8%, with a decrease in irradiance from 1000 W/m2 to 200 W/m2. If we look at the RMSE presented in Table 4, a similar trend comparing the spring–summer months (lower value) with the autumn–winter ones (higher value) can be noted. Clearly, in terms of snowy months (see Figure 3b), not only did the error metrics increase enormously for the single-diode model (up to 75%) but also for the Osterwald one. This was caused in most cases by the snow cover on the PV module’s surface.
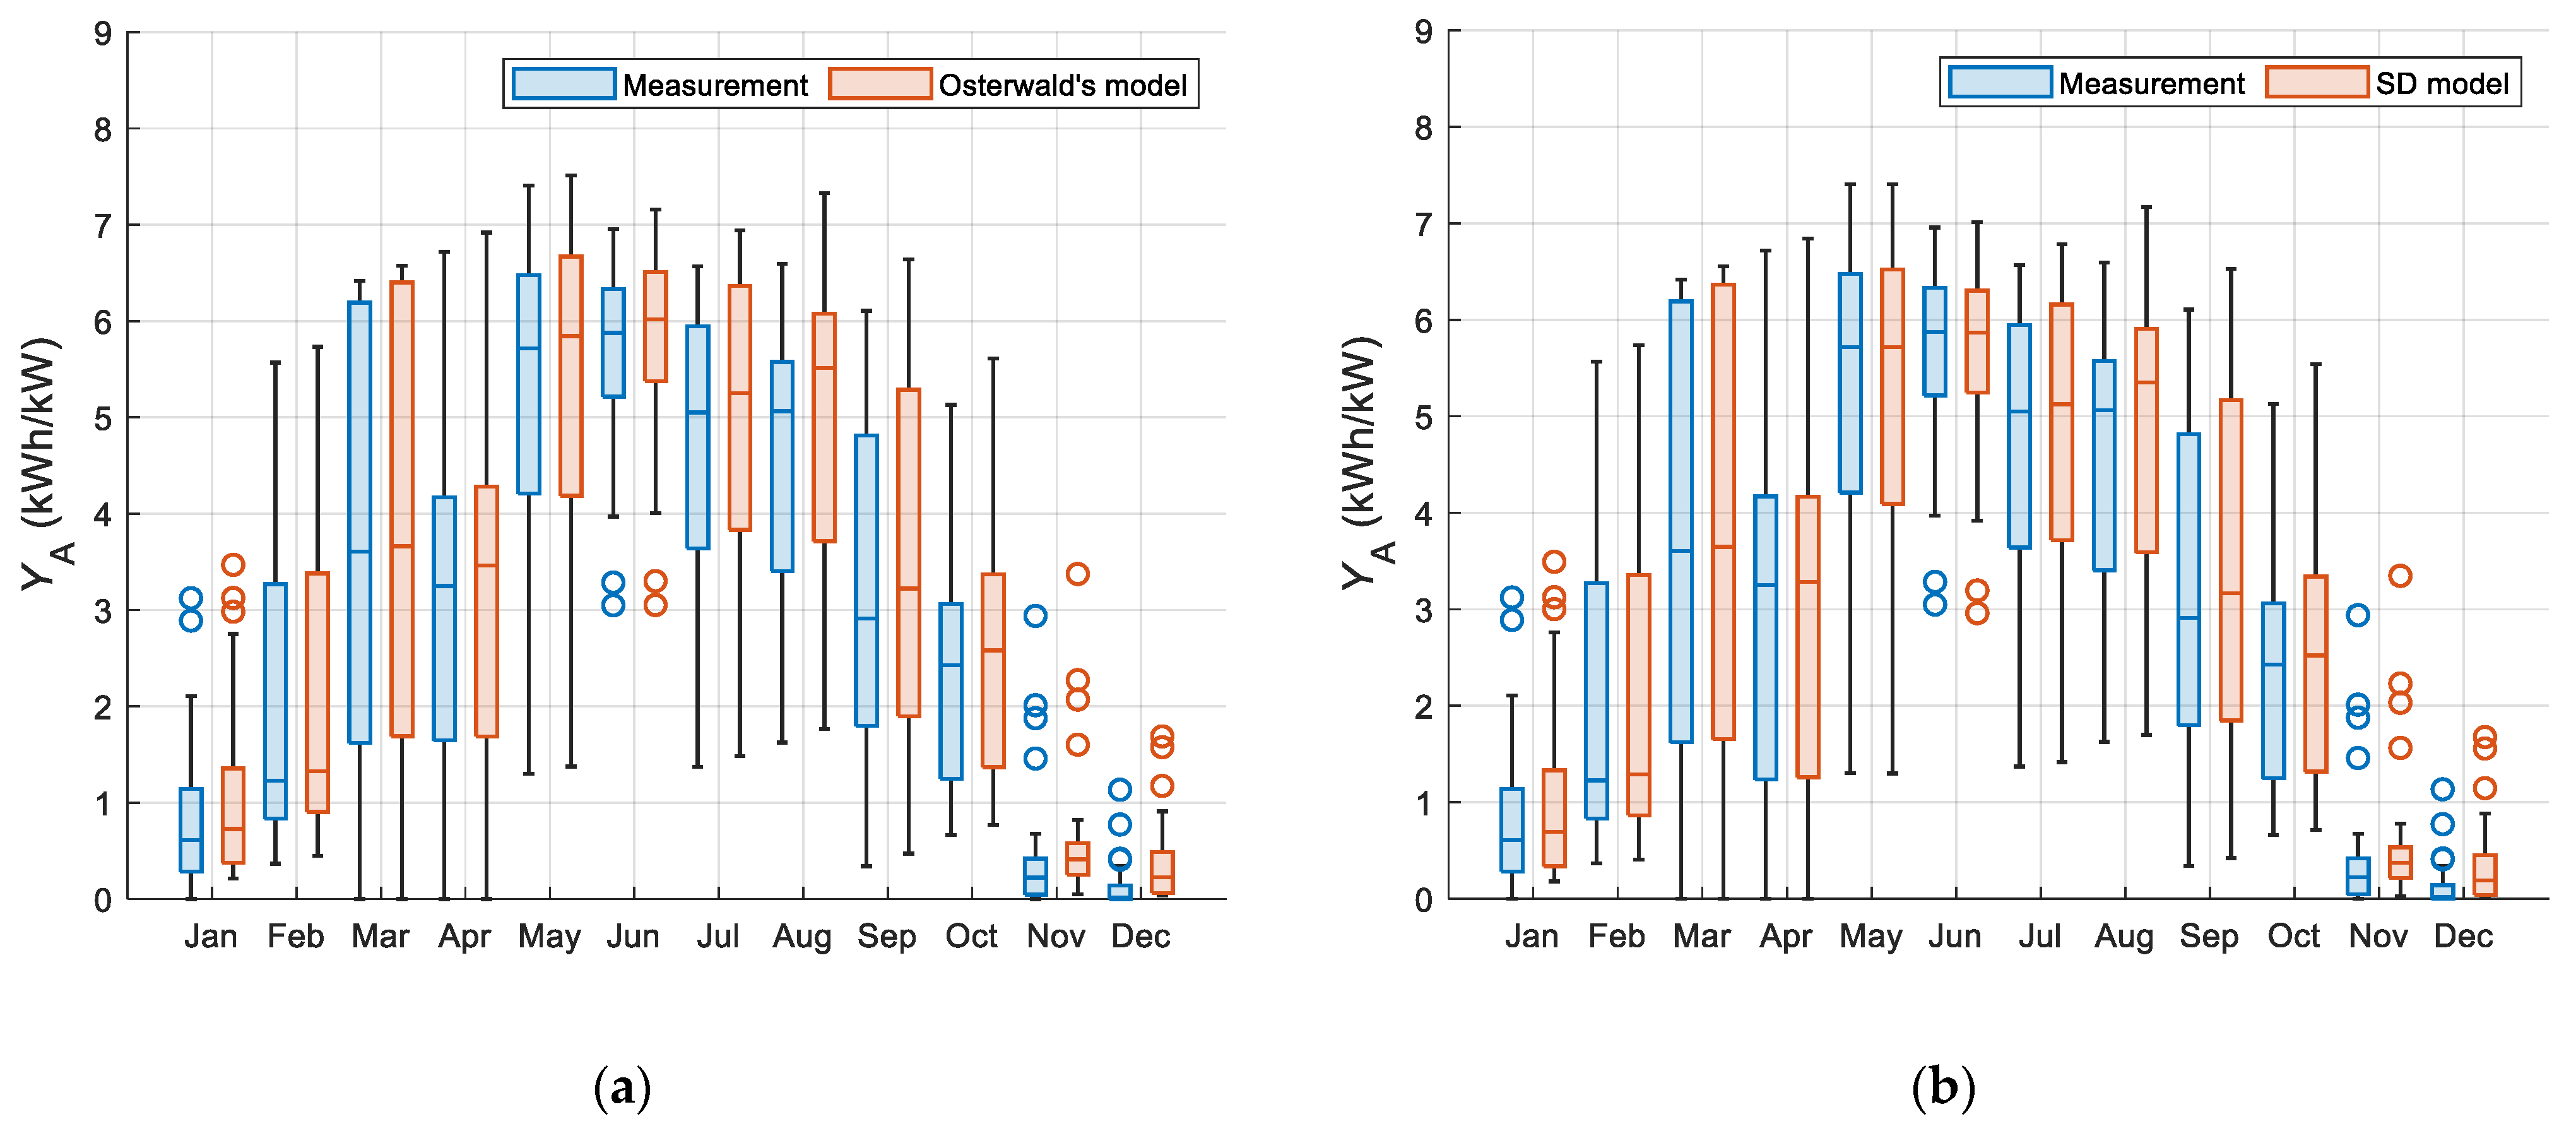
The distributions of the daily array yield of the measured data and the modeled one using the Osterwald method and the single-diode model are shown in Figure 6. Regarding the experimental data, the highest energy production was noticed in June, with a median daily yield of 5.88 kWh/kW. This was also the month with the lowest interquartile range (between 5.21 kWh/kW and 6.33 kWh/kW), which can be explained by the high number of sunny days. Indeed, June was characterized by the highest in-plane insolation for the whole year (Figure 3a). As can be seen from Figure 6b, nearly identical values of the median (5.87 kWh/kW) and the interquartile range (from 5.25 kWh/kW to 6.30 kWh/kW) were noticed for the results obtained using the single-diode model. The same observation was made for other sunny months, e.g., in May, where the difference between the measured and the modeled median of daily yield was less than 0.01 kWh/kW. In July, a difference of 0.07 kWh/kW was found. This confirms the very good match of the modeled to the experimental data for high irradiance conditions. However, for the rest of the months (excluding snowy winter ones), this value did not exceed 0.3 kWh/kW, which is also a good result.
A comparable median of 6.02 kWh/kW was obtained by applying the Osterwald method in terms of June’s weather conditions. The interquartile range was found to be between 5.38 kWh/kW and 6.51 kWh/kW. For the sunny months, the differences between the predicted and measured medians of the array yields were up to 0.2 kWh/kW. The highest registered difference did not exceed 0.46 kWh/kW.
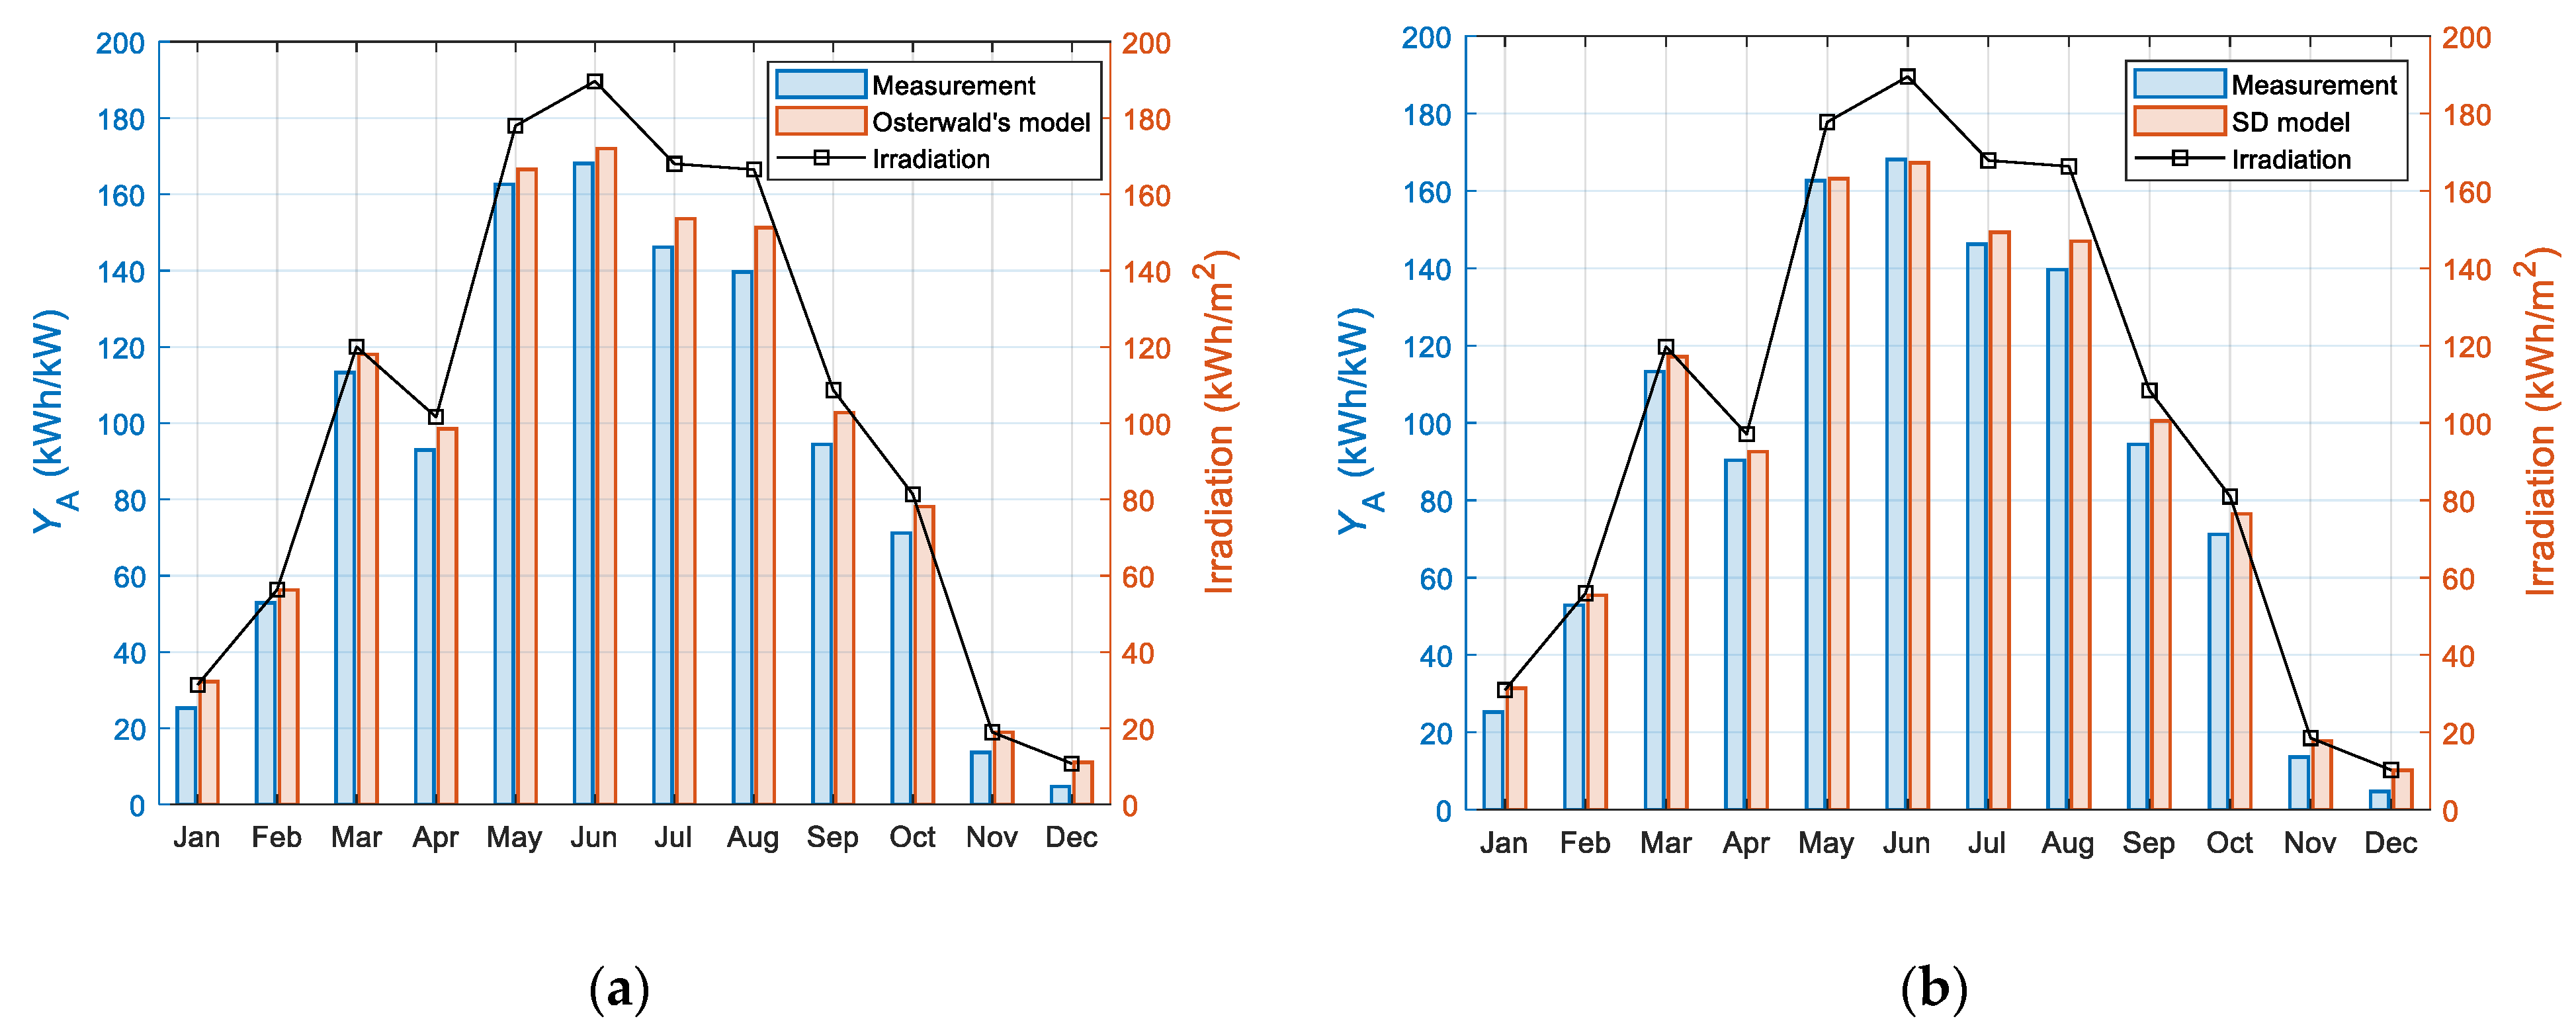
The results of the experimental and modeled monthly array yields obtained during one year of PV system operation are shown in Figure 7. A characteristic seasonal trend with low energy production in the winter half-year period and much higher relatively in the summer half-year is visible. A similar bell-shaped curve was observed in other research conducted for Poland [51,52] and other high-latitude locations [38,53,54].
The measured monthly array yield ranged from 4.7 kWh/kW in December to 168.1 kWh/kW in June, whereas the annual energy yield was 1082 kWh/kW. The yearly energy yield computed using the single-diode model was found to be 1128 kWh/kW. With the Osterwald model, the predicted energy production was higher and equaled 1159 kWh/kW. The relative error between the experimental and the modeled annual energy production was revealed to be about 4% in the case of the single-diode model and about 7% in terms of the Osterwald method. Again, the best match was confirmed for the SD model for the high-insolation period. The array yields in May and June differed by only 0.5 and 0.9 kWh/kW, respectively. In the remaining months, this value stayed below 7.5 kWh/kW. Slightly higher differences were observed with the Osterwald approach. For May and June, a value of 3.9 kWh/kW (in both months) was noticed. The maximum difference was about 11.6 kWh/kW. Relative errors of monthly array yields are listed in Table 5.
Figure 8 shows the monthly DC performance distribution of the analyzed PV system from the experimental and simulation perspectives. For both analyzed modeling methods, the shape of the distribution was noticed to be very similar to the shape obtained using the experimental data, especially in the summer months. Indeed, in May, June, and July, the experimental and modeled (single-diode) medians of the PRDC were found to be almost the same (0.92, 0.88, and 0.89, respectively). The Osterwald method revealed that the higher performance values from May to July fell in the range between 0.91 and 0.94. Significant differences between the experimental and the modeled PRDC were noticed in the winter half-year, mostly due to snow cover and the relatively high number of low-irradiation days. This is visible in Figure 8 in the higher interquartile ranges, especially in January and December.

4. Conclusions

The five-parameter single-diode (SD) method together with the Osterwald model and combined with the measured weather conditions was applied to obtain the I-V curves of the PV modules for long-term analysis of the PV system performance. The modeled results were compared to the real ones (related to power, energy production, and PV performance) to study the accuracy of both modeling methods. The comparison was quantified using the root mean square error (RMSE), mean bias error (MBE), and relative error (RE).
To conclude, both modeling methods revealed results that were in a high correlation with the experimental data regarding the analyzed metrics. During the spring–summer months, the determination coefficient (R2) of the PV power was found to be in the range between 0.93 and 0.98. In terms of RMSE, the single-diode method revealed slightly lower values than the Osterwald method, ranging from 5.0% in March to 11.5% in October. The best match regarding the MBE metric was observed for the summer months. The difference in power computed using the SD was found to be below 1%. The Osterwald method revealed a minimum value of 1.5% (in May). Both values confirmed a high forecasting precision on days with high sunshine levels. This is also visible from the results of the comparison of the experimental and modeled array (DC) yields of the PV system under study. In sunny months (from May to July), the difference in median values of daily yield was below 0.07 kWh/kW in the case of the single-diode model and 0.2 kWh/kW in terms of the Osterwald one. Low relative error values of monthly array yields were also observed in the spring–summer period (about 1% for the SD model and 2% for the OM).
It should be noted that, in the case of months with a high number of sunny days (as in the summer half-year), the results of the modeling are very promising. However, the winter period, primarily due to snow cover and the much higher number of cloudy days, requires more attention in terms of data filtering and PV module cleaning. This problem sets the course for future studies related to the modeling and analysis of PV systems in the temperate climate of Poland.

Funding

This work was financially supported through the funds granted to the Faculty of Environmental Engineering, Lublin University of Technology, Poland, grant number FD-20/IS-6/013.

Data Availability Statement

Not applicable.

Acknowledgments

The author would like to thank Piotr Dragan from Energia Dolina Zielawy for providing access to the PV system data and Anna Szewczykowska from the Institute of Meteorology and Water Management—National Research Institute for providing the irradiance data.

Conflicts of Interest

The author declares no conflict of interest.

References

  1. Humada, A.M.; Hojabri, M.; Mekhilef, S.; Hamada, H.M. Solar Cell Parameters Extraction Based on Single and Double-Diode Models: A Review. Renew. Sustain. Energy Rev. 2016, 56, 494–509. [Google Scholar] [CrossRef]
  2. Kumar, M.; Kumar, A. An Efficient Parameters Extraction Technique of Photovoltaic Models for Performance Assessment. Sol. Energy 2017, 158, 192–206. [Google Scholar] [CrossRef]
  3. Massi Pavan, A.; Mellit, A.; Lughi, V. Explicit Empirical Model for General Photovoltaic Devices: Experimental Validation at Maximum Power Point. Sol. Energy 2014, 101, 105–116. [Google Scholar] [CrossRef]
  4. Attivissimo, F.; Adamo, F.; Carullo, A.; Lanzolla, A.M.L.; Spertino, F.; Vallan, A. On the Performance of the Double-Diode Model in Estimating the Maximum Power Point for Different Photovoltaic Technologies. Measurement 2013, 46, 3549–3559. [Google Scholar] [CrossRef]
  5. Cuce, E.; Cuce, P.M.; Bali, T. An Experimental Analysis of Illumination Intensity and Temperature Dependency of Photovoltaic Cell Parameters. Appl. Energy 2013, 111, 374–382. [Google Scholar] [CrossRef]
  6. Roberts, J.J.; Mendiburu Zevallos, A.A.; Cassula, A.M. Assessment of Photovoltaic Performance Models for System Simulation. Renew. Sustain. Energy Rev. 2017, 72, 1104–1123. [Google Scholar] [CrossRef]
  7. Dolara, A.; Leva, S.; Manzolini, G. Comparison of Different Physical Models for PV Power Output Prediction. Sol. Energy 2015, 119, 83–99. [Google Scholar] [CrossRef]
  8. Bader, S.; Ma, X.; Oelmann, B. One-Diode Photovoltaic Model Parameters at Indoor Illumination Levels—A Comparison. Sol. Energy 2019, 180, 707–716. [Google Scholar] [CrossRef]
  9. Chin, V.J.; Salam, Z.; Ishaque, K. Cell Modelling and Model Parameters Estimation Techniques for Photovoltaic Simulator Application: A Review. Appl. Energy 2015, 154, 500–519. [Google Scholar] [CrossRef]
  10. Ciulla, G.; Lo Brano, V.; Di Dio, V.; Cipriani, G. A Comparison of Different One-Diode Models for the Representation of I–V Characteristic of a PV Cell. Renew. Sustain. Energy Rev. 2014, 32, 684–696. [Google Scholar] [CrossRef]
  11. Jordehi, A.R. Parameter Estimation of Solar Photovoltaic (PV) Cells: A Review. Renew. Sustain. Energy Rev. 2016, 61, 354–371. [Google Scholar] [CrossRef]
  12. Lim, L.H.I.; Ye, Z.; Ye, J.; Yang, D.; Du, H. A Linear Method to Extract Diode Model Parameters of Solar Panels from a Single I–V Curve. Renew. Energy 2015, 76, 135–142. [Google Scholar] [CrossRef]
  13. Ortiz-Conde, A.; García-Sánchez, F.J. A New Approach to the Extraction of Single Exponential Diode Model Parameters. Solid-State Electron. 2018, 144, 33–38. [Google Scholar] [CrossRef]
  14. Yıldıran, N.; Tacer, E. Identification of Photovoltaic Cell Single Diode Discrete Model Parameters Based on Datasheet Values. Sol. Energy 2016, 127, 175–183. [Google Scholar] [CrossRef]
  15. Abbassi, A.; Ben Mehrez, R.; Touaiti, B.; Abualigah, L.; Touti, E. Parameterization of Photovoltaic Solar Cell Double-Diode Model Based on Improved Arithmetic Optimization Algorithm. Optik 2022, 253, 168600. [Google Scholar] [CrossRef]
  16. Chin, V.J.; Salam, Z.; Ishaque, K. An Accurate Modelling of the Two-Diode Model of PV Module Using a Hybrid Solution Based on Differential Evolution. Energy Convers. Manag. 2016, 124, 42–50. [Google Scholar] [CrossRef]
  17. El Ainaoui, K.; Zaimi, M.; Assaid, E.M. Innovative Approaches to Extract Double-Diode Model Physical Parameters of a PV Module Serving Outdoors under Real-World Conditions. Energy Convers. Manag. 2023, 292, 117365. [Google Scholar] [CrossRef]
  18. Yahya-Khotbehsara, A.; Shahhoseini, A. A Fast Modeling of the Double-Diode Model for PV Modules Using Combined Analytical and Numerical Approach. Sol. Energy 2018, 162, 403–409. [Google Scholar] [CrossRef]
  19. Ćalasan, M.; Abdel Aleem, S.H.E.; Zobaa, A.F. A New Approach for Parameters Estimation of Double and Triple Diode Models of Photovoltaic Cells Based on Iterative Lambert W Function. Sol. Energy 2021, 218, 392–412. [Google Scholar] [CrossRef]
  20. Houssein, E.H.; Zaki, G.N.; Diab, A.A.Z.; Younis, E.M.G. An Efficient Manta Ray Foraging Optimization Algorithm for Parameter Extraction of Three-Diode Photovoltaic Model. Comput. Electr. Eng. 2021, 94, 107304. [Google Scholar] [CrossRef]
  21. Gulkowski, S.; Muñoz Diez, J.V.; Aguilera Tejero, J.; Nofuentes, G. Computational Modeling and Experimental Analysis of Heterojunction with Intrinsic Thin-Layer Photovoltaic Module under Different Environmental Conditions. Energy 2019, 172, 380–390. [Google Scholar] [CrossRef]
  22. Khezzar, R.; Zereg, M.; Khezzar, A. Modeling Improvement of the Four Parameter Model for Photovoltaic Modules. Sol. Energy 2014, 110, 452–462. [Google Scholar] [CrossRef]
  23. Bana, S.; Saini, R.P. A Mathematical Modeling Framework to Evaluate the Performance of Single Diode and Double Diode Based SPV Systems. Energy Rep. 2016, 2, 171–187. [Google Scholar] [CrossRef]
  24. De Soto, W.; Klein, S.A.; Beckman, W.A. Improvement and Validation of a Model for Photovoltaic Array Performance. Sol. Energy 2006, 80, 78–88. [Google Scholar] [CrossRef]
  25. Ma, T.; Yang, H.; Lu, L. Solar Photovoltaic System Modeling and Performance Prediction. Renew. Sustain. Energy Rev. 2014, 36, 304–315. [Google Scholar] [CrossRef]
  26. Celik, A.N.; Acikgoz, N. Modelling and Experimental Verification of the Operating Current of Mono-Crystalline Photovoltaic Modules Using Four- and Five-Parameter Models. Appl. Energy 2007, 84, 1–15. [Google Scholar] [CrossRef]
  27. Eke, R.; Demircan, H. Performance Analysis of a Multi Crystalline Si Photovoltaic Module under Mugla Climatic Conditions in Turkey. Energy Convers. Manag. 2013, 65, 580–586. [Google Scholar] [CrossRef]
  28. Senturk, A.; Eke, R. A New Method to Simulate Photovoltaic Performance of Crystalline Silicon Photovoltaic Modules Based on Datasheet Values. Renew. Energy 2017, 103, 58–69. [Google Scholar] [CrossRef]
  29. Gulkowski, S.; Zdyb, A.; Dragan, P. Experimental Efficiency Analysis of a Photovoltaic System with Different Module Technologies under Temperate Climate Conditions. Appl. Sci. 2019, 9, 141. [Google Scholar] [CrossRef]
  30. Zdyb, A.; Gulkowski, S. Performance Assessment of Four Different Photovoltaic Technologies in Poland. Energies 2020, 13, 196. [Google Scholar] [CrossRef]
  31. Dane Publiczne. Instytut Meteorologii i Gospodarki Wodnej-Państwowy Instytut Badawczy. Available online: https://danepubliczne.imgw.pl/ (accessed on 23 August 2023).
  32. Dobos, A.P. An Improved Coefficient Calculator for the California Energy Commission 6 Parameter Photovoltaic Module Model. J. Sol. Energy Eng. 2012, 134, 021011. [Google Scholar] [CrossRef]
  33. National Renewable Energy Laboratory Golden. System Advisor Model Version 2022.11.29. Available online: https://sam.nrel.gov/ (accessed on 26 July 2023).
  34. Holmgren, W.F.; Hansen, C.W.; Mikofski, M.A. Pvlib Python: A Python Package for Modeling Solar Energy Systems. J. Open Source Softw. 2018, 3, 884. [Google Scholar] [CrossRef]
  35. Osterwald, C.R. Translation of Device Performance Measurements to Reference Conditions. Sol. Cells 1986, 18, 269–279. [Google Scholar] [CrossRef]
  36. IEC 61724-1:2021; Photovoltaic System Performance—Part 1: Monitoring. International Electrotechnical Commission: London, UK, 2021. Available online: https://webstore.iec.ch/publication/65561 (accessed on 10 September 2023).
  37. Romero-Fiances, I.; Muñoz-Cerón, E.; Espinoza-Paredes, R.; Nofuentes, G.; De la Casa, J. Analysis of the Performance of Various PV Module Technologies in Peru. Energies 2019, 12, 186. [Google Scholar] [CrossRef]
  38. Adaramola, M.S.; Vågnes, E.E.T. Preliminary Assessment of a Small-Scale Rooftop PV-Grid Tied in Norwegian Climatic Conditions. Energy Convers. Manag. 2015, 90, 458–465. [Google Scholar] [CrossRef]
  39. Malvoni, M.; Kumar, N.M.; Chopra, S.S.; Hatziargyriou, N. Performance and Degradation Assessment of Large-Scale Grid-Connected Solar Photovoltaic Power Plant in Tropical Semi-Arid Environment of India. Sol. Energy 2020, 203, 101–113. [Google Scholar] [CrossRef]
  40. The MathWorks Inc. MATLAB Version: 9.13.0 (R2022b); The MathWorks Inc.: Natick, MA, USA, 2023; Available online: https://www.mathworks.com/ (accessed on 23 August 2023).
  41. Torres-Ramírez, M.; Nofuentes, G.; Silva, J.P.; Silvestre, S.; Muñoz, J.V. Study on Analytical Modelling Approaches to the Performance of Thin Film PV Modules in Sunny Inland Climates. Energy 2014, 73, 731–740. [Google Scholar] [CrossRef]
  42. Kottek, M.; Grieser, J.; Beck, C.; Rudolf, B.; Rubel, F. World Map of the Köppen-Geiger Climate Classification Updated. Meteorol. Z. 2006, 15, 259–263. [Google Scholar] [CrossRef]
  43. Gulkowski, S. Specific Yield Analysis of the Rooftop PV Systems Located in South-Eastern Poland. Energies 2022, 15, 3666. [Google Scholar] [CrossRef]
  44. Kausika, B.B.; van Sark, W.G.J.H.M. Calibration and Validation of ArcGIS Solar Radiation Tool for Photovoltaic Potential Determination in the Netherlands. Energies 2021, 14, 1865. [Google Scholar] [CrossRef]
  45. Øgaard, M.B.; Riise, H.N.; Haug, H.; Sartori, S.; Selj, J.H. Photovoltaic System Monitoring for High Latitude Locations. Sol. Energy 2020, 207, 1045–1054. [Google Scholar] [CrossRef]
  46. Olczak, P.; Żelazna, A.; Stecuła, K.; Matuszewska, D.; Lelek, Ł. Environmental and Economic Analyses of Different Size Photovoltaic Installation in Poland. Energy Sustain. Dev. 2022, 70, 160–169. [Google Scholar] [CrossRef]
  47. Santhakumari, M.; Sagar, N. A Review of the Environmental Factors Degrading the Performance of Silicon Wafer-Based Photovoltaic Modules: Failure Detection Methods and Essential Mitigation Techniques. Renew. Sustain. Energy Rev. 2019, 110, 83–100. [Google Scholar] [CrossRef]
  48. Kaplanis, S.; Kaplani, E.; Kaldellis, J.K. PV Temperature and Performance Prediction in Free-Standing, BIPV and BAPV Incorporating the Effect of Temperature and Inclination on the Heat Transfer Coefficients and the Impact of Wind, Efficiency and Ageing. Renew. Energy 2022, 181, 235–249. [Google Scholar] [CrossRef]
  49. Murat Ates, A.; Singh, H. Rooftop Solar Photovoltaic (PV) Plant—One Year Measured Performance and Simulations. J. King Saud Univ. Sci. 2021, 33, 101361. [Google Scholar] [CrossRef]
  50. Drouiche, I.; Harrouni, S.; Arab, A.H. A New Approach for Modelling the Aging PV Module upon Experimental I–V Curves by Combining Translation Method and Five-Parameters Model. Electr. Power Syst. Res. 2018, 163, 231–241. [Google Scholar] [CrossRef]
  51. Krawczak, E. A Comparative Analysis of Measured and Simulated Data of PV Rooftop Installations Located in Poland. Energies 2023, 16, 5975. [Google Scholar] [CrossRef]
  52. Sarniak, M.T. Researches of the Impact of the Nominal Power Ratio and Environmental Conditions on the Efficiency of the Photovoltaic System: A Case Study for Poland in Central Europe. Sustainability 2020, 12, 6162. [Google Scholar] [CrossRef]
  53. Ritzen, M.J.; Vroon, Z.A.E.P.; Rovers, R.; Lupíšek, A.; Geurts, C.P.W. Environmental Impact Comparison of a Ventilated and a Non-Ventilated Building-Integrated Photovoltaic Rooftop Design in the Netherlands: Electricity Output, Energy Payback Time, and Land Claim. Sol. Energy 2017, 155, 304–313. [Google Scholar] [CrossRef]
  54. te Heesen, H.; Herbort, V.; Rumpler, M. Performance of Roof-Top PV Systems in Germany from 2012 to 2018. Sol. Energy 2019, 194, 128–135. [Google Scholar] [CrossRef]
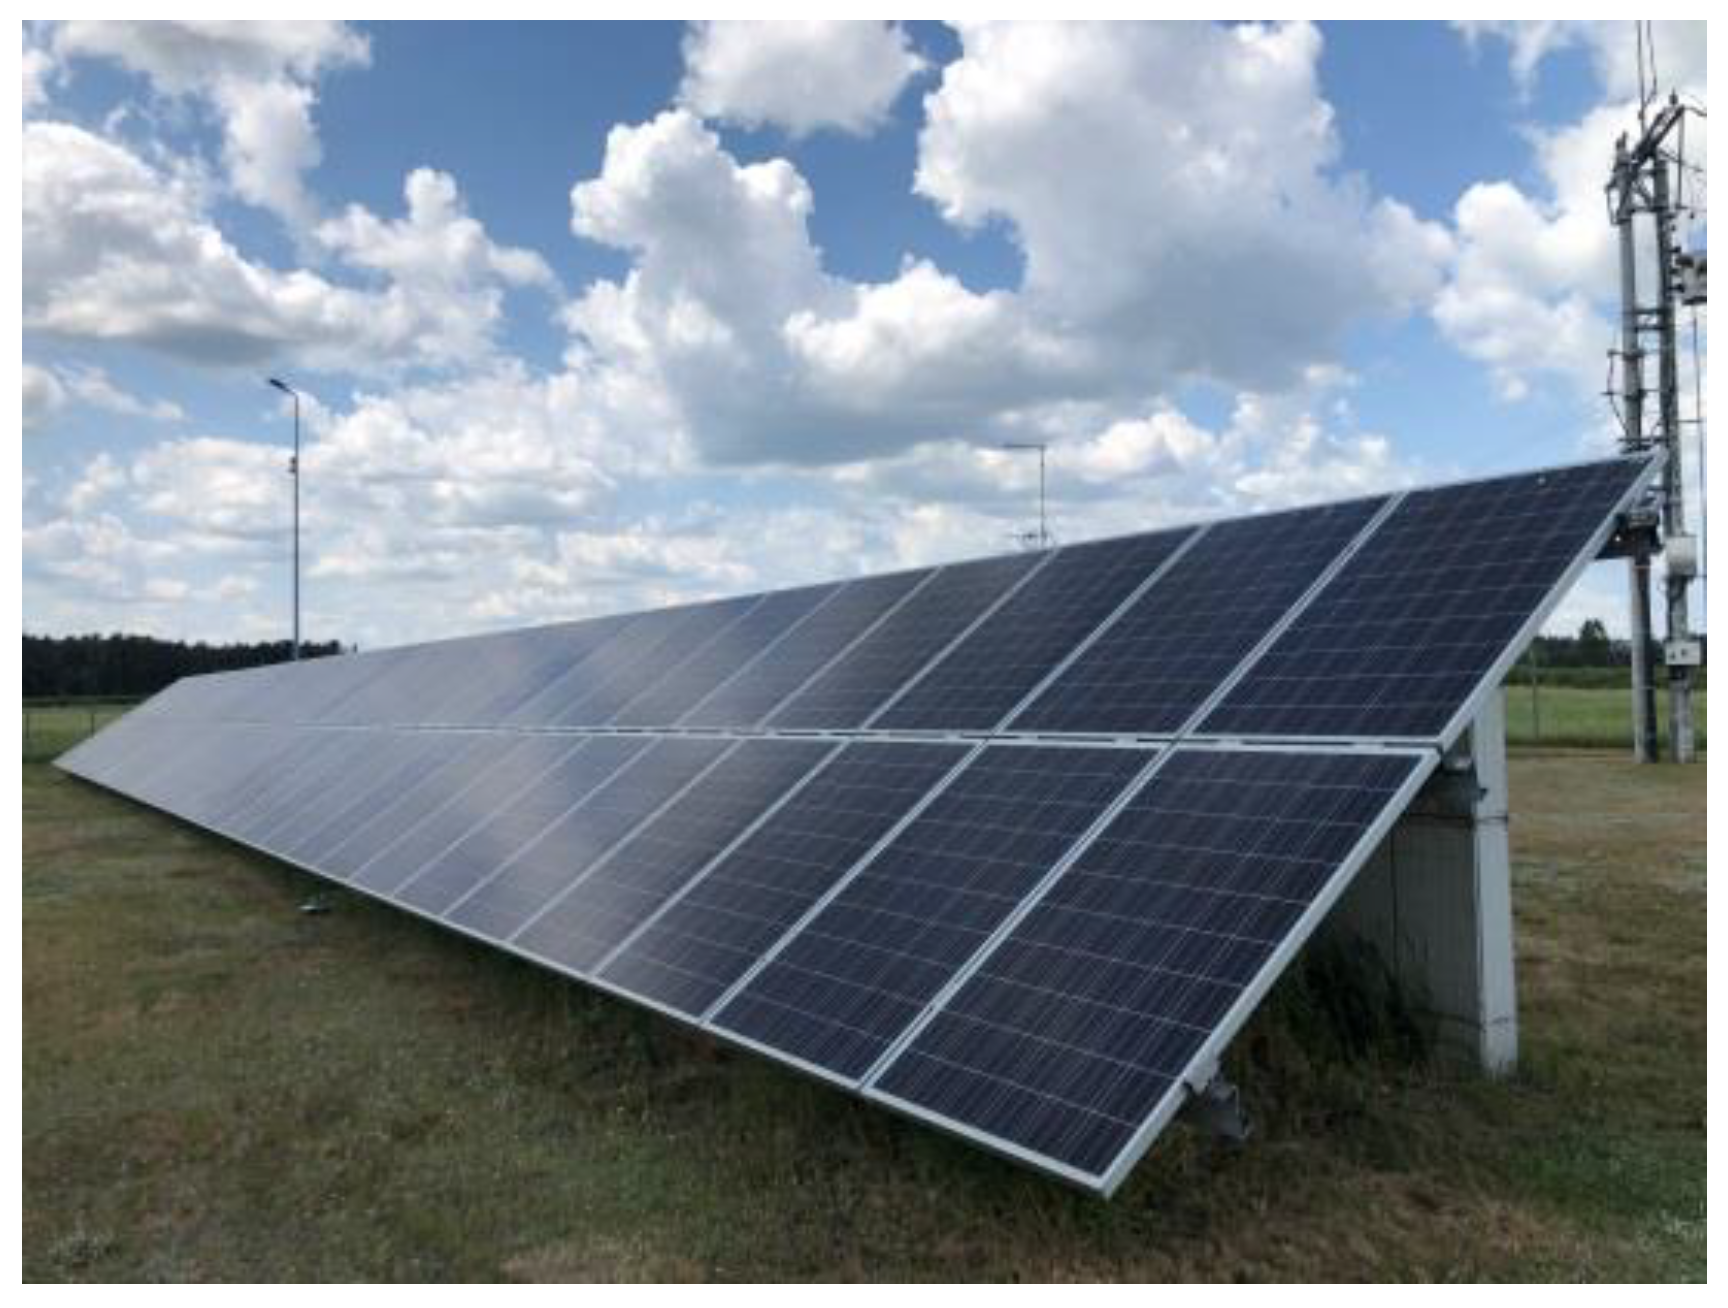
Figure 1. Experimental setup consisting of the pc-Si PV modules under scrutiny.
Energies 16 07017 g001
Figure 2. Flowchart of the PV systems’ experimental and modeling analysis.
Energies 16 07017 g002
Figure 3. Weather conditions over the studied period: (a) in-plane solar radiation, average ambient temperature, and PV module temperature; (b) snow depth and precipitation.
Energies 16 07017 g003
Figure 4. The (a) I-V curves and (b) P-V curves were computed using a single-diode model for experimentally measured irradiances and module temperatures.
Energies 16 07017 g004
Figure 5. The correlation between the measured and the computed values of the PV output power: (a) Osterwald model; (b) single-diode model.
Energies 16 07017 g005
Figure 6. Comparison of experimental and modeled daily yield distributions for the (a) Osterwald and (b) single-diode models.
Energies 16 07017 g006
Figure 7. Comparison of experimental and modeled monthly array yields for the (a) Osterwald and (b) single-diode models.
Energies 16 07017 g007
Figure 8. Comparison of experimental and modeled DC performance distributions for the (a) Osterwald and (b) single-diode models.
Energies 16 07017 g008
Table 1. Electrical parameters of the PV modules and inverters of the system under study.
Module CharacteristicsInverter Characteristics
Maximum power under STC (Wp)250 (0%/+2%)Nominal DC power (kW)21.4
Open-circuit voltage Voc (V)37.4Nominal AC power (kVA)21
Nominal voltage Vmpp (V)30.1Maximum DC Voltage (V)1000
Short-circuit current Isc (A)8.83DC operating voltage range (V)200–1000
Nominal current Impp (A)8.31MPPT DC operating voltage range (V)350–800
Efficiency (%)15.4Maximum efficiency (%)98
Temperature coefficient of Voc (%/°C)−0.30
Temperature coefficient of Voc (V/°C)−0.1122
Temperature coefficient of Isc (%/°C)0.04
Temperature coefficient of Isc (A/°C)0.0035
Temperature coefficient of power (%/°C)−0.40
Temperature coefficient of power (W/°C)1.00
Nominal operating cell temperature (NOCT) (°C)45 °C ± 2%
PV panel area (m2)1.63
PV panel weight (kg)19
Table 2. Five reference parameters of the PV module under study.
Ref. parametersIL,ref (A)I0,ref (A)arefRs,ref (Ω)Rsh,ref (Ω)
8.8330 6.893 × 10−101.60730.3180844.04
Table 3. Comparison of the determination coefficient (R2) of the experimental and the modeled power output data.
MonthOsterwald ModelSingle-Diode Model
10.8620.860
20.9740.973
30.9830.983
40.9350.934
50.9650.966
60.9660.967
70.9710.972
80.9670.968
90.9760.976
100.9710.972
110.9410.938
120.6270.623
Table 4. RMSE and MBE comparison of experimental and modeled power output data.
MonthOsterwald ModelSingle-Diode Model
RMSEMBERMSEMBE
10.3490.1590.3510.145
20.0740.0320.0680.023
30.0540.0260.0500.021
40.1350.0310.1190.015
50.0640.0150.050−0.007
60.0640.0200.048−0.010
70.0910.0430.0620.011
80.1180.0720.0820.040
90.1260.0780.1010.055
100.1300.0830.1150.065
110.2360.1270.2010.090
120.7560.3990.7480.355
Table 5. Relative errors (REs) of monthly array yields computed using the single-diode and Osterwald models.
MonthOsterwald ModelSingle-Diode Model
10.2750.244
20.0650.049
30.0420.034
40.0600.025
50.0240.003
60.023−0.005
70.0510.022
80.0830.053
90.0880.065
100.0970.075
110.3870.308
121.3621.177
Disclaimer/Publisher’s Note: The statements, opinions and data contained in all publications are solely those of the individual author(s) and contributor(s) and not of MDPI and/or the editor(s). MDPI and/or the editor(s) disclaim responsibility for any injury to people or property resulting from any ideas, methods, instructions or products referred to in the content.