Article

Simulation and Research of Methane Premixed Combustion Characteristics Based on Constant Volume Combustion Chamber with Different Ignition Modes

Beijing Key Laboratory of Powertrain for New Energy Vehicle, School of Mechanical, Electronic and Control Engineering, Beijing Jiaotong University, Beijing 100044, China
*
Author to whom correspondence should be addressed.
Energies 2023, 16(20), 7016; https://doi.org/10.3390/en16207016
Submission received: 5 September 2023 / Revised: 2 October 2023 / Accepted: 7 October 2023 / Published: 10 October 2023
(This article belongs to the Section I2: Energy and Combustion Science)

Abstract

:
Dual spark plug ignition can accelerate the burning velocity of nature gas and improve the engine performance. However, the mechanism between the two flames and the disturbance characteristics of flame to flow field during the combustion process under different ignition strategies are still unclear. In order to reduce the interference of other external factors, this paper is based on the CFD software CONVERGE 3.0, using G equations combined with SAGE detailed chemical reaction mechanism, the combustion model is constructed based on the closed constant volume combustion chamber. The accuracy of the model was verified using experimental data. The methane–air premixed combustion process under different ignition strategies (single spark ignition, dual spark synchronous ignition and dual spark asynchronous ignition) was simulated using this model. The results show that the flame propagation speeds under the dual spark ignition plan are all smaller than that of single spark ignition due to the inhibition of the opposite side flame. However, it still has obvious fast combustion characteristics, shortens the combustion duration and improves the heat release rate. The flame stability is optimum under synchronous ignition with the pressure offsetting effect, and with the increase in the ignition interval, the flame stability decreases, and the disturbance of the flow field gradually increases. There is little effect of ignition position on combustion pressure and heat release rate. Compared with single spark ignition and dual spark asynchronous ignition, dual spark synchronous ignition has better combustion characteristics. It can improve thermal efficiency while ensuring flame stability. This is a key technology for improving the natural gas engine performance.

1. Introduction

Transportation brings vitality to the world’s economic development, but it generates energy shortages and environmental problems [1]. In the context of accelerated clean and low-carbon development of global energy, the automotive industry is transforming into a green and low-carbon industry [2]. Natural gas vehicles are more widely used and more successfully promoted as clean energy vehicles [3].
Compared with traditional fuels, it has the advantages of high calorific value per unit, low exhaust pollution, abundant reserves, low price, etc., and has become the development direction of the world’s clean fuel for automobiles. However, it has problems such as slow flame propagation and low combustion rate, especially for large bore engines, which affects engine power, economy and emissions [4]. Therefore, rapid combustion and increasing combustion efficiency are important measures to improve the performance of natural gas engines [5]. Dual spark plug ignition technology provides a viable solution for the realization of rapid combustion of mixtures and has great potential for improving engine performance [6].
Some scholars have used quasidimensional thermodynamic modelling to evaluate the overall performance improvement of the engine. Ismail Altin et al. [7] used a quasidimensional thermodynamic cycle model and the results showed that for selected Stroke/Bore ratio, dual spark ignition improves the overall engine performance, engine power, indicated mean effective pressure, specific fuel consumption and thermal efficiency. It has been found that single spark plug at the central of the engine gives the best engine performance and fuel economy and at away from the central, better combustion phenomenon is obtained with dual spark plug arrangement [8]. A new approach is proposed in order to provide a quasidimensional thermodynamic model suitable for complex combustion chamber geometries [9]. The variations in total combustion duration, combustion mass fraction, cylinder pressure and temperature (exhaust and maximum combustion gases) for three spark plug configurations (diagonal, central and side), three equivalence ratios (0.8, 0.9 and 1.0) and three spark durations (−30, −25 and −20 CA @ BTDC) were further investigated [10].
Dual ignition technology has been extensively studied in rotor engines and some results have been achieved. Chen et al. [11] carried out numerical simulation studies on three-dimensional dynamics of a natural gas–diesel rotary engine. The whole air–fuel mixing process was studied. The use of auxiliary ignition technology can effectively enhance the dynamics. At the moment of auxiliary ignition, natural gas is concentrated at the rear of the combustion chamber and diesel fuel is concentrated at the front and middle of the combustion chamber. Ji et al. [12] established a three-dimensional kinetic simulation model of a direct-injection hydrogen-rich gasoline rotary engine coupled with the SAGE chemical kinetic mechanism, and investigated the effects of different positions of the dual spark plugs on the flow field distribution and combustion process. The simulation results show that when the front-mounted spark plugs are kept unchanged, it is recommended to arrange the rear-mounted spark plugs on the long axis of the cylinder wall with an appropriate offset from the short axis in engineering applications. The effects of synchronous and asynchronous ignition timing changes on engine combustion performance were further investigated based on this simulation model. The results show that regardless of synchronous or asynchronous changes in ignition timing, the in-cylinder pressure tends to increase as the ignition time is advanced. The average in-cylinder pressure corresponding to synchronous changes is slightly higher than that of asynchronous changes under the same change amplitude [13]. Using a 30° CA synchro-propelled ignition strategy, a peak pressure 16.4% higher than that of the original engine can be obtained [14].
Characteristics such as the concentration distribution of the mixture in the combustion chamber have a significant effect on the improvement of combustion performance under the dual ignition strategy. Gong et al. [6] developed a simulation model of a methanol direct injection dual spark plug synchronous ignition engine. This model is for medium compression ratio condition. The effect of dual spark plug position on combustion characteristics was investigated. The calculation results show that the combustion and heat release are most reasonable at A (ratio of dual-spark-plug distance to cylinder bore) of about 0.65 compared to other dual-spark-plug positions. A = 1.00 is the worst dual spark plug arrangement. The methanol injection moment, ignition moment and overall equivalence ratio have important effects on the methanol-air mixture concentration distribution, flow rate and flame surface density [15]. Synchronized ignition of twin spark plugs is an effective means of improving combustion stability and increasing the lean combustion limit of spark ignition engines [16].
Yan et al. [17] investigated the effects of ignition position and ignition moment on the combustion process of a direct-injection dual-cylinder FPG (power of free piston generator) using a combination of experimental and simulation methods based on a dual-spark ignition strategy. The results show that the combustion process of direct-injection FPG is more sensitive to the change in ignition moment than the change in ignition angle position. As the moment of ignition was delayed, the indicated thermal efficiency kept increasing at a rate of 25.1%, but the homogeneity of the in-cylinder mixture and the concentration of the mixture around the spark plug gradually decreased. Dual spark ignition resulted in a 30% increase in cylinder pressure and a 2% increase in indicated thermal efficiency, compared to single-spark ignition.
The development process and the interaction mechanism of the dual flames in the engine combustion chamber are very complex. R. Lauvergne et al. [18] used the ECFM premixed combustion model to construct a 3D simulation of a small two-valve petrol engine. It was found that the improvement in combustion performance was more pronounced with dual ignition at higher EGR concentrations and earlier corresponding spark times. This is because the development of the second flame corrects the weakness of the slow flame propagation from the single spark plug, keeping the overall combustion rate at an acceptable level. Hwang et al. [19] simulated the dual flame development process in the combustion chamber of a rotary engine and found that a more stable flame propagation process can be obtained by varying the ignition time using dual spark plug ignition. Deng et al. [20] conducted a simulation study on the flame and turbulence mechanism under lean combustion conditions in a single-cylinder engine. It was found that the maximum temperature in the cylinder is higher and decreases faster in the synchronized dual spark mode due to the special form of flame–turbulence interaction. In the early stages of flame propagation initiated by the dual spark plug structure, it is diverted by the airflow. Two separate flame fronts collide with each other, creating more independent combustion regions in the central of the combustion chamber [21]. Deng B investigated the emission characteristics of CO and NOX under dual ignition strategy at different concentrations of fuel [22].
Forte et al. found that the dual spark ignition system can effectively reduce cyclic variations and enhance combustion stability [23]. Further studies found that combustion stability is closely related to the formation of the first ignition nucleus [24]. Chen et al. [25] simulated the spontaneous combustion and detonation characteristics of the engine under different ignition time intervals and positions. It was found that the compression and heating effects of the two ignition flames were the main reasons for the spontaneous ignition of the end gases. Zou et al. [26] carried out a simulation study in a small petrol rotor engine and found that delaying the second spark ignition moment reduces the intensity of knock and delays the self-ignition moment.
At present, many scholars have carried out a large number of numerical simulation studies based on different types of dual-spark-plug ignition engines. The engine combustion chamber is coupled with multiple physical fields, and the combustion environment is complex. The different shapes of the combustion chamber structure, the intake and exhaust moments, the fuel injection mode and the ignition moment all have an impact on the premixed gas and combustion process. It is difficult to obtain a universal influence rule.
The constant volume combustion chamber (CVCC) is a kind of combustion device that simulates the engine combustion chamber structure, which can reduce the influence of external factors. Seang-Wock Lee et al. [27] designed a constant volume combustion chamber with single and dual spark plug configurations to obtain the basic combustion characteristics of HCNG and to evaluate the possible advantages of the dual spark plug ignition configuration over the single spark plug ignition configuration. Li et al. [28] carried out experimental studies with different ignition strategies in a constant volume bomb, and found that the combustion rate under the synchronized dual ignition strategy was fast and the flame stability. Lim et al. [29] presented a phenomenological model of flame kernel development that focuses on the initiation of propane–air mixtures in a constant volume bomb. The initial rapid volume growth is adequately modelled, and the subsequent growth is mainly dominated by diffusion.
In summary, under certain conditions, double spark ignition technology can effectively improve the combustion process and enhance engine performance. The current research work is mostly focused on exploring the influence of parameters such as spark plug position and ignition moment on engine performance. On the one hand, engine models are different, combustion chamber structure, inlet and exhaust valve moment and other parameters have a non-negligible impact on the combustion process. The results of the study are not very adaptable. On the other hand, there are few articles on the visible study of flame. Flame stability under dual spark ignition technology plays a crucial role in the improvement of engine performance.
In this paper, a simulation model of gas premixed fuel combustion under dual ignition is constructed based on a closed spherical-like constant volume combustion chamber using CFD software CONVERGE 3.0. The combustion process and flow characteristics based on the closed constant volume combustion chamber are simulated and analyzed using the G-equation combined with the detailed chemical reaction mechanism of SAGE. The interaction mechanism between the two flame fronts and the turbulent properties of the flame on the flow field during the combustion process are investigated. In order to study the stability of the flame propagation process, the evolution of the flame fronts under different ignition strategies (single-point ignition, two-point synchronous ignition, two-point asynchronous ignition) is studied. Based on the pressure signal and heat release rate, the rapid combustion characteristics under dual ignition mode were investigated. Moreover, the microscopic problem of the flow field of a constant volume combustion bomb is investigated, and the velocity distribution of the flow field is analyzed in order to study the turbulent properties of the flame on the flow field. Later on, based on this model, the mechanism of other initial conditions (different fuels, equivalence ratios, ambient pressures, ambient temperatures, etc.) on the flame propagation process under different ignition strategies can be analyzed. The simulation calculation can supplement the shortage of testing means of experiment, and it is valuable for the improvement of premixed combustion theory of gaseous fuel double-spark ignition.

2. The Numerical Simulation Model

2.1. Geometric Model

This paper is based on a closed constant volume combustion chamber. The shape of chamber is similar to a sphere, with an inner cavity radius of 100 mm and a total volume of 6.38 L [30]. The front and rear sides of the combustion chamber are cylindrical cavities with a radius of 50 mm, and quartz glass with high parallelism and high transmittance is installed as the light channel of the schlieren system [31]. Cylindrical cavities of the same radius are also opened in the other four directions, and the three-dimensional model is shown in Figure 1a.
The constant volume combustion chamber has symmetrical structure and symmetrical internal flow field. The selection of calculation model should meet the applicable conditions of single point ignition and double point ignition, and save computing resources. Therefore, the 1/4 constant volume combustion chamber model is adopted in this paper, as shown in Figure 1b.

2.2. Numerical Set Up

2.2.1. Mathematical Model

(1)
Turbulence model
The simulation of turbulence in this study uses an RNG k ε model based on the Reynolds averaging method. Although advanced turbulence simulation methods, such as large eddy simulation, can be used to more accurately calculate the flow processes in the combustion chamber, the RNG k ε model is faster and has been widely proven to capture the flow characteristics [14].
The RNG k ε model is obtained by modifying the standard k ε model using the reformulated group theory [32]. The modified viscosity term takes into account the effect of smaller-scale vortices [33]. An additional term R ε is introduced into the ε equation to account for the relationship between the time-averaged strain rate and the dissipation rate during the flow. This approach is more accurate in calculating low Reynolds number flows and near-wall flows compared to the standard k ε model. Equation k and equation ε are as follows [34]:
𝜕 𝜕 t ρ k + 𝜕 𝜕 x i ρ k u i = 𝜕 𝜕 x j μ e σ k 𝜕 k 𝜕 x j + G k + G b ρ ε Y M + S k
𝜕 𝜕 t ρ ε + 𝜕 𝜕 x i ρ ε u i = 𝜕 𝜕 x j μ e σ ε 𝜕 k 𝜕 x j + C 1 ε k G k + C 1 C 3 ε k G b C 2 ρ ε 2 k R ε + S ε
where:
μ e = ρ C μ k 2 ε
R ε = C μ ρ η 3 1 η / η 0 1 + β η 3 ε 2 k
η = S k ε
where, k is the turbulent kinetic energy, ε is the dissipation rate, μ e is turbulent viscosity, G k and G b are turbulent kinetic energy caused by mean velocity gradient and buoyancy, respectively, Y M is the influence of pulsating expansion in compressible turbulence, C 1 , C 2 and C 3 are empirical constants, σ k and σ ε are the Prandtl number corresponding to turbulent kinetic energy and turbulent energy dissipation rate, respectively, S k and S ε are source items by user defined, η 0 = 4.38, β = 0.012 [13]. The O’Rourke and Amsden wall heat transfer model [35] is selected for this paper, with the von Karman constant of 0.42 [36].
(2)
Combustion model
The spark plug ignition process consists of discharge, plasma breakdown and surge propagation. All phenomena occur within a short period of time and over a relatively small area. Spark ignition can be simply simulated by adding energy to the ignition unit for the duration of the spark [37]. The spherical source item is available for simulating spark plug ignition. The ignition source is set in the central between the positive and negative electrodes, and the radius of the ignition source is referenced to the radius of the electrode head circle. The spherical source term is assigned with ignition energy, and the start and end moments of ignition energy release are set.
In this study, the combustion model is constructed by the method of G-equation coupled with SAGE detailed chemical reaction mechanism. The G-equation model tracks the location of the flame front by solving the transport equation for the non-reacting scalar G, which decouples the flame-face region from the chemically reactive region [38]. G = 0 is the location of the flame front itself and divides the flow field into two regions: G < 0 characterizes the unburned region and G > 0 characterizes the burned region [39]. Flame propagation is driven by the flow velocity v f of the unburned mixture at the flame front and the laminar flame velocity S L vertical to the flame front [37]. The flame propagation velocity is:
d x f d t = v f + n S L
The normal vector n is defined as:
n = G G
Then the transport equation for the G-equation model is:
𝜕 G 𝜕 t + v f G = S L G
Later Peters extended this approach to turbulence environments by tracing the turbulent flame by solving for the mean G ˜ and variance G 2 ˜ of G [40].
ρ ¯ 𝜕 G ˜ 𝜕 t + ρ ¯ v f ˜ G ˜ = ρ u ¯ S T 0 G ˜ ρ ¯ D T κ ˜ G ˜
ρ ¯ 𝜕 G 2 ˜ 𝜕 t + ρ ¯ v f ˜ · G 2 ˜ = | | ( ρ u ¯ D T | | G 2 ˜ ) + 2 ρ ¯ D T ( G ˜ ) 2 c s ρ ¯ ε ˜ k ˜ G 2 ˜
where, v f ˜ —fluid velocity;
ρ u ¯ —unburnt Gas density;
ρ ¯ —gas density at the average position of the turbulent flame;
D T —Turbulent diffusion coefficient;
| | —Tangential gradient operator;
k ˜ , ε ˜ —turbulent kinetic energy and its dissipation rate;
κ ˜ —mean curvature of the flame front surface. κ ˜ = ( G ˜ G ˜ )
S T 0 is the turbulent flame speed [40]:
S T 0 S L 0 = 1 a 4 b 3 2 2 b 1 l l F + a 4 b 3 2 2 b 1 l l F 2 + a 4 b 3 2 u l S L 0 l F 1 / 2
where S L 0 is the reference laminar flame velocity; u = 2 k ˜ / 3 is the turbulence intensity. l and l F are the turbulence integral length scale and laminar flame thickness, respectively.
Methane (CH4), which is a simple small molecule fuel, can be simulated in the most realistic methane combustion process using the SAGE detailed chemical reaction solution model, and the results obtained are more accurate.
The SAGE model allows the simulation of chemical reactions in the combustion process through the input of CHEMKIN format files [41]. It does not require empirical modelling of different combustion states. In addition, Multi-Zone acceleration algorithm is introduced to improve the calculation speed of detailed chemical reactions by tens of times while ensuring the calculation accuracy. The chemical reaction mechanism chosen for this study is GRI 3.0 which contains 53 components and 325 groups of primitive reactions [42]. The multi-step chemical reaction can be written in the following form [43]:
m = 1 M v m , i χ m m = 1 M v m , i χ m   for   i = 1 , 2 , I
where, v m , i , v m , i —stoichiometric coefficients of reactants and products;
I —Total number of reactions;
χ m —chemical formula of component m .
The net production rate of component m is:
ω ˙ m = i = 1 I v m , i q i   for   m = 1 , 2 , M
v m , i = v m , i v m , i
The reaction parameter q i is:
q i = k i , f m = 1 M X m v m , i k i , r m = 1 M X m v m , i
where, X m —the molar concentration of component m ;
k i , f , k i , r —positive and negative reaction rate coefficients for reaction i.
The mass and energy governing equations followed by the SAGE detailed chemical reaction solution model are [43]:
d [ X m ] d t = ω ˙ m
d T d t = V d P d t m h ¯ m ω ˙ m m X m c ¯ p , m
where, h ¯ m —the molar specific enthalpy of the component m ;
c ¯ p , m —the molar specific heat capacity at constant pressure of the component m .
(3)
Calculation grid
In this study, Adaptive Mesh Refinement (AMR) and Fixed Embedding mesh control techniques are used to arrange the mesh in the desired time and space, so as to obtain higher computational accuracy with minimum computational load.
The grid size after refinement is:
d x = d x _ b a s e 2 s c a l e
The scale is the number of refinement levels, and this parameter must be an integer. When different encryption methods are set at the same location, the smallest refinement size takes precedence, and the sizes are not overlapped.
The d x _ b a s e is the basic size of the grid, which can be set to the hexahedral grid size in the x, y and z directions, respectively. Due to the large size of the combustion bomb, in this study, d x _ b a s e , d y _ b a s e and d z _ b a s e are set to 10 mm to reduce the computational load, and a fully orthogonal ortho-hexahedral grid is obtained.
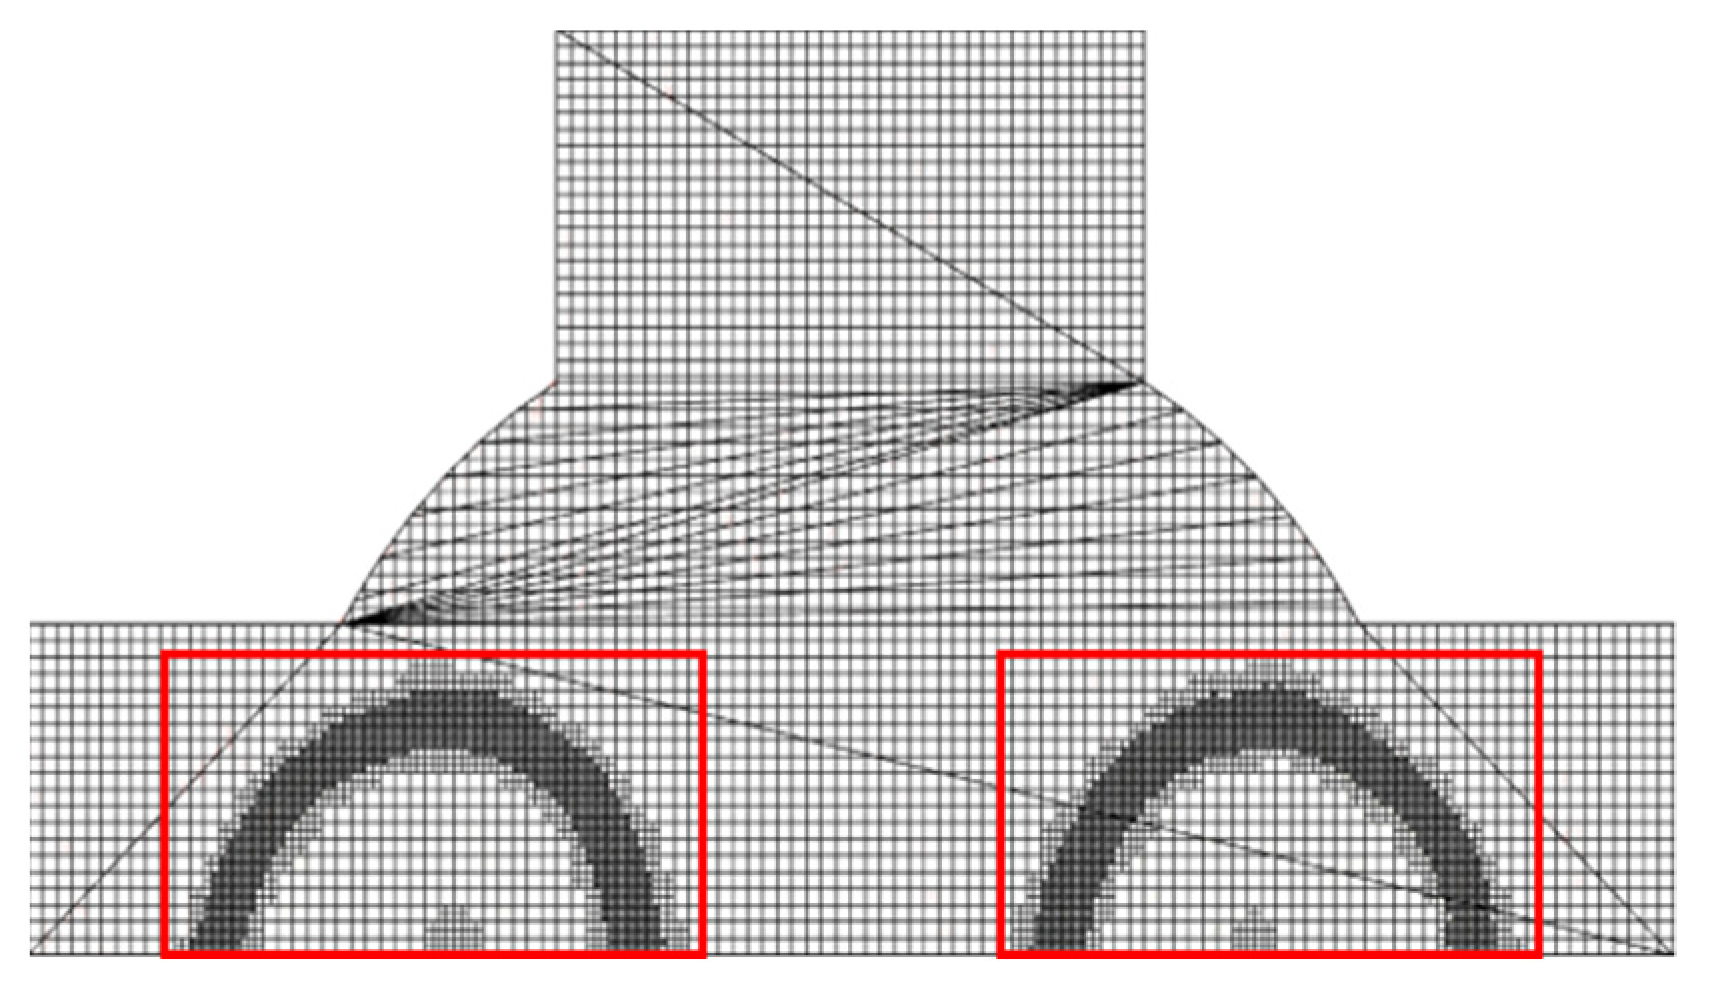
The Adaptive Mesh Refinement technique can automatically refine the mesh according to the gradient of flow field parameters such as velocity, temperature, concentration and particle density. In this study, the refinement levels were set to 3 and 4 based on the velocity gradient and temperature gradient, respectively. Figure 2 shows the grid distribution near the flame front during combustion with a minimum grid size of 0.625 mm. During the calculation, the software automatically generates a real-time dynamic, high-quality hexahedral mesh based on the specified boundary type and mesh parameter settings. The mesh density changes during the computation, but the model topology does not change.
Fixed Embedding mesh control technique is to perform fixed refinement for specified time and specified spatial region. In this study, the ignition source item is set as a sphere, and the ignition duration is set as 0.5 ms. Therefore, two spherical fixed refinement are set as the central of the ignition source item, as shown in Figure 3a, to ensure the stable formation of the fire nucleus to ensure the normal combustion. The refinement radius of the small sphere is 3.5 mm, and the refinement scale is 5; the refinement radius of the large sphere is 4 mm, and the refinement scale is 3. The grid distribution in the vicinity of the ignition source term is shown in Figure 3b, and the minimum grid size of the process is 0.039 mm. The fixed refinement time is defined as the duration of the ignition.
(4)
Parameter definition
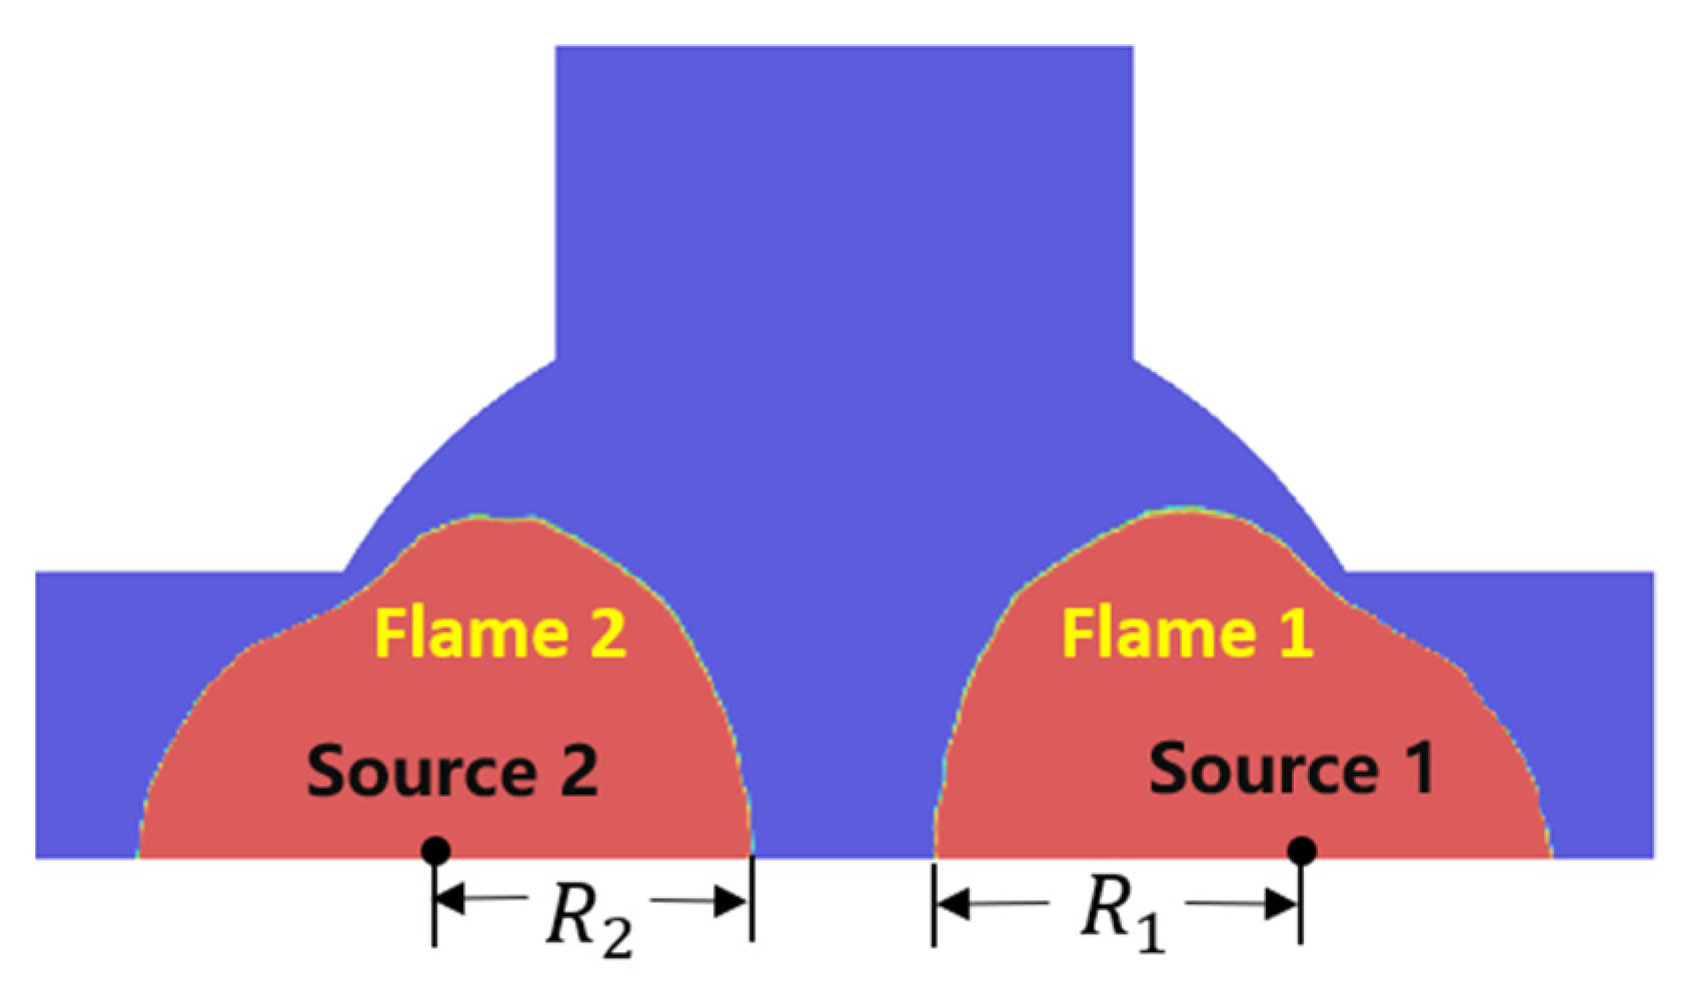
As shown in Figure 4, Source 1 and source 2 ignite the gas mixture and generate two near spherical flames, flame 1 and flame 2, respectively. The distance from the ignition source to the flame front surface is defined as the flame radius, denoted as R1 and R2, respectively.
The stretch flame propagation speed S n can be obtained from Equation (1):
S n = d R d t
Flame stretch rate α is defined as the rate of change with time of the logarithm of an infinitesimal area A on the flame surface. For a spherical flame, A = π R 2 , thus the flame stretch rate is:
α = d ln A d t = 1 A d A d t = 2 R d R d t = 2 R S n
There is a relationship between the stretch flame propagation speed and the flame stretch rate.
S l S n = L b α
where S l is the unstretched flame propagation speed; L b is the Markstein length.
The negative of the slope of the curve fitting Sn and α is the Markstein length. Markstein length Lb can be used to reflect the flame stability. When the slope of Sn- α is negative, Lb is positive, and the stretched flame propagation speed decreases with the increase in the stretched flame, and the flame tends to be stability. On the contrary, if the slope of Sn- α is positive and Lb is negative, the stretched flame propagation speed increases with the increase in the stretched flame, and the instability of the flame increases [28].
The expression of the surface center value of heat release rate curve is as follows:
t c = d Q d t t d t d Q d t d t
where d Q d t is instantaneous heat release rate, t is the time. The smaller the surface center value t c is the greater the thermal efficiency is.

2.2.2. Boundary Conditions and Initial Conditions

The basic grid size is 10.0 mm. Two fixed embedding ratios are used in the combustion chamber. Two layers of localized embedding are located near the ignition source to capture the formation and development of the initial spark kernel. To capture the combustion and flow features in the combustion chamber the grid is 0.625 mm.
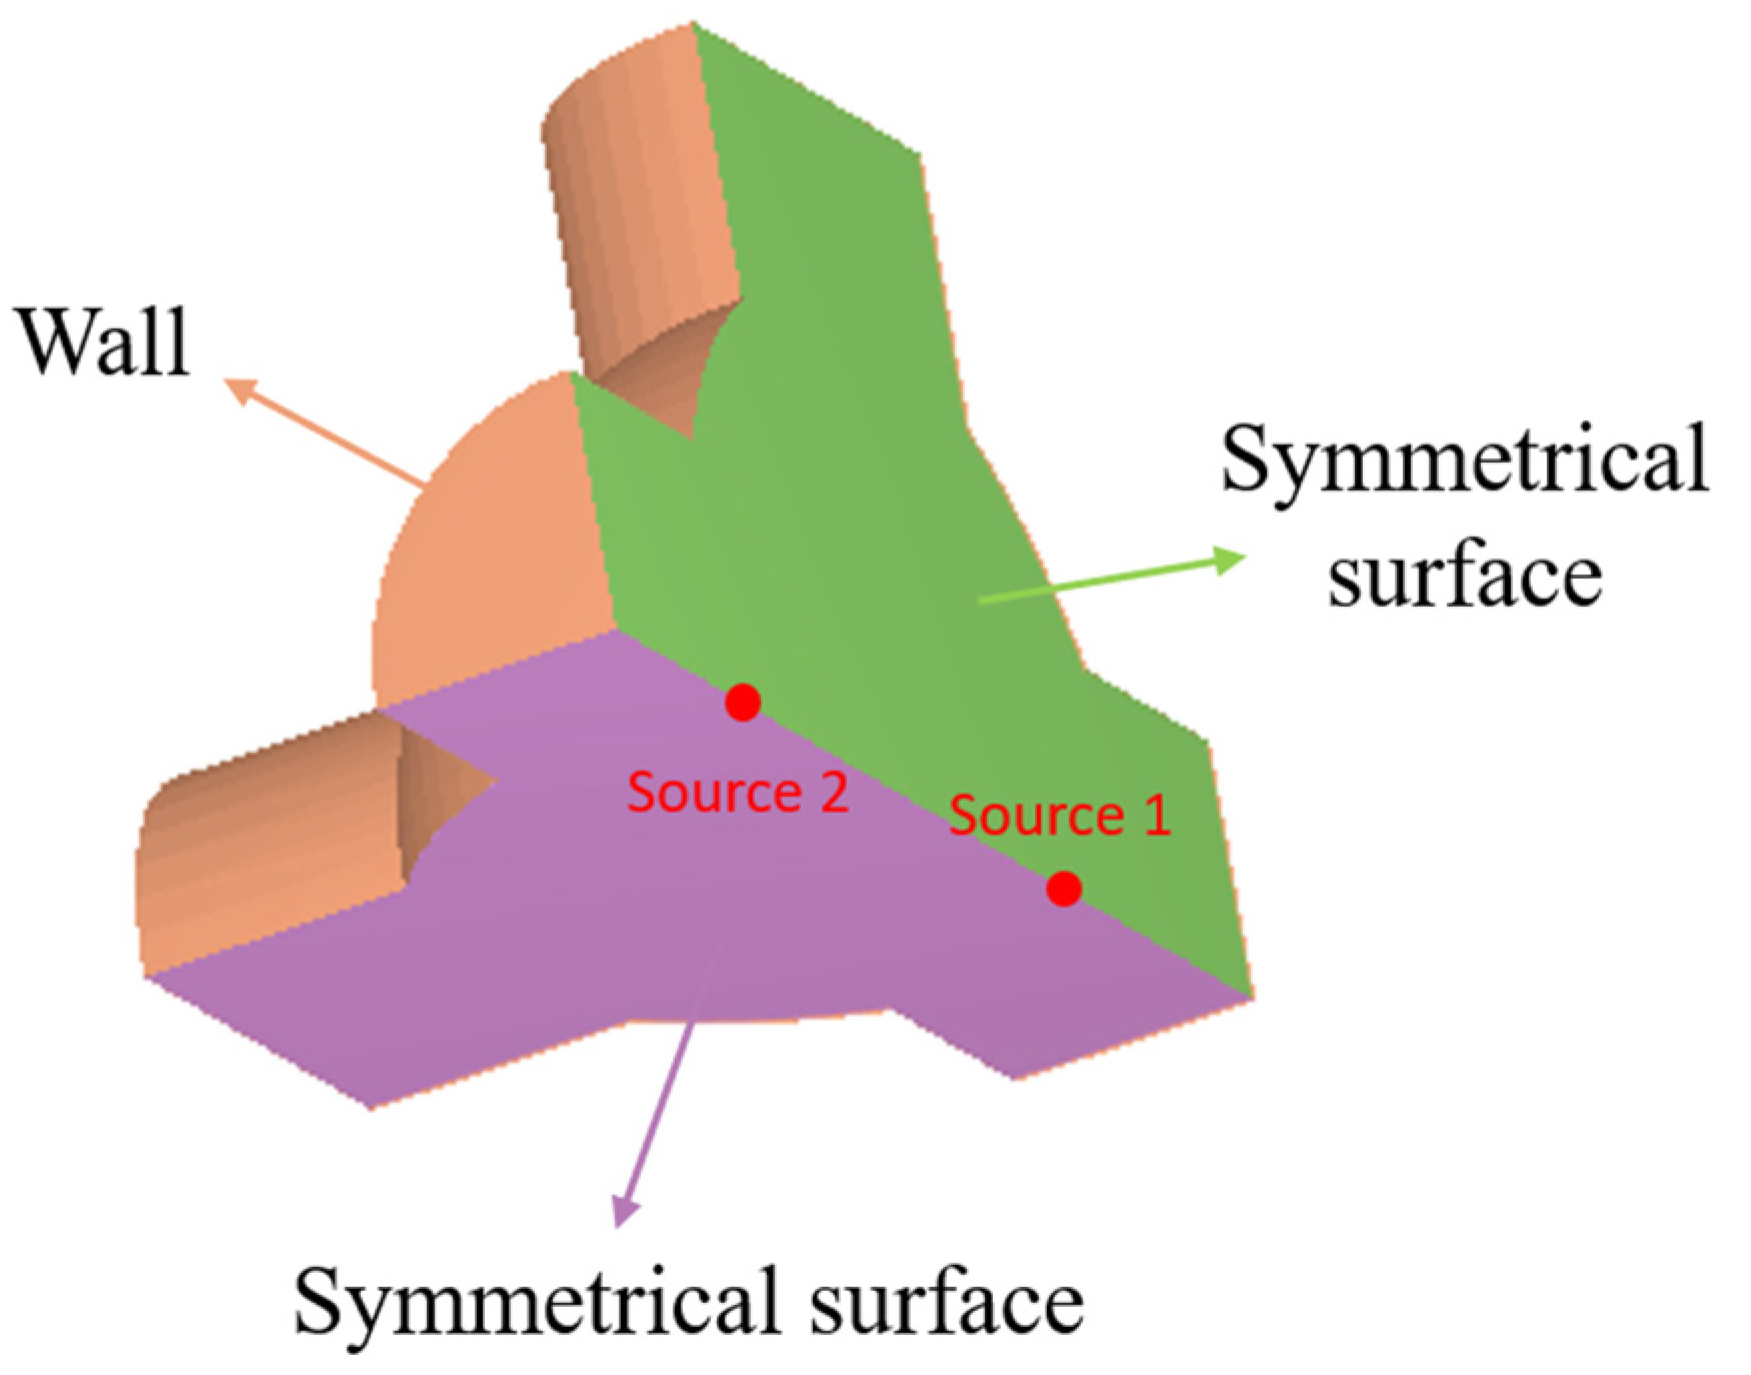
The fuel and air are evenly mixed in the constant volume combustion chamber before ignition, and the boundary has no gas exchange with the outside world and remains static. Therefore, the outer surface of the 1/4 constant volume combustion chamber model is set as the “WALL”, as shown in Figure 5. The outer surface velocity boundary conditions and temperature boundary conditions follow the “law of wall”. The model has two planes of symmetry, whose boundary type is “SYMMETRY”.
The initial temperature and initial pressure inside the constant volume combustion chamber are set to 300 K and 0.1 Mpa. In this study, the ignition energy of 200 mJ is used to simulate the actual ignition process of spark plug. The origin of coordinates is set at the center of the combustion chamber, and the ignition source is set at the intersection line of two symmetric surfaces, which are 150 mm apart. Single point ignition (SPI) only triggers source 1. Dual point ignition (DPI-x, where x is the ignition interval) triggers ignition source 1 first, and triggers ignition source 2 after x milliseconds, as shown in Figure 5. Define the ignition start time to be zero.

2.3. Test and Model Verification

2.3.1. Experiment Setup

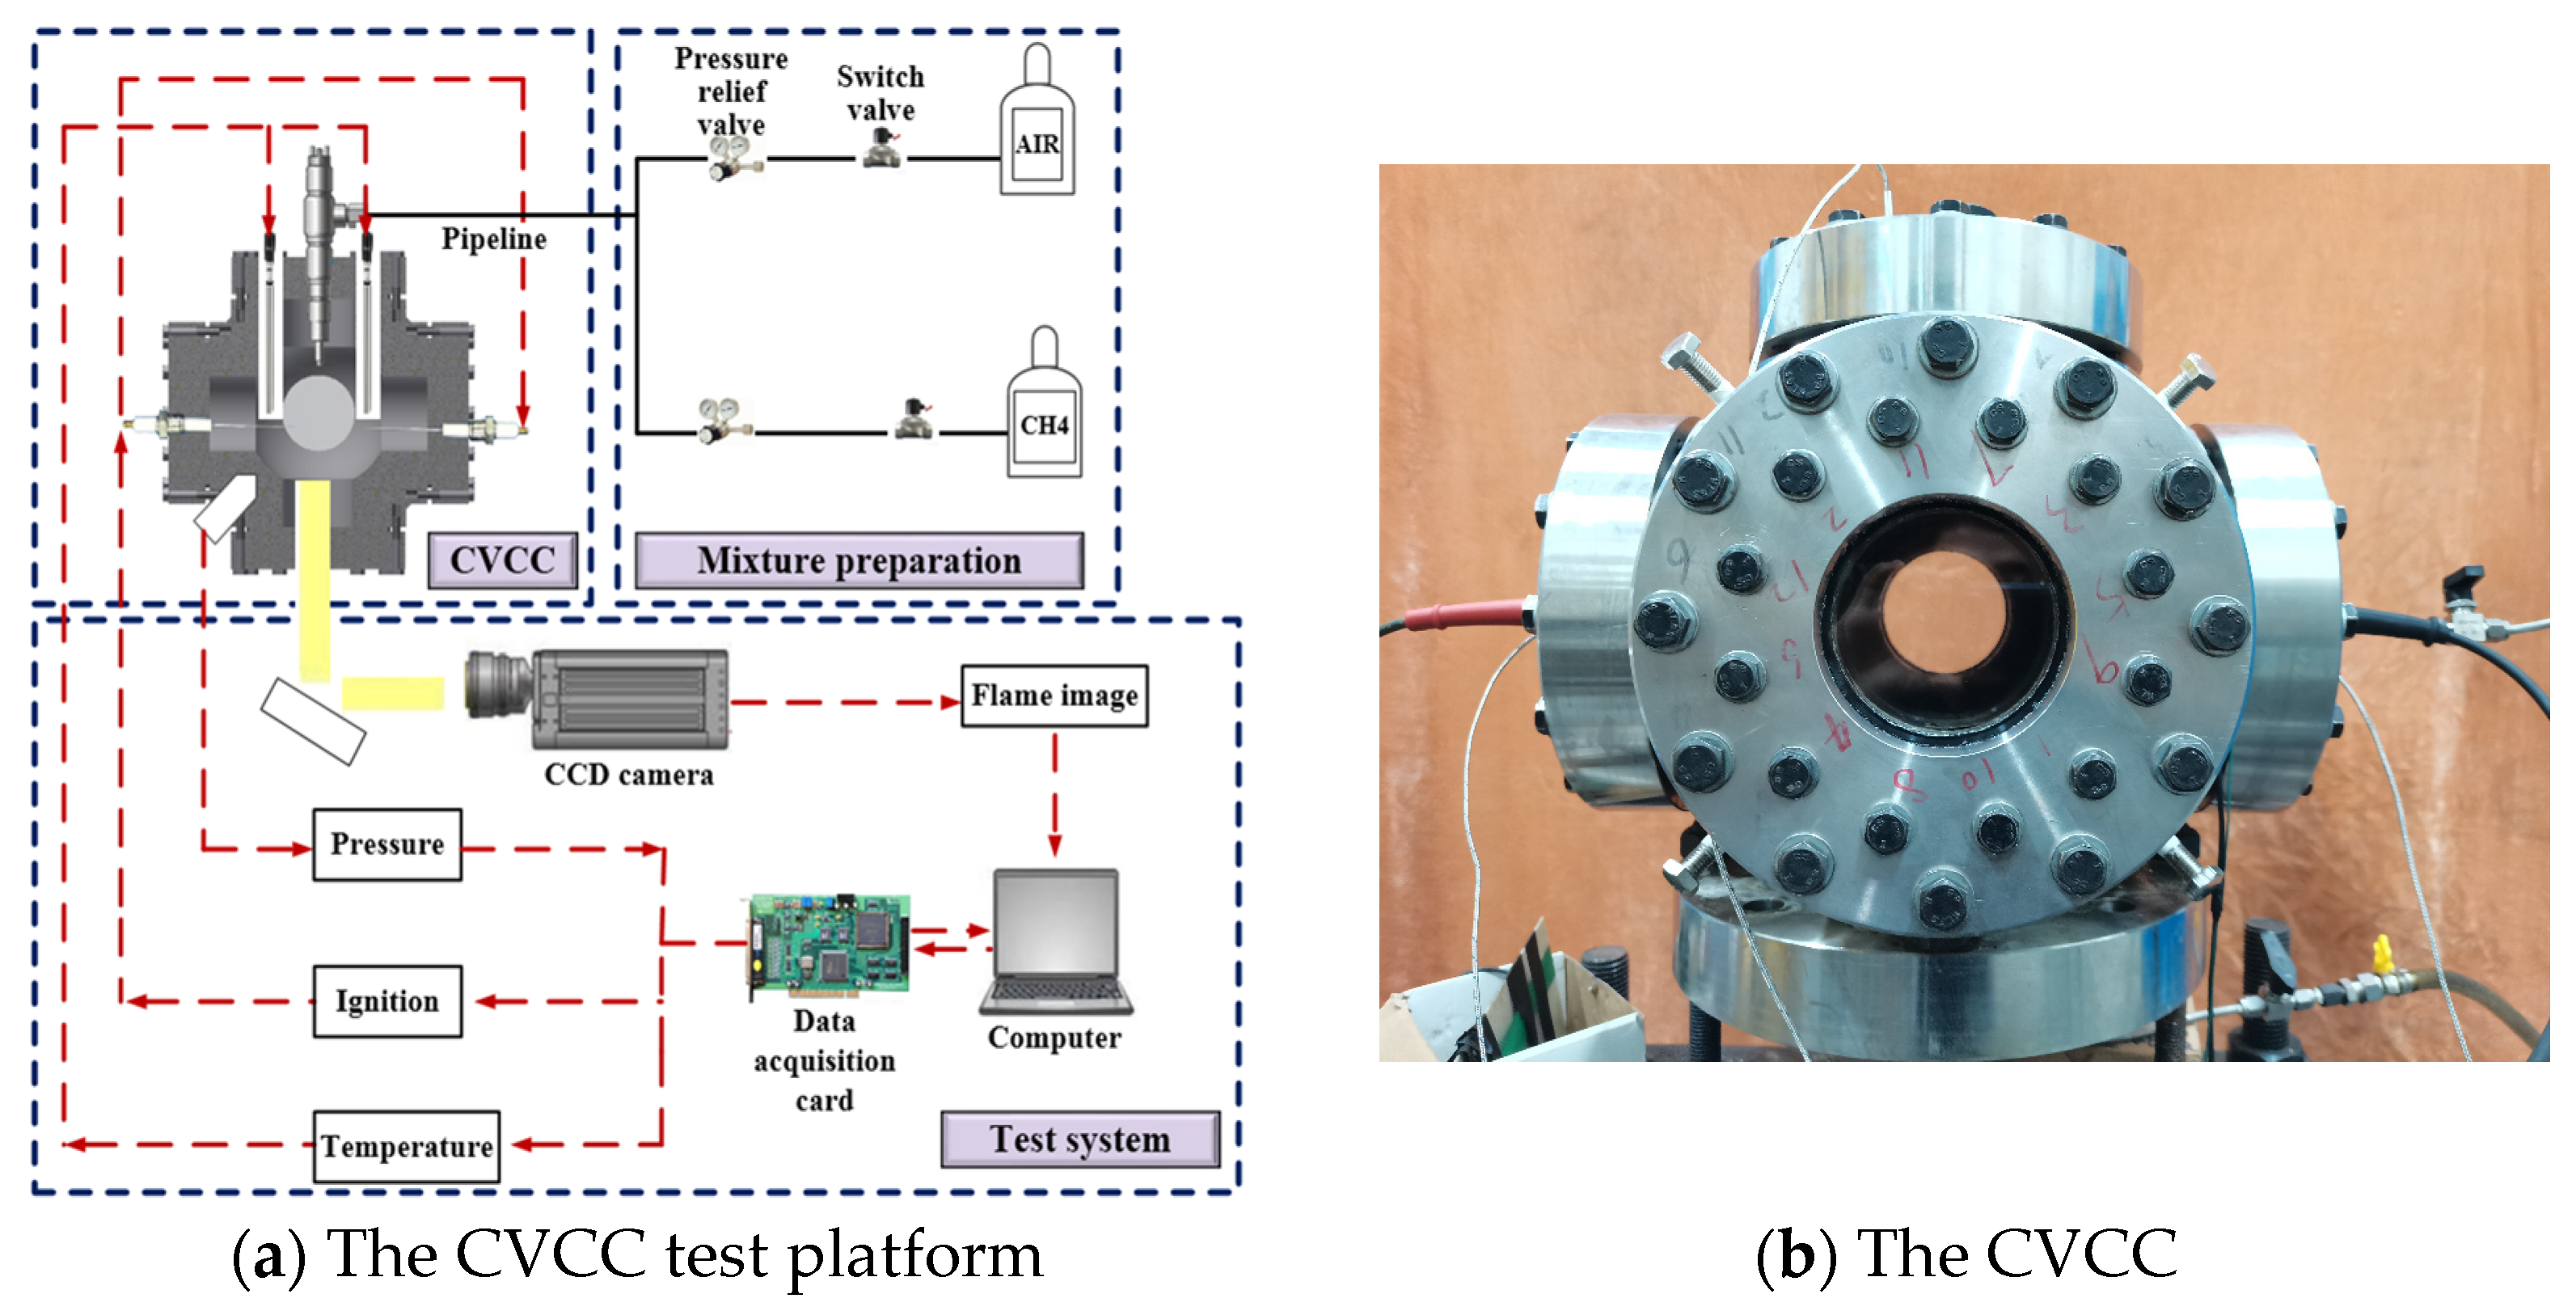
The test platform is mainly composed of CVCC, mixture preparation system and test system, as shown in Figure 6a. Figure 6b shows the actual figure of CVCC. Two bipolar spark plugs are arranged at the left and right ends of the center of the CVCC, which can control the ignition time and ignition energy, respectively, and realize the double point ignition in the CVCC. Data acquisition includes pressure acquisition and flame image acquisition. The relevant experimental parameters are shown in Table 1 [28].
Before gas distribution, pump the gas inside the CVCC to a vacuum state. Use Dalton’s law to calculate the amount of various components of gas that need to be filled, then fill methane and air into the CVCC in sequence according to different intake order, and let it stand for 3–5 min to mix evenly. Open the temperature control system to make the gas in the CVCC reach the set temperature.

2.3.2. Validation of the Model

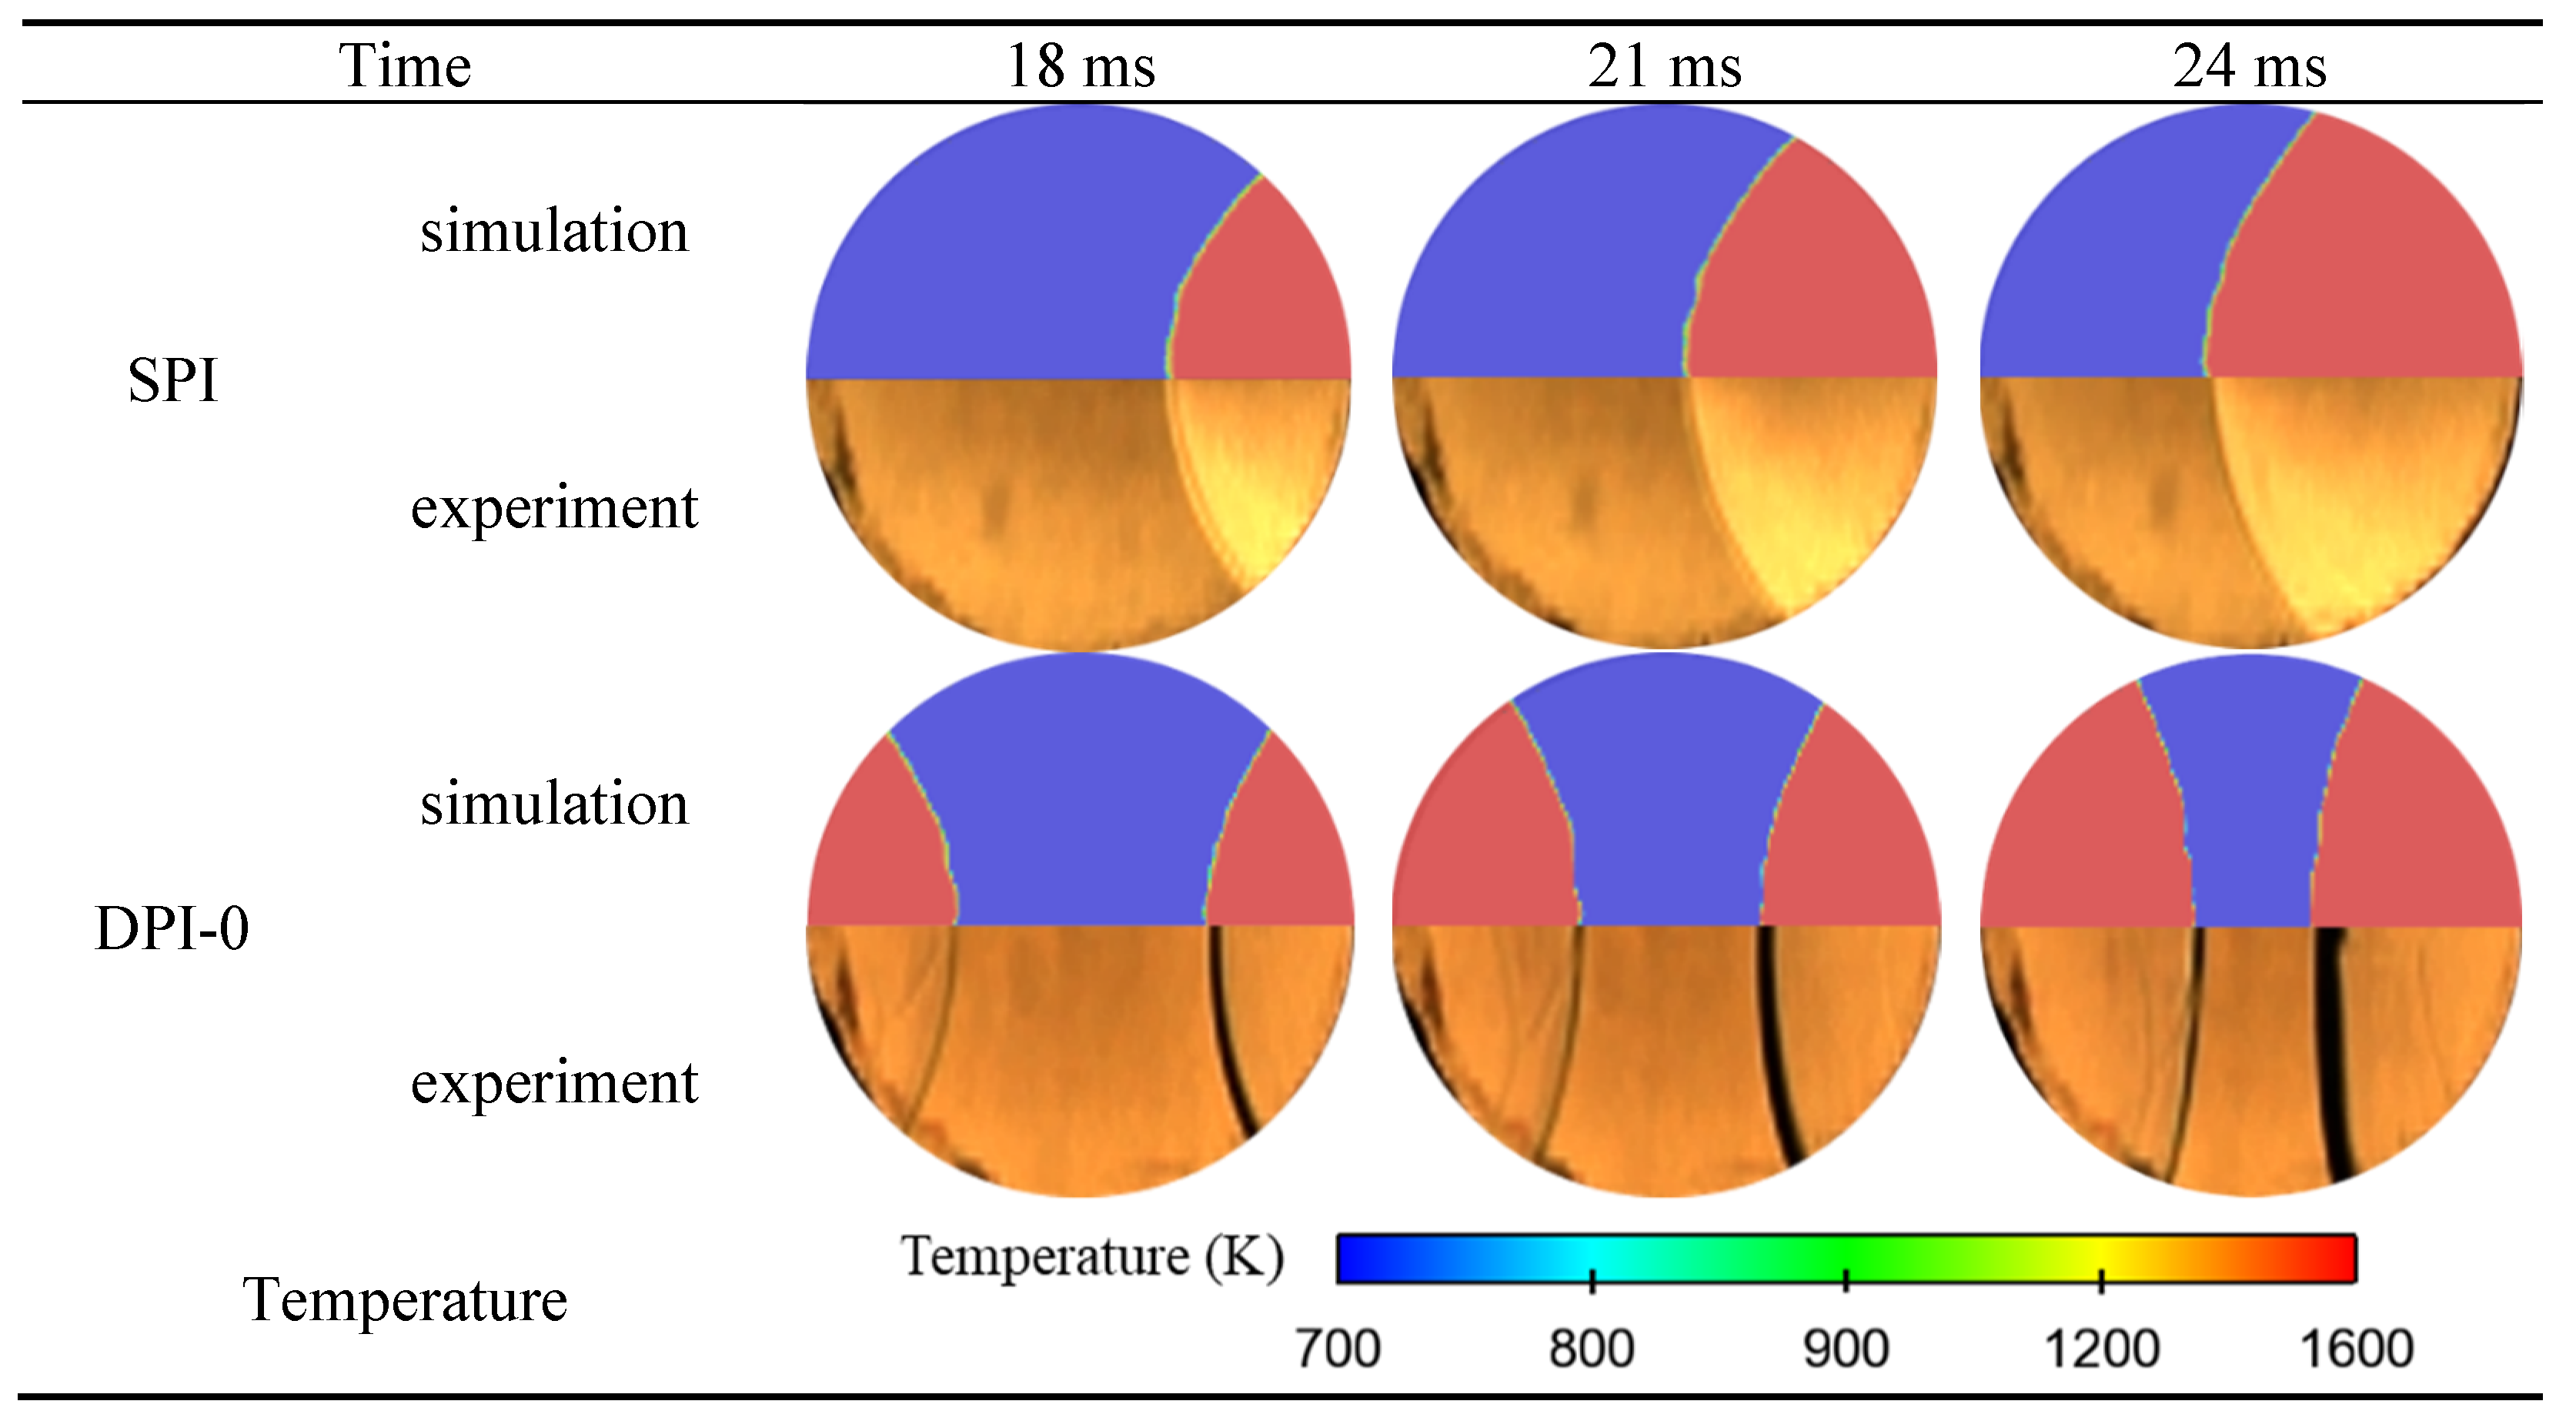
Experiments and simulation of SPI and DPI-0 were carried out, respectively, to verify the accuracy of the model. Figure 7a,b are the comparison between the experimental and simulation values of the average combustion pressure in the SPI and DPI-0, respectively. It can be seen that the simulated average pressure results of the two ignition modes are consistent with the general trend of the test results, and the average error of the entire experimental data for SPI and DPI-0 is 3.2% and 3.9%, respectively. The simulated images at three different moments were selected to compare with the experimental schlieren images, as shown in Figure 8. It can be seen that the obtained flame radius and flame contour are basically consistent with each other. Figure 9 shows the comparison between the experimental and simulated values of the flame propagation of SPI and DPI-0. It can be seen that the simulated flame propagation results for the two ignition modes agree with the general trend of the experimental results, and the average errors of the whole experimental data are 1.5% and 1.1% for SPI and DPI-0, respectively. The results show that the simulation models are reliable and can be used to further simulate the combustion process. The results show that the simulation model is reliable and can be used for further simulation of combustion process.

3. Results

3.1. Flame Propagation Characteristics

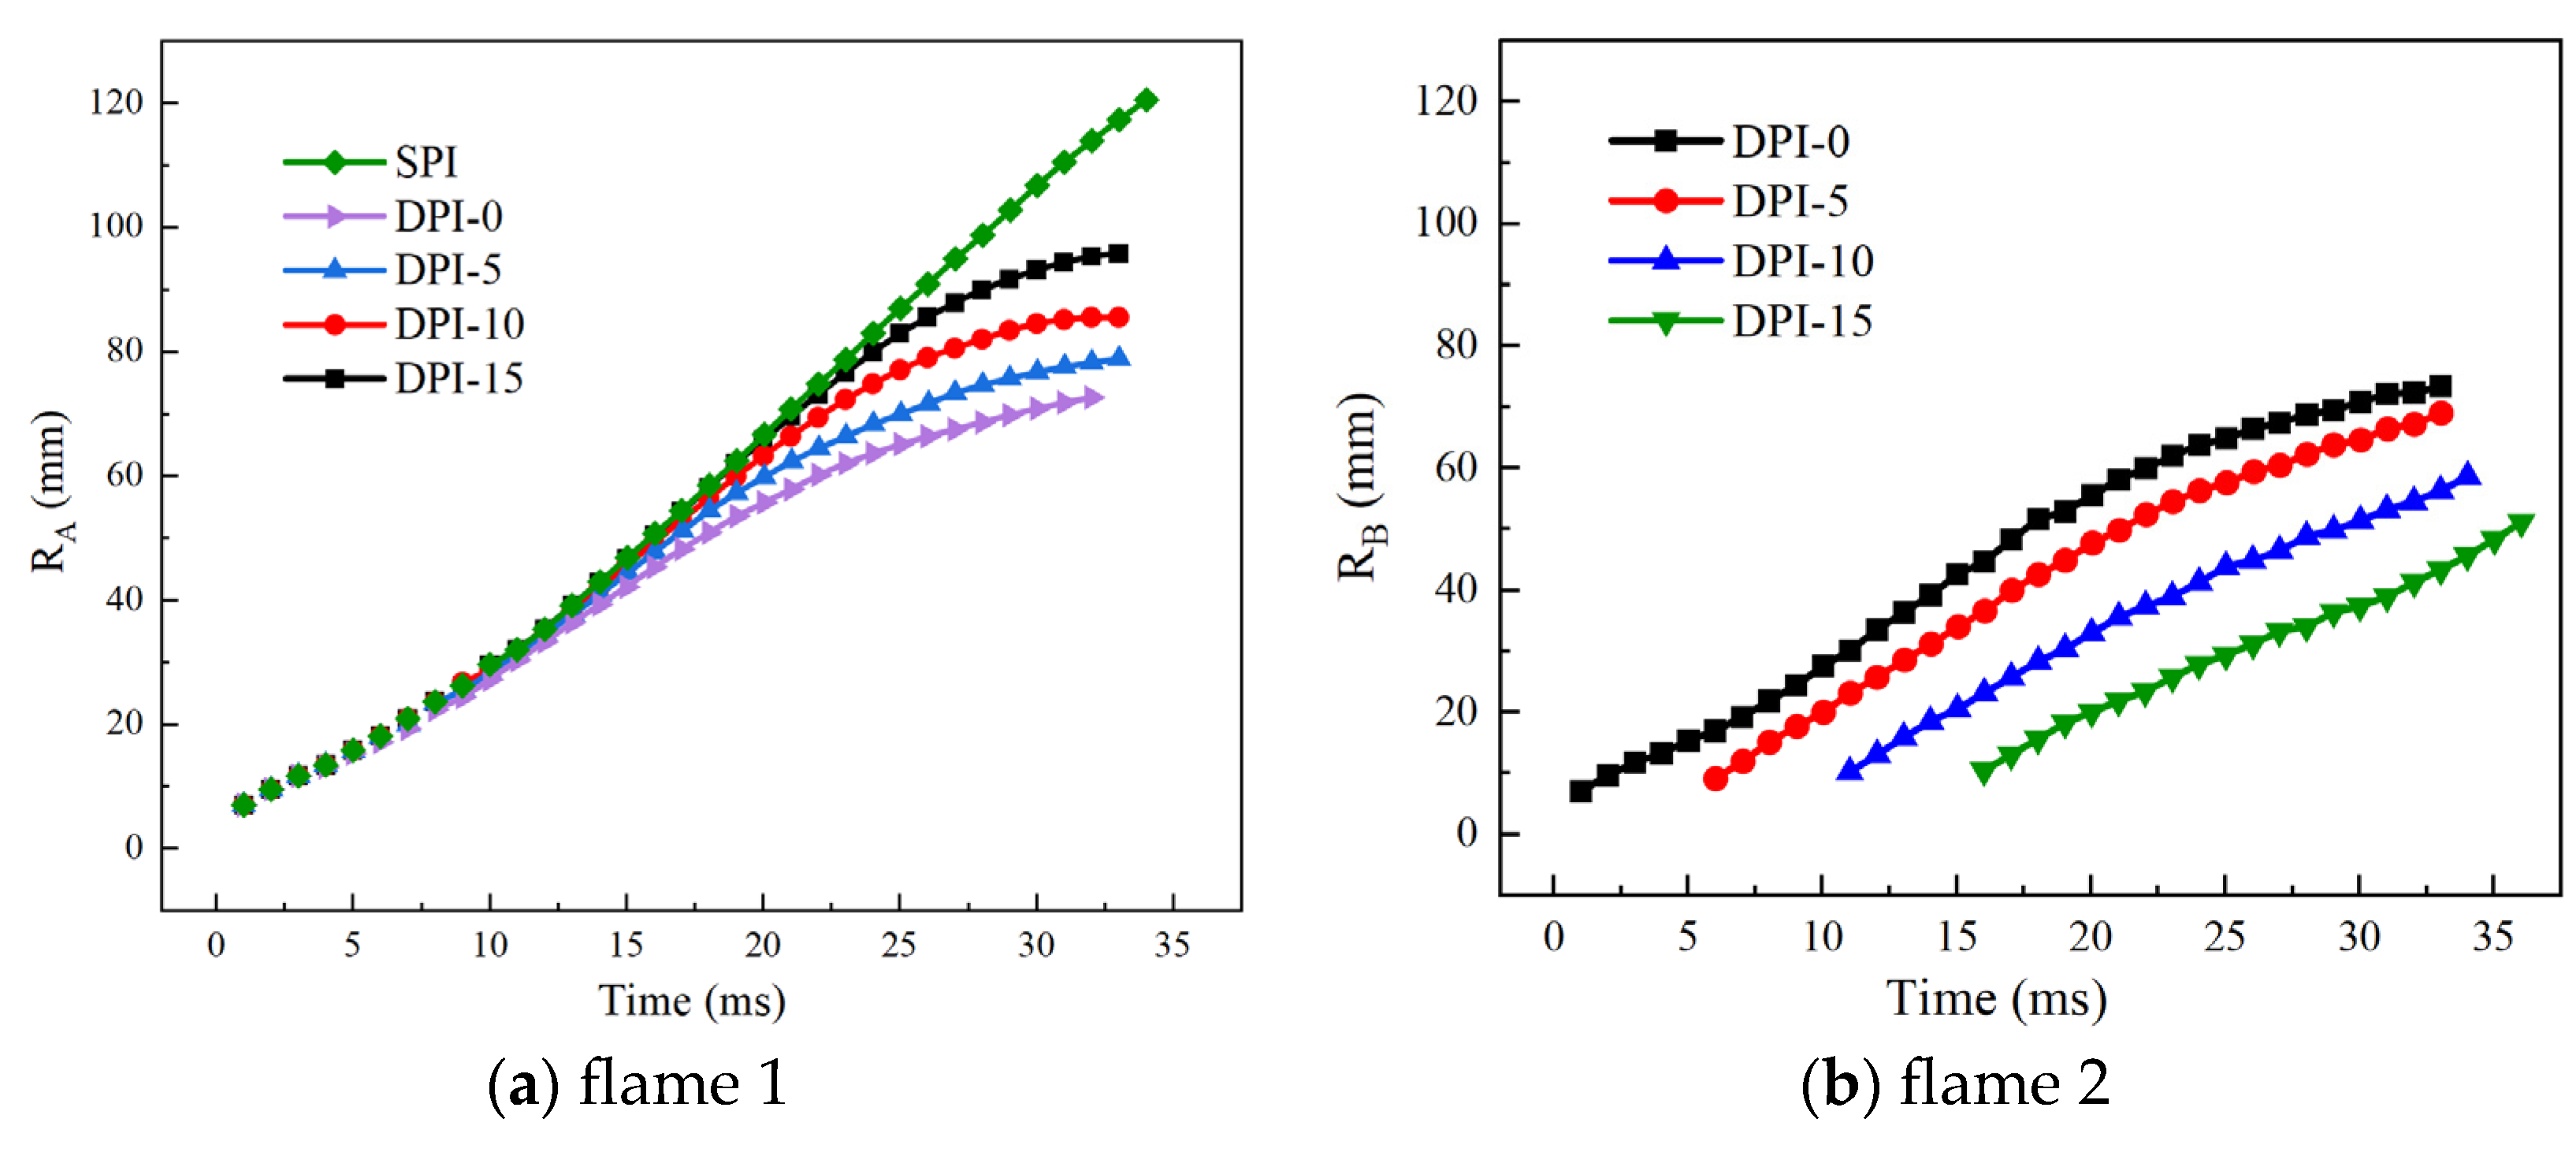
Figure 10 shows the flame radius curve with time under different ignition modes. As shown in Figure 10a, the flame radius of DPI is not affected by the burning of the mixture on the other side before 15 ms, and the flame radius is almost equal to that of SPI. The main reason is that the flame 2 is formed at the early stage, the flame propagation rate is slow at the early stage, and the pressure wave generated has a negligible effect on flame 1. After 15 ms, the flame radius of SPI increases linearly, and the flame radius reaches the maximum. The flame radius of DPI enters a slow growth stage. The main reason for this phenomenon is that DPI produces two flames, which interfere with each other in the process of flame development, making the flame radius grow slower. In the DPI mode, DPI-0 has the smallest flame radius. The results show that as the ignition interval increases Flame 1 is affected by the pressure wave of Flame 2 and decreases. For flame 2, the flame radius increases almost linearly for different ignition modes. For flame 2, the flame radius increases almost linearly for different ignition methods, while flame 2 tends to decrease with increasing ignition intervals, as shown in Figure 10b.
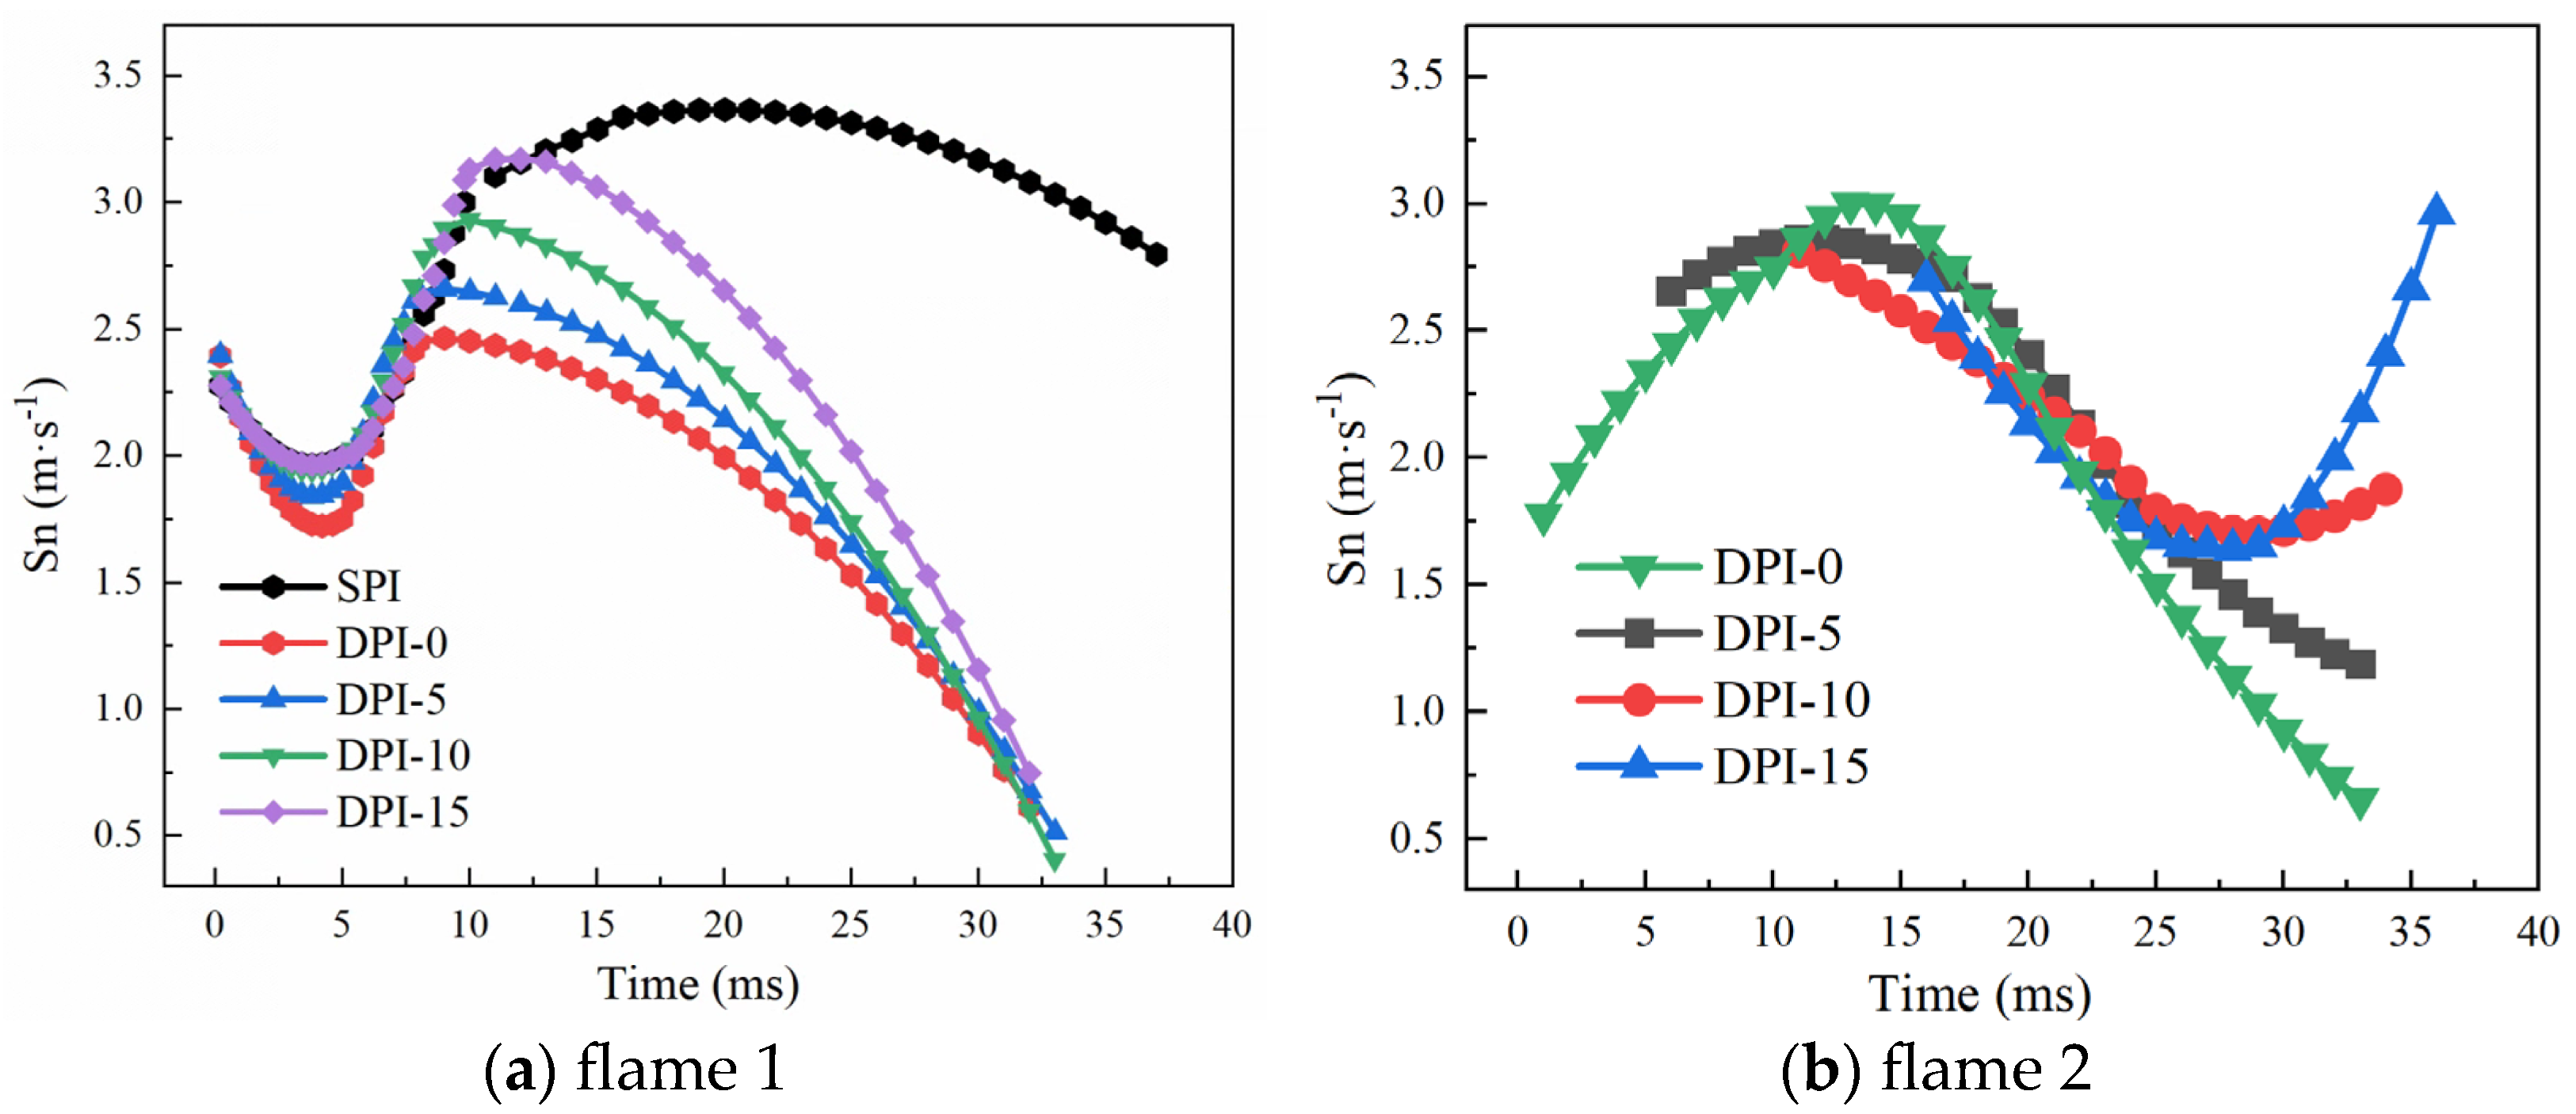
Figure 11 shows the stretched flame propagation velocity curve over time under different ignition methods. For flame 1, as shown in Figure 11a, in the early stage of flame development, different ignition methods all have higher flame propagation speed. With the dissipation of ignition energy, the flame propagation velocity decreases to the first inflection point. Thereafter, the chemical energy released by the combustion of the mixture is greater than the heat emitted to the outside world, the flame develops rapidly, and the propagation speed of the stretched flame increases. However, with the rapid propagation of the two flames in the DPI, the pressure inside the CVCC increases rapidly, which makes the flame front surface squeezed, and inhibits the propagation of the flame, and the flame propagation speed decreases. The stretching flame propagation velocity achievable at this stage increases and the fall-off time is delayed as the ignition interval increases. The stretched flame propagation speed in the SPI is about 3.2 m/s and then slowly decreases after a period of propagation.
For flame 2, as shown in Figure 11b, the stretched flame propagation velocity of DPI-0 and DPI-5 firstly increases and then decreases. In the early stage of combustion, the flame interaction on both sides is not obvious, and flame 2 develops fast. With the development of flame 1, the suppression effect of flame 1 on flame 2 becomes more and more obvious after 15 ms, which leads to the slowing down of flame propagation speed. With the increase in ignition interval time, when the flame 2 of DPI-10 and DPI-15 is in the early development stage, the combustion of flame 1 has produced a large pressure wave, which has a large inhibition effect on flame 2, and the stretched flame propagation speed decreases. After 27 ms, the stretched flame propagation speed increases. The underlying reason is that as combustion proceeds, the surface folds of the flame front increase, resulting in a larger flame front area and faster flame propagation.
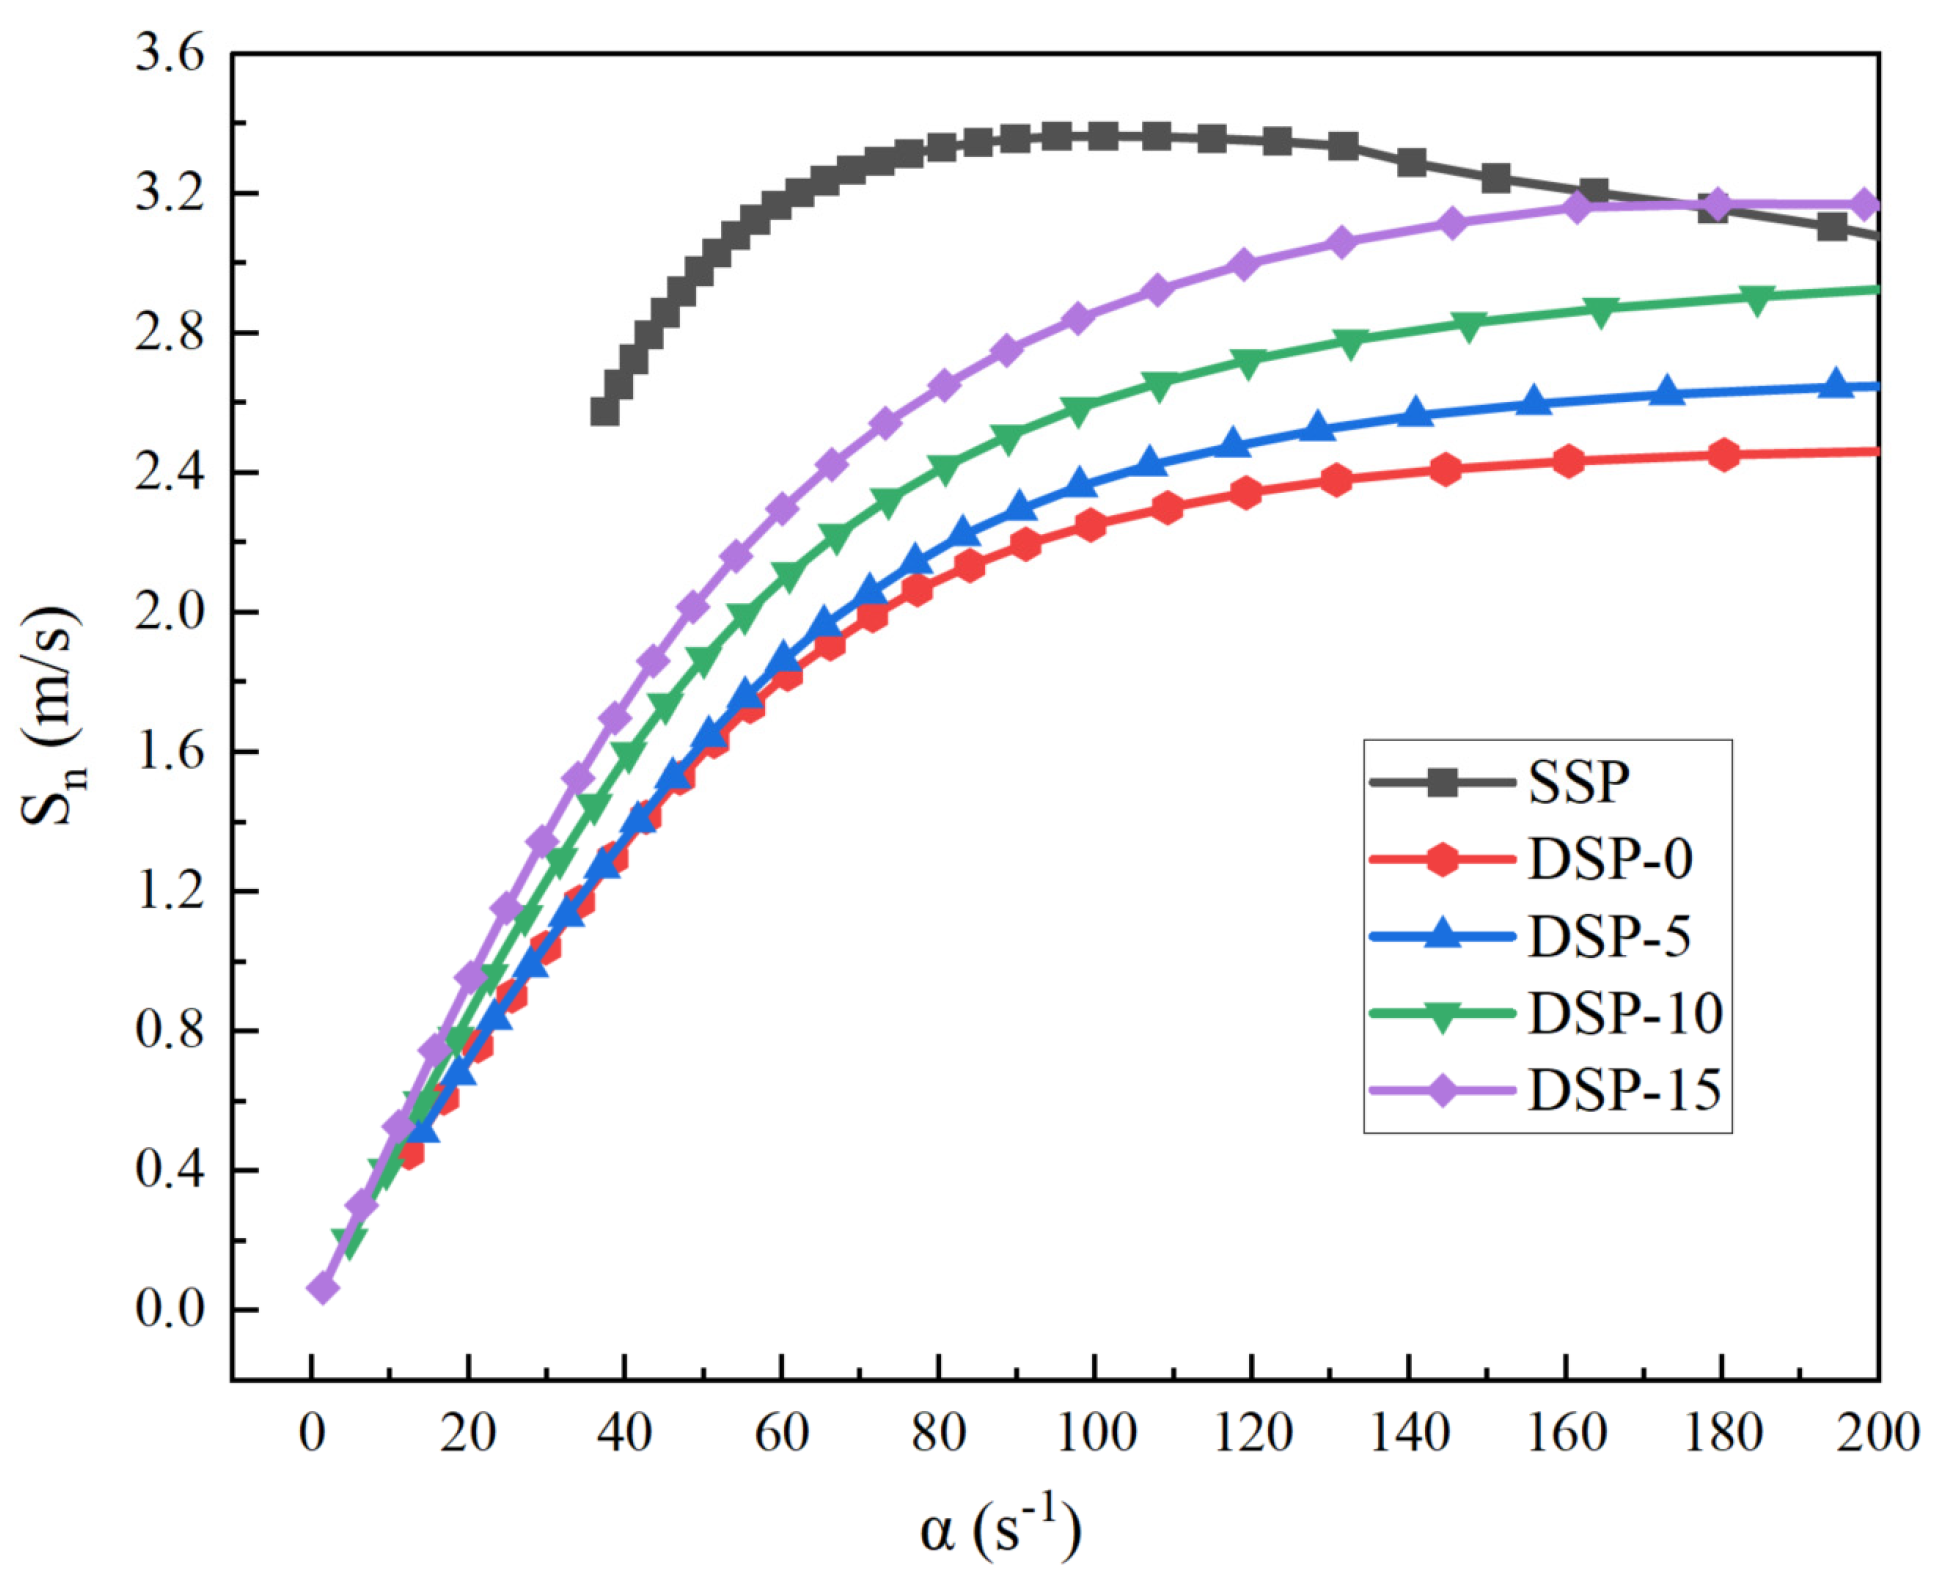
From Figure 12 can be seen that with the increase in flame stretching rate, the flame propagation velocity of SPI has little change, while the flame propagation velocity of DPI increases linearly at first and then becomes stable. The inverse of the slope of the curve is the Markstein length. As the flame develops, the flame stretch ratio decreases. During the flame propagation of SPI, the slope of curve changes from negative to positive, the Markstein length changes from positive to negative, and the flame changes from stable state to unstable state. SPI has the smallest positive slope and the largest Markstein length. Compared with SPI, DPI has a smaller L b and weaker flame stability. Due to the interaction of the two flames, the time of the combustion pressure wave to the CVCC wall is different, the interaction between the pressure wave and the flame cannot be cancelled out, and the flame instability increases. The effect of pressure waves generated by two flames in DPI-0 basically cancels each other out and the flame stability is better than that of DPI-5,DPI-10 and DPI-15. The pressure wave generated on both sides of the flame has a coupling effect on the flame development as the ignition interval increases, L b decreases, the flame stability decreases, and the pressure oscillation phenomenon is more likely to occur.

3.2. Combustion Characteristics

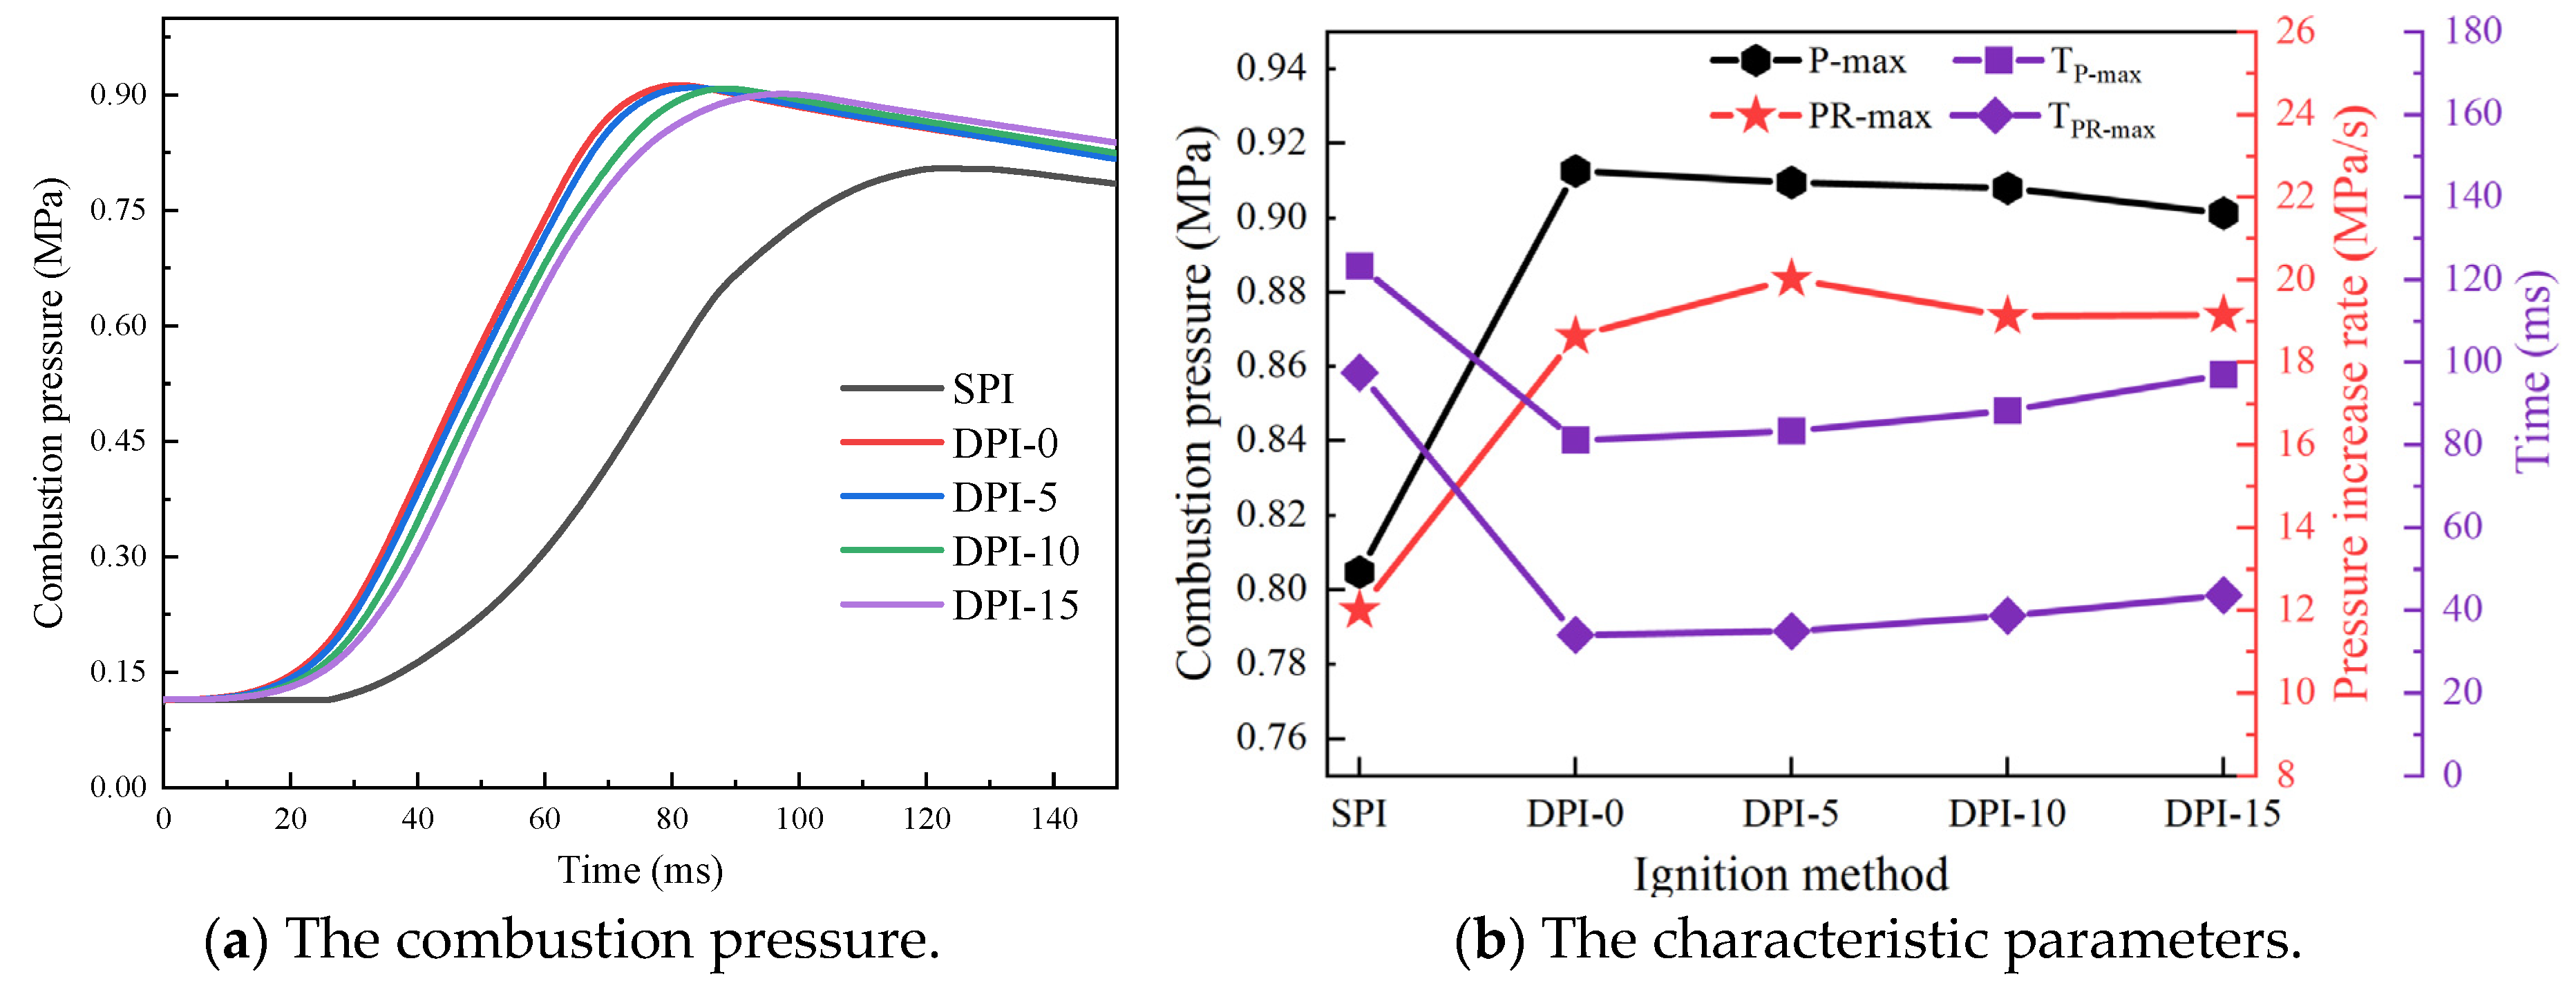
Figure 13a shows the curve of mean pressure in combustion chamber under different ignition methods. Figure 13b shows several characteristic parameters of maximum combustion pressure (P-max), occurrence time of peak combustion pressure (Tp-max), maximum pressure increase rate (PR-max) and occurrence time of maximum pressure increase rate (TPR-max) under different ignition methods. The Tp-max of SPI is around 112 ms, while the Tp-max of DPI is smaller than SPI. The main reason is that DPI can generate two spherical flames, increasing the surface area of the flame front, accelerating the combustion speed of the mixture, shortening the combustion time, and causing the peak pressure to appear earlier. The Tp-max of DPI delays as the ignition interval increases. The P-max of DPI is about 0.1 MPa higher than SPI. With the increase in the ignition interval, the P-max decreases gradually, but the difference is not significant. This is because although the two spherical flames have a certain inhibition effect, the inhibition effect does not play a dominant role in the combustion process, but greatly accelerates the combustion speed of the mixture.
PR-max of DPI is higher than SPI, and TPR-max is later than SPI. TPR-max is delayed gradually with the increase in the ignition interval. The main reason is that with the increase in ignition interval, the flame generated by source 2 needs a longer combustion time, resulting in stronger pressure wave to affect the opposite flame and combustion pressure.
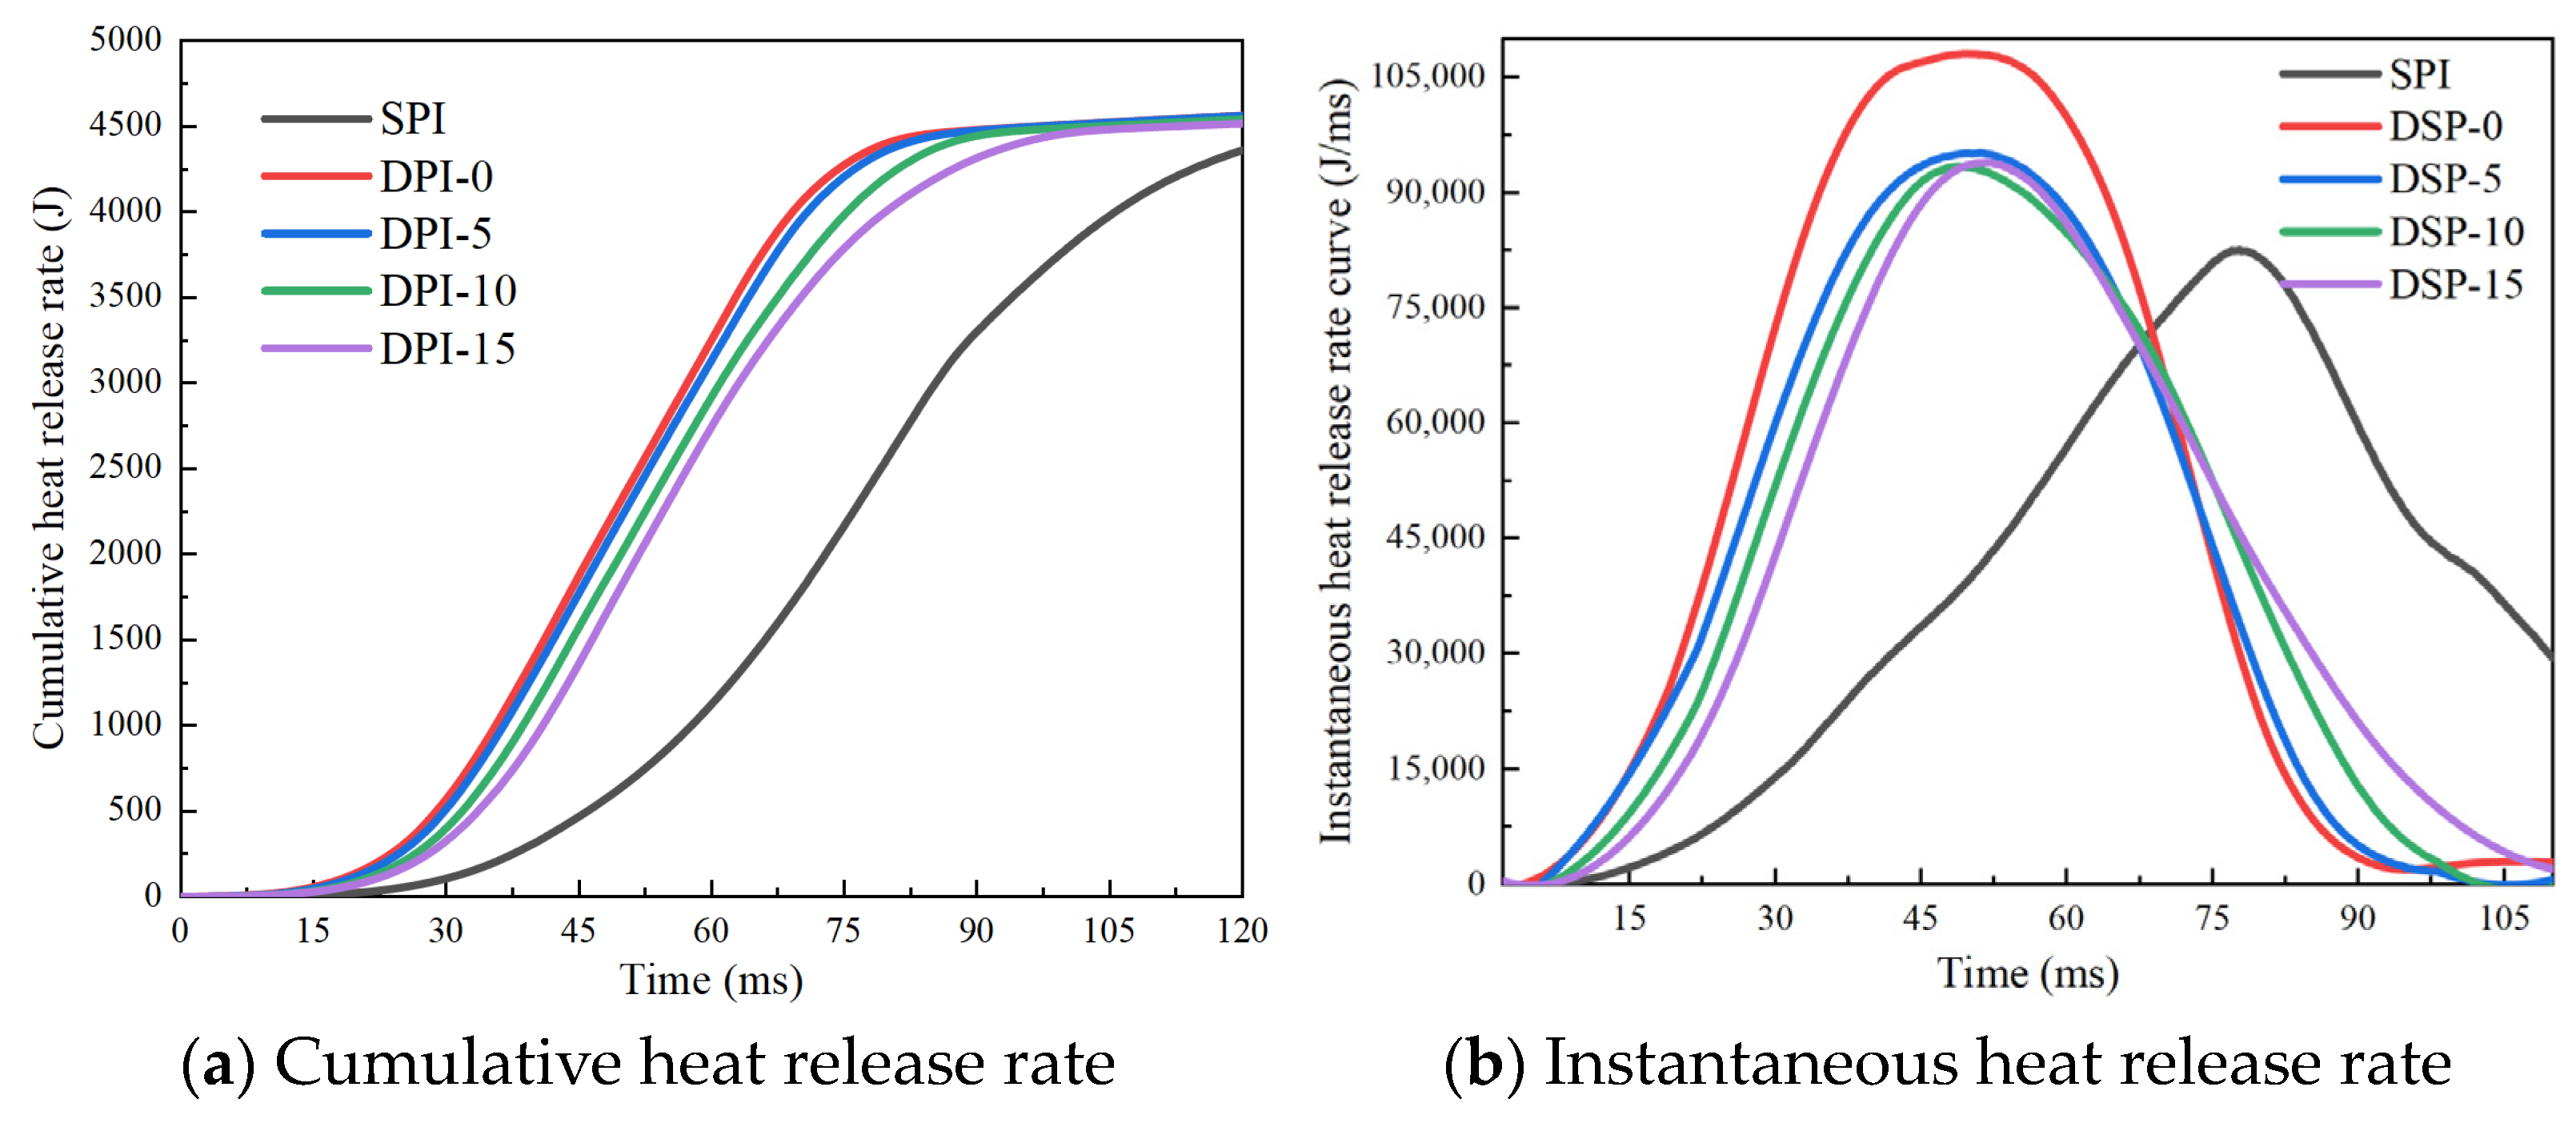
Figure 14 shows the curve of cumulative and instantaneous heat release rate under different ignition methods. As can be seen from Figure 14a, compared with SPI, DPI can obtain a higher cumulative t c , which makes the fuel in the combustion chamber burn more fully. However, there is no significant difference in the t c under different ignition intervals. Figure 14b shows that the DPI effectively improves the d Q d t of the natural gas engine, and the gravity position of the heat release rate moves forward significantly. The d Q d t of DPI-0 is the highest, and the peak value decreases with the increase in ignition interval.
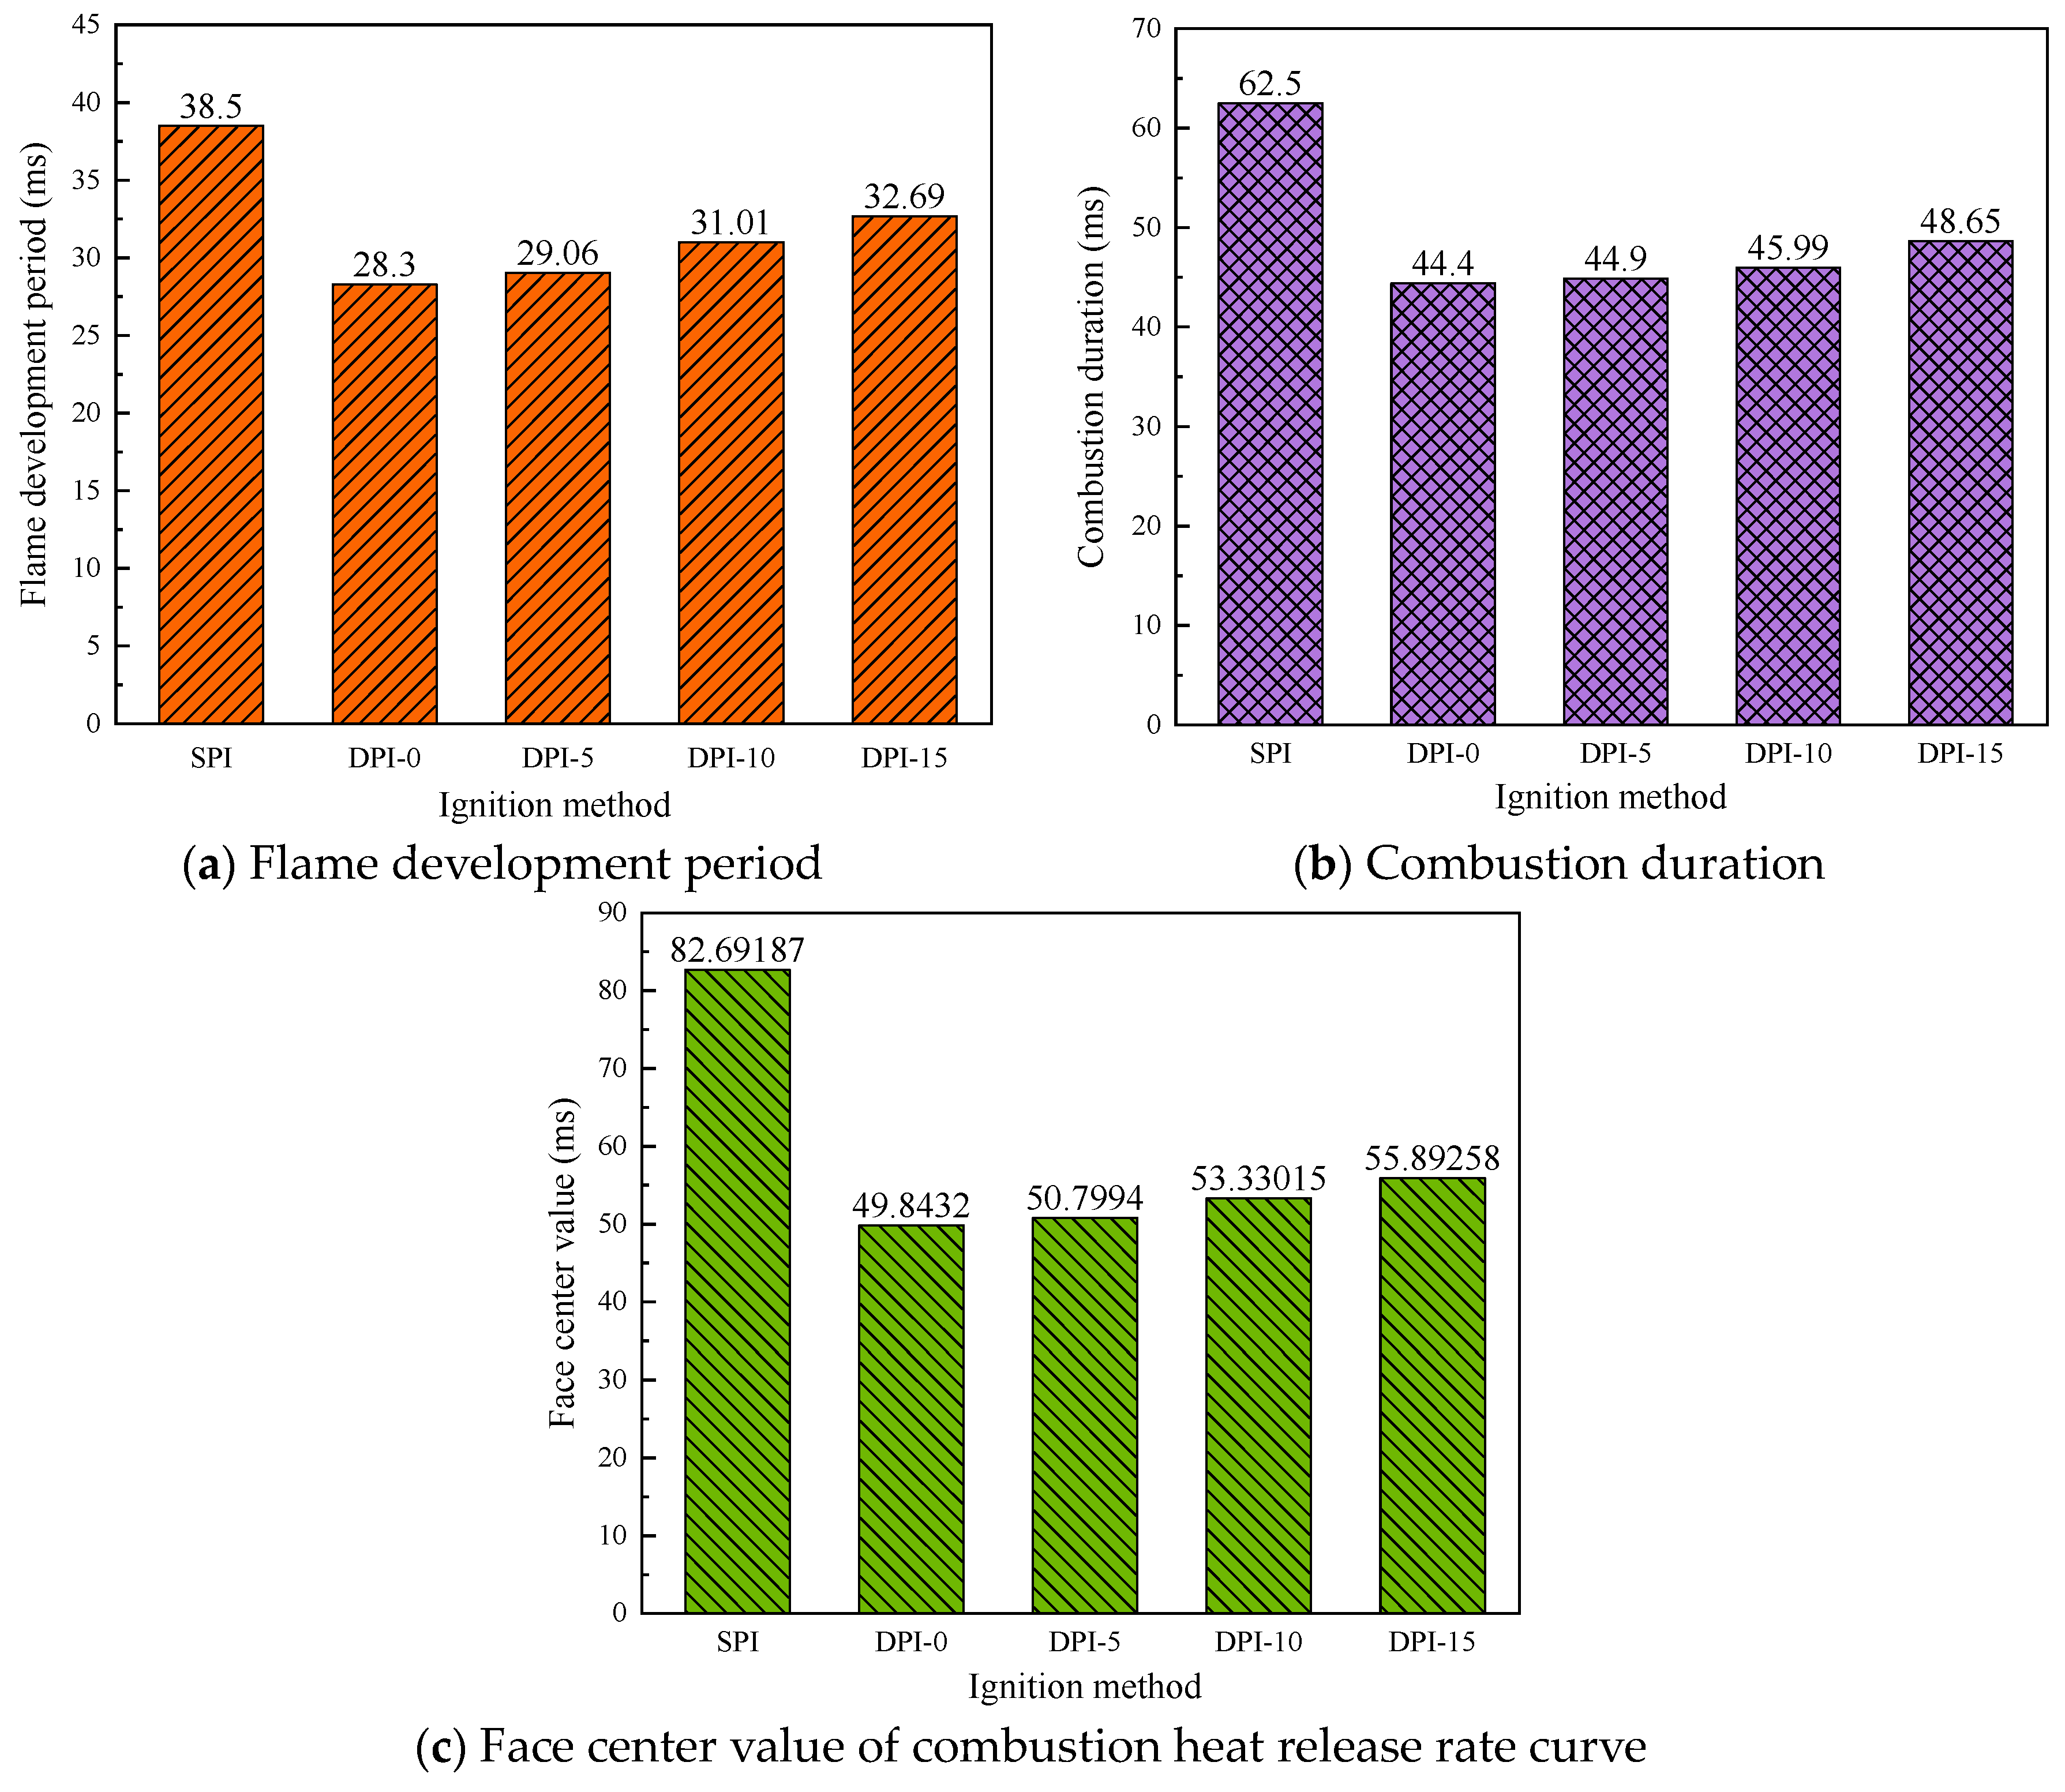
The time from zero to the time when the t c of combustible mixture reaches 10% is regarded as the flame development duration, and the time occupied by the t c of 10~90% is regarded as the combustion duration, which can be used to evaluate the “fast” or “slow” of combustion process. The smaller the face center value, the higher the constant volume of the entire combustion process, and the greater the improvement in thermal efficiency.
Figure 15 shows the characteristic parameters of combustion process under different ignition methods. From Figure 15a, it can be seen that the flame development period of DPI is shorter than that of SPI, and the flame development period increases as the ignition interval time increases. The combustion duration of DPI-0 is 44.4 ms, 18.1 ms shorter than SPI, as Figure 15b shown. The combustion duration of DPI increases with the increase in ignition interval. The combustion duration of DPI-0, DPI-5, DPI-10 and DPI-15 is 29%, 28.1%, 26.4% and 22.1% shorter than SPI, respectively. The results show that the DPI can accelerate the combustion speed and shorten the combustion duration, and the DPI-0 has the fastest combustion speed. This is because the DPI can produce two flames, compared with the SPI, flame front surface greatly increased, thus achieving rapid fuel combustion. The face center value of SPI is 82.69 ms, and the face center value of DPI-0, DPI-5, DPI-10 and DPI-15 are 49.84 ms, 50.79 ms, 53.33 ms and 55.89 ms, respectively, as Figure 15c shown. Compared with the SPI, the face center values are reduced by 39.73%, 38.58%, 35.51% and 32.41%, respectively. The results show that compared with SPI, DPI has higher constant volume degree and greater thermal efficiency. With the increase in ignition interval, the face center value becomes larger, the constant volume degree of combustion process decreases, and the thermal efficiency decreases.

3.3. Interaction between Turbulence and Flame

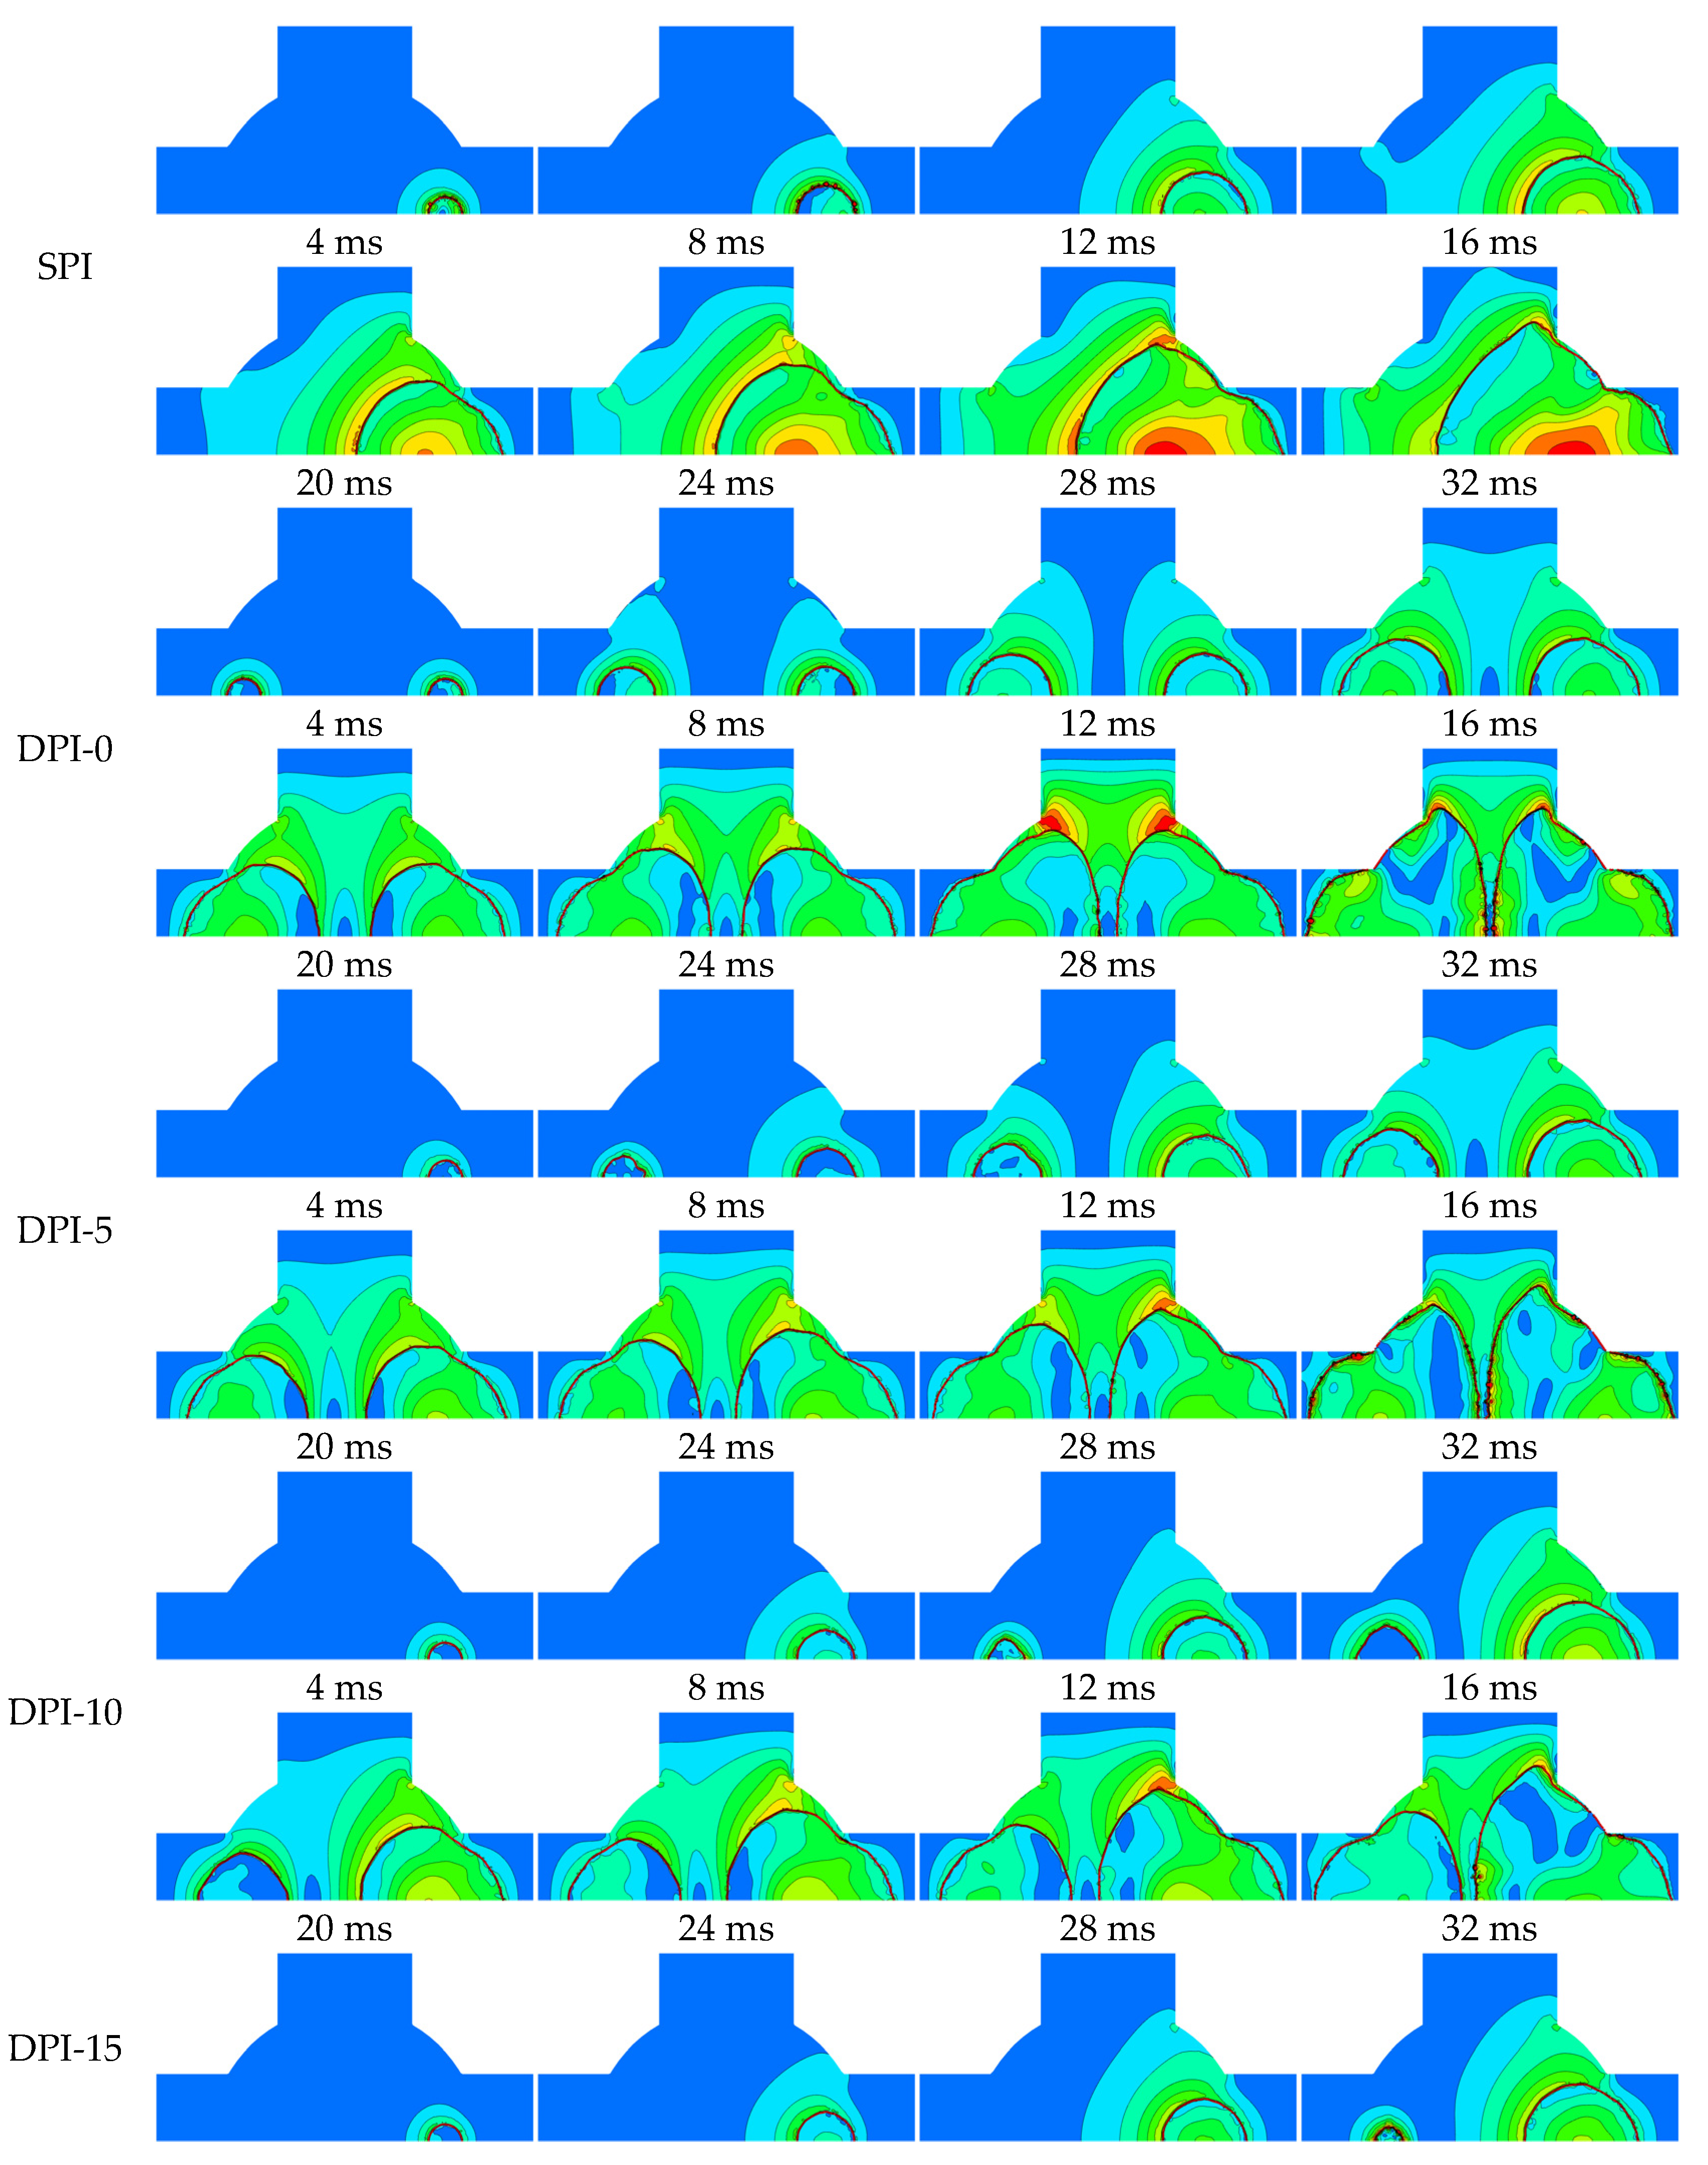
Figure 16 shows the velocity field distribution under different ignition methods. The red curve is the equivalent surface of T = 1500 K, which is used to represent the flame front surface. SPI has only one ignition source, which produces one flame. The mixture is ignited and the flame spreads to both sides of the combustion chamber. Propagation on the right side of the flame is hindered by the boss; on the left side of the flame, the fuel is sufficient, and the space is large. The flame moves rapidly to the left side, and the flame surface area increases. As the combustion progresses, the speed of the air flow in the center of the flame increases gradually, and the combustion speed increases gradually. The air flow velocity decreases from the center of the flame to the flame front surface. The fast forward propagation of the flame disturbs the airflow outside the flame which is still in the state of low temperature and unburned, resulting in high air flow velocity at the outer edge of the flame.
DPI-0 has two ignition sources, producing two flames. At the same time, the flame surface area of DPI-0 is larger than SPI, which can burn more fuel and accelerate the global combustion rate in the constant volume combustion chamber. With the increase in ignition interval, the occurrence time of flame 2 is delayed and the flame surface area decreases at the same time. This indicates that the flame surface area of DPI-0 is the largest and the global combustion speed is the fastest. With the propagation of the flame, a low-speed zone appears inside the flame, which indicates that the two flames generated by DPI have mutual inhibition effect, resulting in a speed inside the flame that is opposite to the direction of the flame, resulting in the decrease in the air flow speed.
DPI-0 has a small low-velocity zone in the center of the constant volume combustion chamber (outside the two flames) at 16 ms. The direction of air flow velocity at this point is perpendicular to the flame surface pointing to the direction of flame advance, and the flame propagation direction on both sides is opposite, resulting in air flow velocity at this point offset, airflow velocity is low. With the increase in ignition interval, the emergence time of the low velocity zone is delayed and gradually deviates from the center of the constant volume combustion chamber and moves to the left. The air flow velocity in the center of DPI-0 flame is lower than that of SPI. The reason for this phenomenon is that two flames generated by DPI inhibit each other in the propagation process, hindering flame propagation, resulting in the decrease in unilateral air flow velocity and combustion velocity. As the ignition interval increases, the suppression of flame 1 by the pressure wave generated by the combustion of flame 2 decreases and the air flow rate in the center of flame 1 increases.

3.4. Influence of Ignition Position on Premixed Combustion Characteristics of Dual Spark-Ignition

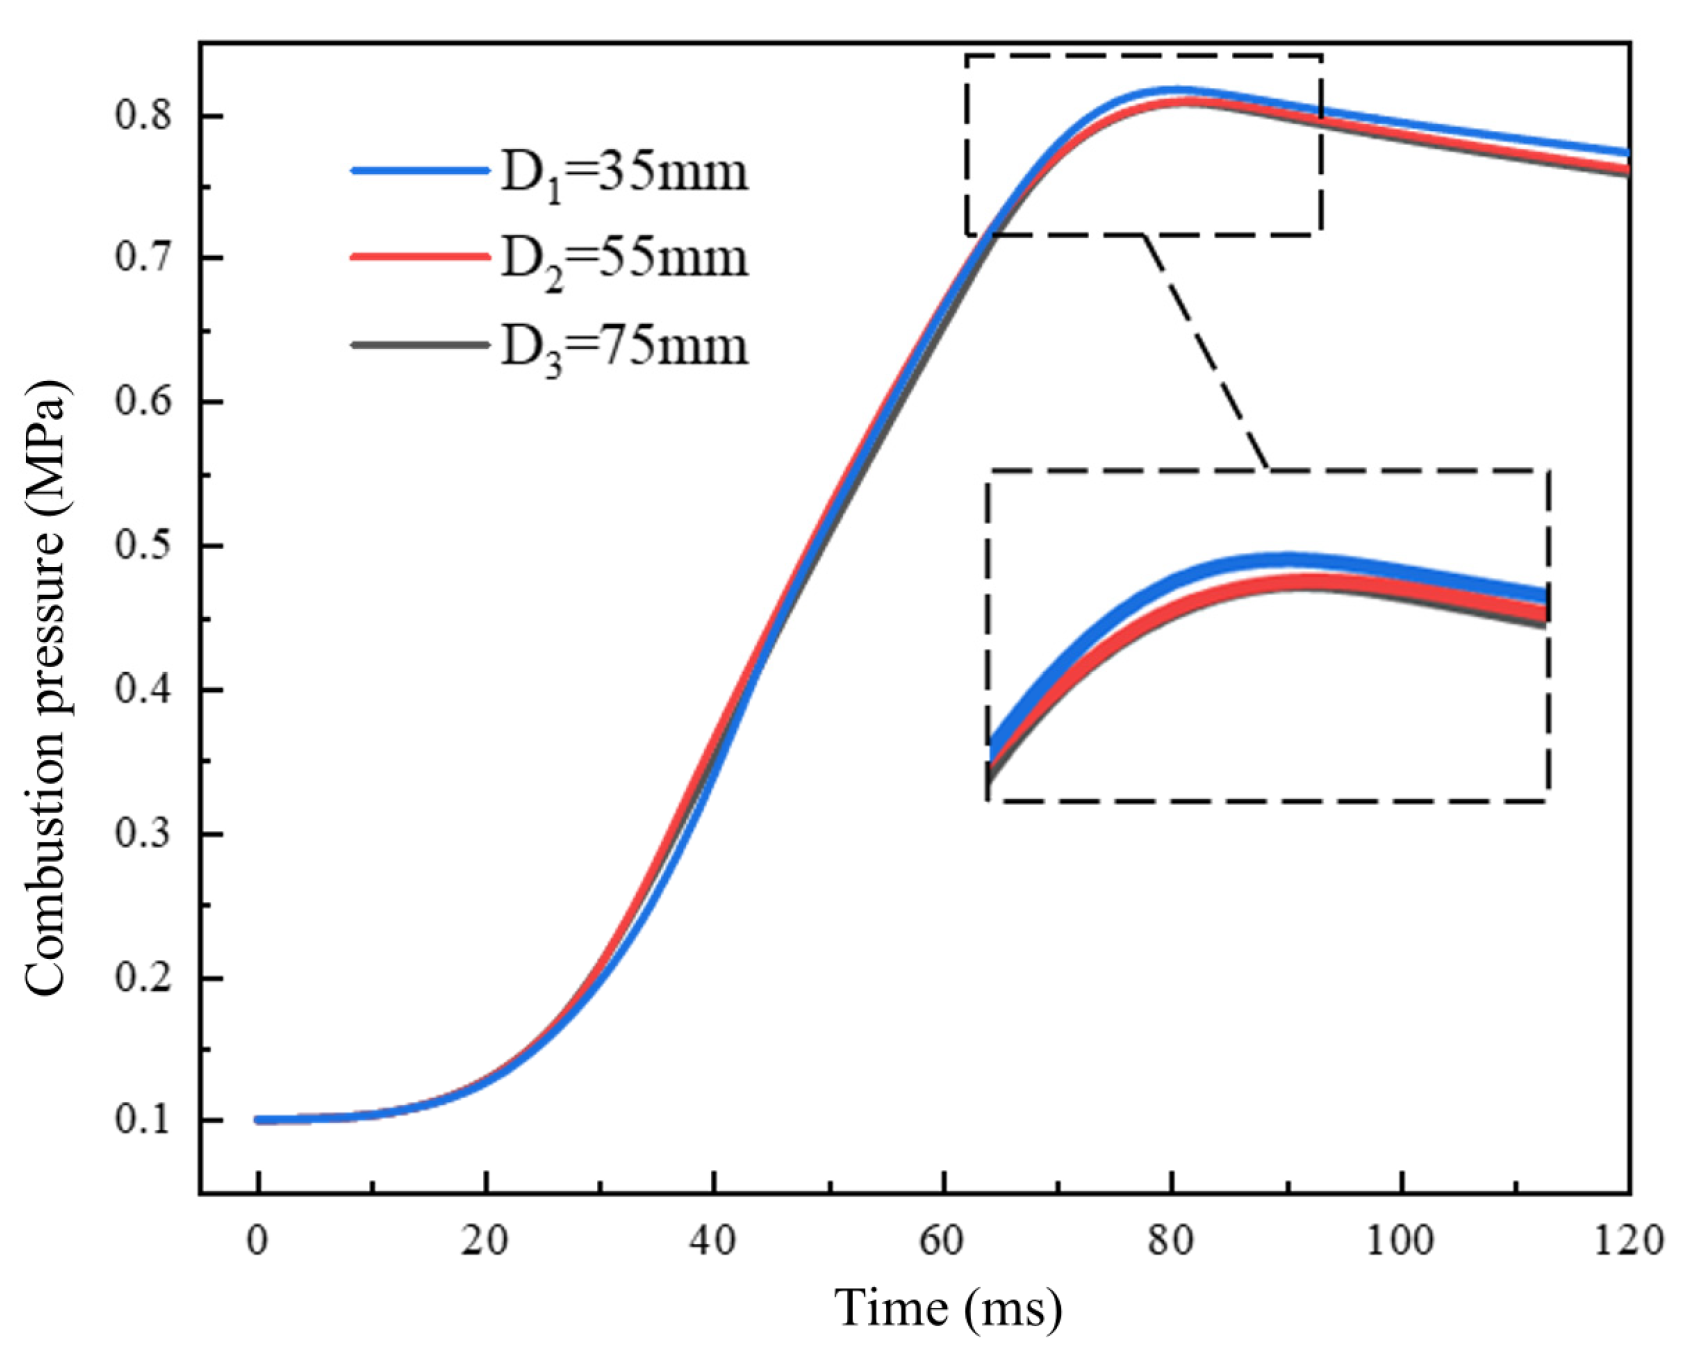
As shown in Figure 17, three symmetrical positions of D1, D2, and D3 on both sides to set the ignition source term, which are, respectively, 35 mm, 55 mm and 75 mm away from the center of the CVCC. Under the conditions of initial temperature of 300 K, initial pressure of 0.1 MPa, and equivalence ratio of 1.0, the influence of ignition source term positions of D1, D2, and D3 on the premixed combustion characteristics of natural gas was studied.
Figure 18 shows the comparison curve of combustion pressure under different ignition positions. It can be seen that the trend of the combustion pressure curve is consistent under different ignition methods. The peak combustion pressure at ignition distance of 35 mm is the highest, but there is no significant difference in the peak combustion pressure and arrival time at different positions.
Figure 19 shows the comparison curve of t c and d Q d t at different ignition positions. The t c curves at different ignition positions almost overlap, while the d Q d t peak increases with the shortening of the ignition position, but the difference in this peak is not significant. Under the same initial temperature and pressure, the amount of combustible gas that can be charged into the CVCC is the same, and the total chemical energy released after combustion is the same, resulting in the same t c . As the ignition position is shortened, the time when flame surfaces on both sides merge into a large flame surface is advanced, which promotes more combustible mixture to participate in chemical reaction, and releases chemical energy to obtain higher d Q d t .

4. Conclusions

We investigated the evolution patterns of the two flame fronts and the effects of the flame on the flow field under the dual spark ignition strategy. In this study, the G equation coupled with the SAGE detailed chemical reaction mechanism is used to construct the combustion model. Study on methane–air premixed combustion simulation with different ignition strategies in a constant volume environment.
(1) Due to the influence of the opposite flame, the stretched flame propagation speed of double point ignition is small, and the flame radius increases slowly. Compared to other ignition methods, single-point ignition has the largest Markstein length and the strongest flame stability, while double-point asynchronous ignition has poor flame stability.
(2) The combustion pressure of DPI is about 0.1 MPa higher than that of SPI, which increases by 12%~13.4%. There is little difference in combustion pressure between synchronous ignition and dual asynchronous ignition. DPI-0 can obtain higher heat release rate and thermal efficiency.
(3) Compared with SPI, the combustion duration of DPI-0, DPI-5, DPI-10 and DPI-15 is reduced by 28.96%, 28.16%, 26.42% and 22.16%, respectively. The flame surface area of DPI is increased, the combustion time is shortened, and the fast combustion is realized. The global combustion rate slows down with increasing ignition interval.
(4) The mixture flow velocity is larger in the flame center and outside the flame front surface. Because of the suppression effect on the opposite flame, the airflow velocity in the center of the flame is less than that in the SPI. With the increase in ignition interval, the airflow velocity inside flame 1 gradually increases and becomes closer to SPI.
(5) In a CVCC, the ignition position has little effect on the combustion pressure, cumulative heat release rate and instantaneous heat release rate of methane–air premixed combustion.

Author Contributions

Y.W.: Data curation, Writing—original draft, Writing—review and editing, Methodology; X.Z.: Conceptualization, Supervision, Resources and Project administration; X.F.: Data curation, Formal analysis; Y.L.: Methodology, Investigation. All authors have read and agreed to the published version of the manuscript.

Funding

This work was supported by the National Natural Science Foundation of China (No. 51976008).

Data Availability Statement

Not applicable.

Conflicts of Interest

The authors declare that they have no known competing financial interests or personal relationships that could have appeared to influence the work reported in this paper.

Abbreviations

SymbolNameUnit
SPISingle point ignition
DPIDual point ignition
CVCCConstant volume combustion chamber
R Equal area radiusmm
S n Flame propagation ratem/s
α Flame surface stretch rate1/s
S l Unstretched flame propagation speedm/s
L b Markstein lengthm
d Q d t Instantaneous heat release rateKJ/s
t c Cumulative heat release rateJ
P PressureMPa
P-maxMaximum combustion pressureMPa
PR-maxMaximum pressure increase rateMPa/s
Tp-maxMoment of peak combustion pressure
TPR-maxMoment of maximum pressure increase rate

References

  1. Tian, Z.; Wang, Y.; Zhen, X.; Liu, Z. The effect of methanol production and application in internal combustion engines on emissions in the context of carbon neutrality: A review. Fuel 2022, 320, 123902. [Google Scholar] [CrossRef]
  2. Li, M.; Wu, H.; Zhang, T.; Shen, B.; Zhang, Q.; Li, Z. A comprehensive review of pilot ignited high pressure direct injection natural gas engines: Factors affecting combustion, emissions and performance. Renew. Sustain. Energy Rev. 2020, 119, 109653. [Google Scholar] [CrossRef]
  3. Cong, X.; Ji, C.; Wang, S. Investigation into engine performance of a hydrogen-dimethyl ether spark-ignition engine under various dimethyl ether fractions. Fuel 2021, 306, 121429. [Google Scholar] [CrossRef]
  4. Shu, J.; Fu, J.Q.; Liu, J.P.; Wang, S.Q.; Yin, Y.S.; Deng, B.L.; Becker, S.M. Influences of excess air coefficient on combustion and emission performance of diesel pilot ignition natural gas engine by coupling computational fluid dynamics with reduced chemical kinetic model. Energy Convers. Manag. 2019, 187, 283–296. [Google Scholar] [CrossRef]
  5. Benajes, J.; García, A.; Monsalve-Serrano, J.; Boronat, V. Achieving clean and efficient engine operation up to full load by combining optimized RCCI and dual-fuel diesel-gasoline combustion strategies. Energy Convers. Manag. 2017, 136, 142–151. [Google Scholar] [CrossRef]
  6. Gong, C.; Sun, J.; Liu, F. Numerical study of twin-spark plug arrangement effects on flame, combustion and emissions of a medium compression ratio direct-injection methanol engine. Fuel 2020, 279, 118427. [Google Scholar] [CrossRef]
  7. Altin, İ.; Sezer, İ.; Bilgin, A. Effects of the Stroke/Bore Ratio on the Performance Parameters of a Dual-Spark-Ignition (DSI) Engine. Energy Fuels 2009, 23, 1825–1831. [Google Scholar] [CrossRef]
  8. Altın, İ.; Bilgin, A. A parametric study on the performance parameters of a twin-spark SI engine. Energy Convers. Manag. 2009, 50, 1902–1907. [Google Scholar] [CrossRef]
  9. Altın, İ.; Bilgin, A. Quasi-dimensional modeling of a fast-burn combustion dual-plug spark-ignition engine with complex combustion chamber geometries. Appl. Therm. Eng. 2015, 87, 678–687. [Google Scholar] [CrossRef]
  10. Altın, İ.; Bilgin, A.; Sezer, İ. Theoretical investigation on combustion characteristics of ethanol-fueled dual-plug SI engine. Fuel 2019, 257, 116068. [Google Scholar] [CrossRef]
  11. Chen, W.; Pan, J.; Fan, B.; Otchere, P.; Miao, N.; Lu, Y. Numerical investigation of dual-fuel injection timing on air-fuel mixing and combustion process in a novel natural gas-diesel rotary engine. Energy Convers. Manag. 2018, 176, 334–348. [Google Scholar] [CrossRef]
  12. Ji, C.W.; Shi, C.; Wang, S.F.; Yang, J.X.; Su, T.; Wang, D. Effect of dual-spark plug arrangements on ignition and combustion processes of a gasoline rotary engine with hydrogen direct-injection enrichment. Energy Convers. Manag. 2019, 181, 372–381. [Google Scholar] [CrossRef]
  13. Shi, C.; Ji, C.; Wang, S.; Yang, J.; Li, X.; Ge, Y. Numerical simulation on combustion process of a hydrogen direct-injection stratified gasoline Wankel engine by synchronous and asynchronous ignition modes. Energy Convers. Manag. 2019, 183, 14–25. [Google Scholar] [CrossRef]
  14. Chang, K.; Ji, C.; Wang, S.; Yang, J.; Wang, H.; Meng, H.; Liu, D. Numerical investigation of the synchronous and asynchronous changes of ignition timing in a double spark plugs direct injection rotary engine. Energy 2023, 268, 126688. [Google Scholar] [CrossRef]
  15. Gong, C.; Sun, J.; Chen, Y.; Liu, F. Numerical study of cold-start performances of a medium compression ratio direct-injection twin-spark plug synchronous ignition engine fueled with methanol. Fuel 2021, 285, 119235. [Google Scholar] [CrossRef]
  16. Gong, C.; Sun, J.; Liu, F. Numerical research on combustion and emissions behaviors of a medium compression ratio direct-injection twin-spark plug synchronous ignition methanol engine under steady-state lean-burn conditions. Energy 2021, 215, 119193. [Google Scholar] [CrossRef]
  17. Yan, X.; Feng, H.; Zuo, Z.; Jia, B.; Zhang, Z.; Wu, L. Research on the influence of dual spark ignition strategy at combustion process for dual cylinder free piston generator under direct injection. Fuel 2021, 299, 120911. [Google Scholar] [CrossRef]
  18. Lauvergne, R.; Hallot, J. Investigation of the Effect of Double Ignition on the Combustion Processes in a 2-valves Gasoline Engine Through 3D Simulation. SAE Trans. 2003, 112, 87–99. [Google Scholar]
  19. Hwang, P.W.; Chen, X.C.; Cheng, H.C. Influences of Ignition Timing, Spark Plug and Intake Port Locations on the Combustion Performance of a Simulated Rotary Engine. J. Mech. 2016, 32, 579–591. [Google Scholar] [CrossRef]
  20. Chen, Y.; Liu, A.; Deng, B.; Xu, Z.; Feng, R.; Fu, J.; Liu, X.; Zhang, G.; Zhou, L. The influences of ignition modes on the performances for a motorcycle single cylinder gasoline engine at lean burn operation: Looking inside interaction between flame front and turbulence. Energy 2019, 179, 528–541. [Google Scholar] [CrossRef]
  21. Duan, X.; Zhang, S.; Liu, Y.; Li, Y.; Liu, J.; Lai, M.-C.; Deng, B. Numerical investigation the effects of the twin-spark plugs coupled with EGR on the combustion process and emissions characteristics in a lean burn natural gas SI engine. Energy 2020, 206, 118181. [Google Scholar] [CrossRef]
  22. Deng, B.; Li, Q.; Chen, Y.; Li, M.; Liu, A.; Ran, J.; Xu, Y.; Liu, X.; Fu, J.; Feng, R. The effect of air/fuel ratio on the CO and NOx emissions for a twin-spark motorcycle gasoline engine under wide range of operating conditions. Energy 2019, 169, 1202–1213. [Google Scholar] [CrossRef]
  23. Forte, C.; Bianchi, G.M.; Corti, E.; Fantoni, S.; Costa, M. CFD Methodology for the Evaluation of Knock of a PFI Twin Spark Engine. Energy Procedia 2014, 45, 859–868. [Google Scholar] [CrossRef]
  24. Forte, C.; Bianchi, G.M.; Corti, E.; Fantoni, S. Evaluation of the Effects of a Twin Spark Ignition System on Combustion Stability of a High Performance PFI Engine. Energy Procedia 2015, 81, 897–906. [Google Scholar] [CrossRef]
  25. Chen, L.; Pan, J.; Liu, C.; Shu, G.; Wei, H. Effect of rapid combustion on engine performance and knocking characteristics under different spark strategy conditions. Energy 2020, 192, 116706. [Google Scholar] [CrossRef]
  26. Zou, R.; Li, Y.; Liu, J.; Wang, N.; Zeng, Q.; Li, J. Numerical study on the effects of spark strategies on knocking combustion in a downsized gasoline rotary engine. Energy 2023, 263, 125770. [Google Scholar] [CrossRef]
  27. Lee, S.W.; Choi, W.; Cho, Y.S. Characterization of HCNG combustion and emission characteristics in a constant volume chamber with a single and a dual spark plug configuration. Int. J. Hydrog. Energy 2012, 37, 682–690. [Google Scholar] [CrossRef]
  28. Li, Y.; Zhang, X.; Wang, Y.; Sun, J.; Fan, X. Experimental study on premixed combustion characteristics of methane-air under dual spark plug ignition strategy in a closed spherical chamber. Fuel 2022, 314, 123093. [Google Scholar] [CrossRef]
  29. Lim, M.T.; Anderson, R.W.; Arpaci, V.S. Prediction of spark kernel development in constant volume combustion. Combust. Flame 1987, 69, 303–316. [Google Scholar] [CrossRef]
  30. Wang, Y.; Zhang, X.; Li, Y.; Qin, S. Experimental study on premixed turbulent flame of methane/air in a spherical closed chamber. Energy Convers. Manag. 2020, 222, 113219. [Google Scholar] [CrossRef]
  31. Li, Y.; Zhang, X.; Wang, Y. Experimental study on the combustion characteristics of premixed methane-hydrogen-air mixtures in a spherical closed chamber. Fuel 2021, 299, 120885. [Google Scholar] [CrossRef]
  32. Basha, S.A.; Raja Gopal, K. In-cylinder fluid flow, turbulence and spray models—A review. Renew. Sustain. Energy Rev. 2009, 13, 1620–1627. [Google Scholar] [CrossRef]
  33. Han, Z.; Reitz, R.D. Turbulence Modeling of Internal Combustion Engines Using RNG κ-ε Models. Combust. Sci. Technol. 1995, 106, 267–295. [Google Scholar] [CrossRef]
  34. Smith, L.M. Renormalization-Group Analysis of Turbulence. Annu. Rev. Fluid Mech. 1998, 30, 275–310. [Google Scholar] [CrossRef]
  35. Amsden, A.A.; Orourke, P.J.; Butler, T.D. KIVA-2: A Computer Program for Chemically Reactive Flows with Sprays; Los Alamos National Lab. (LANL): Los Alamos, NM, USA, 1989; p. 27975. [Google Scholar]
  36. O’Rourke, P.J.; Amsden, A.A. A Spray/Wall Interaction Submodel for the KIVA-3 Wall Film Model; SAE International: Warren, PA, USA, 2000. [Google Scholar]
  37. Sazhin, S.S.; Sazhina, E.M.; Heikal, M.R.; Marooney, C.; Mikhalovsky, S.V. The shell autoignition model: A new mathematical formulation. Combust. Flame 1999, 117, 529–540. [Google Scholar] [CrossRef]
  38. Schneider, E.; Maltsev, A.; Sadiki, A.; Janicka, J. Study on the potential of BML-approach and G-equation concept-based models for predicting swirling partially premixed combustion systems: URANS computations. Combust. Flame 2008, 152, 548–572. [Google Scholar] [CrossRef]
  39. Williams, F.A. Spray combustion theory. Combust. Flame 1959, 3, 215–228. [Google Scholar] [CrossRef]
  40. Peters, N. Turbulent Combustion; Cambridge University Press: Cambridge, UK, 2000. [Google Scholar]
  41. Zhang, Z.; Tian, J.; Xie, G.; Li, J.; Xu, W.; Jiang, F.; Huang, Y.; Tan, D. Investigation on the combustion and emission characteristics of diesel engine fueled with diesel/methanol/n-butanol blends. Fuel 2022, 314, 123088. [Google Scholar] [CrossRef]
  42. Lu, T.; Law, C.K. A criterion based on computational singular perturbation for the identification of quasi steady state species: A reduced mechanism for methane oxidation with NO chemistry. Combust. Flame 2008, 154, 761–774. [Google Scholar] [CrossRef]
  43. Senecal, P.K.; Pomraning, E.; Richards, K.J.; Briggs, T.E.; Choi, C.Y.; McDavid, R.M.; Patterson, M.A. Multi-Dimensional Modeling of Direct-Injection Diesel Spray Liquid Length and Flame Lift-Off Length using CFD and Parallel Detailed Chemistry; SAE International: Warren, PA, USA, 2003. [Google Scholar]
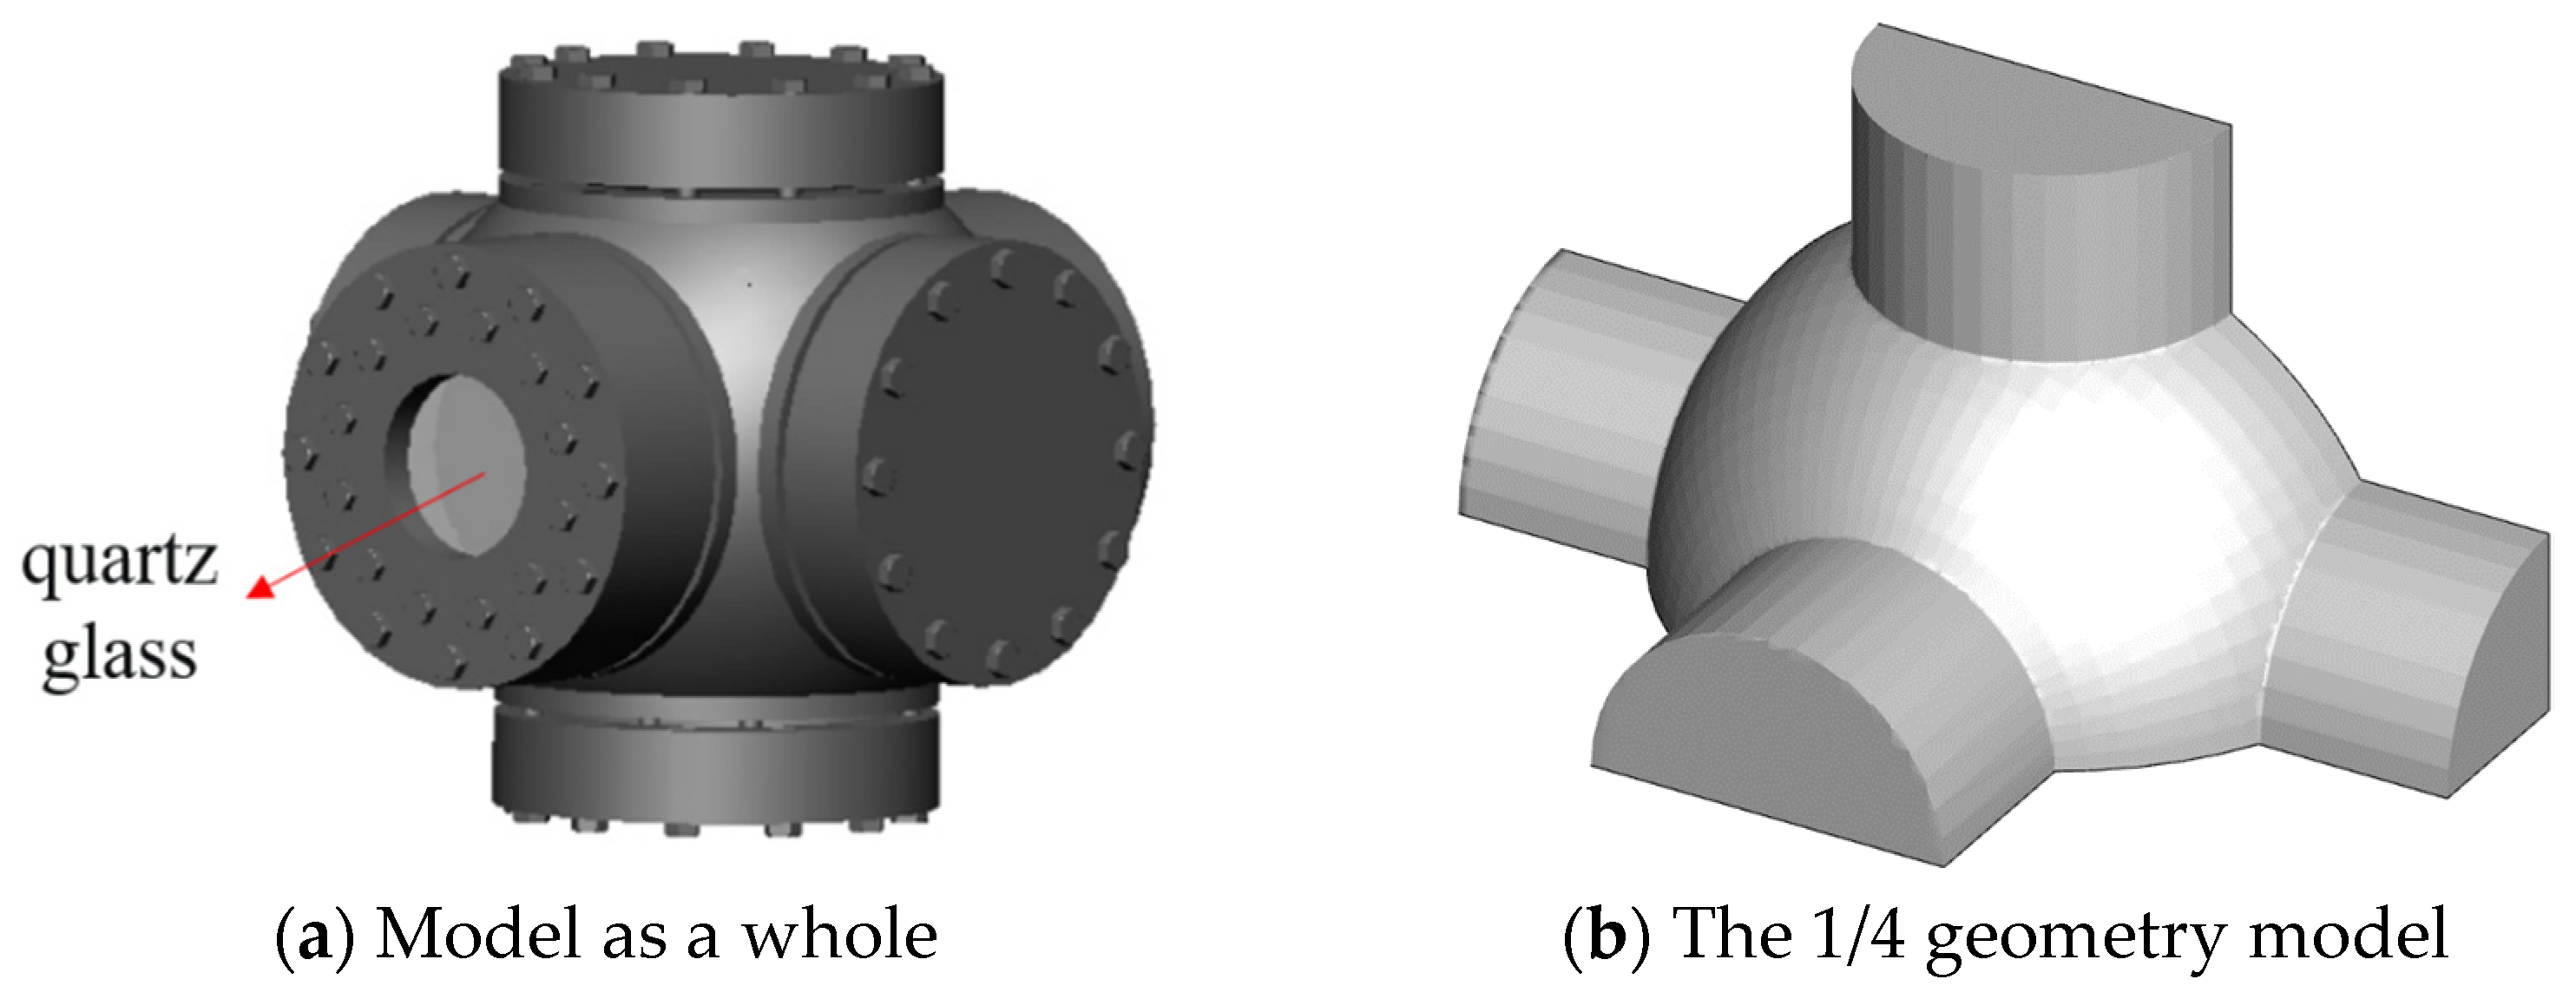
Figure 1. Three-dimensional model of constant volume combustion chamber.
Energies 16 07016 g001
Figure 2. Grid distribution near the flame front.
Energies 16 07016 g002
Figure 3. Grid refinement control near the ignition source.
Energies 16 07016 g003
Figure 4. Flame radius diagram.
Energies 16 07016 g004
Figure 5. Schematic diagram of boundary condition setting.
Energies 16 07016 g005
Figure 6. The test platform.
Energies 16 07016 g006
Figure 7. Comparison curve of combustion pressure.
Energies 16 07016 g007
Figure 8. Comparison of flame propagation image.
Energies 16 07016 g008
Figure 9. Comparison the flame radius.
Energies 16 07016 g009
Figure 10. The flame radius under different ignition methods.
Energies 16 07016 g010
Figure 11. Stretching flame propagation speed under different ignition methods.
Energies 16 07016 g011
Figure 12. The variation in stretched flame propagation speed with flame stretch rate under different ignition methods.
Energies 16 07016 g012
Figure 13. The combustion pressure and characteristic parameters under different ignition methods.
Energies 16 07016 g013
Figure 14. Heat release rate under different ignition methods.
Energies 16 07016 g014
Figure 15. Characteristic parameters of combustion process.
Energies 16 07016 g015
Figure 16. Velocity field distribution under different ignition methods.
Energies 16 07016 g016aEnergies 16 07016 g016b
Figure 17. The diagram of ignition source location.
Energies 16 07016 g017
Figure 18. Combustion pressure curve under different ignition position.
Energies 16 07016 g018
Figure 19. Heat rate curves under different ignition position.
Energies 16 07016 g019
Table 1. Experimental parameter setting.
Test ParametersValue
Initial temperature300 K
Initial pressure0.1 MPa
The equivalence ratio1.0
Ignition distance150 mm
Ignition energy200 mJ
High speed camera frequency5000 Hz
High speed camera pixel512 × 512
Pressure acquisition frequency5000 Hz
Disclaimer/Publisher’s Note: The statements, opinions and data contained in all publications are solely those of the individual author(s) and contributor(s) and not of MDPI and/or the editor(s). MDPI and/or the editor(s) disclaim responsibility for any injury to people or property resulting from any ideas, methods, instructions or products referred to in the content.