Abstract
Currently, quality air and renewable energy are main concerns in protecting the environment. Comparing willingness to pay for quality air and renewable energy is rare in the existing literature. However, the public faces these issues simultaneously. In addition, population mobility under China’s household registration system, i.e., urban living experience, may affect the willingness to pay for environmental protection. Consequently, the difference between people’s willingness to pay for quality air and renewable energy in China is discussed. Binary logistic regression is adopted to analyze the correlation factors based on data from the China General Social Survey. The results show that willingness to pay is influenced by environmental attitudes, awareness of energy use, government responsibilities, age, household income level, and trust. The effects of urban living experience on willingness to pay weakens as age decreases. Thus, improving environmental awareness and specialized knowledge remain important means of promoting willingness to pay. Our findings can help marketers and policy designers develop balanced or targeted measures when taking joint actions.
1. Introduction
The relationship between population and the environment is mutually influential, and demographic and household characteristic changes may have a more significant impact on energy emissions than technological changes, especially in developing countries, where there is more change [1]. Occupant differences can explain 50% of the difference in energy consumption of buildings, and the impact of human differences in energy-efficient buildings is even more significant [2]. The study of human intentions and behavior has always been a popular topic in energy conservation and mitigation.
Ali et al. pointed out that urbanization is positively correlated with carbon emissions and that carbon emission reductions without affecting industrialization can be achieved through applying clean technologies [3] and using renewable energies [4]. Policymakers should introduce effective regulation to encourage financial development and innovation measures in the clean energy sector to offset environmental damage [5]. Surveys of the public’s willingness to pay are a common basis for evaluating policies [6]. Breathing fresh air and using renewable energy are immediate needs and requirements. It is necessary to consider the willingness to pay for both at the same time.
Many studies focus on social and environmental interactions. This paper focuses on a comparative study of willingness to pay for quality air (WTP-QA) and willingness to pay for renewable sources electricity (WTP-RE) in the Chinese context.
China accounts for 18 percent of the world’s population. China has the largest amount of carbon dioxygen emissions [7], and it has undergone rapid urbanization over the past decades and has continued to grow [8]. According to the National Bureau of Statistics of China, at present, there is a 250 million intra-provincial floating population and 124 million inter-provincial floating population in China (the floating population refers to the population whose place of residence does not coincide with the registered place of residence and who have left the registered place of residence for more than six months) [9]. In China, most of the migration or residential relocation occurs as people move from rural areas to urban areas. Such massive energy consumption and urbanization rates, as well as massive populating movements, make China a key concern for the world to reduce carbon emissions.
In the context of China’s urban–rural dual structure, urban Hukou means higher explicit and implicit benefits such as education, working income, pension, and medical care [10]. Since the introduction of the Hukou in 1958, access to urban living experience (movement of persons with rural Hukou to the city) has been strictly controlled. With the initiation of economic reforms in 1978, China has gradually implemented the reform of the household registration system and relaxed the restrictions on the movement of people from rural to urban areas in small- and medium-sized cities [11]. Large cities such as Beijing and Shanghai have strict restrictions on settlement, such as the adoption of points-based settlement, which is only open to limited highly qualified people [12,13]. The impact of the household registration system is still very significant [14]. It is difficult to accurately characterize Chinese mobility using hukou or household registration place. Using 2006 survey data, Hu et al. found that permanent rural migrants were less than 1/10th of circular migrants [15]. After 10 years of development, the gap between permanent and circular migrants narrowed, with permanent migrants accounting for 30% of the total and circular migrants still in the majority [16]. This led to the fact that using whether one now lives in an urban or rural community to describe China’s population movements is also not accurate. This is coupled with the environmental behavioral perspective that past experiences have an impact on human behavior. Therefore, we propose to describe Chinese mobility in terms of urban living experience (ULE) and examine whether it is related to willingness to pay for environmental protection.
Similar to other studies on lived experiences [17,18,19], the influence of past experiences on present behavioral intentions is discussed, while slightly different from them, the urban living experiences in this paper focuses more on whether there is rural to urban movement, i.e., population mobility. The proposal to use urban living experience belongs to the innovation of this paper.
Other contributions of this study include the use of national-level statistics to explore willingness to pay, extending the scope of existing research. The similarities and differences in willingness to pay for quality air and renewable energy are compared. This study also explains the above differences.
The rest of this article is arranged below. The second part presents the literature review and hypotheses. The third part presents surveys, data, and methods. The fourth part shows the results of the study. Part five and six contain the discussion and conclusion.
2. Literature Review and Hypotheses
Interdependent metatheory assumes that human action is continually created, reinforced, or eroded by experiences and other factors [20]. Lewin’s equation points out that behavior is environmentally decided [21], although people tend to stick to their past patterns [22], such as the saving behaviors of the past will be carried over to the new environment [23], and residential relocation or considering relocation offer an opportunity to reform their behavior [24,25,26], according to habit discontinuity theory. There is a complex relationship between attitudes, habits, and behavior change. According to the planned behavior theory, attitudes are an important starting point for habit change [27]. The above studies illustrate that human behavioral intentions are influenced by environmental changes.
Changes have been found in that migration impacts energy consumption [28], transportation [29], and prosocial activities [30]. Population mobility is related to carbon emissions. The use of urban living experience to describe population mobility in China, which has been demonstrated in the previous section, is very rare in available studies on behavioral intentions.
At the same time, carbon emissions are higher in cities than in rural areas [31,32,33] and show regional differences [34,35,36]. Urban citizens are more willing to pay for environmental protection than rural villagers [35,36].
In different parts of China, residents’ willingness to pay is influenced by environmental perceptions and other factors, showing regional differences [36]. A survey of residents in China’s first-tier cities for recycling garbage showed that residents are willing to pay, but the cost is low [37]. Different spatial distribution of people have different energy consumption patterns, because people’s lifestyles determine where they live [34]. Fear of waste promotes sustainable behavior in people’s use of electricity [38]. Chinese people are frugal and not wasteful, and they are especially frugal in rural areas where resources are relatively poor. These studies conclude that carbon emissions, environmental awareness, and willingness to pay vary from place to place. Thus, how will people’s willingness to pay change after their movement experience?
Hypothesis 1.
Urban living experience influences people’s willingness to pay for quality air.
Hypothesis 2.
Urban living experience influences people’s willingness to pay for renewable energy.
The main theoretical basis for the study of willingness to pay is the theory of planned behavior and an extended theory of planned behavior that both consider various factors [39,40,41,42,43]. The study of willingness to pay has involved environmental protection [44,45], pollution prevention [46], garbage recycling [37], renewable energy [47,48,49,50,51], quality air [32,45,52,53,54], ecological consumption [36], urban parks [55], etc., and the factors affecting the willingness to pay include social–demographic characteristics, such as gender, age, income, education, professional status, household size, marital status, health, and happiness. It is also affected by attitudes, specific knowledge, payment experience, political trust, pollution, green energy conviction, environmental awareness, cost, social norms, etc. Living experience is seldom studied in the field of WTP.
Zhang et al. stated that air pollution would increase willingness to pay for environmental protection in China, while locals do not show differences because they are used to local pollution [45]. Guo et al. also stated that air pollution is a determinant factor to WTP-QA in China [56]. An empirical estimation in Pakistan points to the effect of political trust and health on WTP-QA [52]. Wang et al. stated that governmental credibility regarding air pollution prevention also influences WTP-QA [57]. One reason for the reluctance to pay for quality air is the perception that air quality is a social responsibility, not an individual issue [58], i.e., NIMBY syndrome (not in my backyard public attitude) [54]. Together, these studies point to air quality as being more of a public good at some distance from everyday life.
As for WTP-RE, suffering from electricity shortage [42,47] or investment in renewable energy is influential [47]. The type of renewable energy used to generate electricity can also make a difference in WTP-RE [59,60]. A study in Lithuania points out that WTP-RE has little to do with environmental issues, but environmental issues have an indirect effect on willingness to pay [61]. Along with WTP-QA, government involvement and awareness of benefits influence WTP-RE [62]. WTP-RE is more biased toward private sphere experiences and perceptions than WTP-QA.
Few studies have looked at the two different willingness-to-pay types at the same time, conducting comparative studies. Although there are studies of differences in willingness to pay between urban and rural populations, these are static studies. Studies comparing locals and nonlocals have mostly focused on a particular region, mainly in urban areas. There are also few studies that have looked at the impact of people’s past migration experiences and life experiences on their willingness to pay.
Environmental concerns are general attitudes and have different effects on different environmental behaviors, because determining a particular environmental behavior is determined by specific situational cognition [63]. Thus, respondents may show different preferences for quality air and renewable energy payments.
Hypothesis 3.
Willingness to pay for renewable energy is different from willingness to pay for quality air.
3. Materials and Methods
3.1. Survey
Because it contained the residential relocation situation and information on household energy consumption, CGSS [64] data was chosen for this study.
A newly published national survey conducted in China, the China General Social Survey (CGSS), was used. The first round of CGSS was launched in 2003. The 2018 CGSS primary survey covered 12,787 households from 29 provinces, municipalities directly under the central government; and autonomous region households, which are energy modules, covered 4147 households.
Several comparative advantages of using this general survey data are as follows: First, a larger sample size could be used. Despite the small size of the energy module, the effective samples are still significantly higher than most existing studies. Second, associations with general surveys provide richer information about personal characteristics, allowing us to evaluate different settings. It comprehensively covers the details of household energy consumption. The questionnaire of CGSS is used world wide, and thus, reliability and authority of the data are ensured. Therefore, it is the perfect data set to solve our problems.
After controlling for the missing values, the final valid sample size in our analysis was 3734. Among them, 1459 samples have no urban living experience, and 2275 samples have urban living experience.
Of those, 46% are male and 75% are married. Respondents averaged about middle school of education and 52 years of age. Descriptive statistics are listed in Table 1.

Table 1.
List of variables and descriptive statistics.
3.2. Measures
3.2.1. Willingness to Pay
Common methods for measuring WTP are experimental, direct, or indirect surveys, in which contingent valuation methods are widely used. Double-bounded dichotomous choice and open-ended measures are commonly used for WTP elicitation formats [65].
CGSS asked, “How much money are you willing to pay per month to ensure an increase of 1 day per month in the number of days with good air quality in 2018?” This is an open-ended measure. These questions were asked two more times assuming increases of 3 or 5 days.
This open-ended question allowed respondents to state their specific WTP.
Their answers varied from RMB 0 to 3050, and 754 respondents refused to answer or chose unsure how much to pay.
For households that were willing to pay for quality air and reported income (N = 1577, excluding values greater than 5 standard deviation), their yearly household income has an RMB 87900 mean value. The average cost paid for quality air was 195.81 RMB/month. y = 6.01x + 15.513, R2 = 0.9992; the formula was calculated based on respondents’ responses to the three questions of willingness to pay for quality air.
CGSS asked, “By now, every 100 kWh household electricity has 7 kWh produced from renewable energy sources. How much money are you willing to pay to increase your monthly electricity to 10 kWh using renewable energy sources every 100 kWh?” It is an open-ended measure. These questions were asked two more times assuming increases of 15 or 20 kWh.
Their answers varied from RMB 0 to 1000, and 795 respondents refused to answer or chose unsure how much to pay.
For households that were willing to pay for renewable energy generation and reported income (N = 1561, excluding values greater than 5 standard deviation), their yearly household income has an RMB 83,203 mean value. The average monthly electricity consumption was 156.94 kWh.
According to the 14th Five-year Plan for Renewable Energy Development, published by the National Development and Reform Commission of China [66], in 2030, the proportion of non-fossil energy consumption will reach about 25%.
If 25% of household electricity is generated from renewable sources, that is 39.23 kWh, they are willing to pay RMB 45.94 more per month. y = 0.807x + 14.744, R2 = 0.9999; the formula is calculated based on respondents’ responses to the three questions of willingness to pay for renewable energy.
Counting only the willingness to pay and wages will result in a large sample loss. Therefore, binary logistic regression was used to consider samples with no willingness to pay and uncertain samples at the same time to explore the differences.
In this research. having will or not, i.e., a choice, was studied for three reasons: First, there is a huge gap between having or not having an intention; thus, even some people answered only a small amount of money, which is different from others that said no or not sure. Second, China is a developing country, although it has megacities that are as developed as other developed countries, but throughout China, people share a low average GDP. Combined with the regional price differences, the same amount of money has a different value; thus, compare this amount does not fit our research aim. Thirdly, among 4147 respondents, 754 answered unknown or rejected to answer WTP-QA, and 795 respondents answered unknown or rejected to answer WTP-RE. Three groups of people were set: group W with a willingness to pay, who answered an exact amount of money above zero; group UW contained those that answered zero and have no willingness to pay; and group UC contained those that answered unknown or rejected to answer, such that their willingness was not certain. Group UC was half as large as the unwilling group (UW). After running the Bonferroni’s multiple comparisons test, we found that group UW and UC shared many similarities in many ways, and they are both different from group W. Eventually, the UC group and the UW group were combined to form a binary variable with the W group for WTP. Through this, we contained as many respondents as possible.
The aim of this study is to explore the relationship between urban living experience and willingness to pay. Migration in China is a cross-province movement; thus, the differences in different province were not considered.
Intention to pay was low, with 54.8% giving a negative or no response. Figure 1 plots the results of how many people are willing to pay by age group, urban living experience and other categories. Overall, the 18–29 years age group had the highest aspirations, with 58.0% of respondents indicating an intention to pay for quality air, which gradually decreased with age. The overall trend is that as the age decreases, people in cities experience more willingness to pay.
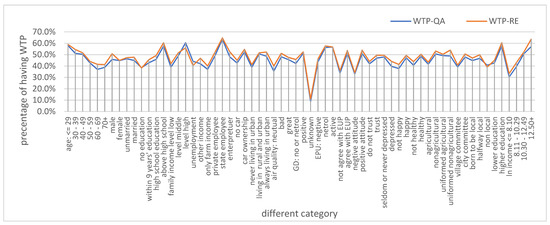
Figure 1.
Line chart of percentage of WTP-QA and WTP-RE in each category.
WTP possibility declines with age, with respondents below 30 declaring the highest possibility. Possibility rises with education, social strata, and agree that government needs to do more. People with high incomes are more willing to pay than people with lower incomes. Happy respondents are more willing to pay. Women are more unwilling to pay than men. Married respondents are more willing to pay than unmarried respondents. People with jobs are more willing to pay.
Only 10% of people in the category of having no idea about the government’s duty showed willingness to pay. Low-income respondents showed little willingness to pay.
3.2.2. Urban Living Experience
China is one of the few countries in the world that still has a Hukou system, and despite the issuance of the Hukou Reform in 2014, the social benefits behind the Hukou have not completely changed [11].
Having urban living experience has a lot to do with Hukou. However, with the change in the management of the migrant population, the urban living experience and Hukou relationship are different.
There was a significant difference between the type of household registration and whether the respondents’ residence belonged to a village committee or a city committee (Figure 2b). Among the locals surveyed, the largest number of people had agricultural Hukou (Figure 2c), while most of the locals lived in city committees (Figure 2a). Most of them are concentrated in city committees, indicating that the direction of population movement is concentrated in city committees. There is an intersection between these classifications, and one cannot simply divide the urban and rural populations by registration or place of residence. Likewise, the local or non-local division does not reflect the direction of respondents’ mobility (Figure 2a,c). However, using the presence or absence of urban living experience, and the three categories: respondent with no urban living experience, respondent with rural and urban living experience and respondent with only urban living experience, could include all respondents who have moved or worked from rural to urban areas.
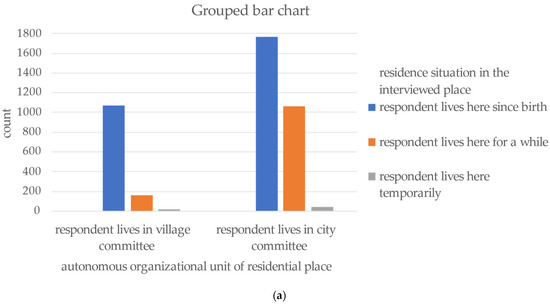
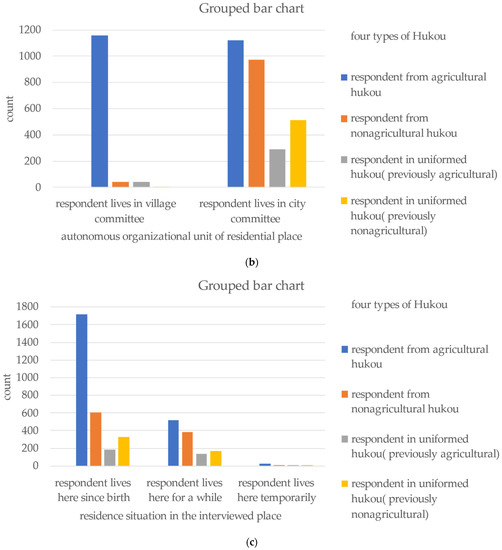
Figure 2.
Grouped bar chart of Hukou, unit, and local or not. (a) Autonomous organizational unit of residential place by residence situation in the interviewed place. (b) Autonomous organizational unit of residential place by four types of Hukou. (c) Residence situation in the interviewed place by four types of Hukou.
The population flow here considers the flow of population from rural to urban in line with most of China’s conditions, plus the rural-to-urban flow is periodic and incomplete, and the division of urban experience blurs the boundaries, focusing on exploring the experience of mobility, moving, and living in a different place.
CGSS asked “How many years have you been in the city from 14 years old?”.
Answers varied from 0 to 99, in which 99 means do not know, 98 is refuse to answer, 97 means have always been in the city, 96 means never lived in the city. In total, 56 respondents choose not to answer the question.
We categorized those who answered 0 and 96 as the group with no urban living experience, 97 as the group that has been living in the city, 98 and 99 were discarded from the sample, and the other numbers from 1–95 were the group that lived in the city halfway. The variable of urban experience is classified into three groups.
3.2.3. Other Variables
Sociodemographic and economical characteristics (SDC) include age, gender, education level, marital status, household income, employment economic activity, car ownership, and self-reported household income level.
Related variables are specific knowledge or attitude on energy. According to the Theory of Planned Behavior, intention is controlled by three different beliefs, which is behavioral attitude and normative and control belief [67,68,69,70]. Respondent’s attitude, energy cognition, which is their awareness of energy usage causing pollution (EUP), and policy understanding (EPU) are under review. As quality air is a public product, it is part of the government’s responsibility. The government needs to do more to calculate how respondents think of the responsibility of government (GD). At the same time, respondent’s view on air quality is also in this category; refer to Appendix Table A1: Environmental attitudes and energy understanding questions in the CGSS.
Mood variables are respondent’s mindset when they are answering the questionnaire. It is their view on social trust, depression, happiness and health.
Location variables are factors such as ULE, as mentioned before, Hukou, ULE, unit and local. Their classifications are intertwined with each other. This is used to evaluate the ULE. By replacing the position and order, the similarities and differences of their influence effects were examined in the model.
KMO and Bartlett’s test was performed for the factors selected for analysis. The KMO measure of sampling adequacy was 0.753 (larger than 0.7), and the p value of the Bartlett’s test of sphericity was less than 0.001. The validity analysis met the requirements.
The correlations of the factors were analyzed using the Spearman’s rho test. The results showed that gender, marital status, household size, air quality, and local or not were not related to WTP-QA in this study. Gender was related to WTP-RE. Similarly, marital status, household size, air quality, and local or not were not related to WTP-RE. Respondent’s perception of government responsibilities was also unrelated to WTP-RE. Other unmentioned factors were related to WTP.
3.3. Method
Articles used to analyze the willingness to pay for a particular type of environmental protection are often based on an extended theory of planned behavior, using structural equation modeling or OLS regression models [23,44,46,49,52]. A spike model is also often employed when there are a large number of zero responses for willingness to pay [71,72,73]. This study focused on a comparative study of willingness to pay for quality air and willingness to pay for renewable energy, hoping to find as many factors as possible and to discover which of them are the ones that play a more significant role. The purpose of this study is to discover the different factors as well.
Binary logistic regression fits our needs. The empirical model is based on existing research [47,74,75] and incorporates urban living experiences. Regression analysis was used to study factors influencing WTP, as we take WTP as a binary dependence, 1 for having WTP, and 0 for other (no or unsure).
Many influencing factors affect residents’ willingness to pay for renewable energy and quality air, including personal characteristics, social characteristics, and policy factors.
The process of analysis is summarized in Figure 3. We used blocks to add variables to the binary logistic regression model. Maximum likelihood was stepwise approached. The model can always replace an existing variable with a new one if the regression works better.
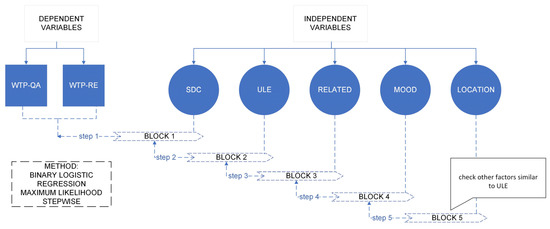
Figure 3.
Flowchart of analysis.
Block 1 includes SDC factors: age, gender, marriage, education, income, employment, car, and family income level.
Block 2 contains ULE. This article focuses on urban living experience. Take the absence of urban living experience as a reference.
Block 3 includes relevant variables that have a significant impact on WTP: air quality, GD, EPU, EUP, and attitude.
Block 4 covers mood variables that refer to the respondent’s state of body and mind when answering the questionnaire: trust, depression, happiness, health.
Block 5 includes location variables that are ULE similar but with different classifications: local or not, Hukou, and unit.
4. Results
This study uses binary logistic regression analysis to calculate the probability of willingness to pay for quality air and renewable energy.
A logistic regression was completed to determine the relationship between the respondents’ background variables (gender, year group, education, wealth, and knowledge), urban living experience and willingness to pay. The results of WTP-QA are presented in models 1 to 5 of Table 2. The results of WTP-RE are presented in models 1 to 5 of Table 3.
Table 2.
Logistic regression of variables with WTP-QA.
Table 3.
Logic regression of variables with WTP-RE.
4.1. Regression Results of Willingness to Pay for Quality Air
In model 1, age has a negative effect on WTP-QA, household income increases WTP-QA, and compared to unemployment students, or retired with no income respondents, respondents only have farming income shows less willing. Self-reported family income level has positive correlation with WTP-QA.
There was no significant association between gender or marital status and willingness to pay. Overall, respondents’ background explains little (5.9%) of the variance in willingness to pay.
Table 2 model 2 adds the urban living experience factor scores, and this increases the explanatory power of the model a little for around 0.4% of the variance. People who are halfway ULE are 1.3 times likely to pay than those with no ULE.
Model 3 adds related factors, four factors’ scores had significant associations with willingness to pay: high “air quality”, “EUP”, “attitude”, and “unknown GD” (p < 0.05 in all cases). Respondents who answered unknown about GD are 4.2 times less willing to pay than those that answered no about GD. There was no significant association between EPU and willingness to pay. The positive relationship between household income and WTP becomes insignificant. This increases the explanatory power of the model for around 4.3% of the variance.
Model 4 adds mood factors, two factors’ scores had significant associations with willingness to pay: high “trust”, and low “depression”(p < 0.05 in all cases). Happiness can promote WTP, but the association is not statistically significant. There was no significant association between health and willingness to pay. This increases the explanatory power of the model for around 0.6% of the variance.
Model 5 adds location factors such as ULE; no one had significant associations with willingness to pay. The model variance stays the same as model 4.
WTP-QA is significantly related to age, awareness of energy use cause pollution, agreement with government duty, attitude, family income level, urban living experience, trust, and depression.
Hypothesis 4.
Urban experience influences people’s willingness to pay for quality air.
Verified and holds. The resulting logistic model is statistically significant, urban living experience is related to the willingness to pay for quality air, and people with urban living experience are 1.3 times more willing to pay for quality air than people without urban living experience. Figures are shown in Table 2.
4.2. Regression Results of Willingness to Pay for Renewable Energy
In model 1, age has a negative effect on WTP-RE, household income increases WTP-RE, and women are less willing to pay than men. Compared to unemployment students, or retired with no income respondents, respondents who are state employee or retired show higher willingness. Self-reported family income middle level has positive correlation with WTP-RE than low-level respondents.
There was no significant association between marital status or household size and willingness to pay. Overall, respondents background explains little (5.3%) of the variance in willingness to pay.
Table 3 model 2 adds the urban living experience factor scores; nothing had significant associations with willingness to pay. The model variance stayed the same as in model 1.
Model 3 adds related factors, three factors’ scores had significant associations with willingness to pay: “EUP”, “attitude”, and “unknown GD” (p < 0.05 in all cases). Respondents who answered unknown about GD are 3.3 times less willing to pay than those who answered no about GD. There was no significant association between air quality or EPU and willingness to pay. The positive relationship between household income and WTP becomes insignificant. This increases the explanatory power of the model for around 4.3% of the variance.
Model 4 adds mood factors, only one factor’s scores had significant associations with willingness to pay: high “trust” (p < 0.05 in all cases). There was no significant association between health, happiness or depression with willingness to pay. This increases the explanatory power of the model for around 0.3% of the variance.
Model 5 adds location factors such as ULE; no one had significant associations with willingness to pay. The model variance stayed the same as in model 4.
WTP-RE is significantly related to attitude, age, agreement with energy use causing pollution, trust, family income level, and gender.
Hypothesis 5.
Urban experiences influence people’s willingness to pay for renewable energy.
It does not hold.
The resulting logistic model is statistically significant; urban living experience is not related to the willingness to pay for renewable energy. Figures are shown in Table 3.
4.3. Difference between Willingness to Pay for Quality Air and Renewable Energy
Hypothesis 6. Willingness to pay for renewable energy is different from willingness to pay for quality air.
Verified and holds.
Applying the Chi-square test, it shows x2 = 1828.7, df = 1, p < 0.0001, meaning the distributions of different values across willingness to pay for quality air and renewable energy are not equally likely. Willingness to pay for quality air and renewable energy has differences. There was a statistically significant difference in people’s preferences for the two willingness to pay types. Phi value was 0.664. There is a statistical correlation between the two willingness to pay types, and the degree of correlation is strong.
Using the same independent variables for regression analysis, the equation for air willingness to pay has urban experience, but energy willingness to pay does not. Moreover, energy payments are related to gender. The two willingness to pay types are different and partly influenced by a variety of factors. It may also have something to do with the fact that air is a public good.
5. Discussion
5.1. SDC Differences
Willingness to pay is related to age. This coincides with other studies. Older people have less WTP. Robustness tests were performed using a change-factor approach. Change in age group and education level were two independent factors. In addition, regarding change in urban living experience as a binary variable, the results stay robust. Table A2 and Table A3, model 8, showed the results including all factors at once without block.
Table A2 and Table A3, model 6 and model 7, showed the same results. Regarding age above 40, urban living experience still affects their willingness to pay for quality air.
Respondents aged above 40, or born before 1978, which is the year China started reform and opened up, were given many chances and opportunities to move. It was also the release of the Hukou system. As to WTP-RE, for those aged above 40, ULE also has a significant positive effect. It can be seen from the urban living experience that it is a positive factor to these respondents of that age.
Table A2 and Table A3 show the test of all variables entering the regression at the same time, with the respondents divided by below 40 and by other.
Table A2, model 6 showed The tables show that ULE has little effect on ages below 40, which is very reasonable. On the other hand, along with the opening up of China, urban living experience is no longer a significant positive factor; it is a good sign that the government should carry on opening up.
Males tend to pay more than females [76]. In this study, gender only has a negative effect on willingness to pay for renewable energy. WTP-RE is correlated with gender, which may be due to the moderating role of gender [48,77,78]. There is also literature that discusses that women spend money more cautiously. Female-dominated households consume less energy and tend to be greener [79].
A Nigerian study correlates marital status with WTP-RE [50]. However, marital status was not associated with WTP-QA or WTP-RE in this study. This is consistent with the findings of Xie and Zhao [76].
Education can improve the environmental sustainability of a region and reduce CO2 emissions [80]. Education is an important factor influencing willingness to pay in many studies. However, it did not enter the binary logistic regression. This does not suggest that it was less important, but simply that other factors were more significant than education in this study.
5.2. Urban Living Experience and Willingness to Pay for Quality Air
The hierarchical chi-square test was used to evaluate the connection between ULE and WTP-QA under different circumstances.
This study analyzes the association between ULE and WTP-QA under different trust conditions and uses a hierarchical chi-square test. The ratio test showed that p < 0.05, indicating that the OR values between the layers were heterogeneous. Stratified by trust, the correlation between ULE and WTP-QA was statistically significant among people who trust, with an OR of 1.763 (95% CI 1.509~2.061), X2 = 51.266, and p < 0.001. Among people who do not trust, there is no significant correlation between ULE and WTP-QA.
Similarly, stratified by air quality, the correlation between ULE and WTP-QA was statistically significant among people who felt good about air quality, with an OR of 1.787 (95% CI 1.532~2.084), X2 = 55.123, p < 0.001. Among people who felt good that air quality is bad or normal, there is no significant correlation between ULE and WTP-QA.
Stratified by energy policy understanding, the correlation between ULE and WTP-QA was statistically significant among people in the negative group, with an OR of 1.584 (95% CI 1.382~1.815), X2 = 43.914, and p < 0.001. Among people who felt positive, there is no significant correlation between ULE and WTP-QA.
Stratified by Hukou, the correlation between ULE and WTP-QA was statistically significant among people who are agricultural Hukou, with an OR of 1.590 (95% CI 1.337~1.892), X2 = 27.630, and p < 0.001. Among people with another Hukou, there is no significant correlation between ULE and WTP-QA.
ULE is more likely to influence people who feel social trust, believe the air quality is good where they live, know less about energy policies, and have an agricultural hukou. Having urban living experience can increase the willingness to pay for quality air for these people. In these cases, WTP-QA can be increased by promoting people to have an urban living experience, including work or study in urban areas.
One explanation is that having urban living experiences allows for a larger reference sample than in rural areas where the reference group is narrow and local. Both anthropological studies [81,82] and evolutionary studies in zoology [83] have found that people or mammals raised in cities have a better sense of adventure and the ability to learn. Ju noted that those employed in urban nonfarm jobs exhibited more sewage disposal behavior than those employed in local nonfarm jobs [84]. Le and Nakagawa pointed out that workers who leave home to work are more pro-social when they return home [30]. That means the urban living experience has brought positive effects.
Combined with the early study in the literature review, quality air is more of a public good, while electricity is more of a private sphere. Therefore, urban living experience retains a significant impact on willingness to pay for quality air among many other factors.
5.3. Connections
The hierarchical chi-square test was used to evaluate connections between WTP-QA, WTP-RE and ULE.
The two willingness to pay types are related. To discuss whether ULE increases WTP-QA, a controlled study was designed that treated WTP-RE as a confounding factor, considering the correlation between WTP-RE and WTP-QA. The ratio test showed p < 0.05, indicating that the OR values between the layers were heterogeneous. Stratified by willingness to pay for renewable energy, the correlation between urban experience and willingness to pay for quality air was statistically significant among people without willingness to pay for renewable energy, with an OR of 1.700 (95% CI 1.311~2.204), X2 = 16.299, and p < 0.001. Among people who are willing to pay for renewable energy, there is no significant correlation between urban experience and willingness to pay for quality air.
Stratified by WTP-QA, the correlation between ULE and WTP-RE was statistically significant among people who are in the negative group, with an OR of 1.580 (95% CI 1.259~1.983), X2 = 15.752, and p < 0.001. Among people who felt positive, there is no significant correlation between ULE and WTP-RE.
Abdullah and Jeanty noted that people are more willing to pay for grid power than for PV power [59]. People gravitate toward what they are familiar with [85]. Electricity use is a daily exposure, while air pollution is not always being exposed to nor are people aware of its importance. This is probably why people are more willing to pay for renewable energy than for quality air.
6. Conclusions and Policy Implication
6.1. Conclusions
Based on the frontier hotspots of population and the environment, this study discusses the similarities and differences in willingness to pay for quality air and renewable energy. Both willingness to pay types are influenced by environmental attitudes, awareness of energy use, government’s duty, age, household income level, and trust. WTP-QA is also influenced by urban living experience, occupational economic activity, and emotional state. Gender and Hukou affect WTP-RE. The willingness to pay for quality air is influenced by more factors.
Urban living experiences have an impact on people’s willingness to pay, and this effect remains significant after controlling for people’s awareness of air quality, energy, and income levels. The migration of people to cities is of excellent value for both personal development and social development. Exploratory research conducted against the background of the China General Social Survey has obtained preliminary and effective positive results and may well dispel the public’s doubts about the various problems that relaxation of household restrictions on the floating population will bring. Our research also shows that more young people have urban living experiences. The restriction of flow in China is gradually weakening.
6.2. Policy Implication
The results showed a lower WTP for quality air than for renewable energy. Willingness to pay for renewable energy is more acceptable and can be boosted by increasing it to promote willingness to pay for quality air. Willingness to pay for quality air is related to more factors and can be promoted by enhancing all aspects. The multifaceted impacts of targeted measures need to be considered when developing policy measures.
In China, urbanization in large cities is more rapid than in small cities. Measures to promote the movement of people to cities should be continuously strengthened, such as government public rental housing. Enhancing the movement of people to cities and promoting various types of people to live and work in cities is good for the overall functioning of the city and for increasing the willingness to pay for environmental protection.
The popularity of energy-saving policies should be enhanced to raise public awareness. The type of resources varies from region to region in China, and local policies should be developed accordingly.
6.3. Limitations and Further Research
Even with these explanations, this study is not involved in revealing the mechanics of how urban living experience works. The experience of urban life may represent income, education, energy use patterns, understanding of energy policies, etc., but interactions between changes in social norms caused by migration on energy demand and energy conservation behavior should be further grasped. Impact mechanisms also need to be further explored.
CGSS is panel data, and further research may use longitudinal data and may consider the possible impact of the period and length of urban living experience.
Considering that population movements within China cross provincial boundaries, future research could assign regional differences to cities where people obtain urban living experience.
Education and willingness to pay are statistically significant correlations, but education does not enter the regression equation, one reason being that the general level of education is low (mean education in years is 8.6, nearly 6 years of primary school and 3 years of middle high school). Meanwhile the mean value of understanding energy policies is only 1.15, with a standard deviation of 0.4, ranging from 1 for “do not know” to 3 for “know”. Respondents do not have enough knowledge regarding energy. If they do not, their answers may not reveal their true preferences [86]. Future research could explore the effects of low knowledge levels.
Author Contributions
Conceptualization, methodology, software, validation, writing—original draft preparation, R.Z. Conceptualization, supervision, writing—review and editing, H.F. Software, visualization, writing—review and editing, Y.L. and Y.W. All authors have read and agreed to the published version of the manuscript.
Funding
This research received no external funding.
Institutional Review Board Statement
Not applicable.
Informed Consent Statement
Not applicable.
Data Availability Statement
The data used in the paper are all from the “China General Social Survey (CGSS)” project hosted by the China Survey and Data Center of Renmin University of China. http://cgss.ruc.edu.cn. Downloaded on 29 December 2021.
Acknowledgments
The authors thank the Center of Renmin University of China, and the respondents who answered the questionnaires of CGSS. Our gratitude goes to the anonymous reviewers and editors as well.
Conflicts of Interest
The authors declare no conflict of interest.
Appendix A
The following table lists the environmental and energy awareness issues in the CGSS. Respondents answered these questions on the agree-or-disagree five-point Likert scale. The inconclusive or rejected responses were retained in the responses, classifying the two responses in addition to the five-point scale to preserve as many samples as possible. The original answers were recoded so that people’s responses scored the highest and most consistent with the description. The second column of the following table indicates the names of the variables used in the text.
Table A1.
Environmental attitudes and energy understanding questions in the CGSS.
Table A1.
Environmental attitudes and energy understanding questions in the CGSS.
| Original Question | Variable Name |
|---|---|
| To protect the environment, humans should sacrifice some money. | attitude |
| The government should impose additional taxes on energy products to limit energy consumption. | government’s duty (GD) |
| The government should introduce some mandatory policies to restrict the consumption of certain energy products. | |
| Personal efforts in saving energy and protecting the environment are limited. | |
| How much do you agree or disagree with the following: Energy use is the main cause of acid rain. | energy using cause pollution (EUP) |
| Energy use is the main cause of smoggy days. | |
| Energy use is the main cause of the greenhouse effect. | |
| Different types of energy products cause different levels of pollution. | |
| The air quality is good where I live. | air quality |
Appendix B
Robust tests results are listed in models 6, 7, and 8.
Table A2.
Robust test of WTP-QA.
Table A2.
Robust test of WTP-QA.
| Model 5 | Model 6 | Model 7 | Model 8 | |
|---|---|---|---|---|
| Variable | Block 5 | Below 40 | Above 40 | All |
| age | 0.987 ** 1 | 0.961 ** | 0.984 ** | 0.987 ** |
| ln(household income + 2) | 1.029 | - | - | - |
| employment economic active: ref. no work and no income | * | ** | - | * |
| no work income but other income | 0.874 | 2.248 | - | 0.921 |
| only farm income | 0.767 * | 0.511 * | - | 0.809 |
| private employee | 0.843 | 0.743 | - | 0.891 |
| state employee and retired from it | 1.304 | 1.533 | - | 1.391 |
| entrepreneur | 0.790 | 0.652 | - | 0.825 |
| family income level: ref. level: low | ** | - | ** | ** |
| level middle | 1.214 * | - | 1.312 ** | 1.235 ** |
| level high | 1.744 ** | - | 2.136 ** | 1.826 ** |
| ULE: ref. never living in urban | * | - | ** | * |
| halfway urban | 1.295 ** | - | 1.400 ** | 1.294 * |
| always urban | 1.128 | - | 1.218 * | 1.120 |
| air quality: ref. neither good nor bad | * | - | - | |
| bad | 1.219 | 0.509 * | - | - |
| great | 1.360 * | 1.092 | - | - |
| agree with government needs to do more: ref. no or neutral | ** | ** | ** | |
| positive | 1.142 | 1.262 | 1.121 | 1.157 * |
| unknown | 0.245 ** | 0.000 | 0.269 ** | 0.254 ** |
| energy policy understanding: ref. negative | - | ** | - | - |
| neutral | - | 1.979 ** | - | - |
| active | - | 2.293 | - | - |
| energy use cause pollution: agree | 1.471 ** | - | 1.517 ** | 1.485 ** |
| attitude positive | 1.413 ** | 1.545 * | 1.443 ** | 1.448 ** |
| trust | 1.187 * | 1.342 * | - | 1.199 * |
| depression | 0.847 * | - | - | 0.839 * |
| happiness | 2.183 | - | 1.280 * | 1.198 * |
| Nagelkerke R square | 11.20% | 12.20% | 9.60% | 10.90% |
| x2 | 320.215, df = 20, p < 0.0001 | 86.246, df = 14, p < 0.0001 | 205.262, df = 10, p < 0.0001 | 312.546, df = 17, p < 0.0001 |
| overall percentage correct | 62.0 | 57.4 | 61.7 | 61.9 |
Notes: data are from CGSS, some classifications were combined. 1 number is odds ratio and ** is p < 0.01, * p < 0.05.
Table A3.
Robust test of WTP-RE.
Table A3.
Robust test of WTP-RE.
| Model 5 | Model 6 | Model 7 | Model 8 | |
|---|---|---|---|---|
| Variable | Block 5 | Age Below 40 | Age Above 40 | All |
| Age | 0.988 ** 1 | - | 0.985 ** | 0.987 ** |
| gender—female | 0.850 * | - | 0.766 * | 0.842 * |
| education | 1.001 | - | - | - |
| income | 1.040 * | 1.097 * | - | 1.037 |
| employment: ref. student, unemployment, retired no money | * | * | - | - |
| no work income but other income | 1.235 | 1.388 | - | - |
| only farm income | 0.972 | 0.466 ** | - | - |
| private employee | 1.116 | 0.650 * | - | - |
| state employee and retired from it | 1.798 ** | 1.177 | - | - |
| entrepreneur | 1.124 | 0.648 | - | - |
| household size | - | 0.891 ** | - | - |
| income level: ref. level low | * | - | ** | * |
| level middle | 1.214** | - | 1.324 ** | 1.207 * |
| level high | 1.205 | - | 1.284 | 1.155 |
| GD: ref. disagree that government needs to do more | ** | - | ** | ** |
| agree that government needs to do more | 1.013 | - | 1.001 | 0.998 |
| unknown | 0.306 ** | - | 0.361 ** | 0.319 ** |
| EPU | - | - | - | - |
| EUP agree with energy use causes pollution | 1.473 ** | - | 1.491 ** | 1.463 ** |
| attitude: positive | 1.653 ** | 2.059 ** | 1.660 ** | 1.662 ** |
| trust: trust | 1.249 ** | - | 1.200 * | 1.211 * |
| happiness | - | 1.674 ** | - | 1.188 |
| four types of Hukou: ref. agricultural | - | - | ** | ** |
| nonagricultural | - | - | 1.298 ** | 1.236 * |
| uniformed used to be agricultural | - | - | 1.336 * | 1.293 |
| uniformed used to be nonagricultural | - | - | 1.610 ** | 1.417 ** |
| Nagelkerke R square | 9.90% | 8.30% | 9.40% | 10.00% |
| x2 | 282.773, df = 16, p < 0.0001 | 57.199, df = 9, p < 0.0001 | 200.670, df = 14, p < 0.0001 | 284.473, df = 14, p < 0.0001 |
| overall percentage correct | 61.0 | 54.7 | 60.8 | 61.2 |
Notes: data are from CGSS, some classifications were combined. 1 number is odds ratio and ** means p < 0.01, * p < 0.05.
References
- De Sherbinin, A.; Carr, D.; Cassels, S.; Jiang, L. Population and Environment. Annu. Rev. Environ. Resour. 2007, 32, 345–373. [Google Scholar] [CrossRef] [PubMed]
- Van den Brom, P.; Hansen, A.R.; Gram-Hanssen, K.; Meijer, A.; Visscher, H. Variances in Residential Heating Consumption—Importance of Building Characteristics and Occupants Analysed by Movers and Stayers. Appl. Energy 2019, 250, 713–728. [Google Scholar] [CrossRef]
- Ali, K.; Bakhsh, S.; Ullah, S.; Ullah, A.; Ullah, S. Industrial Growth and CO2 Emissions in Vietnam: The Key Role of Financial Development and Fossil Fuel Consumption. Environ. Sci. Pollut. Res. 2021, 28, 7515–7527. [Google Scholar] [CrossRef]
- Ali, K.; Jianguo, D.; Kirikkaleli, D. Modeling the Natural Resources and Financial Inclusion on Ecological Footprint: The Role of Economic Governance Institutions. Evidence from ECOWAS Economies. Resour. Policy 2022, 79, 103115. [Google Scholar] [CrossRef]
- Jianguo, D.; Ali, K.; Alnori, F.; Ullah, S. The Nexus of Financial Development, Technological Innovation, Institutional Quality, and Environmental Quality: Evidence from OECD Economies. Environ. Sci. Pollut. Res. 2022, 29, 58179–58200. [Google Scholar] [CrossRef]
- Streimikiene, D.; Balezentis, T.; Alisauskaite-Seskiene, I.; Stankuniene, G.; Simanaviciene, Z. A Review of Willingness to Pay Studies for Climate Change Mitigation in the Energy Sector. Energies 2019, 12, 1481. [Google Scholar] [CrossRef]
- Wang, Y.; Guo, C.; Du, C.; Chen, X.; Jia, L.; Guo, X.; Chen, R.; Zhang, M.; Chen, Z.; Wang, H.; et al. Carbon Peak and Carbon Neutrality in China: Goals, Implementation Path, and Prospects. China Geol. 2021, 4, 720–746. [Google Scholar] [CrossRef]
- Ning, Y.; Liu, S.; Zhao, S.; Liu, M.; Gao, H.; Gong, P. Urban Growth Rates, Trajectories, and Multi-Dimensional Disparities in China. Cities 2022, 126, 103717. [Google Scholar] [CrossRef]
- Ning, J. Main Data of the Seventh National Population Census 2021. Available online: http://www.stats.gov.cn/english/PressRelease/202105/t20210510_1817185.html (accessed on 30 December 2022).
- Song, Y. What Should Economists Know about the Current Chinese Hukou System? China Econ. Rev. 2014, 29, 200–212. [Google Scholar] [CrossRef]
- Wing Chan, K.; Buckingham, W. Is China Abolishing the Hukou System? China Q. 2008, 195, 582–606. [Google Scholar] [CrossRef]
- Sheng, Y.; Zhao, M. Regulations in the Era of New-type Urbanisation and Migrant Workers’ Settlement Intentions: The Case of Beijing. Popul. Space Place 2021, 27, e2394. [Google Scholar] [CrossRef]
- Zhang, L.; Tao, L. Barriers to the Acquisition of Urban Hukou in Chinese Cities. Environ. Plan. Econ. Space 2012, 44, 2883–2900. [Google Scholar] [CrossRef]
- Wu, W. Sources of Migrant Housing Disadvantage in Urban China. Environ. Plan. Econ. Space 2004, 36, 1285–1304. [Google Scholar] [CrossRef]
- Hu, F.; Xu, Z.; Chen, Y. Circular Migration, or Permanent Stay? Evidence from China’s Rural–Urban Migration. China Econ. Rev. 2011, 22, 64–74. [Google Scholar] [CrossRef]
- Che, L.; Du, H.; Jin, X.; Feldman, M.W. How Family Living Arrangements and Migration Distances Shape the Settlement Intentions of Rural Migrant Workers in China. Int. J. Environ. Res. Public Health 2022, 19, 16308. [Google Scholar] [CrossRef]
- Lane, A.M. “I Grew Up a Working-Class Evangelical”: Lived Experience, Intersubjectivity, and Ethnography. SAGE Open 2014, 4, 1–8. [Google Scholar] [CrossRef]
- Donges, W. A Qualitative Case Study: The Lived Educational Experiences of Former Juvenile Delinquents. Qual. Rep. 2015, 20, 1009–1028. [Google Scholar] [CrossRef]
- Falvo, I.; Zufferey, M.C.; Albanese, E.; Fadda, M. Lived Experiences of Older Adults during the First COVID-19 Lockdown: A Qualitative Study. PLoS ONE 2021, 16, e0252101. [Google Scholar] [CrossRef]
- Eyster, H.N.; Satterfield, T.; Chan, K.M.A. Why People Do What They Do: An Interdisciplinary Synthesis of Human Action Theories. Annu. Rev. Environ. Resour. 2022, 47, 725–751. [Google Scholar] [CrossRef]
- Sansone, C.; Morf, C.C.; Panter, A.T. (Eds.) The Sage Handbook of Methods in Social Psychology; Sage Publications: Thousand Oaks, 2004; ISBN 978-0-7619-2535-4. [Google Scholar]
- Fatmi, M.R.; Habib, M.A. Modelling Mode Switch Associated with the Change of Residential Location. Travel Behav. Soc. 2017, 9, 21–28. [Google Scholar] [CrossRef]
- Wang, Y.; Lin, B.; Li, M. Is Household Electricity Saving a Virtuous Circle? A Case Study of the First-Tier Cities in China. Appl. Energy 2021, 285, 116443. [Google Scholar] [CrossRef]
- Verplanken, B.; Walker, I.; Davis, A.; Jurasek, M. Context Change and Travel Mode Choice: Combining the Habit Discontinuity and Self-Activation Hypotheses. J. Environ. Psychol. 2008, 28, 121–127. [Google Scholar] [CrossRef]
- Curl, A.; Kearns, A.; Macdonald, L.; Mason, P.; Ellaway, A. Can Walking Habits Be Encouraged through Area-Based Regeneration and Relocation? A Longitudinal Study of Deprived Communities in Glasgow, UK. J. Transp. Health 2018, 10, 44–55. [Google Scholar] [CrossRef] [PubMed]
- Ralph, K.M.; Brown, A.E. The Role of Habit and Residential Location in Travel Behavior Change Programs, a Field Experiment. Transportation 2019, 46, 719–734. [Google Scholar] [CrossRef]
- Verplanken, B.; Orbell, S. Attitudes, Habits, and Behavior Change. Annu. Rev. Psychol. 2022, 73, 327–352. [Google Scholar] [CrossRef] [PubMed]
- Shen, H.; Tao, S.; Chen, Y.; Ciais, P.; Güneralp, B.; Ru, M.; Zhong, Q.; Yun, X.; Zhu, X.; Huang, T.; et al. Urbanization-Induced Population Migration Has Reduced Ambient PM2.5 Concentrations in China. Sci. Adv. 2017, 3, e1700300. [Google Scholar] [CrossRef]
- Ding, D.; Nguyen, B.; Learnihan, V.; Bauman, A.E.; Davey, R.; Jalaludin, B.; Gebel, K. Moving to an Active Lifestyle? A Systematic Review of the Effects of Residential Relocation on Walking, Physical Activity and Travel Behaviour. Br. J. Sports Med. 2018, 52, 789–799. [Google Scholar] [CrossRef]
- Le, H.; Nakagawa, Y. Vietnamese Return Migrants’ Prosocial Behavior in Their Rural Home Communities. Rural Sociol. 2021, 86, 301–325. [Google Scholar] [CrossRef]
- Wiedenhofer, D.; Guan, D.; Liu, Z.; Meng, J.; Zhang, N.; Wei, Y.-M. Unequal Household Carbon Footprints in China. Nat. Clim. Chang. 2017, 7, 75–80. [Google Scholar] [CrossRef]
- Li, Y.; Zhao, R.; Liu, T.; Zhao, J. Does Urbanization Lead to More Direct and Indirect Household Carbon Dioxide Emissions? Evidence from China during 1996–2012. J. Clean. Prod. 2015, 102, 103–114. [Google Scholar] [CrossRef]
- Fan, J.; Ran, A.; Li, X. A Study on the Factors Affecting China’s Direct Household Carbon Emission and Comparison of Regional Differences. Sustainability 2019, 11, 4919. [Google Scholar] [CrossRef]
- Poom, A.; Ahas, R. How Does the Environmental Load of Household Consumption Depend on Residential Location? Sustainability 2016, 8, 799. [Google Scholar] [CrossRef]
- Soon, J.-J.; Ahmad, S.-A. Willingly or Grudgingly? A Meta-Analysis on the Willingness-to-Pay for Renewable Energy Use. Renew. Sustain. Energy Rev. 2015, 44, 877–887. [Google Scholar] [CrossRef]
- Li, J.; Ren, L.; Sun, M. Is There a Spatial Heterogeneous Effect of Willingness to Pay for Ecological Consumption? An Environmental Cognitive Perspective. J. Clean. Prod. 2020, 245, 118259. [Google Scholar] [CrossRef]
- Bai, R.; Lin, B. Are Residents Willing to Pay for Garbage Recycling: Evidence from a Survey in Chinese First-Tier Cities. Environ. Impact Assess. Rev. 2022, 95, 106789. [Google Scholar] [CrossRef]
- Hanif, M.W.; Hafeez, S.; Afridi, M.A. Does Wastophobia Bring Sustainability in Consumers’ Responsible Behavior? A Case of Electricity Waste Management. Int. J. Energy Sect. Manag. 2022; ahead-of-print. [Google Scholar] [CrossRef]
- Wang, Q.-C.; Chang, R.; Xu, Q.; Liu, X.; Jian, I.Y.; Ma, Y.-T.; Wang, Y.-X. The Impact of Personality Traits on Household Energy Conservation Behavioral Intentions—An Empirical Study Based on Theory of Planned Behavior in Xi’an. Sustain. Energy Technol. Assess. 2021, 43, 100949. [Google Scholar] [CrossRef]
- Tao, Y.; Duan, M.; Deng, Z. Using an Extended Theory of Planned Behaviour to Explain Willingness towards Voluntary Carbon Offsetting among Chinese Consumers. Ecol. Econ. 2021, 185, 107068. [Google Scholar] [CrossRef]
- Jomnonkwao, S.; Wisutwattanasak, P.; Ratanavaraha, V. Factors Influencing Willingness to Pay for Accident Risk Reduction among Personal Car Drivers in Thailand. PLoS ONE 2021, 16, e0260666. [Google Scholar] [CrossRef]
- Elahi, E.; Khalid, Z.; Zhang, Z. Understanding Farmers’ Intention and Willingness to Install Renewable Energy Technology: A Solution to Reduce the Environmental Emissions of Agriculture. Appl. Energy 2022, 309, 118459. [Google Scholar] [CrossRef]
- Bamberg, S.; Möser, G. Twenty Years after Hines, Hungerford, and Tomera: A New Meta-Analysis of Psycho-Social Determinants of pro-Environmental Behaviour. J. Environ. Psychol. 2007, 27, 14–25. [Google Scholar] [CrossRef]
- Shao, S.; Tian, Z.; Fan, M. Do the Rich Have Stronger Willingness to Pay for Environmental Protection? New Evidence from a Survey in China. World Dev. 2018, 105, 83–94. [Google Scholar] [CrossRef]
- Zhang, Y.; Yu, C.-H.; Li, D.; Zhang, H. Willingness to Pay for Environmental Protection in China: Air Pollution, Perception, and Government Involvement. Chin. J. Popul. Resour. Environ. 2020, 18, 229–236. [Google Scholar] [CrossRef]
- Rafique, M.Z.; Sun, J.; Larik, A.R.; Li, Y. Assessment of Willingness to Pay for Pollution Prevention, Health and Happiness: A Case Study of Punjab, Pakistan. Front. Public Health 2022, 10, 825387. [Google Scholar] [CrossRef] [PubMed]
- Zografakis, N.; Sifaki, E.; Pagalou, M.; Nikitaki, G.; Psarakis, V.; Tsagarakis, K.P. Assessment of Public Acceptance and Willingness to Pay for Renewable Energy Sources in Crete. Renew. Sustain. Energy Rev. 2010, 14, 1088–1095. [Google Scholar] [CrossRef]
- Bigerna, S.; Polinori, P. Italian Households’ Willingness to Pay for Green Electricity. Renew. Sustain. Energy Rev. 2014, 34, 110–121. [Google Scholar] [CrossRef]
- Lee, M.-K.; Kim, J.-H.; Yoo, S.-H. Public Willingness to Pay for Increasing Photovoltaic Power Generation: The Case of Korea. Sustainability 2018, 10, 1196. [Google Scholar] [CrossRef]
- Ayodele, T.R.; Ogunjuyigbe, A.S.O.; Ajayi, O.D.; Yusuff, A.A.; Mosetlhe, T.C. Willingness to Pay for Green Electricity Derived from Renewable Energy Sources in Nigeria. Renew. Sustain. Energy Rev. 2021, 148, 111279. [Google Scholar] [CrossRef]
- Korzhenevych, A.; Owusu, C.K. Renewable Minigrid Electrification in Off-Grid Rural Ghana: Exploring Households Willingness to Pay. Sustainability 2021, 13, 11711. [Google Scholar] [CrossRef]
- Malik, S.; Arshad, M.Z.; Amjad, Z.; Bokhari, A. An Empirical Estimation of Determining Factors Influencing Public Willingness to Pay for Better Air Quality. J. Clean. Prod. 2022, 372, 133574. [Google Scholar] [CrossRef]
- Freeman, R.; Liang, W.; Song, R.; Timmins, C. Willingness to Pay for Clean Air in China. J. Environ. Econ. Manag. 2019, 94, 188–216. [Google Scholar] [CrossRef]
- Sun, C.; Yuan, X.; Yao, X. Social Acceptance towards the Air Pollution in China: Evidence from Public’s Willingness to Pay for Smog Mitigation. Energy Policy 2016, 92, 313–324. [Google Scholar] [CrossRef]
- Halkos, G.; Leonti, A.; Petropoulos, C.; Sardianou, E. Determinants of Willingness to Pay for Urban Parks: An Empirical Analysis in Greece. Land Use Policy 2022, 119, 106186. [Google Scholar] [CrossRef]
- Guo, D.; Wang, A.; Zhang, A.T. Pollution Exposure and Willingness to Pay for Clean Air in Urban China. J. Environ. Manag. 2020, 261, 110174. [Google Scholar] [CrossRef] [PubMed]
- Wang, B.; Hong, G.; Qin, T.; Fan, W.-R.; Yuan, X.-C. Factors Governing the Willingness to Pay for Air Pollution Treatment: A Case Study in the Beijing-Tianjin-Hebei Region. J. Clean. Prod. 2019, 235, 1304–1314. [Google Scholar] [CrossRef]
- Wang, K.; Wu, J.; Wang, R.; Yang, Y.; Chen, R.; Maddock, J.E.; Lu, Y. Analysis of Residents’ Willingness to Pay to Reduce Air Pollution to Improve Children’s Health in Community and Hospital Settings in Shanghai, China. Sci. Total Environ. 2015, 533, 283–289. [Google Scholar] [CrossRef]
- Abdullah, S.; Jeanty, P.W. Willingness to Pay for Renewable Energy: Evidence from a Contingent Valuation Survey in Kenya. Renew. Sustain. Energy Rev. 2011, 15, 2974–2983. [Google Scholar] [CrossRef]
- Numata, M.; Sugiyama, M.; Swe, W.; del Barrio Alvarez, D. Willingness to Pay for Renewable Energy in Myanmar: Energy Source Preference. Energies 2021, 14, 1505. [Google Scholar] [CrossRef]
- Liobikienė, G.; Dagiliūtė, R. Do Positive Aspects of Renewable Energy Contribute to the Willingness to Pay More for Green Energy? Energy 2021, 231, 120817. [Google Scholar] [CrossRef]
- Nketiah, E.; Song, H.; Adu-Gyamfi, G.; Obuobi, B.; Adjei, M.; Cudjoe, D. Does Government Involvement and Awareness of Benefit Affect Ghanaian’s Willingness to Pay for Renewable Green Electricity? Renew. Energy 2022, 197, 683–694. [Google Scholar] [CrossRef]
- Bamberg, S. How Does Environmental Concern Influence Specific Environmentally Related Behaviors? A New Answer to an Old Question. J. Environ. Psychol. 2003, 23, 21–32. [Google Scholar] [CrossRef]
- China General Social Survey (CGSS); 2018. Available online: http://cgss.ruc.edu.cn/English/Home.htm# (accessed on 29 December 2021).
- Oerlemans, L.A.G.; Chan, K.-Y.; Volschenk, J. Willingness to Pay for Green Electricity: A Review of the Contingent Valuation Literature and Its Sources of Error. Renew. Sustain. Energy Rev. 2016, 66, 875–885. [Google Scholar] [CrossRef]
- Notice on Printing and Distributing the “14th Five-Year” Renewable Energy Development Plan from National Development and Reform Commission. Available online: https://www.ndrc.gov.cn/xwdt/tzgg/202206/t20220601_1326720.html?code=&state=123 (accessed on 26 November 2022).
- Ajzen, I. The Theory of Planned Behavior. Organ. Behav. Hum. Decis. Process. 1991, 50, 179–211. [Google Scholar] [CrossRef]
- Conner, M.; Armitage, C.J. Extending the Theory of Planned Behavior: A Review and Avenues for Further Research. J. Appl. Soc. Psychol. 1998, 28, 1429–1464. [Google Scholar] [CrossRef]
- Choi, D.; Johnson, K.K.P. Influences of Environmental and Hedonic Motivations on Intention to Purchase Green Products: An Extension of the Theory of Planned Behavior. Sustain. Prod. Consum. 2019, 18, 145–155. [Google Scholar] [CrossRef]
- Oehman, J.M.; Babbitt, C.W.; Flynn, C. What Predicts and Prevents Source Separation of Household Food Waste? An Application of the Theory of Planned Behavior. Resour. Conserv. Recycl. 2022, 186, 106492. [Google Scholar] [CrossRef]
- Tan, Y.; Fukuda, H.; Li, Z.; Wang, S.; Gao, W.; Liu, Z. Does the Public Support the Construction of Battery Swapping Station for Battery Electric Vehicles?—Data from Hangzhou, China. Energy Policy 2022, 163, 112858. [Google Scholar] [CrossRef]
- Zhang, L.; Fukuda, H.; Liu, Z. Households’ Willingness to Pay for Green Roof for Mitigating Heat Island Effects in Beijing (China). Build. Environ. 2019, 150, 13–20. [Google Scholar] [CrossRef]
- Zhang, L.; Fukuda, H.; Liu, Z. Public Willingness to Pay for Sand and Dust Weather Mitigation: A Case Study in Beijing, China. J. Clean. Prod. 2019, 217, 639–645. [Google Scholar] [CrossRef]
- Knight, J.; Song, L.; Gunatilaka, R. Subjective Well-Being and Its Determinants in Rural China. China Econ. Rev. 2009, 20, 635–649. [Google Scholar] [CrossRef]
- Strand, S. Education and Achievement at 16. Sociol. Rev. 2022, 31, 2–6. Available online: https://ora.ox.ac.uk/objects/uuid:f95cafd1-1b8c-42e2-ac25-6a50d012ecd7 (accessed on 15 December 2022).
- Xie, B.-C.; Zhao, W. Willingness to Pay for Green Electricity in Tianjin, China: Based on the Contingent Valuation Method. Energy Policy 2018, 114, 98–107. [Google Scholar] [CrossRef]
- Salehi, S.; Telešienė, A.; Pazokinejad, Z. Socio-Cultural Determinants and the Moderating Effect of Gender in Adopting Sustainable Consumption Behavior among University Students in Iran and Japan. Sustainability 2021, 13, 8955. [Google Scholar] [CrossRef]
- Macháč, J.; Brabec, J.; Arnberger, A. Exploring Public Preferences and Preference Heterogeneity for Green and Blue Infrastructure in Urban Green Spaces. Urban For. Urban Green. 2022, 75, 127695. [Google Scholar] [CrossRef]
- Wang, J.; Long, R.; Chen, H.; Li, Q. Are Female-Dominated Families More Energy-Saving? Evidence from Jiangsu Province, China. Sustain. Prod. Consum. 2021, 27, 2178–2192. [Google Scholar] [CrossRef]
- Bu, J.; Ali, K. Environmental Degradation in Terms of Health Expenditure, Education and Economic Growth. Evidence of Novel Approach. Front. Environ. Sci. 2022, 10, 1046213. [Google Scholar] [CrossRef]
- Albrecht, D.E. Rural/Urban Differences: Persistence or Decline. Rural Sociol. 2022, 87, 1137–1154. [Google Scholar] [CrossRef]
- Opoku-Asare, N.A.; Siaw, A.O. Curricula and Inferential Factors That Affect Student Achievement in Rural, Urban, and Peri-Urban Senior High Schools in Ghana: Evidence from the Visual Arts Program. SAGE Open 2016, 6, 1–13. [Google Scholar] [CrossRef]
- Harten, L.; Gonceer, N.; Handel, M.; Dash, O.; Fokidis, H.B.; Yovel, Y. Urban Bat Pups Take after Their Mothers and Are Bolder and Faster Learners than Rural Pups. BMC Biol. 2021, 19, 190. [Google Scholar] [CrossRef]
- Ju, H.; Chen, J.; Xu, J.; Zhang, H. How Do Non-Agricultural Employment and Regional Selection Affect Farmers’ Domestic Sewage Discharge Behavior? Empirical Evidence from Rural China. Int. J. Environ. Res. Public Health 2022, 19, 10694. [Google Scholar] [CrossRef]
- Wood, W.; Rünger, D. Psychology of Habit. Annu. Rev. Psychol. 2016, 67, 289–314. [Google Scholar] [CrossRef]
- Mitchell, R.C. Using Surveys to Value Public Goods: The Contingent Valuation Method, 1st ed.; RFF Press: Washington, DC, USA, 2013; ISBN 978-1-315-06056-9. [Google Scholar]


Disclaimer/Publisher’s Note: The statements, opinions and data contained in all publications are solely those of the individual author(s) and contributor(s) and not of MDPI and/or the editor(s). MDPI and/or the editor(s) disclaim responsibility for any injury to people or property resulting from any ideas, methods, instructions or products referred to in the content. |
© 2023 by the authors. Licensee MDPI, Basel, Switzerland. This article is an open access article distributed under the terms and conditions of the Creative Commons Attribution (CC BY) license (https://creativecommons.org/licenses/by/4.0/).