Abstract
One of the issues associated with the supply of electricity is its generation capacity, and this has led to prevalent power cuts and high costs of usage experienced in many developing nations, including South Africa. Historical research has shown that the annual rate of increase for electricity has grown at an alarming rate since 2008 and, in some years, has grown as much as 16%. The objectives of this study are to estimate the cost analysis of electricity usage at the twenty-nine residences of the University of Johannesburg (UJ-Res) and propose a model for our university, as well as other South African universities, to become more energy-efficient. This was achieved by analyzing the tariffs between 2015 and 2021. A forecast was made for a period of five years (2021 to 2026) using a non-linear autoregressive exogenous neural network (NARX-NN) time-series model. From the results obtained, the better NARX-NN model studied has a root mean squared error (RMSE) of 2.47 × 10⁵ and a determination coefficient () of 0.9661. The projection result also shows that the annual cost of energy consumed will increase for the projected years, with the year 2022 being the peak with an estimated annual cost of over ZAR 30 million (USD 2,076,268).
1. Introduction
Energy is an integral part of economic development [1]. It is utilized for economic activity, and through it, life-essential services are provided [2,3]. Energy is very crucial to the provision of important services; it is related to sustainable development [2]; however, this relationship can be both positive and negative [4]. Energy consumption (EC), on the other hand, is a vital issue of international concern [5]. The demand for energy clearly has an effect on a number of crucial choices, including those involving the upkeep of machinery, the trading of fuel, and the production of energy. As a result, energy corporations and governments increasingly consider anticipating energy use when making decisions [6]. A high-precision EC prediction technology is still difficult to build, however, because EC is also naturally influenced by a number of interrelated elements, including economic growth, national energy planning, energy production capacity, and meteorological conditions [5].
Energy is meant to bring comfort, makes life better for humanity [7], and plays a very crucial role in climate change, while climate change also affects the energy sector [8,9]. Therefore, energy consumption (EC) is closely connected with climate change [9]. In recent times, climate change has become an issue of concern globally [10], and the issue of climate change has been increasingly surfacing in the write-ups by researchers in this present time, and the means to curb it has continued to become a serious problem [11,12]. Therefore, the onus to address the issues of climate change and global warming lies upon the decision makers and stakeholders, who include all members of the general public and, particularly, students in the higher institutions of learning (HIL) [13,14]. A report has shown that EC in the residential sector accounted for ~38% of carbon emissions in specific parts of the United States of America (USA) [15,16]. Meanwhile, carbon emission in the manufacturing sector in South Africa has increased over the years; its 2020 figure was around ~20%, while overall emissions are expected to decrease by 40% in 2025 [17,18]. Nonetheless, an increase in EC is anticipated during the coming decades. The electricity used in South Africa comes from a faltering state company that relies primarily on coal. The government of South Africa is having trouble keeping up with the rising demand for energy because of the country’s heavy reliance on expensive fuel imports. However, despite the limitations and the high expense, energy use in HIL is still mostly unregulated and poorly managed [19]. An effort to create a sound electricity policy and a better knowledge of the nature of aggregate power consumption will both benefit from the investigation of the main drivers of EC in South Africa [20].
In this study, the cost analysis of EC at the twenty-nine residences of the University of Johannesburg (UJ-Res) was estimated, and a time-series model was used to estimate both EC as well as its cost over the next five years. Time-series models for supervised learning include statistical approaches, ensemble methods, and artificial neural network (ANN) methods [21]. The time-series models that are widely used in research and practice include linear autoregressive (AR) and autoregressive with exogenous [22] models, moving average (MA) and autoregressive moving average (ARMA) models, and the ANN methods, which include Long-short term memory (LSTM) neural network model and the non-linear autoregressive models (NAR and NARX) [23]. Among the established methods for forecasting time-series data, a recurrent neural network (RNN) such as the non-linear autoregressive exogenous model (NARX) is one of the methods that have been proven to have very good prediction rates [21]. RNNs are not only vital for time-series forecasts but also good in dynamic system control [24]. To the best of our knowledge, there is little or no information that has been documented with respect to the cost assessment of EC and prediction in any university residence in South Africa and Africa in general. Hence, this study becomes very crucial for universities in Africa to attain sustainability in terms of EC and utilization. This study aims to perform an economic analysis of EC at the University of Johannesburg student residences. To achieve the aim, an investigation into energy consumption in relation to economic growth and energy consumption in higher institutions of learning was discussed in the literature review aspect of this study. The methodology section is divided into four sections, which include the UJ history and UJ-Res information, study data acquisition, the proposed NARX neural network model algorithm, and finally, the key evaluation metrics employed in this study.
2. Literature Review
2.1. Energy Consumption (EC) and Economic Growth
In the last three decades all over the world, several authors have investigated and established a relationship between EC and economic growth [25,26,27,28,29,30,31,32,33]. The analysis of EC plays a significant role in the formulation of policy by decision-makers [34]. There is a vital aspect of EC, which is electricity or electric EC; its relevance to economic growth has been recognized by all professions [35]. EC reveals people’s way of life, especially when the economy is booming, resulting in high demand for energy [36]. EC and carbon dioxide (CO2) emissions are interdependent; these have continued to increase in developing countries (DCs) because of growth in the economy [37]. Recent investigations [38,39] put the demand for energy from homes, businesses, and industrial sectors at ~49% and the amount of carbon emissions at ~47%. The efficiency of energy systems and the environmental quality need to be improved because of the increasing demand for energy all over the world [40]. Economic growth, population growth, and increased urbanization are the major factors contributing to increased energy demand, which is ultimately leading to climate change and other environmental issues globally [40]. Thus, efficient use of energy is the only solution to the current energy challenges facing the world, and for sustainability to be attained in all sectors of the economy, efficient usage of energy becomes very crucial [8,28,31]. According to the Energy Efficiency and Conservation Act of 2000, “Energy efficiency means a change to energy use that results in an increase in net benefits per unit of energy” [41]. For energy efficiency to be achieved, there must be a change of attitude. Any change of attitude that leads to less EC is referred to as energy conservation. When less energy is expended to perform similar activities, energy efficiency is said to be attained [42]. Energy efficiency can best be achieved when economic Power Logic systems are employed. These systems will assist energy intelligence to manage EC proactively while strategic decisions will be made and supported. The systems will also help in the reduction of emissions [43]. HILs are contributing greatly to climate change via electric EC. This issue can be mitigated by continuously educating the students on the need to reduce EC in order to attain a sustainable university [13]. Most universities in many parts of the world consume a high amount of energy, so one of the ways to achieve a reduction in EC is to keep asking each university to report the amount of energy used per period since energy reduction will be very difficult if proper data and the cost of energy usage by individuals or institutions are not recorded or documented [44].
2.2. Summary of Studies on Energy Consumption from Higher Institutions of Learning
Emeakaroha et al., 2012 presented an advanced solution for adjusting students’ behavior towards EC. This involved the grouping of real-time electricity response and appointment of energy representatives who may perhaps oversee awareness creation among students towards the reduction of climate change. Different feedback was received based on the behavior of a selected group of students. Hence, a system was therefore offered to tackle matters linked to EC. This was done using smart sensors, the incorporation of a committed visual web interface, and the assignment of a delegate at the student residence [45]. In their study, a primary investigation of EC in one of the residences of a tertiary institution was carried out using ~200 smart electric meters around the campus. Daily, ~5 million data points were collected, and this lasted for about five months. Data obtained revealed a twist in EC for diverse appliances used on the campus [10].
Escobedo et al., 2014 discussed the energy consumption (EC) and greenhouse gas (GHG) emission situation at the National Autonomous University of Mexico (UNAM). They estimated EC and its associated emissions via GHGs. The authors chose some buildings and facilities as representative samples for the energy audits. From their findings, it was discovered that lighting accounted for ~30%, research facilities accounted for ~20%, refrigeration for ~15%, and water heating for ~10%. Finally, the overall EC was compared by the end usage to the overall EC from the estimated bill, where a slight difference was discovered. The authors emphasized that this difference could be attributed to other research equipment or losses not being taken into consideration [46].
Yang and Lee, 2014 discussed EC and environmental quality in HIL buildings, and the authors addressed the relationship between local climate, building characteristics, and sustainable development on different campuses of the institution. The authors emphasized that the design of each building, its functionality, and the number of occupants were the major factors that affect EC in HIL buildings [47].
Masebinu et al., 2020, presented a time-series dataset via a real-time energy monitoring device from a student residence. The data collection lasted for about two years. Data collected from the conductors feeding the residences were, by design, combined and shown in the form of a single data point. About 14,000 h of data points were recorded in the study. It was concluded that the data obtained could be helpful in making informed decisions regarding the best model of electricity for student residences [48].
Gui et al., 2020 studied the relationship between EC and space usage at Griffith University, Australia, using multiple linear regression models. A total of 122 buildings on five main campuses of the institution were used as a case study, and the established models had statistical significance, showing that they could be used to explain and predict the energy use of a higher education building in environments with comparable climatic and academic conditions. This study not only confirms earlier studies that found that the building services in higher education buildings use the most energy, but it also discusses how laboratories, particularly those with wet operations, have the biggest effects on energy use because of their energy-intensive equipment and the high need for mechanical ventilation [49].
Bello et al., 2021 investigated the use of sustainable design to reduce EC in HIL buildings in Bauchi state, Nigeria. According to the responses to the surveys conducted by the authors, it was found that the majority of the buildings that made up the built environment lacked the essential amenities to enable them to conserve energy for heating, ventilation, and air conditioning (HVAC). The authors suggested that building retrofits could be done at a minimal cost by government-owned institutions and could also be done not just to reduce EC by HVAC and lighting systems but also to increase thermal comfort within lecture areas [50].
Shukri et al., 2022, were one of the latest authors to study EC in HILs, with the Universiti Tun Hussein Onn Malaysia as a case study in the work. From their study, several buildings recorded high annual EC, which was due to the absence of an EC reference benchmark for the campus buildings. The purpose of their study was to use statistical analysis to create an energy efficiency baseline for university buildings. Their statistics analysis results revealed that the typical practical EC range was between 72.5–141.0 kWh/m2 per annum. In addition, they concluded that the most energy-efficient buildings were those with EC values below 72.5 kWh/m2 per annum. In contrast, those above 141.0 kWh/m2 per annum were regarded as being inefficient in terms of energy use [51].
3. Methodology
3.1. University of Johannesburg Student Residence (UJ-Res)
The University of Johannesburg (UJ) is in Johannesburg in the Gauteng Province (GP) of South Africa [52]. The UJ was founded in 2005 from the amalgamation that occurred amongst the following Universities: Rand Afrikaans University (RAU), the Technikon Witwatersrand (TWR), the Soweto vista campus, and East Rand campuses of Vista University [53]. The UJ has over 50,000 undergraduate and postgraduate students and over 6500 student bed spaces in 29 residences spread across its four campuses. These campuses include the Auckland Park Bunting Road (APB), Auckland Park Kingsway [54], Doornfontein (DFC), and Soweto campuses (SWC) [55]. Given the high demand for student housing and the limited land spaces for student residences on campus, UJ also recognized off-campus accommodations. This study focused on the 29 student residences (as of the timeline in this study) of the UJ (both on-campus and off-campus). The basic information from these residences is summarized in Supplementary Information (SI) (Table S1).
3.2. UJ Residence Energy Data Acquisition
The monthly energy data (EC and associated cost) from the twenty-nine University of Johannesburg student residences (UJ-Res) from January 2015 to July 2021 were obtained and considered in this study. The UJ-Res data were obtained by connecting remote data loggers (RDLs) to the meters positioned at the various student residences of the university. The obtained data were uploaded into software called Metering Online (Power Meter Technique company, Midrand, South Africa). The statistics for the number of student occupants in each of the residences were one of the key requirements in the analysis, and these were obtained from the UJ Student Accommodation and Residence Life [55].
3.3. Non-Linear AutoRegressive eXogenous Neural Network Model (NARX-NN)
In neural network dynamic modeling, NARX-NN is understood to be a non-linear autoregressive model with exogenous input, i.e., the model can be related to the past and current values of the same series [56]. The NARX model is a powerful class of models that have been demonstrated well suited for modeling non-linear dynamic systems [24,57]. When applied to time-series prediction, NARX is designed as a feedforward time delay neural network (TDNN), i.e., there is no feedback loop of delayed outputs, thereby substantially reducing the performance of prediction processes [58]. The defining equation for the NARX model is given in Equation (1).
where is the model output (variable of interest) at time step , is the model input at time step , is the error term (also called noise), and are the memory orders of the output and input variables. In NARX models, the function is a non-linear function; it could be a wavelet network (NARX-WN), a sigmoid network (NARX-SN), or a neural network (NARX-NN), as in the case of this study, and so on. In NARX models, historical information about helps to predict and likewise, the previous values.
The simplest way to implement the NARX-NN model appears to be using a feedforward neural network with embedded memory (a first tapped delay line), as illustrated in Figure 1, and a delayed link from the output of the second layer to input (a second tapped delay line) [57]. It is the same as employing input units that are given neighboring sequence elements to make the network dependent on a preceding sequence element. Since it only offers a partial view of the series, this input is frequently referred to as a time window. It can also be seen as a straightforward method of converting one spatial dimension into another, converting time into space [57]. It has been found in practice that evaluating related time series at the same time will improve predicting for a given time series, such as the case of energy consumption investigated in this study.
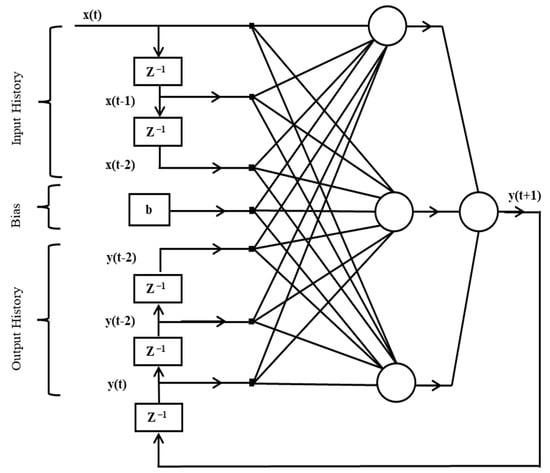
Figure 1.
A simple Architecture of the NARX-NN model.
Generally, there are two NARX-NN architectures: the series-parallel (open-loop) and the parallel (closed-loop) configurations, as shown in Figure 2. The series-parallel performs the training, validation, and testing steps, while the parallel is used for prediction purposes [59]. In this study, the MATLAB R2020a version deep learning neural network time-series (ntstool) toolbox was employed. The non-linear autoregressive model process with exogenous input (NARX) neural network model with two separate time delays (td) was investigated and compared with Microsoft Excel exponential smoothing (ES) forecast trend.
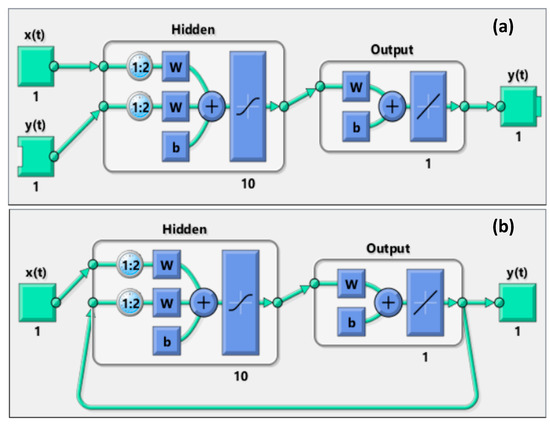
Figure 2.
Matlab R2020a NARX-NN model architecture (a) Open Loop (b) Closed Loop [59].
3.4. Key Evaluation Metrics
Four indicators were employed as evaluation metrics to assess how well the NARX-NN prediction model performed. Equations (2)–(5) contain the formulas for the metrics, which are the Root Mean Square Error (RMSE), Mean Squared Error (MSE), Coefficient of Correlation (R), and Coefficient of Determination (R2), respectively.
where Ns is the training sample size of the dataset, is the observed dataset, is the mean of the observed dataset, is the NARX-NN predicted output.
4. Results
UJ Residence Energy Data Analysis
The dataset was analyzed in two parts: the energy consumption in kWh and the energy cost in South African Rands (ZAR). Figure 3 and Figure 4 show the annual energy consumed and total energy cost for each UJ-Res from 1 January 2015 to 31 July 2021, respectively. The Sophiatown residence with the highest number of students (416) had the highest energy consumption, with 1.6 GWh in 2015, amongst other UJ-Res. Meanwhile, the YMCA and Kopano residences, with 20 MWh and 22 MWh, respectively, had the least energy consumption. This was due to the low number of students residing in both residences in 2019, as shown in Figure 3. Also, in terms of the cost of consumption, 2019 had the highest in Sophiatown, with over ZAR 2.5 million (USD 170,127) spent on electricity, as shown in Figure 4. It should be noted that the 2020 energy cost and consumption at all the UJ-Reses were relatively low compared to previous years, as this was due to the COVID-19 pandemic, where students spent only about four months in all the residences.
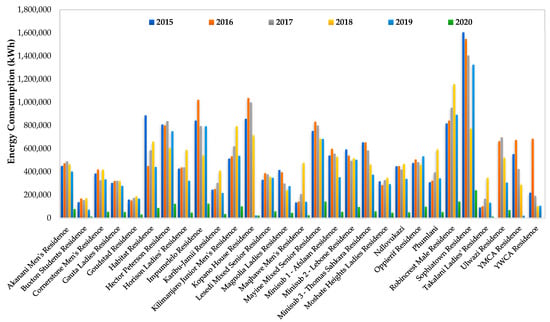
Figure 3.
Annual energy consumption by each UJ-Res from 2015 to 2020.
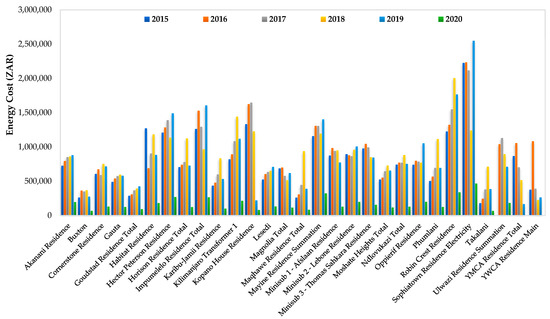
Figure 4.
Annual energy cost by each UJ-Res from 2015 to 2020.
The total monthly energy consumption and cost from January 2015–July 2021 of the residences of the UJ are illustrated in Figure 5 and Figure 6. This was done to understand the trend over the period captured so as to have an effective prediction over the next five (5) years. This would assist the institution, policymakers, and other institutions in making adequate plans in terms of EC and cost. The pattern showed that the monthly total energy increased over the years, and this was due to several factors, but the main factor in 2021 was because of the online classes; this resulted in a situation where lots of students spent more time at the UJ-Res rather than having face-to-face physical contact in classrooms. Figure 5 shows that students tended to use more energy in the winter months (May to September), while January and December always accounted for the lowest usage due to the late resumption of courses and early December breaks. Figure 6 also shows that in the core winter periods, energy cost was always at the highest due to high cost per kWh as high energy generation, transmission, and demands during winter periods were high. This energy tariff fluctuation has remained this way over the seven-year period captured. The total energy consumption in 2016 was the highest recorded for all the UJ-Res combined in the last six years, with a total of 16 GWh. Moreover, aside from the 2020 COVID-19 pandemic year, with a consumption of 0.2 GWh, 2019 had the lowest energy consumption, with a total of 11 GWh. In terms of the cost of energy consumed, the university paid a sum of ZAR 26 million (USD 1,799,433) in 2018. This is the highest figure over the last six years (2020 and 2021 exclusive). Meanwhile, 2015 had the lowest energy cost per kWh; hence, the lowest cost was spent on energy in that year (2020 and 2021 exclusive).
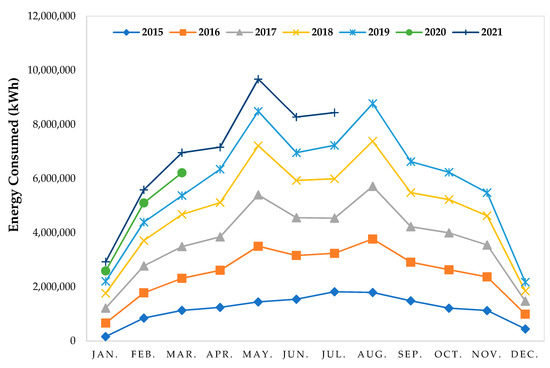
Figure 5.
UJ-Res total monthly energy consumption (in kWh) from January 2015 to July 2021.
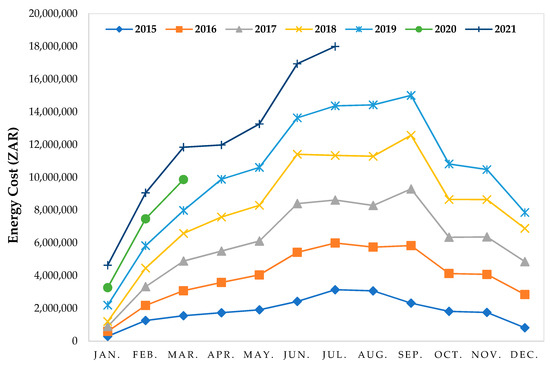
Figure 6.
UJ-Res total monthly energy cost (in ZAR) from January 2015 to July 2021.
5. Discussion
5.1. Training, Testing, and Validation of Energy Data with NARX-NN
To have an effective prediction, a MATLAB non-linear autoregressive exogenous neural network (NARX-NN) time-series toolbox model was used to train the energy dataset. The monthly EC from January 2015–July 2021 (71 data points) was employed as the model input variable (x), while the total cost served as the model output (y). In the NARX-NN models, the time delay was a vital variable in the prediction process; hence, two different delays were investigated, and the results were compared. In the first-time delay scenario (NARX1), a time delay of one month was investigated, while for the second-time delay scenario (NARX2), a two month-time delay was investigated. The 70:15:15 ratio was adopted for the training, testing, and validation dataset for the two scenarios. In addition, the Levenberg-Marquardt (LM) algorithm was used to train the dataset. The output of the two simulation scenarios is shown in Figure 7a,b. The overall root mean squared error (RMSE) and overall correlation coefficient (R) from scenario 1 were 2.47 × 10⁵ and 0.9661, and those of scenario 2 were 2.50 × 10⁵ and 0.9505, respectively. The mean squared error (MSE), RMSE, R, and coefficient of determination (R2) for the training, testing, validation, and overall dataset are summarized in Table 1.
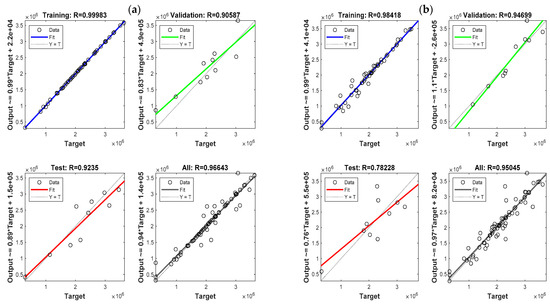
Figure 7.
Simulation output of (a) NARX1 (td = 1) and (b) NARX2 (td = 2).

Table 1.
Performance evaluation of the NARX-NN scenarios.
5.2. UJ-Res Energy Prediction over the Next Five Years
To have an effective prediction of energy costs over the next five years (2021–2026), the Microsoft Excel forecast exponential smoothing (ES) built-in technique was employed based on the original dataset. ES works by projecting the historical trend of energy cost over the years to the point where the effect of fluctuating energy costs in relation to consumption and tariff is feasible. With the current pandemic and current energy crisis, the trend is projected to be feasible for the next five years. The result obtained from the ES projection was compared with the NARX-NN prediction, as shown in Figure 8. It was predicted that the cost would remain fluctuating, and the peak cost [ZAR 3.5 million (USD 242,231)] in June 2022 would be lower than that obtained in July 2021 [ZAR 3.6 million (USD 249,152)]. The annual prediction represented by Figure 9 projected that the year 2022 would be the year with the maximum energy cost, with over ZAR 30 million (USD 2,076,268.25) needing to be budgeted for this year alone. It was also projected that the total annual cost would drop in subsequent years. Note that the unit value of electricity is expressed in Rand (USD 1 = ZAR 14.45) as of 20 October 2021.
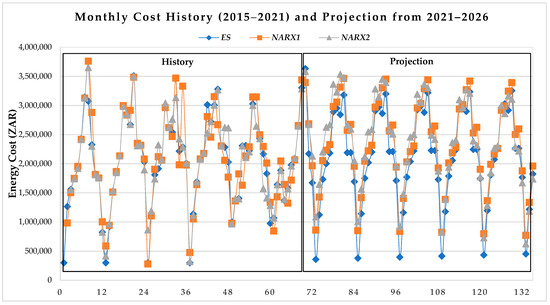
Figure 8.
UJ-Res monthly energy cost history and projection over the next five years.
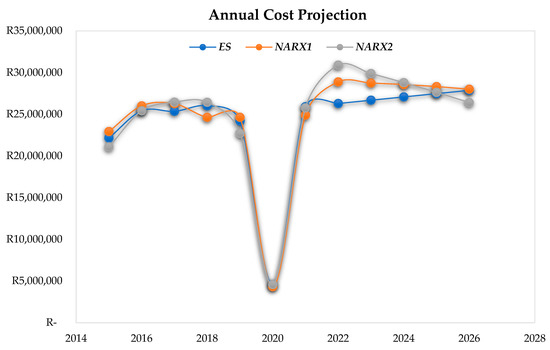
Figure 9.
UJ-Res annual energy cost history and projection over the next five years.
6. Conclusions
Energy consumption analysis, as well as its time-series forecasting, is essential because it facilitates decision-making across a variety of sectors. The study estimated the cost analysis of energy consumption in twenty-nine residences of the University of Johannesburg (UJ-Res) and projected the cost over the next five years. This was achieved by analyzing the tariffs between 2015 and 2021, and a forecast was made for a period of five years (2021 to 2026). The non-linear autoregressive exogenous neural network (NARX-NN) time-series model was used to forecast the annual energy consumption cost. Two NARX-NN models were investigated to see if the outcome of the projection would be affected by time delay. The better NARX-NN model in this study had a root mean squared error (RMSE) of 2.47 × 10⁵ and a determination coefficient (R2) of 0.9661. The annual projection also showed that the total cost of energy consumed would increase for the projected years, with 2022 being the peak year, with over ZAR 30 million (USD 2,076,268) expected to be spent on the 29 residences of the university.
The projected results from this study can serve as an invaluable tool for the University of Johannesburg (UJ) and other South African institutions to plan for energy cost and consumption. Another way by which the proposed model could be implemented in energy consumption (EC) is for the institution to employ a real-time energy data system that could employ this model (NARX-NN) to predict the EC in each of the buildings at the institution on a daily, weekly, or monthly basis, as the case may be. Due to the need to manage EC effectively, this study would assist higher institutions in developing countries (DCs), and specifically, Africa and other sub-Saharan African nations’ institutions, in several areas such as predictive maintenance, proper energy budget planning, corrective measures to determine which residential building consumes the highest energy relative to its capacity, amongst several others. Moreover, an incentive model could be developed, and those residences that consume less energy could be rewarded as a way of encouraging lower consumption of energy. Other recurrent neural network (RNN) variations, such as the gate recurrent unit (GRU), might also be very good at forecasting tasks, as well as other intelligent algorithms such as a back propagation neural network (BPNN), multilayer perceptron (MLP), support vector machine (SVM), etc. In the future, we can use additional excellent techniques to improve the NARX-NN model. In addition, the effect of neural network tunning parameters such as neuron size could be investigated in future works.
Supplementary Materials
The following supporting information can be downloaded at: https://www.mdpi.com/article/10.3390/en16020942/s1, Table S1: UJ-Res and their capacities [55,60].
Author Contributions
Conceptualization, O.O.A. and J.A.A.; methodology, S.B.K.N.; software, L.I.F.; validation, J.A.A., O.O.A. and S.B.K.N.; formal analysis, S.B.K.N.; investigation, O.O.A.; resources, S.B.K.N.; data curation, J.A.A.; writing—original draft preparation, O.O.A.; writing—review and editing, L.I.F.; visualization, J.A.A.; supervision, P.A.O.; project administration, P.A.O.; funding acquisition, P.A.O. All authors have read and agreed to the published version of the manuscript.
Funding
This research received no external funding.
Acknowledgments
The authors wish to acknowledge the University of Johannesburg (UJ) University Research Council (URC) for the funding support.
Conflicts of Interest
The authors declare no conflict of interest.
References
- Stern, D.I.; Burke, P.; Bruns, S. The Impact of Electricity on Economic Development: A Macroeconomic Perspective; EEG State-Of-Knowledge Paper Series; University of California: Berkeley, CA, USA, 2019; p. 44. [Google Scholar]
- Unakıtan, G.; Aydın, B. A comparison of energy use efficiency and economic analysis of wheat and sunflower production in Turkey: A case study in Thrace Region. Energy 2018, 149, 279–285. [Google Scholar] [CrossRef]
- Ayres, R.U.; Brockway, P.; Aramendia, E. The Key Role of Energy in Economic Growth; White Rose Research Online; White Rose: Yorkshire, UK, 2019. [Google Scholar]
- OECD. OECD Contribution to the United Nations Commission on Sustainable Development 15: Energy for Sustainable Development; OECD: Paris, France, 2007. [Google Scholar]
- Peng, L.; Wang, L.; Xia, D.; Gao, Q. Effective energy consumption forecasting using empirical wavelet transform and long short-term memory. Energy 2022, 238, 121756. [Google Scholar] [CrossRef]
- Deb, C.; Zhang, F.; Yang, J.; Lee, S.E.; Shah, K.W. A review on time series forecasting techniques for building energy consumption. Renew. Sustain. Energy Rev. 2017, 74, 902–924. [Google Scholar] [CrossRef]
- OECD. G20 Contribution to the 2030 Agenda: Progress And Way Forward; OECD: Paris, France, 2019. [Google Scholar]
- Liu, L.; Huang, G.; Baetz, B.; Cheng, G.; Pittendrigh, S.M.; Pan, S. Input-output modeling analysis with a detailed disaggregation of energy sectors for climate change policy-making: A case study of Saskatchewan Canada. Renew. Energy 2020, 151, 1307–1317. [Google Scholar] [CrossRef]
- Hennessey, R.; Pittman, J.; Morand, A.; Douglas, A. Co-benefits of integrating climate change adaptation and mitigation in the Canadian energy sector. Energy Policy 2017, 111, 214–221. [Google Scholar] [CrossRef]
- Sial, A.; Jain, A.; Singh, A.; Mahanti, A. Profiling energy consumption in a residential campus. In Proceedings of the 2014 CoNEXT on Student Workshop, Sydney, Australia, 2–5 December 2014. [Google Scholar]
- Akpan, U.F.; Akpan, G. The contribution of energy consumption to climate change: A feasible policy direction. Int. J. Energy Econ. Policy 2012, 2, 21. [Google Scholar]
- Chandel, S.; Shrivastva, R.; Sharma, V.; Ramasamy, P. Overview of the initiatives in renewable energy sector under the national action plan on climate change in India. Renew. Sustain. Energy Rev. 2016, 54, 866–873. [Google Scholar] [CrossRef]
- Filho, W.L.; Sima, M.; Sharifi, A.; Luetz, J.M.; Salvia, A.L.; Mifsud, M.; Olooto, F.M.; Djekic, I.; Anholon, R.; Rampasso, I.; et al. Handling climate change education at universities: An overview. Environ. Sci. Eur. 2021, 33, 109. [Google Scholar] [CrossRef]
- Molthan-Hill, P.; Blaj-Ward, L.; Mbah, M.F.; Ledley, T.S. Climate change education at universities: Relevance and strategies for every discipline. In Handbook of Climate Change Mitigation and Adaptation; Springer: Cham, Switzerland, 2022; pp. 3395–3457. [Google Scholar]
- Wilbanks, T.J. Effects of Climate Change on Energy Production and Use in the United State; DIANE Publishing: Collingdale, PA, USA, 2009. [Google Scholar]
- Santamouris, M.; Vasilakopoulou, K. Present and future energy consumption of buildings: Challenges and opportunities towards decarbonisation. e-Prime-Advances in Electrical Engineering. Electron. Energy 2021, 1, 100002. [Google Scholar]
- Kan, K.; Mativenga, P.; Marnewick, A. Understanding energy use in the South African manufacturing industry. Procedia CIRP 2020, 91, 445–451. [Google Scholar] [CrossRef]
- Moghayedi, A.; Hübner, D.; Michell, K. Achieving sustainability in South African commercial properties: The impact of innovative technologies on energy consumption. Facilities 2022. ahead-of-print. [Google Scholar] [CrossRef]
- Samuels, J.; Grobbelaar, S.; Booysen, M. Light-years apart: Energy usage by schools across the South African affluence divide. Energy Res. Soc. Sci. 2020, 70, 101692. [Google Scholar] [CrossRef]
- Hlongwane, N.W.; Daw, O. Electricity Consumption and Population Growth in South Africa: A Panel Approach; Munich Personal RePEc Archive: Munich, Germany, 2022. [Google Scholar]
- Massaoudi, M.; Chihi, I.; Sidhom, L.; Trabelsi, M.; Refaat, S.S.; Oueslati, F.S. A novel approach based deep RNN using hybrid NARX-LSTM model for solar power forecasting. arXiv 2019, arXiv:10064. [Google Scholar]
- Rand, T.; Haukohl, J.; Marxen, U. Municipal Solid Waste Incineration: A Decision Maker’s Guide; The World Bank: Washington, DC, USA, 2000. [Google Scholar]
- Kuric, I.; Fedorová, D.; Bohušík, M.; Bartoš, M.; Sága, M., Jr. Development of predictive maintenance based on artificial intelligence methods. Innovations 2022, 10, 57–60. [Google Scholar]
- Chan, R.W.; Yuen, J.K.; Lee, E.W.; Arashpour, M. Application of Nonlinear-Autoregressive-Exogenous model to predict the hysteretic behaviour of passive control systems. Eng. Struct. 2015, 85, 1–10. [Google Scholar] [CrossRef]
- Tong, T.; Ortiz, J.; Xu, C.; Li, F. Economic growth, energy consumption, and carbon dioxide emissions in the E7 countries: A bootstrap ARDL bound test. Energy. Sustain. Soc. 2020, 10, 20. [Google Scholar] [CrossRef]
- Khobai, H.B.; Le Roux, P. The relationship between energy consumption, economic growth and carbon dioxide emission: The case of South Africa. Int. J. Energy Econ. Policy 2017, 7, 102–109. [Google Scholar]
- Khan, M.K.; Khan, M.; Rehan, M. The relationship between energy consumption, economic growth and carbon dioxide emissions in Pakistan. Financ. Innov. 2020, 6, 1. [Google Scholar] [CrossRef]
- Anca Florentina, V. The Relationship Between Economic Growth and CO2 Emissions in EU Countries: A Cointegration Analysis. Front. Environ. Sci. 2022, 10, 934885. [Google Scholar]
- Mohsin, M.; Abbas, Q.; Zhang, J.; Ikram, M.; Iqbal, N. Integrated effect of energy consumption, economic development, and population growth on CO2 based environmental degradation: A case of transport sector. Environ. Sci. Pollut. Res. 2019, 26, 32824–32835. [Google Scholar] [CrossRef]
- Azam, M.; Khan, A.Q.; Bakhtyar, B.; Emirullah, C. The causal relationship between energy consumption and economic growth in the ASEAN-5 countries. Renew. Sustain. Energy Rev. 2015, 47, 732–745. [Google Scholar] [CrossRef]
- Bah, M.M.; Azam, M. Investigating the relationship between electricity consumption and economic growth: Evidence from South Africa. Renew. Sustain. Energy Rev. 2017, 80, 531–537. [Google Scholar] [CrossRef]
- Bekun, F.V.; Emir, F.; Sarkodie, S. Another look at the relationship between energy consumption, carbon dioxide emissions, and economic growth in South Africa. Sci. Total Environ. 2019, 655, 759–765. [Google Scholar] [CrossRef]
- Ranjbar, O.; Chang, T.; Nel, E.; Gupta, R. Energy consumption and economic growth nexus in South Africa: Asymmetric frequency domain approach. Energy Sources Part B Econ. Plan. Policy 2017, 12, 24–31. [Google Scholar] [CrossRef]
- Hosseinzadeh-Bandbafha, H.; Safarzadeh, D.; Ahmadi, E.; Nabavi-Pelesaraei, A. Optimization of energy consumption of dairy farms using data envelopment analysis–A case study: Qazvin city of Iran. J. Saudi Soc. Agric. Sci. 2018, 17, 217–228. [Google Scholar] [CrossRef]
- Karanfil, F.; Li, Y. Electricity consumption and economic growth: Exploring panel-specific differences. Energy Policy 2015, 82, 264–277. [Google Scholar] [CrossRef]
- Nasreen, S.; Anwar, S.; Ozturk, I. Financial stability, energy consumption and environmental quality: Evidence from South Asian economies. Renew. Sustain. Energy Rev. 2017, 67, 1105–1122. [Google Scholar] [CrossRef]
- Ahmad, A.; Zhao, Y.; Shahbaz, M.; Bano, S.; Zhang, Z.; Wang, S.; Liu, Y. Carbon emissions, energy consumption and economic growth: An aggregate and disaggregate analysis of the Indian economy. Energy Policy 2016, 96, 131–143. [Google Scholar] [CrossRef]
- Chowdhury, J.I.; Hu, Y.; Haltas, I.; Balta-Ozkan, N.; Matthew, G.; Varga, L. Reducing industrial energy demand in the UK: A review of energy efficiency technologies and energy saving potential in selected sectors. Renew. Sustain. Energy Rev. 2018, 94, 1153–1178. [Google Scholar] [CrossRef]
- EIA. EIA Electricity Use in Homes. 2021. Available online: https://www.eia.gov/energyexplained/use-of-energy/homes.php (accessed on 9 December 2022).
- Sheng, X.; Lin, D. Energy saving analyses on the reconstruction project in district heating system with distributed variable speed pumps. Appl. Therm. Eng. 2016, 101, 432–445. [Google Scholar] [CrossRef]
- Ministry for the Environment. Energy Efficiency and Conservation Act 2000; Ministry for the Environment, Ed.; Ministry for the Environment, New Zealand Government: Wellington, New Zealand, 2000; p. 23.
- The NEED Project. Energy Consumption; The NEED Project: Bedfordshire, UK, 2016. [Google Scholar]
- Schneider Electric. Energy Efficiency and Cost Reduction Solutions for Industry: PowerLogic Application Brochure; Schneider Electric: La Vergne, TN, USA, 2011. [Google Scholar]
- Katircioglu, S.; Katircioĝlu, S.; Saqib, N. Does higher education system moderate energy consumption and climate change nexus? Evidence from a small island. Air Qual. Atmos. Health 2020, 13, 153–160. [Google Scholar] [CrossRef]
- Emeakaroha, A.; Ang, C.; Yan, Y. Challenges in improving energy efficiency in a university campus through the application of persuasive technology and smart sensors. Challenges 2012, 3, 290–318. [Google Scholar] [CrossRef]
- Escobedo, A.; Briceño, S.; Juárez, H.; Castillo, D.; Imaz, M.; Sheinbaum, C. Energy consumption and GHG emission scenarios of a university campus in Mexico. Energy Sustain. Dev. 2014, 18, 49–57. [Google Scholar] [CrossRef]
- Yang, J.; Lee, S.E. Buildings in Higher Education: Energy Consumption and Environmental Quality. In Encyclopedia of Energy Engineering and Technology, 2nd ed.; CRC Press: Boca Raton, FL, USA, 2014; pp. 1–10. [Google Scholar]
- Masebinu, S.; Holm-Nielsen, J.; Mbohwa, C.; Padmanaban, S.; Nwulu, N. Electricity consumption data of a student residence in Southern Africa. Data Brief 2020, 32, 106150. [Google Scholar] [CrossRef]
- Gui, X.; Gou, Z.; Zhang, F. The relationship between energy use and space use of higher educational buildings in subtropical Australia. Energy Build. 2020, 211, 109799. [Google Scholar] [CrossRef]
- Bello, M.M.; Allu-Kangkum, E.; Nimlyat, P. Energy Efficiency Assessment of Higher Education Buildings in Bauchi, Nigeria. J. Contemp. Res. Built Environ. 2021, 5, 56–71. [Google Scholar]
- Shukri, M.A.M.; Jailani, J.; Hauashdh, A. Benchmarking the energy efficiency of higher educational buildings: A case study approach. Int. J. Energy Econ. Policy 2022, 12, 491–496. [Google Scholar] [CrossRef]
- Ayeleru, O.O.; Okonta, F.; Ntuli, F. Municipal solid waste generation and characterization in the City of Johannesburg: A pathway for the implementation of zero waste. Waste Manag. 2018, 79, 87–97. [Google Scholar] [CrossRef]
- University of Johannesburg. I Care for My Community, Therefore I Choose the University of Johannesburg; Community Engagement Report; University of Johannesburg: Johannesburg, South Africa, 2011. [Google Scholar]
- Das, B.; Bhave, P.V.; Sapkota, A.; Byanju, R.M. Estimating emissions from open burning of municipal solid waste in municipalities of Nepal. Waste Manag. 2018, 79, 481–490. [Google Scholar] [CrossRef]
- Ayeleru, O.O.; Adeniran, J.A.; Ntsaluba, S.; De Koker, J.J. Comparative study on energy consumption at the University of Johannesburg residences. In Proceedings of the 2017 International Conference on the Domestic Use of Energy (DUE), Cape Town, South Africa, 4–5 April 2017; IEEE Press: New York, NY, USA, 2017. [Google Scholar]
- Billings, S.A. Nonlinear System Identification: NARMAX Methods in the Time, Frequency, and Spatio-Temporal Domains; John Wiley & Sons: Hoboken, NJ, USA, 2013. [Google Scholar]
- Diaconescu, E. The use of NARX neural networks to predict chaotic time series. Wseas Trans. Comput. Res. 2008, 3, 182–191. [Google Scholar]
- Menezes, J.M.P., Jr.; Barreto, G.A. Long-term time series prediction with the NARX network: An empirical evaluation. Neurocomputing 2008, 71, 3335–3343. [Google Scholar] [CrossRef]
- Mathworks. Design Time Series NARX Feedback Neural Networks; Mathworks: Natick, MA, USA, 2021. [Google Scholar]
- University of Johannesburg. Residence per Campus; University of Johannesburg: Johannesburg, South Africa, 2021. [Google Scholar]
Disclaimer/Publisher’s Note: The statements, opinions and data contained in all publications are solely those of the individual author(s) and contributor(s) and not of MDPI and/or the editor(s). MDPI and/or the editor(s) disclaim responsibility for any injury to people or property resulting from any ideas, methods, instructions or products referred to in the content. |
© 2023 by the authors. Licensee MDPI, Basel, Switzerland. This article is an open access article distributed under the terms and conditions of the Creative Commons Attribution (CC BY) license (https://creativecommons.org/licenses/by/4.0/).