Article

Optimizing the Transient Performance of Thermoelectric Generator with PCM by Taguchi Method

1
State Key Laboratory of Automotive Simulation and Control, Jilin University, Changchun 130022, China
2
Chongqing Key Laboratory of Vehicle Emission and Economizing Energy, Chongqing 401122, China
3
Faculty of Engineering, University of Nottingham, Nottingham NG7 2RD, UK
*
Author to whom correspondence should be addressed.
Energies 2023, 16(2), 805; https://doi.org/10.3390/en16020805
Submission received: 15 December 2022 / Revised: 5 January 2023 / Accepted: 6 January 2023 / Published: 10 January 2023
(This article belongs to the Special Issue Advances in Thermal Energy Storage and Applications)

Abstract

:
Phase change material (PCM) is an effective thermal management method to improve the thermoelectric conversion performance of a system. PCM can not only absorb excessive thermal energy at high temperature to protect the thermoelectric module (TEM) and increase the maximum available temperature range, but also compensate for intermittent energy to extend the working time of the TEM. In the paper, the transient performance is improved by adding PCM to a traditional thermoelectric generator (TEG) system. Due to the low thermal conductivity of PCM, metal fins are used to improve the thermal conductivity of PCM. To achieve maximum efficiency of the TEG system, the Taguchi method is employed. Four factors are heat source thermal power, PCM type, height of the PCM box, and filling ratio of the PCM, respectively. The results show that heat source thermal power has the greatest effect, and PCM has the least effect on the conversion efficiency of the TEG system. Conversion efficiency from thermal to electricity is about 1.472% during 2300 s of the heating and cooling stages.

1. Introduction

Due to the global energy crisis and impact of fossil fuels on the environment, it is very important to explore clean energy and reduce environmental pollution [1]. Among the developing methods of renewable energy, TEG has attracted great attention, which can convert thermal directly into electricity. TEG has advantages in operation, such as no noise, no media leakage, small size, light weight, no emissions, and long service life. Therefore, the TEG has great potential for heat recovery with a wide range of applications, such as the space station, automobile, industrial waste heat, plant, unwatched sensors, etc. [2,3]. Conversion efficiency from thermal to electricity is about 5–7%, which makes it difficult to apply widely. So, how to improve the conversion efficiency has become a core issue. In a review paper written by Yan [4], the ways to improve efficiency mainly focus on three aspects: (1) Improving thermoelectric figure of merit (ZT) in materials. (2) Optimizing thermoelectric module. (3) Improving the thermal management of TEG system.
A large number of traditional and emerging thermoelectric materials are developed, such as ceramic [5,6,7], semiconductor [8], and polymers [9]. Peter [10] reviewed the current status and future challenges of thermoelectric material, noting the wide variety of materials and approaches offering many avenues for new material combinations. Lee et al. [11] synthesized the gold nanoparticles-Bi2Te3 nanocomposite by chemical solution-based bottom-up method improved the ZT up to 0.95. Research discovered Zn4Sb3 as a thermoelectric material with high ZT = 1.3 [12]. Now, most thermoelectric materials have ZT value ranging from 1 to 1.6, and an optimistic ZT > 4 would be found in theory [13]. However, it is very difficult to improve the ZT value of thermoelectric materials, because Seebeck coefficient, thermal conductivity, and electrical conductivity are independent of each other [14].
Due to limitations in terms of the performance of thermoelectric materials, a lot of studies have focused on the design and optimization of TEM to improve thermoelectric performance at a certain extent. Kuo et al. [15] designed an annular thermoelectric module (ATEM). The result showed that the open circuit voltage of the ATEM is 17% greater than conventional square-shaped thermoelectric module (STEM). In the literature, researchers have also been carried out to investigate the effect of these parameters, such as the number of thermoelectric (TE) units, and the vertical length of the TE units [16]. Luo et al. [17,18] analyzed the geometry of TEM and obtained the optimum geometry of TEM. It is found that TEM exhibits a higher output power when TEM contains a great number of TE units. The influences of height, cross-sectional area, number of TE units and ceramic plate are investigated to guide the design and parametric optimization of TEM. Wang et al. [19] proved that the output performance occurs peak value with variation in the vertical length of the TE units, and the peak value decreases when the thermal conductivity of the TE units increases.
The thermal management of TEG system determines its performance when TEM has been designed and manufactured. Therefore, some studies improve the power generation by optimizing multiple TEMs and heat exchanger. Kuo et al. [15] proposed a novel concentric cylindrical thermoelectric generator, the results indicated that the novel structure can improve the space utilization of automotive. Liu et al. [20] experimentally investigated a similar structure of the disc sandwich to analyze the thermoelectric conversion performance and temperature characteristics. To improve the output performance of the TEG system, some researchers have proposed a novel prototype for two-stage thermoelectric generator [21,22]. Some studies have tried to maximize the output power by optimizing the heat exchanger on the hot side of TEG system, such as heat exchanger containing fin [23,24], heat pipe [25,26], and PCM [27,28,29]. Li et al. [30] improved the heat supply by integrating the heat pipe. Their analysis shows that it is an effective way to increase the total power by enhancing the temperature at the hot side of TEM. Rezania et al. [31] investigated to maximize the output power by applying a micro plat-fin heat exchanger. Luo et al. [32] proposed a converging heat exchanger to improve the heat transfer performance. Their results indicate that the TEG system generates a higher output performance and a more uniform temperature distribution than the conventional structure. Phase change material is usually required to absorb excess thermal energy and compensate for fluctuation and intermittent energy [33,34], which is an attractive option in waste heat recovery to resolve the thermal management of the TEG system. Researchers investigated experimentally the effect of PCM on the system by controlling the hot side temperature of TEM, the results showed that PCM not only extended the generation time after removing the external heat source, but also protected TEM at high temperature [35,36]. However, PCM has the disadvantage of low thermal conductivity, which limits the application of PCM. Therefore, adding materials with high thermal conductivity to PCM and increasing the heat transfer area can enhance heat transfer performance, such as graphite, nanoparticles with high thermal conductivity, metals fins, metal foam, metal powder, etc.
There are plenty of studies have focused on ways to improve the thermal conductivity of PCM. A form-stable composite PCM with expand graphite can improve thermal conductivity, which makes PCM plays a better buffering effect and reduce fluctuation of TEG performance [29,37]. Bedssem et al. [38] investigated a TEG system containing a PCM-based finned heat sink, which can improve the effectiveness of cooling system. Sohif et al. [39] carried out the melting process in a triplex-tube heat exchanger with PCM. Their results show that the heat transfer between the PCM and fluid is enhanced by internal-external fins. Nakhchi et al. [40] analyzed the vertically heated PCM with fins by numerical simulations, including upward and downward steeped fins. The results showed that the novel fins enable improve PCM melting rate compared to conventional horizontal fins. The latent heat of PCM depends on its mass. Adding PCM can increase the thermal resistance of TEG system, which will weaken the power generation capacity of the TEG system. So, it is particularly important to balance the quality of PCM and materials with high thermal conductivity. There are many ways to optimize PCM. Among them, Taguchi method is one of the optimization techniques, which mainly analyzes the effect of factors and obtains the best combination conditions. Rezania et al. [41] proposed Taguchi method to analyze five critical parameters effective on the system, and achieve the maximum thermal to electrical conversion efficiency of TEG with PCM, finally.
In this paper, the work intended to analyze and optimize the output performance of TEG system. At firstly, a steady fluid-thermal-electric Multiphysics is established to analyze the output performance of the TEG system with the load resistance and select the optimal resistance. Secondly, a transient numerical model with PCM is established to simulate the thermoelectric coupling behavior of the system. Considering the safe operating temperature of TEM and low thermal conductivity of PCM, there are several parameters involved in this study, such as heat source thermal power, PCM type, height of the PCM box, and the filling ratio ( V PCM / V box ) introduced, representing the ratio of the volume of the PCM to the PCM box. Finally, Taguchi method is employed to achieve maximum efficiency in the TEG system, and the optimal values of the control factors are selected. Since there is a safe operating temperature for the TEM, the work considers different heat sources to analyze the influence on the TEG system. In this study, some conclusions and optimization method provide theoretical guidance for PCM-TEG fields in the future.

2. Thermoelectric Theory and Model

2.1. Thermoelectric Theory

The thermal energy of TEG system is provided by heaters and through an energy storage system, TEM, and heat sink. Figure 1 depicts the heat transfer process of the TEG system, in which Q1 and Q2 represent the thermal released by the heater and absorbed by the heat sink, respectively. Qh and Qc represent the thermal absorbed and released of two sides of TEM, respectively. Th and Tc are the temperature of the hot and cold sides of TEM. Rsink, RTEM, and Ress are the thermal resistances of the heat sink, thermoelectric module, and energy storage system. In the process of heat transfer, one part of the thermal is converted into electricity and the other part is transferred to the cold source. According to the TEG system, one can obtain differential equations regarding P, ηTEM, and ηTEGs, which are used to evaluate the thermoelectric conversion performance of the TEG system.
Seebeck coefficient α and internal electrical resistance R in of TEM can be calculated by Equations (1) and (2) as follows.
α = n ( α P     α N )
R in = n ( ρ N A N d N + ρ P A P d P )
where α P and α N represent the Seebeck coefficients of P-type and N-type TE units, respectively; n is the number of TE units; ρ P and ρ N are the electrical resistivities; A P and A N are the cross-sectional areas; d P and d N are the heights.
E = α ( T h     T c )
E is the open-circuit voltage of the TEM.
The loop current and output power of the TEG system are expressed as
I = E R in + R L = α ( T h T c ) R in + R L
P = α 2 ( T h     T c ) 2 ( R in + R L ) 2 · R L = m ( m + 1 ) 2 · α 2 ( T h     T c ) 2 R in
where R L is the load resistance; m is calculated as the R L / R in , where T h and T c represent the hot side and cold side temperature of the TEM, respectively. when m = 1 , output power can reach a maximum value.
Therefore, η of TEM and TEG system are defined as Equations (6) and (7).
η TEM = P Q h = Q h     Q c Q h
η TEGS = P Q 1
According to the above analysis, the load resistance, hot side temperature of TEM, inlet temperature, and velocity of fluid will affect the thermoelectric performance of the system, but the hot side temperature has the greatest impact on the system. The higher the T h value is, the better the system performance will be. In order to maintain the hot side temperature of TEM, a large heat transfer performance is required from source Q 1 to Q h . In the system, the thermal conductivity of PCM is low. Therefore, the energy storage system needs to be optimized to improve the heat transfer performance.

2.2. Heat Recovery System

2.2.1. Physical Model

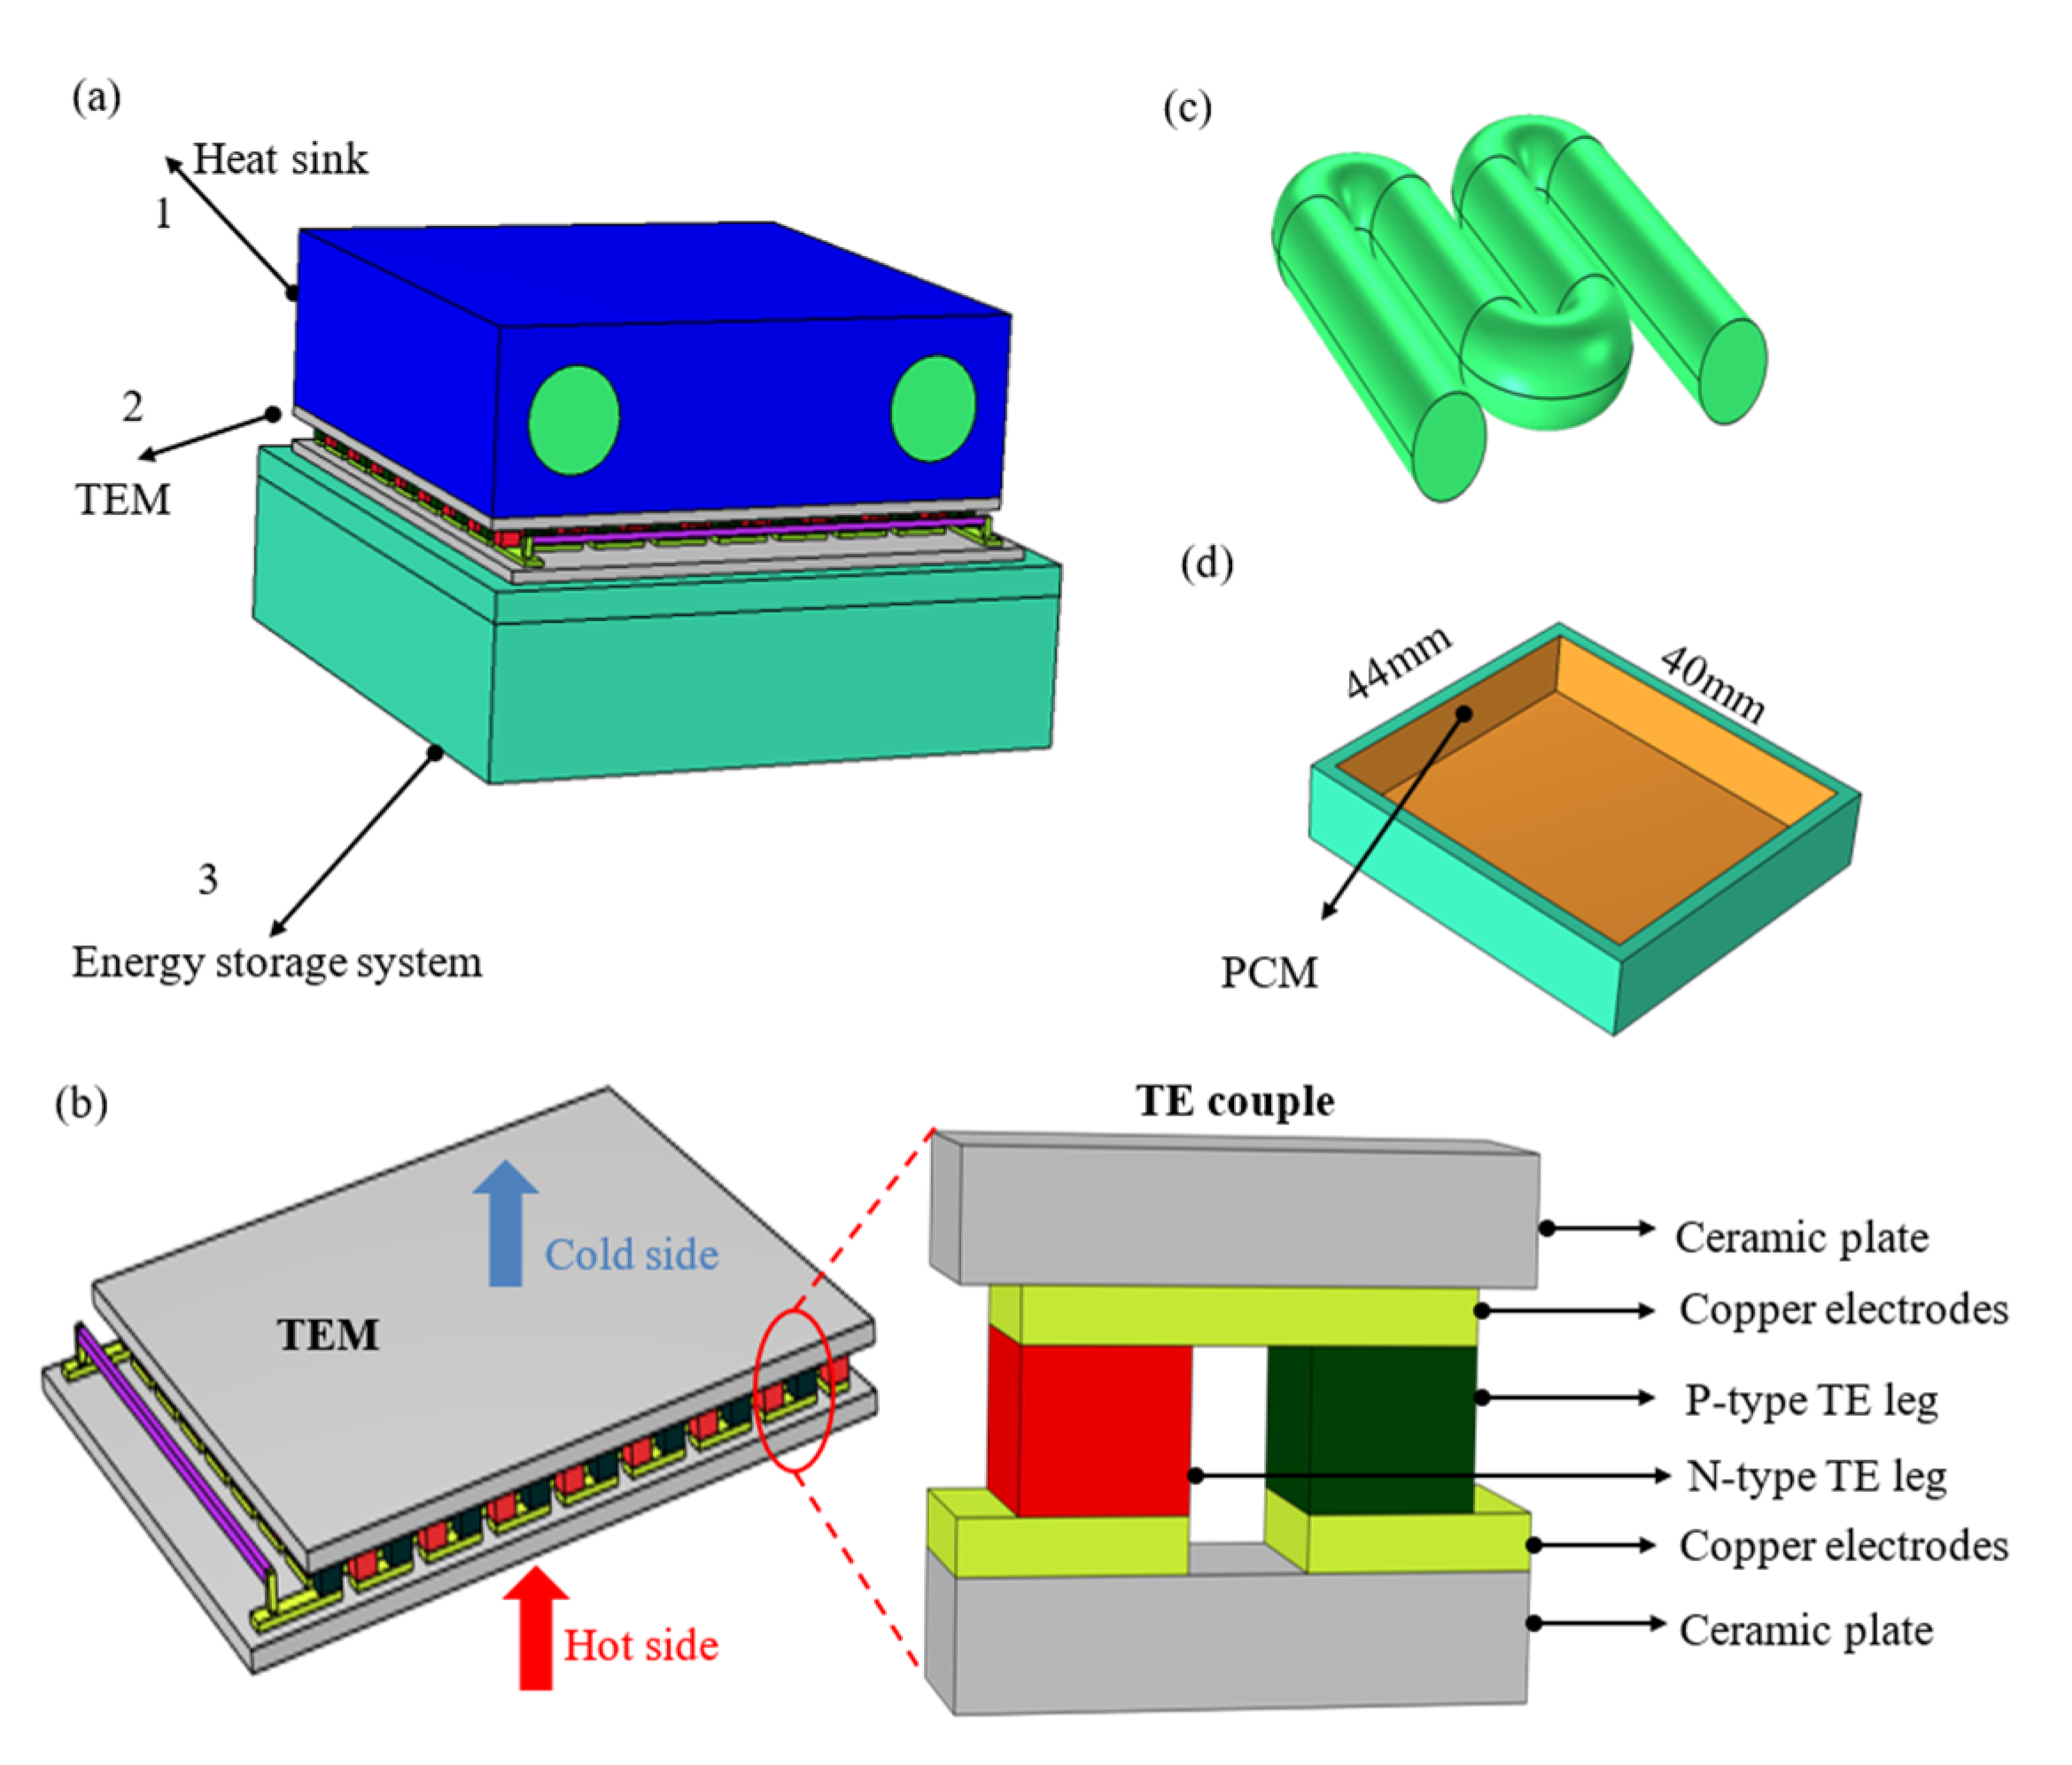
The geometry of the TEG system is shown in Figure 2. TEG system consists of TEM, heat sink and energy storage system. The TEM is between the cooling device and the energy storage system, which depends on the temperature difference to convert heat into electricity, Figure 2a depicts the overall structure of TEG system. TEM is core component in the system, as shown in Figure 2b, which consists of 2 ceramic plates, 128 pairs of Bi2Te3-based P-type and N-type TE units, and 256 conductive coppers. The sizes of ceramic plates, thermoelectric units and copper are 40 mm × 40 (44) mm × 0.8 mm, 1.4 mm × 1.4 mm × 1 mm, 3.8 mm × 1.4 mm × 0.35 mm. To realize the load resistance connected to the TEM by adjusting the electric resistivity of 0.5 mm × 0.5 mm × 35.5 mm geometry (colored in peach) [3,17]. The fluid channel is snake shaped and 7 mm in diameter, as shown in Figure 2c, which can dissipate the thermal energy of the cold side and maintain the temperature consistency of the TEM. Here, the energy storage system consists of PCM and aluminum box with high thermal conductivity, which can absorb excess thermal energy to protect TEM at a safe operating temperature and release thermal energy to enhance the output performance of TEG system after removing the heat source. The aluminum box is shown in Figure 2d.
In this work, the metal fin is added to the PCM box to improve the heat transfer performance of TEG system, which can increase the temperature of the hot side of TEM and make the temperature more uniform inside the PCM. However, the more metal fins are filled, the less PCM is required, so the energy storage capacity decrease of the TEG system. In order to solve this contradiction, temperature uniformity should be improved without affecting the energy storage capacity of system as much as possible. Considering the length, width, and height of metal fin, the filling ratio ( V PCM / V box ) is introduced as the object to optimize the energy storage structure. A diagram of different filling ratios is shown in Figure 3.

2.2.2. Governing Equations

The governing equations of the transient fluid–thermal–electric Multiphysics coupling field include the fluid and solid regions. As a cooling medium, water has a large specific heat capacity, which can promote the heat transfer of the system, and be regarded as incompressible because the Mach number is less than 0.1. In the study, the k-ε model is used to simulate the TEG system. Continuity equation, momentum equation, and energy equation in the numerical model can be expressed by Equations (8)–(10):
  ×   ρ v = 0
t ρ v +   ×   ρ v v = p   +     ×   [ μ ( v +   v T ) ]
ρ c T t + ρ c v   ×   T =   ×   ( λ T )
where p , t , v , μ , c , T , and λ represent the density, time, fluid velocity vector, dynamic viscosity, specific heat capacity, temperature, and thermal conductivity, respectively.
In the electric field, conservation equations are expressed by Equations (11)–(13):
E = + a P , N T T
J = σ m E
× J = 0
where E , , a P , N ( T ) T , σ m , and J represent the electric field vector, electric potential, Seebeck voltage, electric conductivity of the P-type, N-type units and copper, and current density vector.

2.2.3. Boundary Conditions

In this work, Multiphysics coupling field numerical model was established with PCM, including fluid, thermal and electric fields. The boundary conditions of the TEG system are set as shown in Figure 4, which consists of CFD boundary conditions and voltage boundary condition. As for the CFD boundary conditions, the inlet, outlet of the fluid are velocity and pressure boundary, respectively. The pressure boundary is set as a standard atmospheric pressure due to the outlet connected with the external environment. The bottom of the energy storage system of TEG is defined as heat source boundary. For the electric field, the contact surface between the load resistance and TEM is set to ground boundary condition, and the electric potential is equal to 0 V.

2.2.4. Taguchi Method

Taguchi method is a statistical approach, consisting of factors and levels, to analyze the results and select the best combination conditions by an orthogonal array. The orthogonal array has the advantages of uniformly dispersed, neatly comparable and reliably representative for experimental schemes. And the parameter signal-to-noise (S/N) ratio is introduced to analyze the data. There are three types of criteria, namely the lower the better (LB), the nominal the better (NB), and the higher better (HB), which has been widely used in science and engineering to compare the level of a desired signal to the level of the background noise [42,43]. In general, the larger the S/N ratio is, the more consistent the result is. So, the optimal parameters can be obtained from the profiles of the S/N ratio. To improve the thermal to electrical conversion performance of the TEG system with integrating phase change materials, the HB criteria is adopted, finally. The S/N ratio in terms of efficiency is defined by Equations (14) and (15):
S N = 10 log 10 ( 1 η TEGs 2 )
η TEGS = E TEGs E heater
where η TEGS represents the value of thermal to electrical conversion efficiency of TEG system.

3. Results and Discussion

3.1. Performance of TEG System without PCM

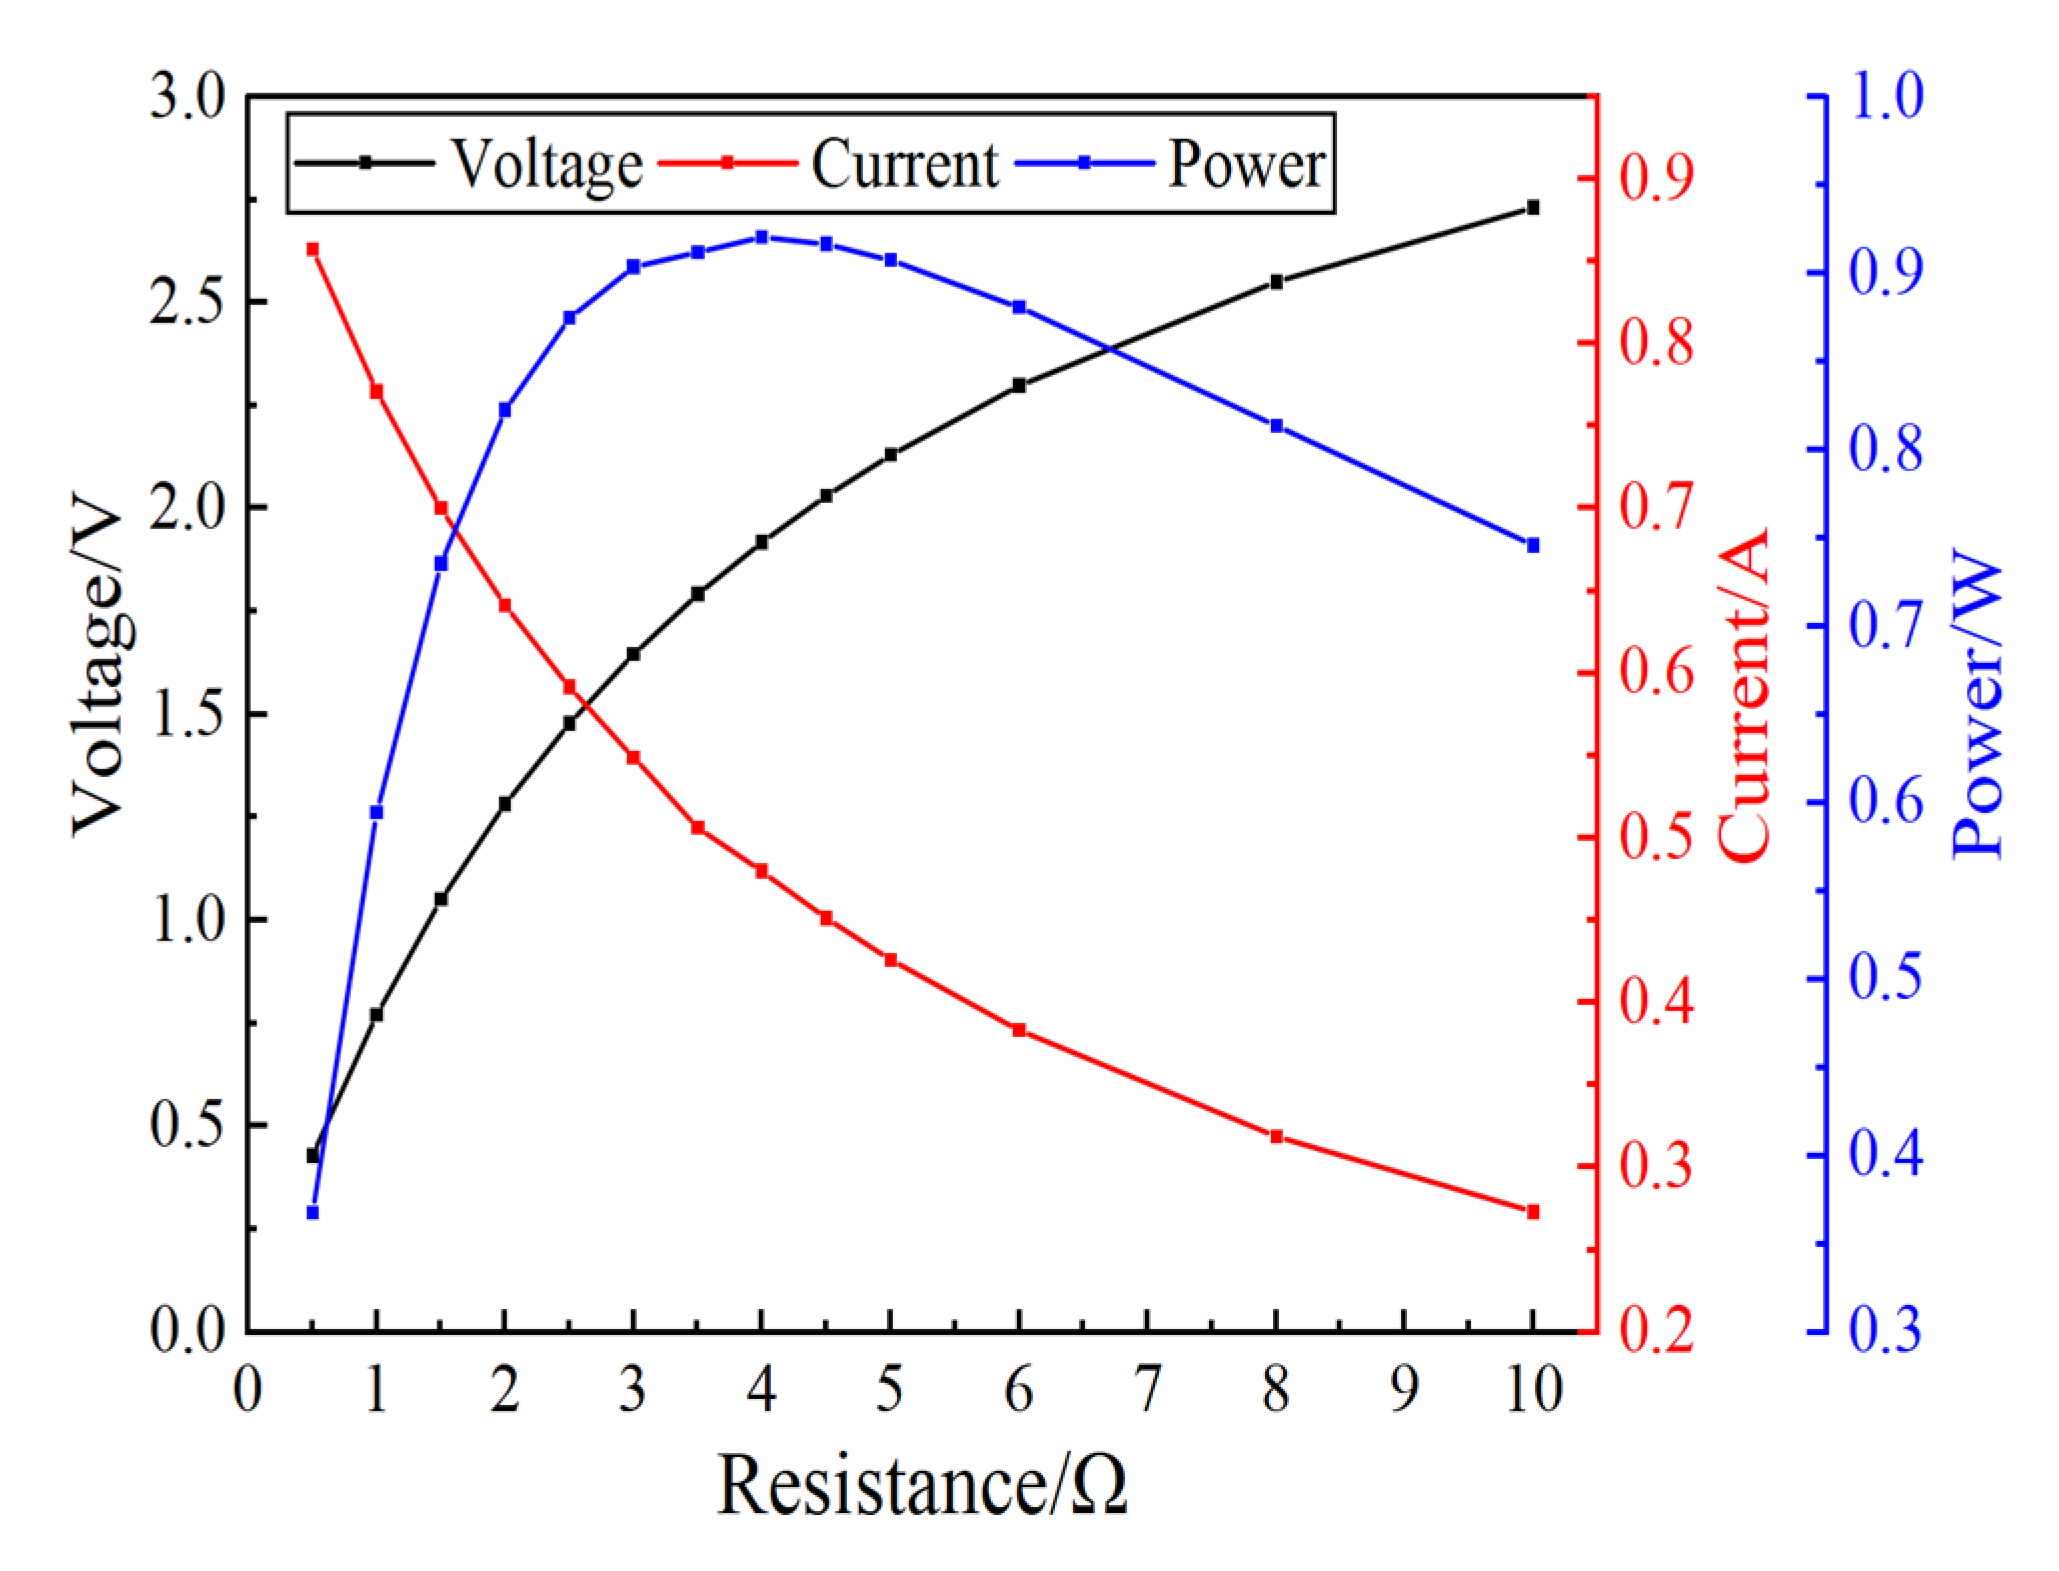
Theoretically, the maximum output power occurs when the load resistance is equal to the internal resistance of TEM. Therefore, it is important to determine the matching load resistance. Under fixed conditions: inlet temperature of fluid = 25 °C, inlet velocity = 0.5 m/s, RL = 0.5 Ω~10 Ω, the hot temperature of TEM = 140 °C, thermoelectric conversion performance of TEG system is analyzed with changing load resistance under steady-state.
In the 3D simulation, the results are related to the quality of the grid, and the appropriate grid model can be determined by comparing and analyzing the calculation results under multiple grids. The model was divided into five categories: coarse, conventional, refined, more refined, and super refined by physical field automation. The number of grids were 157,432, 304,660, 771,632, 2,574,923, and 301,842,285. The results show that with the increase of the number of grids, the output performance of the TEG system improves and gradually becomes stable. Considering the simulation time and accuracy comprehensively, grid III is selected, and the number of grids is 771,632.

3.1.1. Thermoelectric Performance Curves

Under steady-state condition, output voltage, current, and power of the TEG system are shown in Figure 5. With the increase of load resistance, the output voltage gradually increases, the current gradually decreases, and the power has a better value. The maximum output power is achieved when the load resistance is approximately 4 Ω. Therefore, the load resistance = 4 Ω is selected to study the thermoelectric performance with PCM under transient-state.

3.1.2. Physical Field Distribution

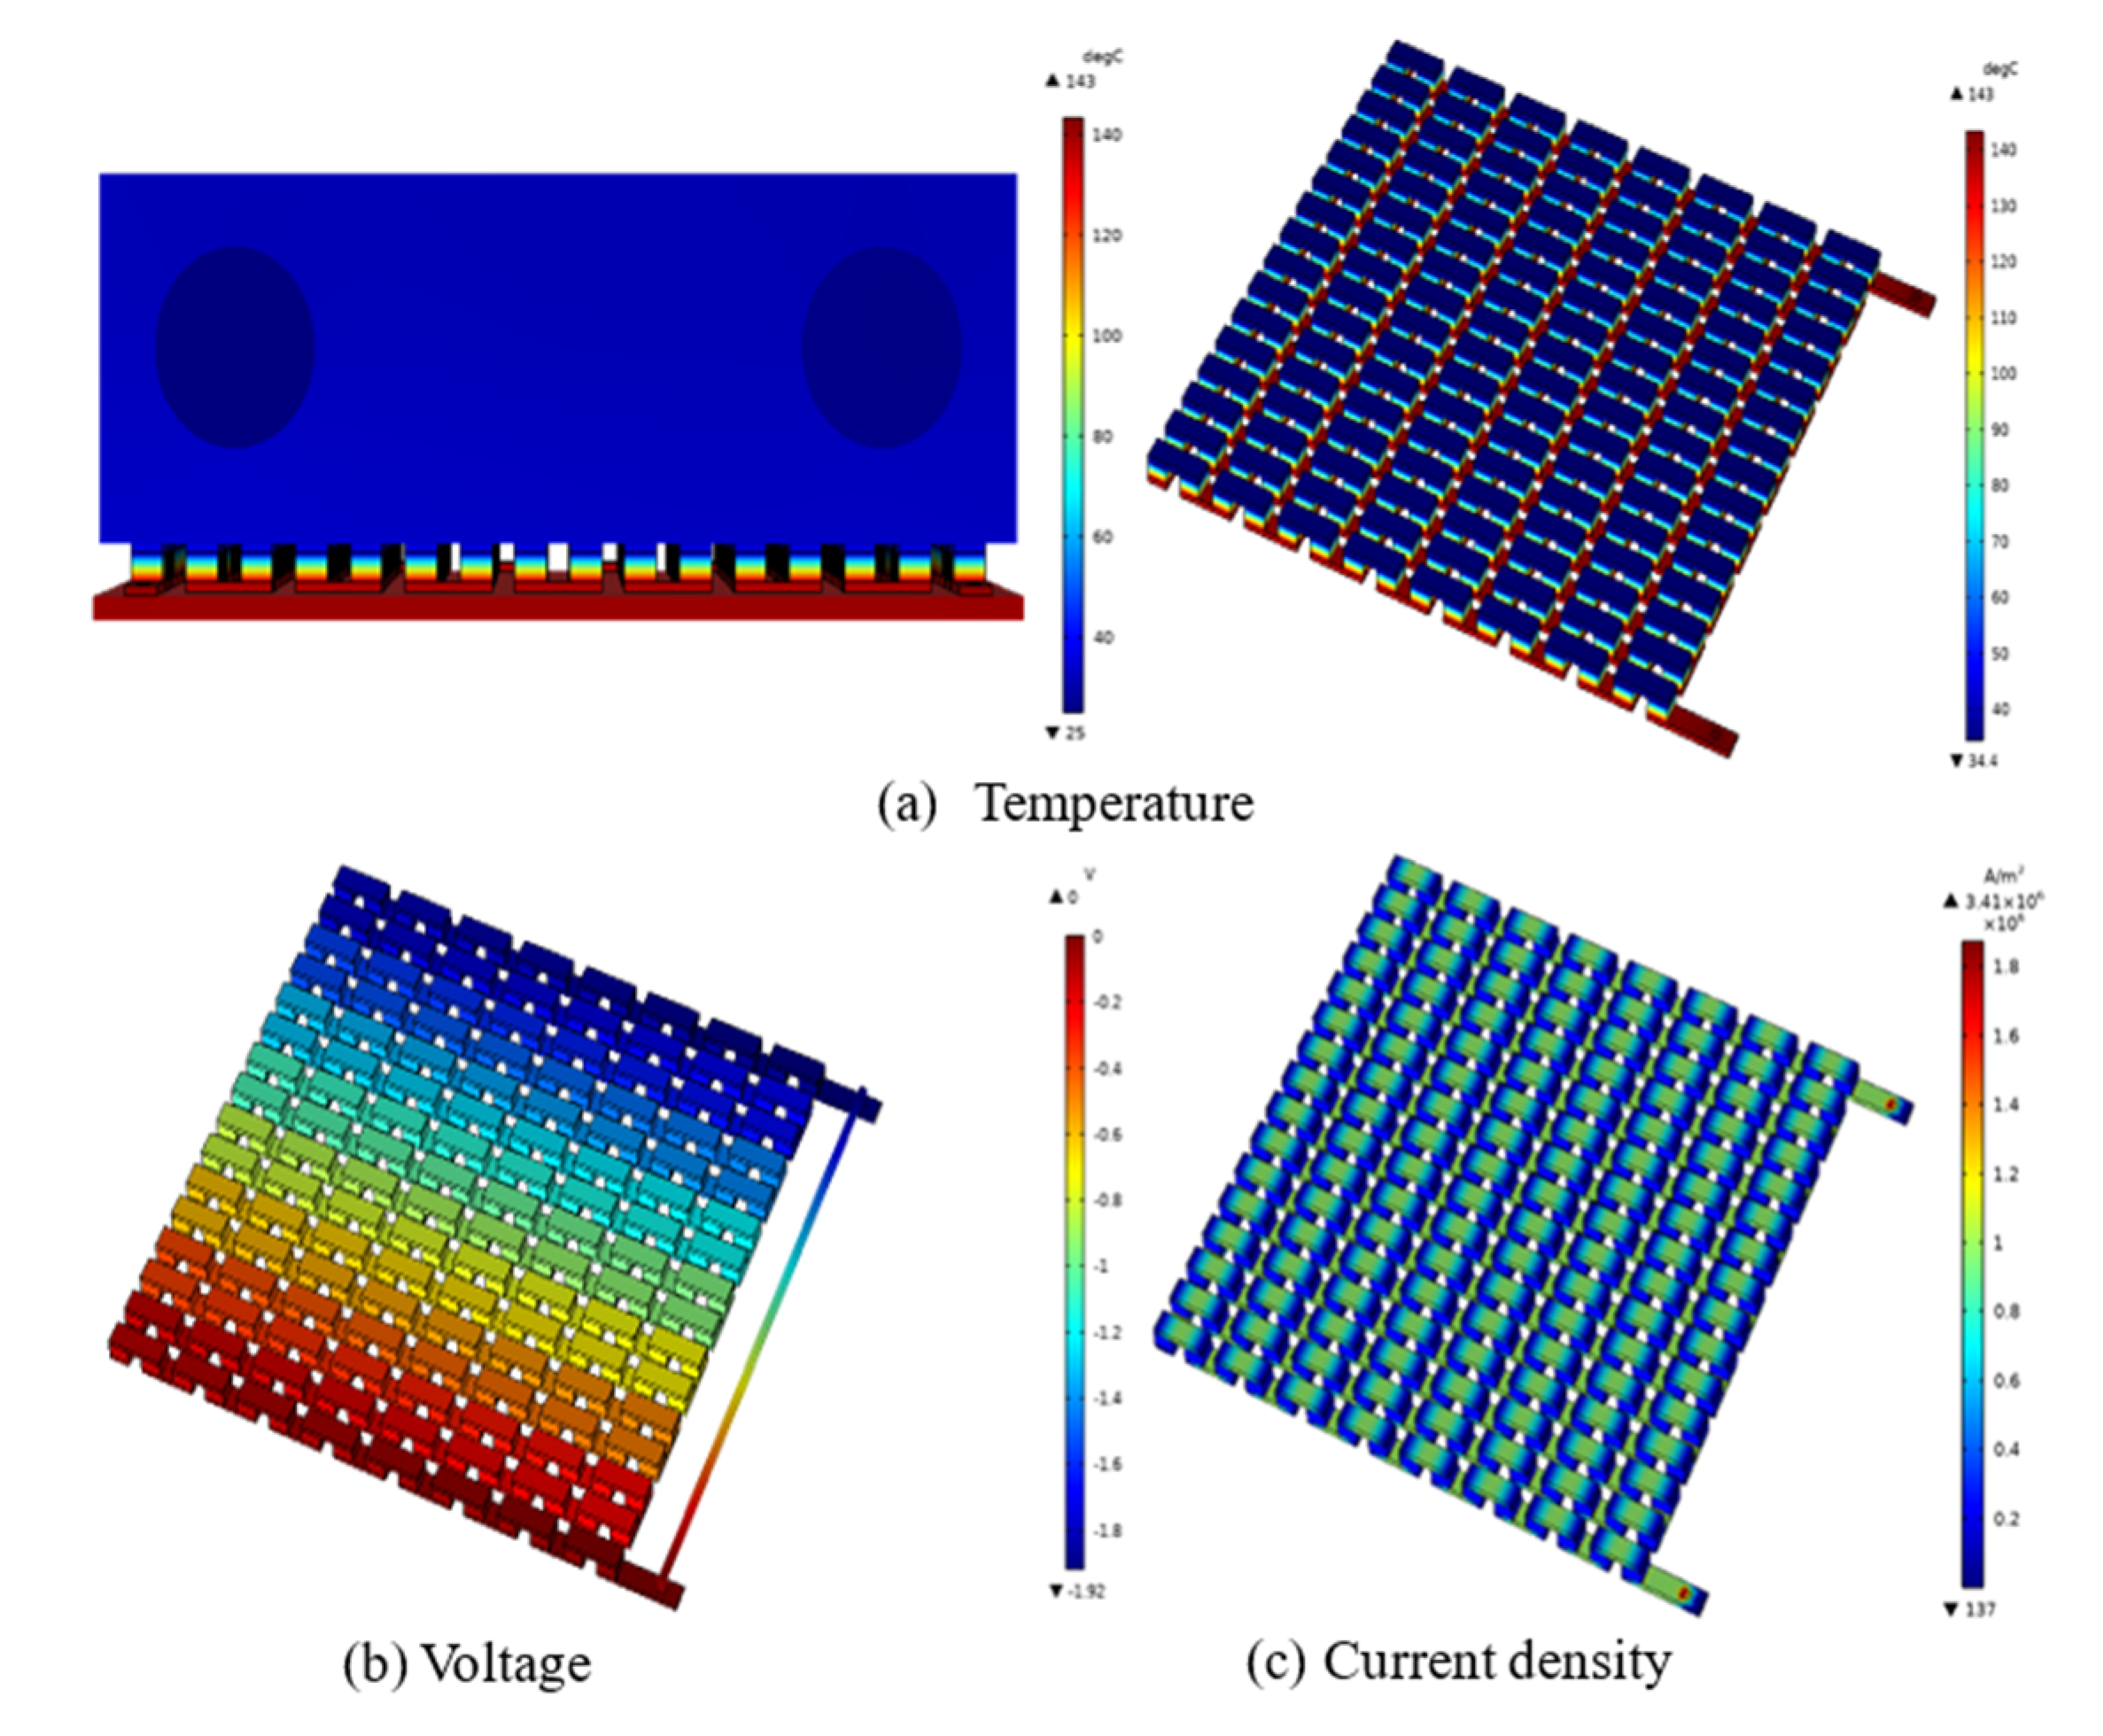
Figure 6 shows the physical filed distribution of TEG system under optimal load resistance. Figure 6a exhibits the temperature distribution of the system. The temperature of the heat sink is very close to the cooling water, because cooling water has a large specific heat capacity. The temperature difference between the two sides of TEM leads to the obvious temperature gradient in the TE units. The main reason is that the thermal conductivity of the TE units is low. Figure 6b shows the voltage distribution of the TEM. The hole in P-type TE units and electrons in N-type TE units move from the hot side to the cold side due to the temperature gradient, which generates voltage under the Seebeck effect. So, the voltage only exists in the circuit of the TE units, the conductive copper, and the load resistance. The current density distribution of the TEM is shown in Figure 6c. Here, 128 pairs of the TE units are connected in series, and the current in the loop is basically unchanged. However, the difference between the cross-sectional area of the TE units and the conductive copper leads to the different current density distribution. Because the coppers have higher electric conductivity and low cross-sectional area, the absolute value of the current density is the highest.

3.2. Operating Conditions and Simulations by Integrating PCM

In this analysis, four factors, namely heat source thermal power, PCM type, filling ratio of the PCM, and height of the PCM box, are considered. Each parameter has four different levels, which are listed in Table 1. Table 2 shows properties of the PCM. For the simulation, the heat source thermal power is imposed to the bottom of energy storage system for 1500 s. Firstly, the effect of PCM on thermoelectric performance and the response of four factors are analyzed during heating and cooling processes by η TEGS . Finally, the optimal run is selected to improve the thermoelectric performance of the TEG system. The temperature and electrical properties of the system are output every 2 s.
Without considering the interaction between four factors, a typical orthogonal number table L16(44) has 16 runs of the Taguchi method with 4 factors and 4 levels. The Taguchi L16 orthogonal array is shown in Table 3.

3.3. Factor Analysis

During the heating and cooling process, the value of the parameters, harvested electrical energy, input thermal energy, efficiency of the system, and S/N ratios at 16 runs are given in Table 4. In the 16 runs, the maximum conversion efficiency of 1.47% is exhibited at Run 12, whereas the minimum conversion efficiency of 0.49% occurs at Run 4. The main reason for this is that Run 12 has a larger heat source thermal power than Run 4, firstly. And the height of the PCM box and filling ratio improve the heat transfer performance of the system at Run 12.
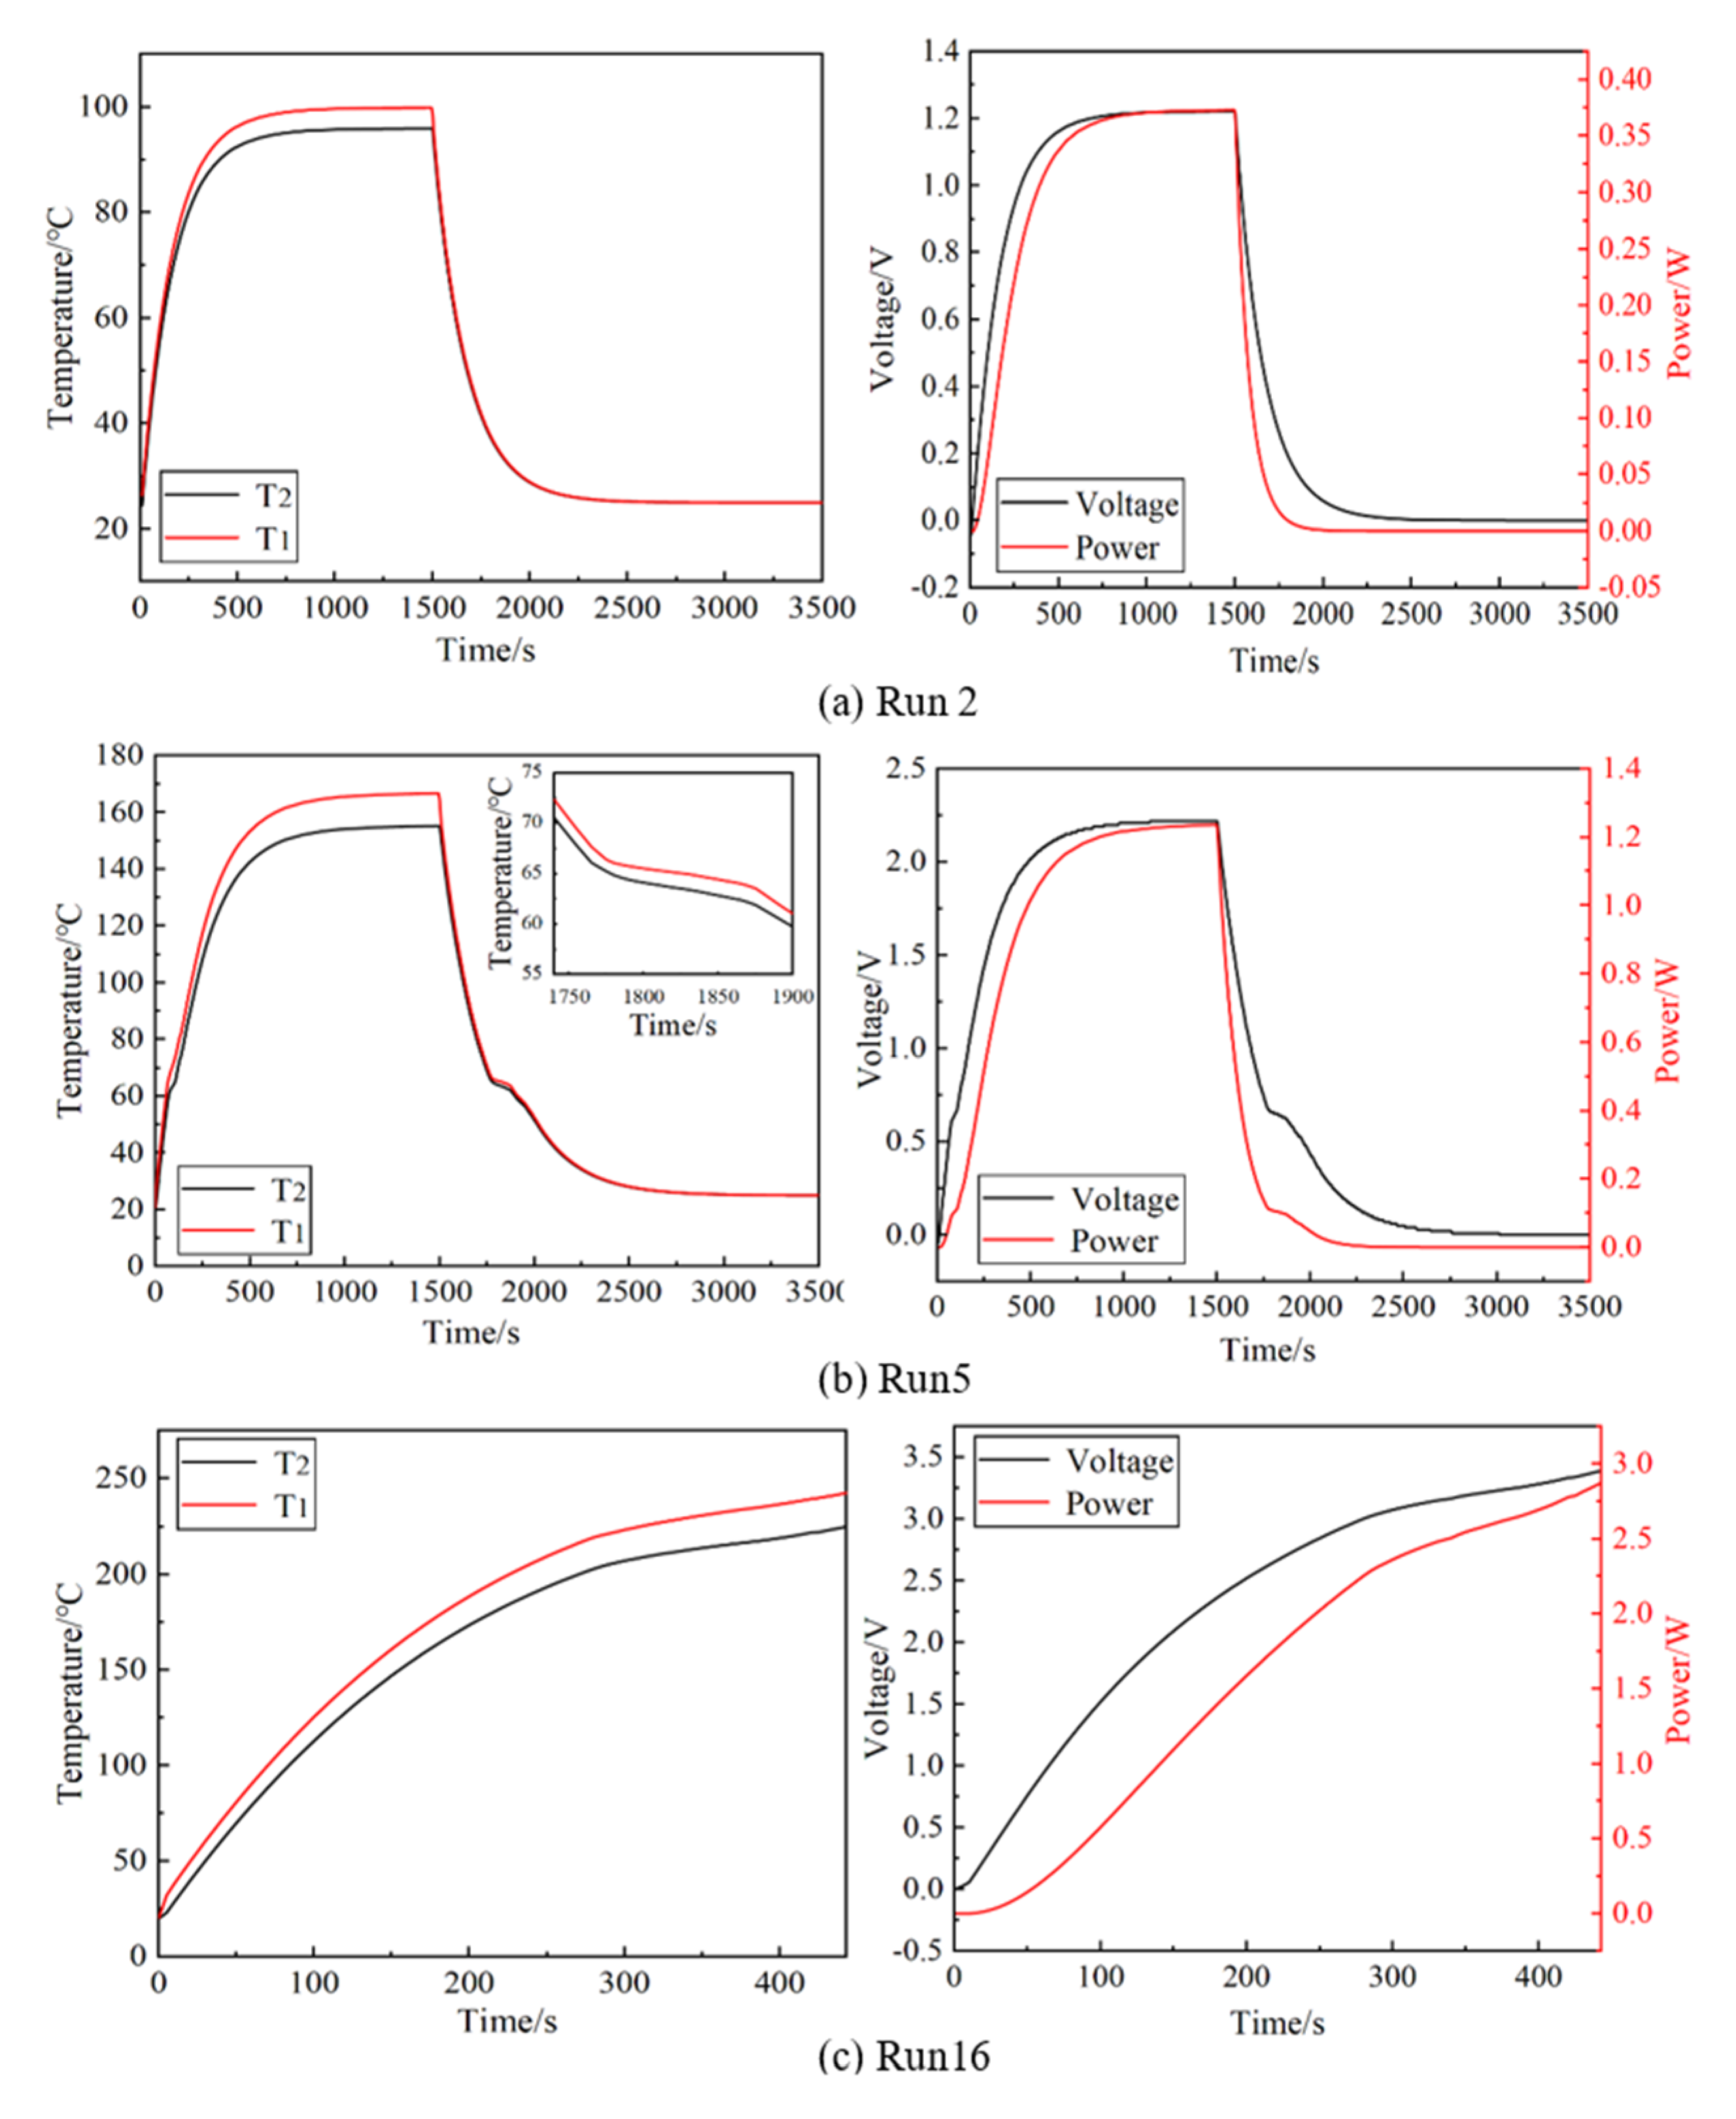
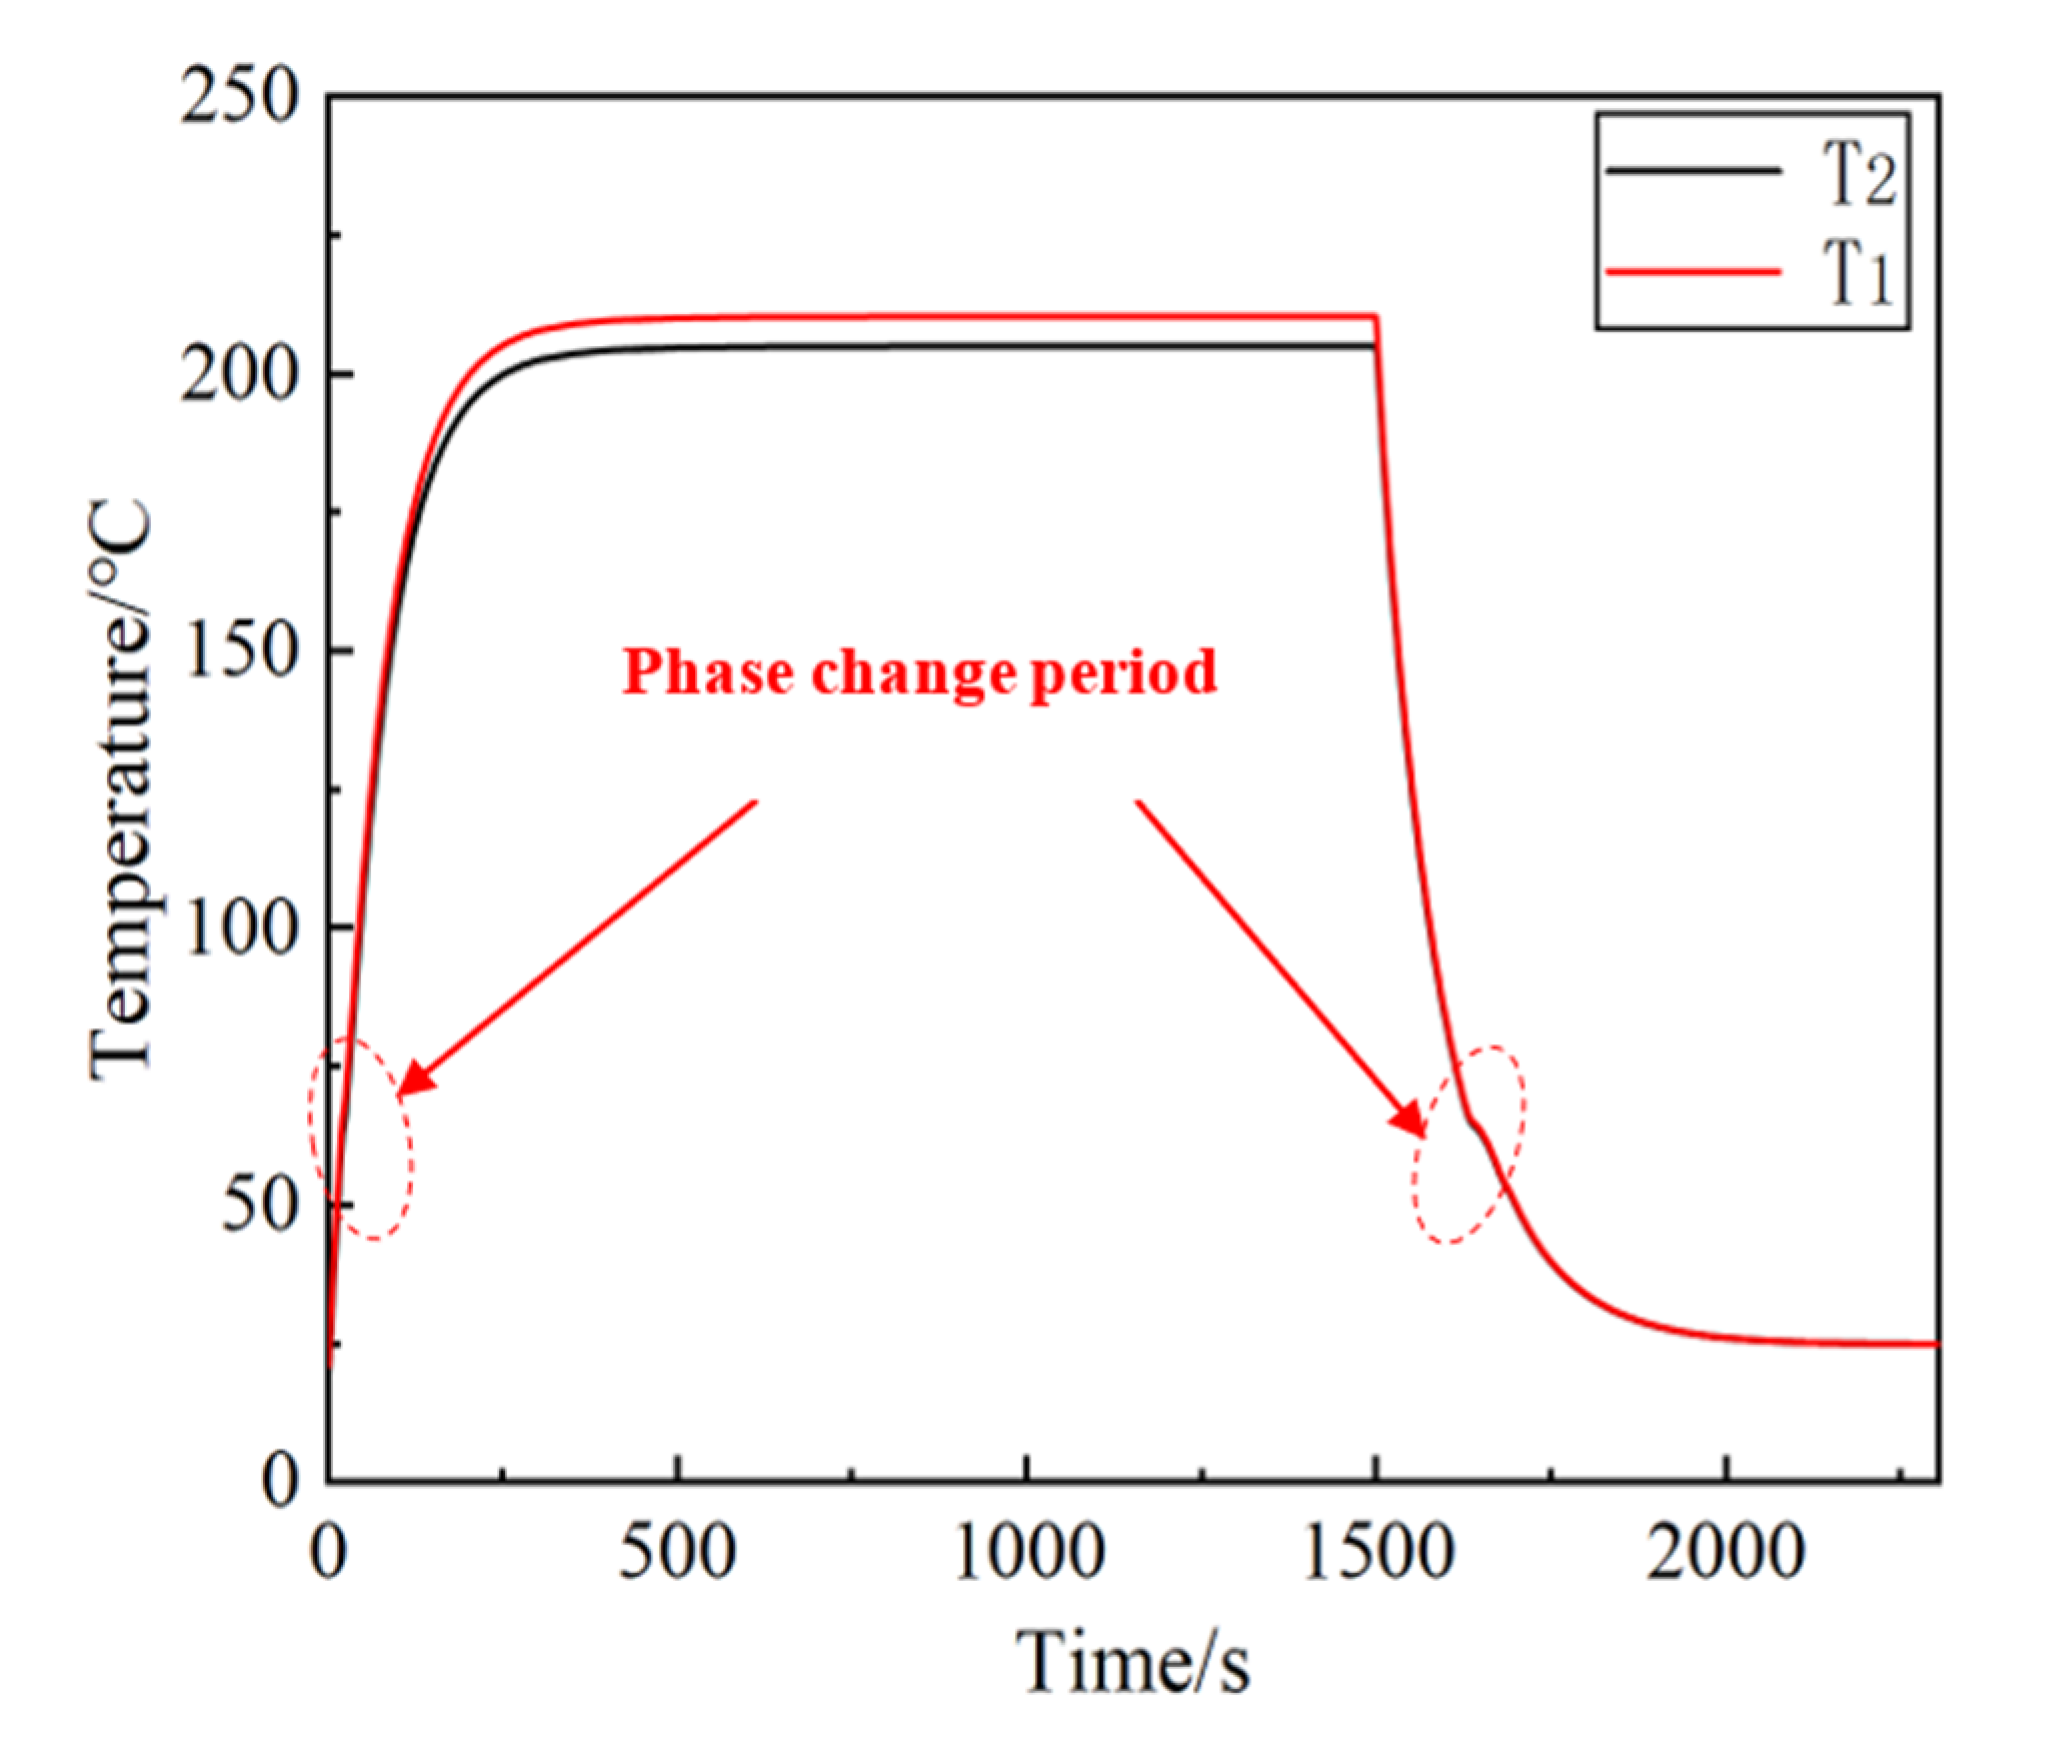
Figure 7 shows three special working conditions, including Run 2, Run 5, and Run16, and the temperature and electrical performance of three runs are analyzed. The temperature curves of the heat source and the hot side of the TEM are described T1 and T2. The PCM did’t reach the phase change point and only increased the thermal resistance of the system in Run 2. In the Run 5, the PCM appears phase change phenomenon during the heating and cooling process, the overheating phenomenon of the TEM is prevented, and working time is extended. While the TEM occurs overheating because the heat source thermal power is too large, and PCM undergoes phase transition during the heating process without the process releasing latent heat.
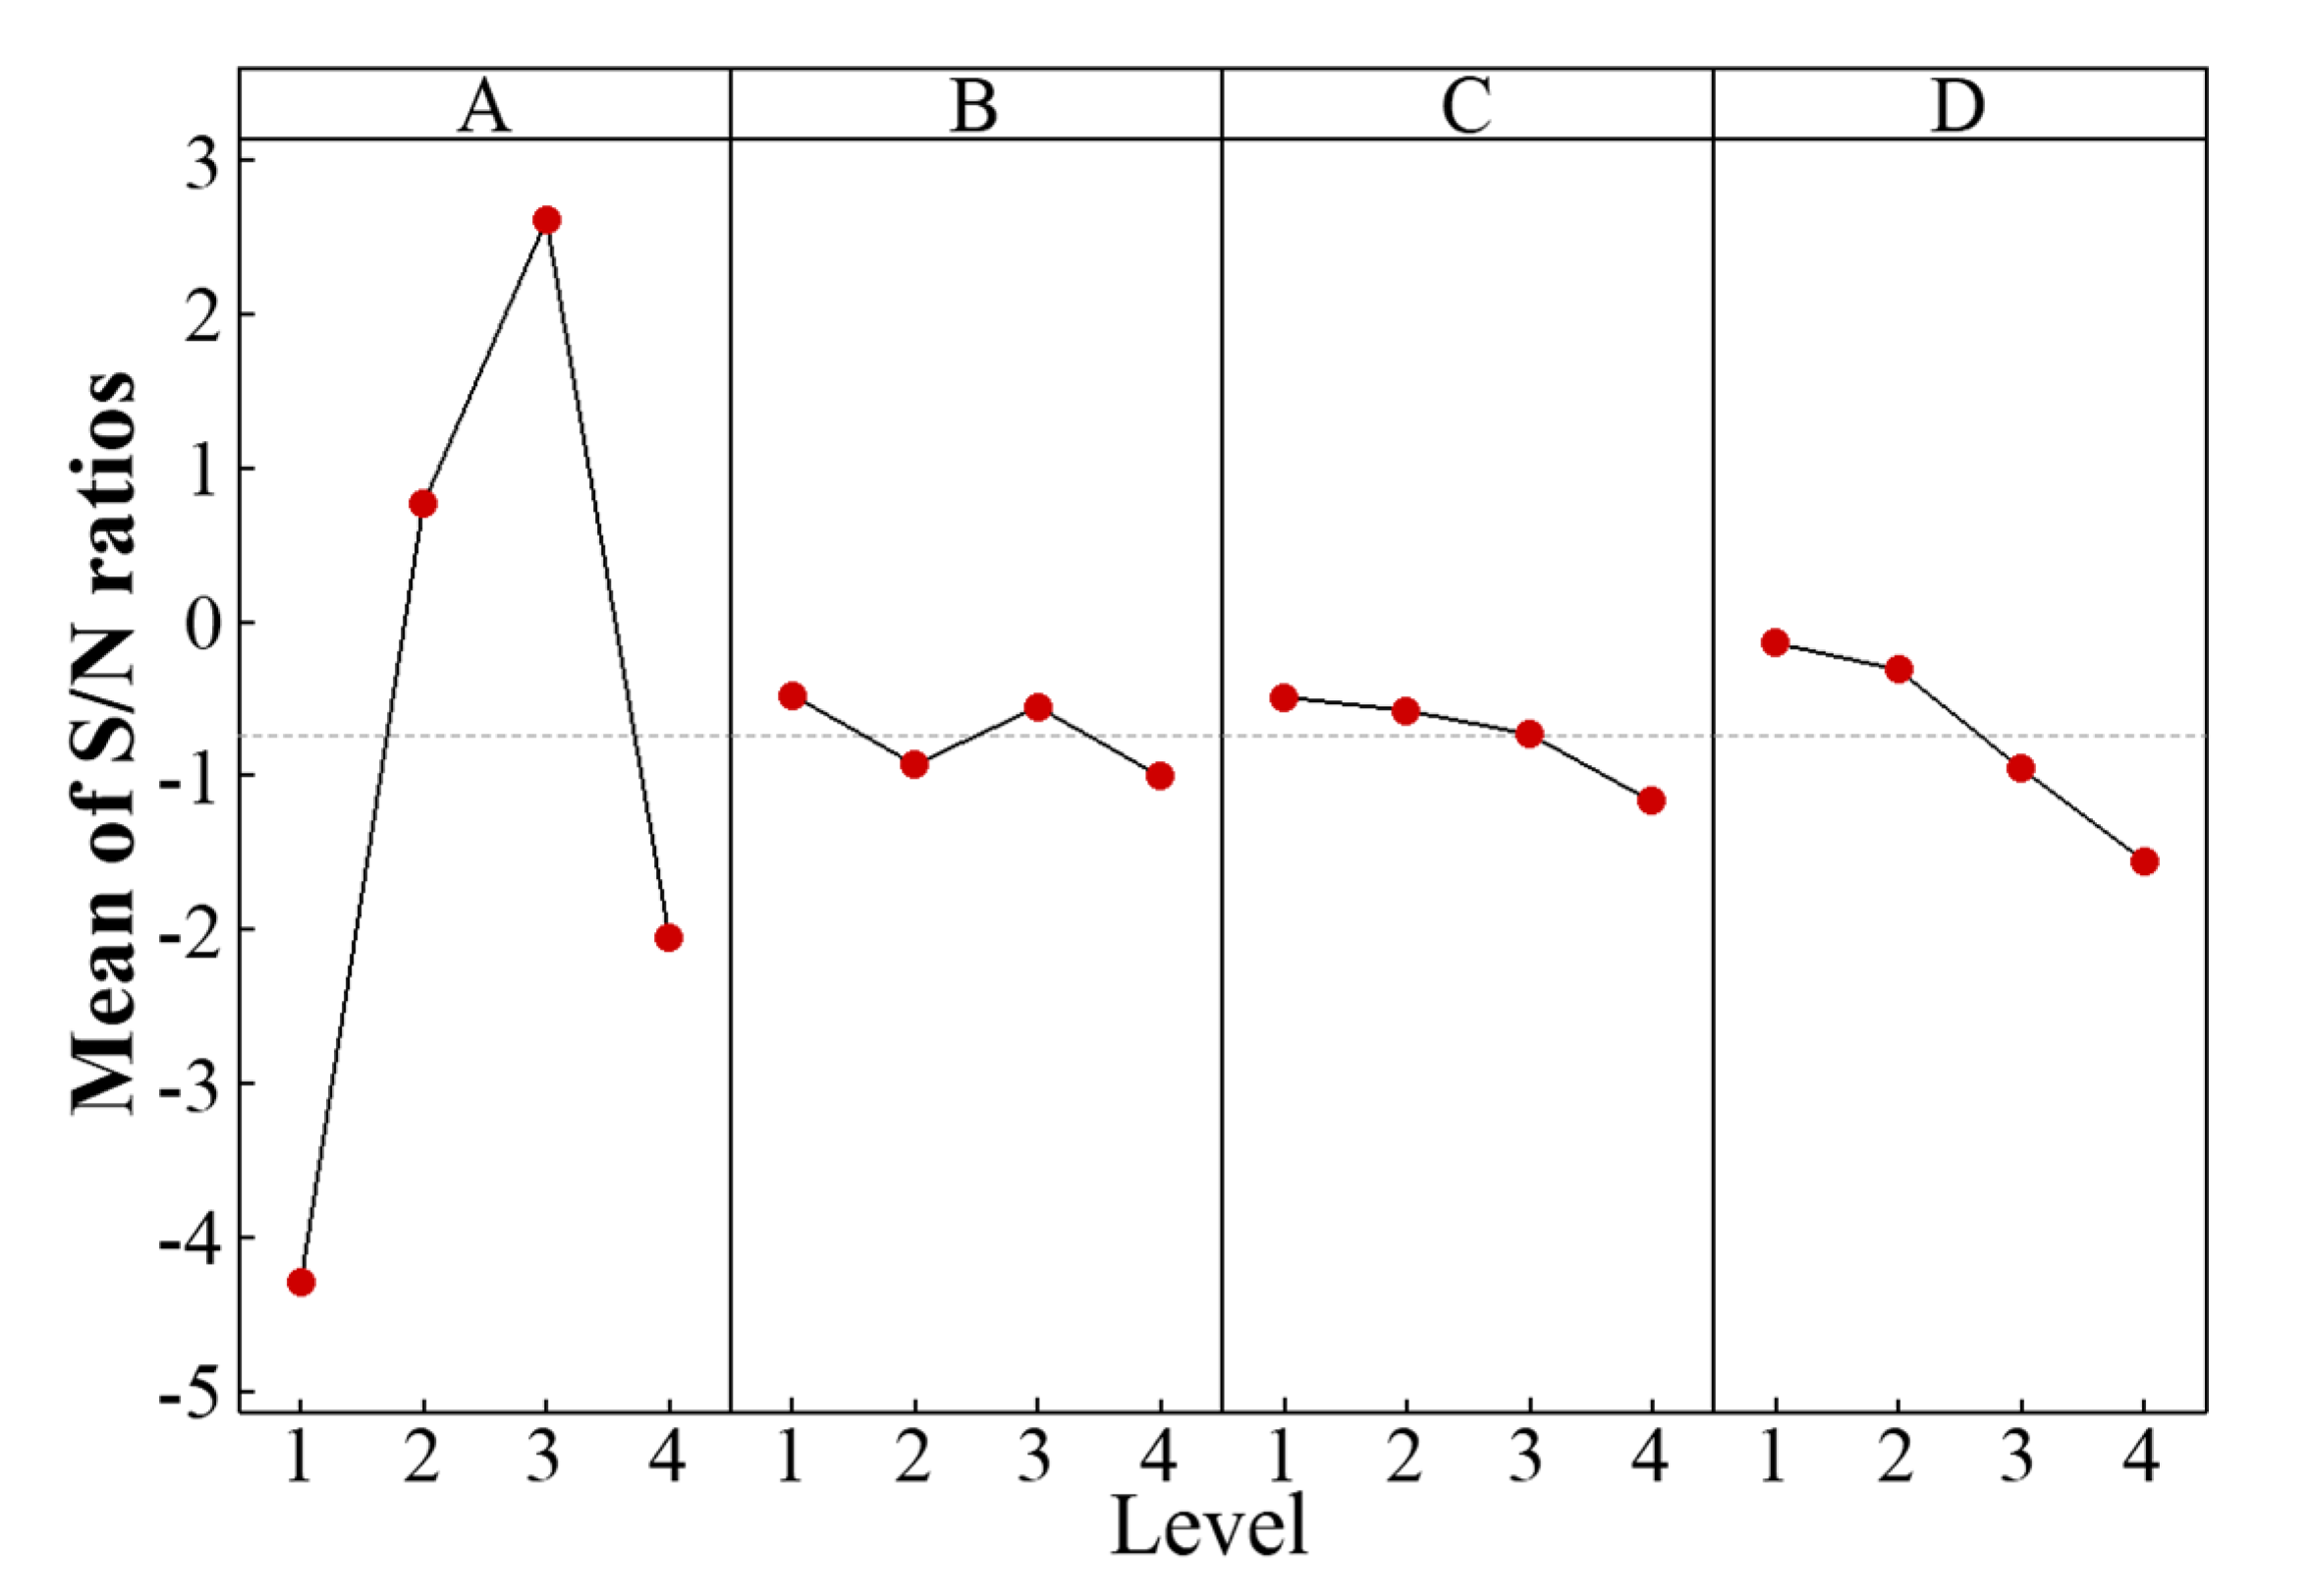
The mean responses for the S/N ratios for each level of the parameters are indicated in Table 5. For example, the mean S/N ratio of Factor A at Level 1 in terms of conversion efficiency is equal to (−3.2189 − 3.6273 − 4.0822 − 6.2383)/4 = 4.2917. The effect of each factor is the difference between the maximum value and the minimum one. Factor A at four levels is numerically (2.6109 + 4.2917) = 6.9026. The higher effect of a factor corresponds to a higher impact on the conversion efficiency of the TEG system. Factor A (heat source thermal power) with the effect of 6.9026 has bigger impact on the system, and Factor B (PCM type) has little effect on the conversion efficiency of the system. The values of the effects of Factors B (PCM type), C (Filling ratio of the PCM), and D (Height of the PCM box) are 0.5313, 0.6799, and 1.4180, respectively. Therefore, the influence of the four factors on the efficiency are ranked as: Factor A > Factor D > Factor C > Factor B. The profiles of the mean S/N ratios of the 4 factors based on the efficiency is shown in Figure 8. Hence, the optimal control parameter levels are A1 (level 1 for A), B1 (level 1 for B), C1 (level 1 for C), and D1 (level for 1).
Based on the above analysis, the heat source thermal power has the greatest influence on the conversion efficiency of the TEG system. However, it will fuse and stop working when the temperature of the TEM exceeds 225 °C. Therefore, greater heat source thermal power does not necessarily mean better performance under certain conditions. There is an optimal value to improve the efficiency of the system and ensure that TEM will not overheat. The PCM type has the least influence on the conversion efficiency. Without considering their own thermal conductivity, the biggest difference of the four PCM is the phase change temperature and latent thermal. So, these two factors should be determined when selecting phase change material.

3.4. Analysis of Optimum Parameters

The optimal run is determined by analyzing the S/N ratio of each factor. The considered values of the parameters are: heat source thermal power = 150 W, PCM type = 65 °C, filing ratio of the PCM = 50%, height of the PCM box = 10 mm. The heater is turned on for 1500 s, and then turned off. The thermoelectric performance of the TEG system and the phase distribution of PCM were analyzed during the heating and cooling process.

3.4.1. Temperature Performance

Figure 9 shows the temperature performance of the thermal source (T1) and the hot TEM (T2). As shown, the bottom of the PCM box reached to 64 °C when heated to 18 s, and PCM stores energy as latent heat during the heating process. The filling of the metal fins improves the heat transfer performance of the energy storage system and reduces the phase change time of PCM. Therefore, the phase transient lasts only 8 s until the top of the PCM is completely melted. When the system is heated to 1112 s, the maximum temperature of T1 and T2 are 210 °C and 205 °C, respectively. Therefore, PCM has the potential to protect the TEM from overheating and extend the working time of the TEM. On the contrary, during the cooling process of the system, the temperature curves tend to be gentle at 1630 s. Because the latent energy is released to the system and the phase change lasts for 20 s. The phase transient during the heating and cooling process are shown in red dotted lines.

3.4.2. Phase Distribution of the PCM

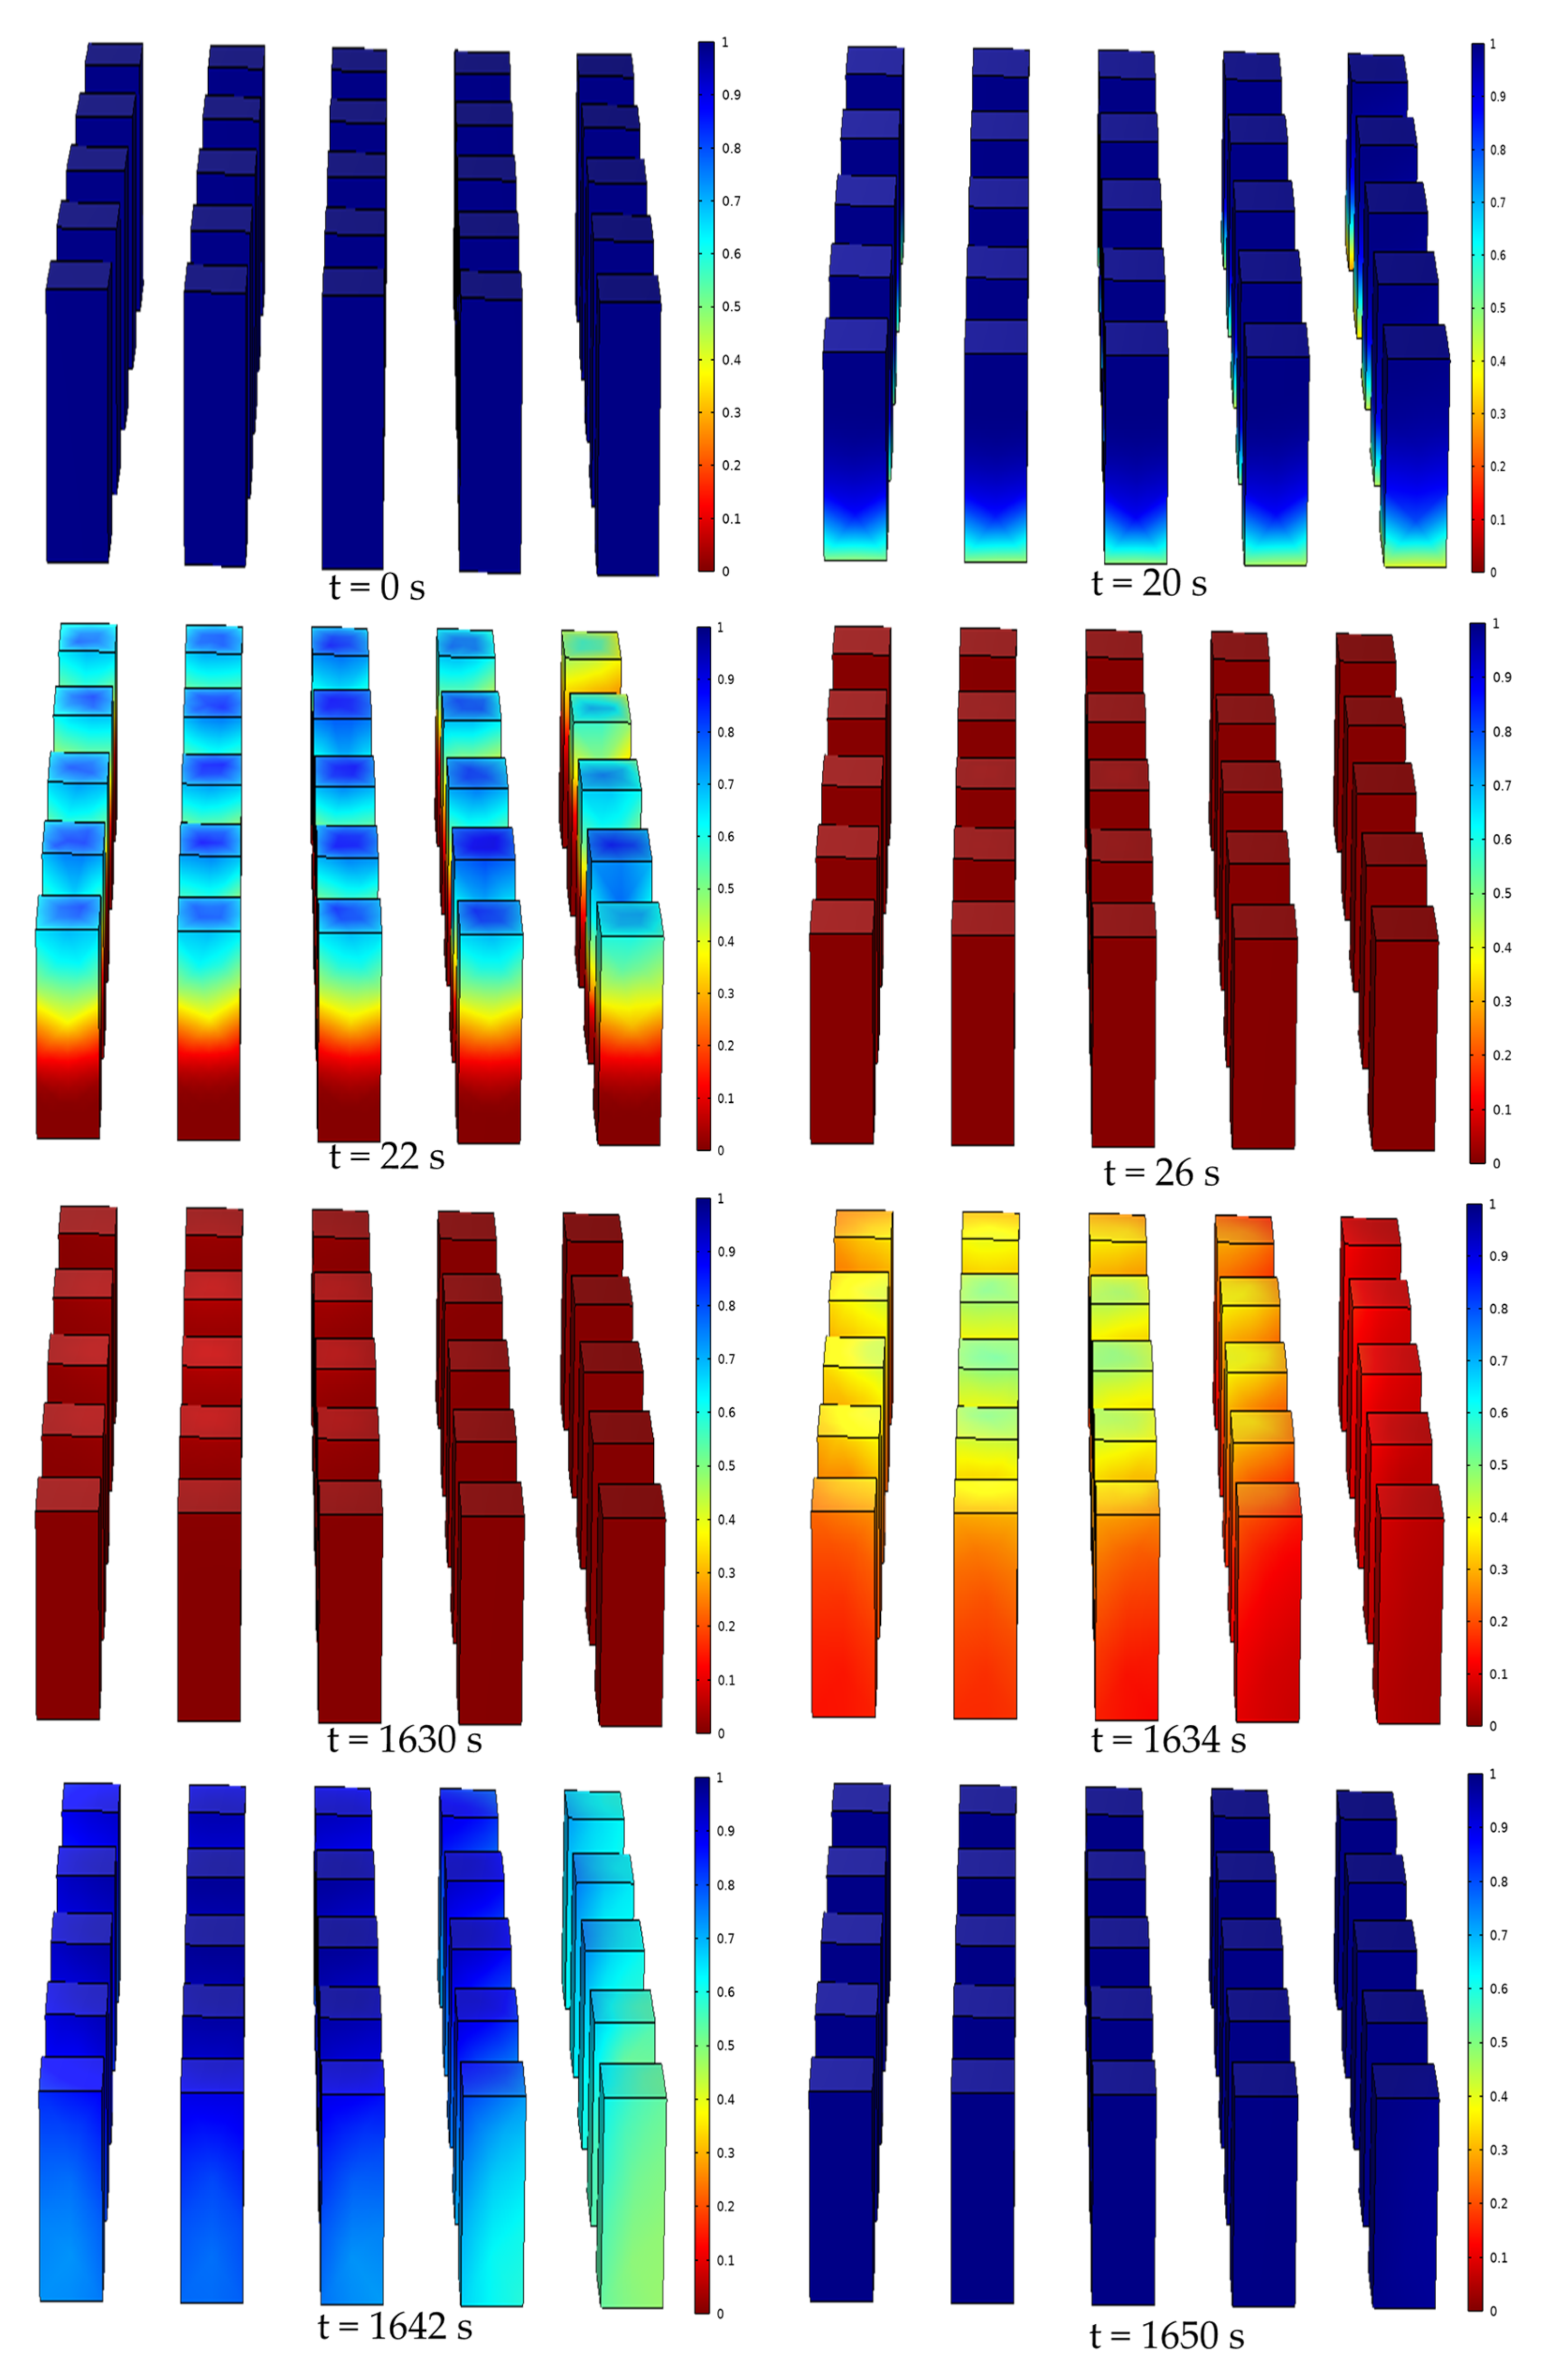
The phase transient profiles between the liquid and solid phases is shown in Figure 10. The bottom of PCM began to melt after heating for 18 s. More than half of the PCM completed phase transient after 22 s, and all of the PCM was melted into liquid phase after 26 s. The heater was turned off at 1500 s. The top of the PCM released latent heat and transformed from liquid to solid phase. The solidification process for the whole PCM took about 20 s.

3.4.3. Electrical Performance

Figure 11 shows the electrical performance of the TEG system in the optimal run. The output voltage and power of the system gradually increase and tend to be stable during the heating process. The maximum voltage and power are 3.0394 V and 2.3095 W, respectively. Although the heat source thermal power was applied to the system for only 1500 s, the system generates electricity lasts 2300 s. The output voltage and power gradually decrease after 1500 s. Consistent with the temperature curves, the electrical properties curve gradually tend to be gentle because the PCM releases the latent heat to maintain a certain temperature. The TEG system harvest 3211.6 J electrical energy during the heating process while 225,000 J heat was applied to the system during 1500 s. Due to the existence of PCM, the system is extended to 700 s and generates 102.4 J electrical energy after removing the heat source thermal power. The overall conversion efficiency of the TEG system is 1.472% under the optimal run, which is higher than the efficiency of the 16 runs in Table 4. Therefore, Taguchi method has a certain reliability to optimize the parameters of the TEG system containing PCM.

4. Conclusions

The aim of this study was to improve the thermoelectric performance of the TEG system under the transient-state. PCM, as the thermal energy storage material, is usually required to absorb excess thermal energy and compensate for intermittent energy. A fluid-thermal-electric Multiphysics numerical model is developed to explore the feasibility of integrating PCM with TEM. The temperature distribution, output voltage, current, power and conversion efficiency of the TEG system are analyzed. Taguchi method was employed to optimize the performance of the TEG system. A L16(44) orthogonal array is built to figure out the sensitivity of the conversion performance to the variations of the four factors and four levels. The results are summarized as follows:
(1)
The thermoelectric conversion performance of the TEG system without PCM is analyzed changing the load resistance under steady-state in this paper, and the optimal load resistance = 4 Ω is selected to study the transient performance of the system with PCM.
(2)
Analyzing the influence of PCM on thermoelectric performance by η TEGS . In the 16 runs, the maximum conversion efficiency of 1.47% is exhibited at Run 12, whereas the minimum conversion efficiency of 0.49% occurs at Run 4. Greater heat source thermal power does not necessarily mean better performance under certain conditions. There is an optimal value to improve efficiency of the system and ensure that TEM will not overheat.
(3)
According to the results, the influence of the four factors on the efficiency are ranked as: heat source thermal power > height of the PCM box > filling ratio of the PCM > PCM type. Under the optimal run, the overall conversion efficiency of the TEG system is 1.472% during the heating and cooling process, which is higher than the efficiency of the16 runs in this study.

Author Contributions

Conceptualization, Z.S. and G.W.; writing—original draft, Z.S.; writing—review & editing, G.W. and Y.Z.; software, Y.Y.; funding acquisition, C.L., B.G. and Q.L. All authors have read and agreed to the published version of the manuscript.

Funding

The work is financially supported by the Open Funding in 2022, Chongqing Key Laboratory of Vehicle Emission and Economizing Energy (PFJN-05), Science and Technology Innovation for Major project of Ningbo (2019B10042).

Conflicts of Interest

The authors declare no conflict of interest.

References

  1. Kazemian, A.; Salari, A.; Ma, T. A year-round study of a photovoltaic thermal system integrated with phase change material in Shanghai using transient model. Energy Convers. Manag. 2020, 210, 112657. [Google Scholar] [CrossRef]
  2. Pourkiaei, S.M.; Ahmadi, M.H.; Sadeghzadeh, M.; Moosavi, S.; Pourfayaz, F.; Chen, L.; Yazdi, M.A.P.; Kumar, R. Thermoelectric cooler and thermoelectric generator devices: A review of present and potential ap-plications, modeling and materials. Energy 2019, 186, 115849. [Google Scholar] [CrossRef]
  3. Luo, D.; Yan, Y.; Wang, R.; Zhou, W. Numerical investigation on the dynamic response characteristics of a thermoelectric generator module under transient temperature excitations. Renew. Energy 2021, 170, 811–823. [Google Scholar] [CrossRef]
  4. Chen, Y.; Hou, X.; Ma, C.; Dou, Y.; Wu, W. Review of Development Status of Bi2Te3-Based Semiconductor Thermoelectric Power Generation. Adv. Mater. Sci. Eng. 2018, 2018, 1210562. [Google Scholar] [CrossRef] [Green Version]
  5. Wu, F.; Wang, W.; Hu, X.; Tang, M. Thermoelectric properties of I-doped n-type Bi2Te3-based material prepared by hydrothermal and subsequent hot pressing. Prog. Nat. Sci. 2017, 27, 203–207. [Google Scholar] [CrossRef]
  6. Tan, G.; Shi, F.; Hao, S.; Zhao, L.D.; Chi, H.; Zhang, X.; Uher, C.; Wolverton, C.; Dravid, V.P.; Kanatzidis, M.G. Non-equilibrium processing leads to record high thermoelectric figure of merit in PbTe–SrTe. Nat. Commun. 2016, 7, 12167. [Google Scholar] [CrossRef]
  7. Nozariasbmarz, A.; Agarwal, A.; Coutant, Z.A.; Hall, M.J.; Liu, J.; Liu, R.; Malhotra, A.; Norouzzadeh, P.; Oeztuerk, M.C.; Ramesh, V.P.; et al. Thermoelectric silicides: A review. Jpn. J. Appl. Phys. 2017, 56, 05DA04. [Google Scholar] [CrossRef]
  8. Sun, Y.; Di, C.; Xu, W.; Zhu, D. Advances in n-Type Organic Thermoelectric Materials and Devices. Adv. Electron. Mater. 2019, 5, 1800825. [Google Scholar] [CrossRef]
  9. Zhang, F.; Di, C.-A. Exploring Thermoelectric Materials from High Mobility Organic Semiconductors. Chem. Mater. 2020, 32, 2688–2702. [Google Scholar] [CrossRef]
  10. Finn, P.A.; Asker, C.; Wan, K.; Bilotti, E.; Fenwick, O.; Nielsen, C.B. Thermoelectric Materials: Current Status and Future Challenges. Front. Electron. Mater. 2021, 1, 677845. [Google Scholar] [CrossRef]
  11. Lee, E.; Ko, J.; Kim, J.Y.; Seo, W.S.; Choi, S.M.; Lee, K.H.; Shim, W.; Lee, W. Enhanced thermoelectric properties of Au nanodot-included Bi2Te3 nanotube composites. J. Mater. Chem. C 2016, 4, 1313–1319. [Google Scholar] [CrossRef]
  12. Mozharivskyj, Y.; Pecharsky, A.O.; Bud’ko, S.; Miller, G.J. A Promising Thermoelectric Material: Zn4Sb3 or Zn6-δSb5. Its Composition, Structure, Stability, and Polymorphs. Structure and Stability of Zn1-δSb. Chem. Mater. 2004, 16, 1580–1589. [Google Scholar] [CrossRef] [Green Version]
  13. Luo, D.; Wang, R.; Yu, W. Comparison and parametric study of two theoretical modeling approaches based on an air-to-water thermoelectric generator system. J. Power Sources 2019, 439, 227069. [Google Scholar] [CrossRef]
  14. Fabián-Mijangos, A.; Min, G.; Alvarez-Quintana, J. Enhanced performance thermoelectric module having asymmetrical legs. Energy Convers. Manag. 2017, 148, 1372–1381. [Google Scholar] [CrossRef]
  15. Huang, K.; Li, B.; Yan, Y.; Li, Y.; Twaha, S.; Zhu, J. A comprehensive study on a novel concentric cylindrical thermoelectric power generation system. Appl. Therm. Eng. 2017, 117, 501–510. [Google Scholar] [CrossRef]
  16. Dongxu, J.; Zhongbao, W.; Pou, J.; Mazzoni, S.; Rajoo, S.; Romagnoli, A. Geometry optimization of thermoelectric modules: Simulation and experimental study. Energy Convers. Manag. 2019, 195, 236–243. [Google Scholar] [CrossRef]
  17. Luo, D.; Wang, R.; Yu, W.; Zhou, W. A novel optimization method for thermoelectric module used in waste heat recovery. Energy Convers. Manag. 2020, 209, 112645. [Google Scholar] [CrossRef]
  18. Luo, D.; Wang, R.; Yu, W.; Zhou, W. Parametric study of a thermoelectric module used for both power generation and cooling. Renew. Energy 2020, 154, 542–552. [Google Scholar] [CrossRef]
  19. Wang, Y.; Dai, C.; Wang, S. Theoretical analysis of a thermoelectric generator using exhaust gas of vehicles as heat source. Appl. Energy 2013, 112, 1171–1180. [Google Scholar] [CrossRef]
  20. Liu, Y.; Shi, Z.; Wang, G.; Yan, Y.; Zhang, Y. Experimental Investigation for a Novel Prototype of a Thermoelectric Power Generator with Heat Pipes. Front. Energy Res. 2021, 9, 744366. [Google Scholar] [CrossRef]
  21. Asaadi, S.; Khalilarya, S.; Jafarmadar, S. A thermodynamic and exergoeconomic numerical study of two-stage annular thermoelectric generator. Appl. Therm. Eng. 2019, 156, 371–381. [Google Scholar] [CrossRef]
  22. Atouei, S.A.; Ranjbar, A.A.; Rezania, A. Experimental investigation of two-stage thermoelectric generator system integrated with phase change materials. Appl. Energy 2017, 208, 332–343. [Google Scholar] [CrossRef]
  23. Wang, Y.; Wu, C.; Tang, Z.; Yang, X.; Deng, Y.; Su, C. Optimization of Fin Distribution to Improve the Temperature Uniformity of a Heat Exchanger in a Ther-moelectric Generator. J. Electron. Mater. 2015, 44, 1724–1732. [Google Scholar] [CrossRef]
  24. Ma, T.; Lu, X.; Pandit, J.; Ekkad, S.V.; Huxtable, S.T.; Deshpande, S.; Wang, Q.-W. Numerical study on thermoelectric–hydraulic performance of a thermoelectric power generator with a plate-fin heat exchanger with longitudinal vortex generators. Appl. Energy 2017, 185, 1343–1354. [Google Scholar] [CrossRef] [Green Version]
  25. Orr, B.; Akbarzadeh, A.; Mochizuki, M.; Singh, R. A review of car waste heat recovery systems utilising thermoelectric generators and heat pipes. Appl. Therm. Eng. 2016, 101, 490–495. [Google Scholar] [CrossRef]
  26. Shittu, S.; Li, G.; Zhao, X.; Zhou, J.; Ma, X.; Akhlaghi, Y.G. Experimental study and exergy analysis of photovoltaic-thermoelectric with flat plate micro-channel heat pipe. Energy Convers. Manag. 2020, 207, 112515. [Google Scholar] [CrossRef]
  27. Gholaminia, V.; Rahimi, M.; Ghaebi, H. Heat storage process analysis in a heat exchanger containing phase change materials. J. Energy Storage 2020, 32, 101875. [Google Scholar] [CrossRef]
  28. Yu, C.; Yang, S.H.; Pak, S.Y.; Youn, J.R.; Song, Y.S. Graphene embedded form stable phase change materials for drawing the thermo-electric energy harvesting. Energy Convers. Manag. 2018, 169, 88–96. [Google Scholar] [CrossRef]
  29. Yu, J.; Kong, L.; Wang, H.; Zhu, H.; Zhu, Q.; Su, J. A Novel Structure for Heat Transfer Enhancement in Phase Change Composite: Rolled Graphene Film Embedded in Graphene Foam. ACS Appl. Energy Mater. 2019, 2, 1192–1198. [Google Scholar] [CrossRef]
  30. Li, B.; Huang, K.; Yan, Y.; Li, Y.; Twaha, S.; Zhu, J. Heat transfer enhancement of a modularised thermoelectric power generator for passenger vehicles. Appl. Energy 2017, 205, 868–879. [Google Scholar] [CrossRef]
  31. Rezania, A.; Yazawa, K.; Rosendahl, L.; Shakouri, A. Co-optimized design of microchannel heat exchangers and thermoelectric generators. Int. J. Therm. Sci. 2013, 72, 73–81. [Google Scholar] [CrossRef]
  32. Luo, D.; Wang, R.; Yu, W.; Zhou, W. A numerical study on the performance of a converging thermoelectric generator system used for waste heat recovery. Appl. Energy 2020, 270, 115181. [Google Scholar] [CrossRef]
  33. Huang, K.; Yan, Y.; Wang, G.; Li, B. Improving transient performance of thermoelectric generator by integrating phase change material. Energy 2020, 219, 119648. [Google Scholar] [CrossRef]
  34. Arena, S.; Casti, E.; Gasia, J.; Cabeza, L.F.; Cau, G. Numerical simulation of a finned-tube LHTES system: Influence of the mushy zone constant on the phase change behaviour. Energy Procedia 2017, 126, 517–524. [Google Scholar] [CrossRef]
  35. Atouei, S.A.; Rezania, A.; Ranjbar, A.; Rosendahl, L. Protection and thermal management of thermoelectric generator system using phase change materials: An experimental investigation. Energy 2018, 156, 311–318. [Google Scholar] [CrossRef]
  36. Jaworski, M.; Bednarczyk, M.; Czachor, M. Experimental investigation of thermoelectric generator (TEG) with PCM module. Appl. Therm. Eng. 2016, 96, 527–533. [Google Scholar] [CrossRef]
  37. Tu, Y.; Zhu, W.; Lu, T.; Deng, Y. A novel thermoelectric harvester based on high-performance phase change material for space application. Appl. Energy 2017, 206, 1194–1202. [Google Scholar] [CrossRef]
  38. Debich, B.; El Hami, A.; Yaich, A.; Gafsi, W.; Walha, L.; Haddar, M. Design optimization of PCM-based finned heat sinks for mechatronic components: A numerical investigation and parametric study. J. Energy Storage 2020, 32, 101960. [Google Scholar] [CrossRef]
  39. Mat, S.; Al-Abidi, A.A.; Sopian, K.; Sulaiman, M.Y.; Mohammad, A.T. Enhance heat transfer for PCM melting in triplex tube with internal–external fins. Energy Convers. Manag. 2013, 74, 223–236. [Google Scholar] [CrossRef]
  40. Nakhchi, M.; Esfahani, J. Improving the melting performance of PCM thermal energy storage with novel stepped fins. J. Energy Storage 2020, 30, 101424. [Google Scholar] [CrossRef]
  41. Rezania, A.; Atouei, S.A.; Rosendahl, L. Critical parameters in integration of thermoelectric generators and phase change materials by numerical and Taguchi methods. Mater. Today Energy 2020, 16, 100376. [Google Scholar] [CrossRef]
  42. Chen, W.-H.; Huang, S.-R.; Lin, Y.-L. Performance analysis and optimum operation of a thermoelectric generator by Taguchi method. Appl. Energy 2015, 158, 44–54. [Google Scholar] [CrossRef]
  43. Pandey, N.; Murugesan, K.; Thomas, H. Optimization of ground heat exchangers for space heating and cooling applications using Taguchi method and utility concept. Appl. Energy 2017, 190, 421–438. [Google Scholar] [CrossRef]
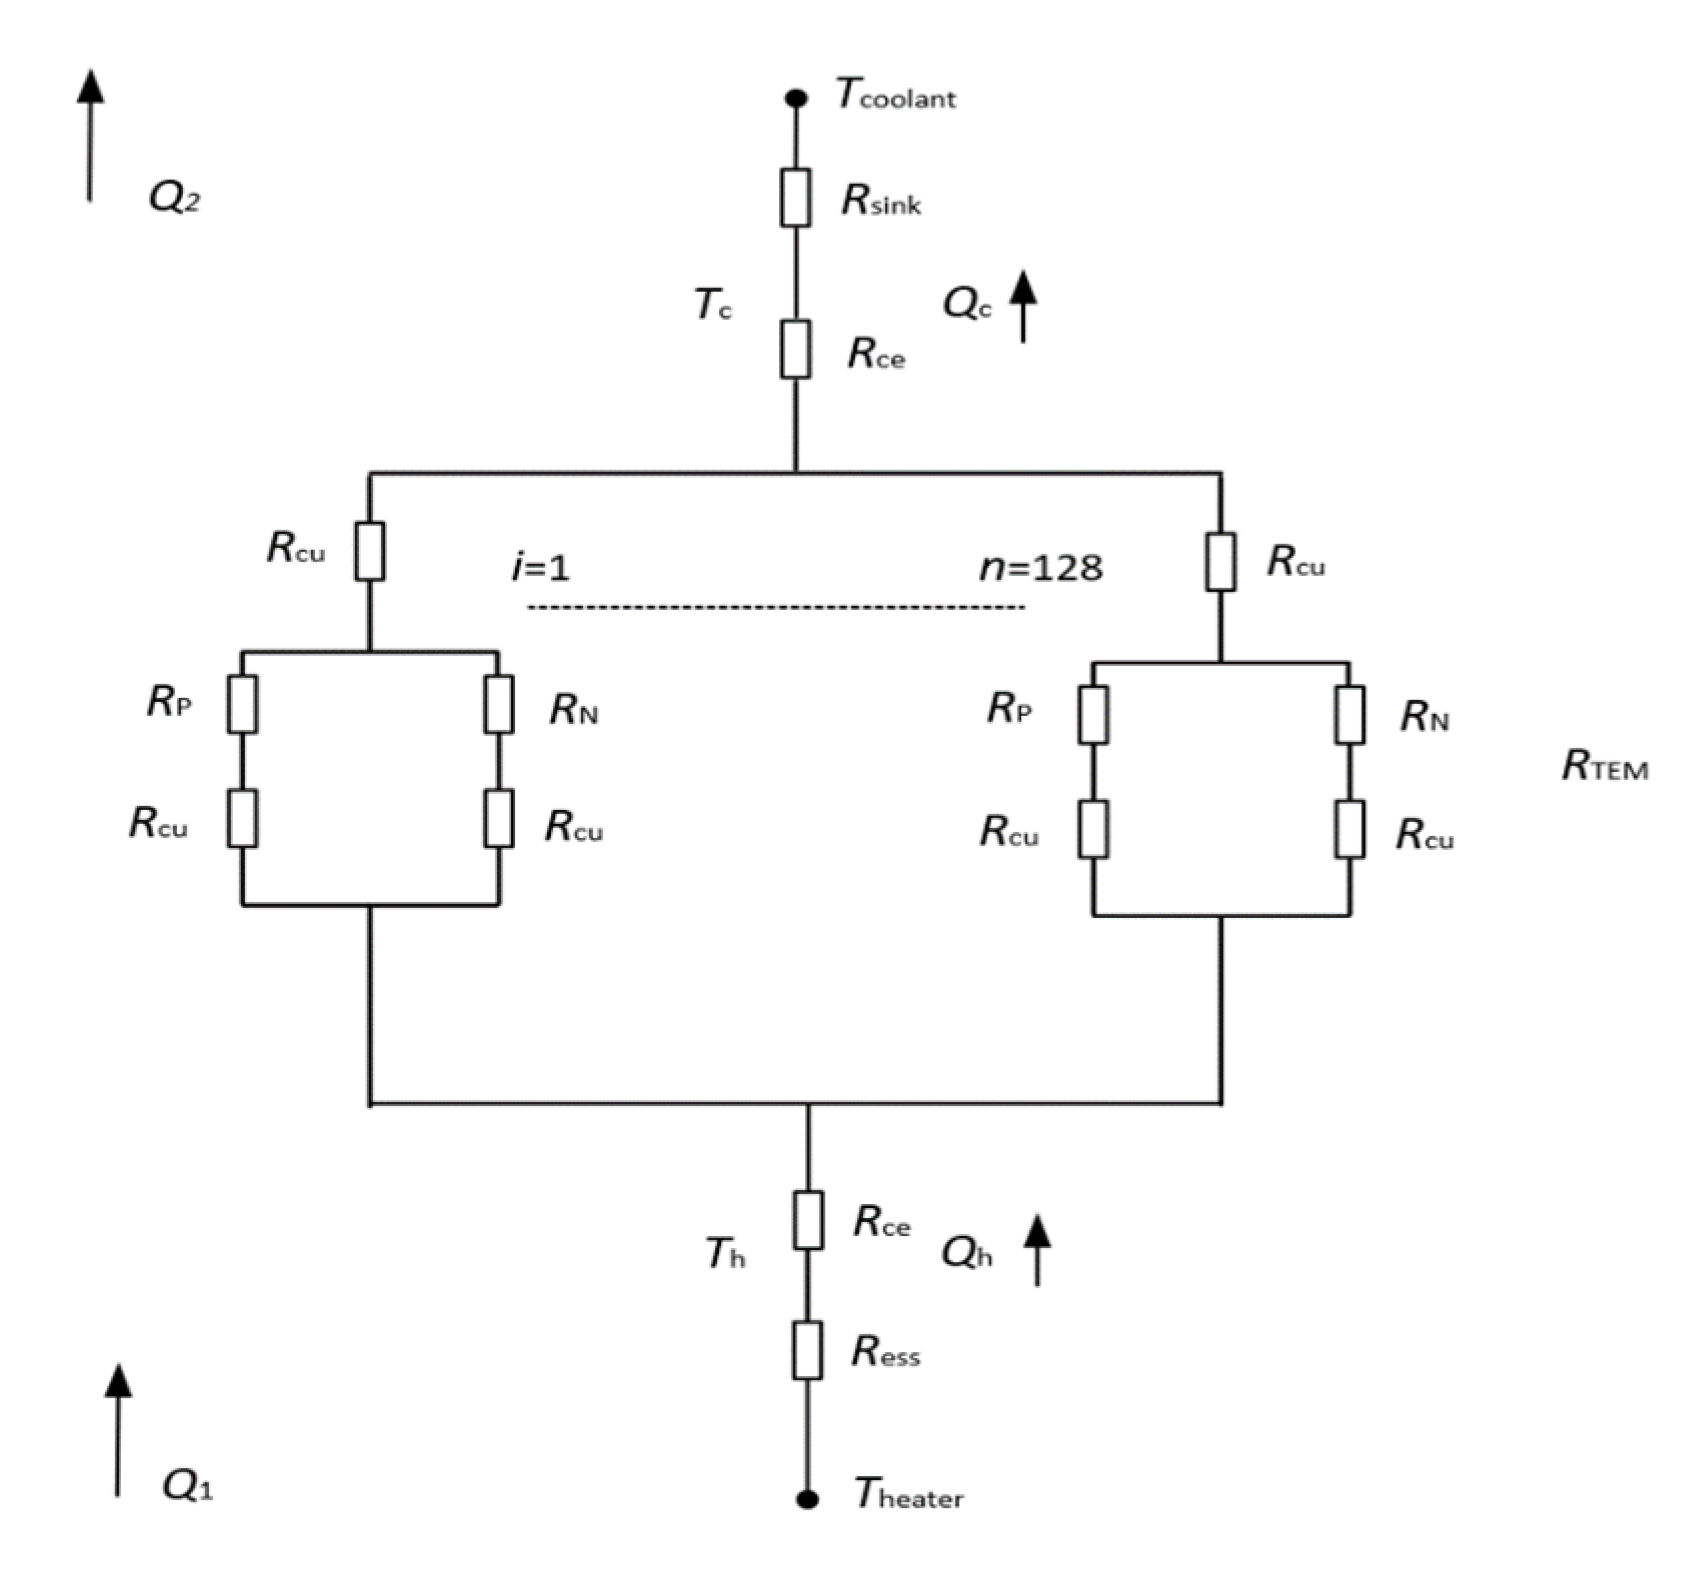
Figure 1. Thermal resistance model of the TEG system.
Energies 16 00805 g001
Figure 2. Diagram of the TEG system. (a) TEG system with phase change material. (b). Structure of thermoelectric module. (c) Snake tube. (d) Energy storage system.
Energies 16 00805 g002
Figure 3. The diagram of different filling ratio.
Energies 16 00805 g003
Figure 4. Boundary conditions of the simplified TEG system. A: inlet boundary of cooling water. B: outlet boundary of cooling water. C: grounded boundary. D: hot source boundary of TEG system.
Energies 16 00805 g004
Figure 5. Electrical characteristics under 140 °C.
Energies 16 00805 g005
Figure 6. Numerical results of the TEG system. (a) Temperature distribution. (b) Voltage distribution. (c) Current distribution.
Energies 16 00805 g006
Figure 7. Thermoelectric performance of the TEG system.
Energies 16 00805 g007
Figure 8. Profile of mean S/N ratio value.
Energies 16 00805 g008
Figure 9. Temperature performance of the TEG system.
Energies 16 00805 g009
Figure 10. The phase transient profiles between and solid phases of the PCM.
Energies 16 00805 g010
Figure 11. Electrical performance of the TEG system.
Energies 16 00805 g011
Table 1. Factors, control parameters, and the levels.
FactorABCD
Control ParameterHeat Source Thermal Power (W)PCM TypeFilling Ratio of the PCM (%)Height of the PCM Box (mm)
Level 150PCM6550%10
Level 2100PCM16465%20
Level 3150PCM18580%30
Level 4200PCM220100%40
Table 2. Properties of the PCMs [33,41].
PCM NameDensity
(kg·m−3)
Latent Heat Capacity
(kJ·kg−1)
Specific Heat Capacity
(J·kg−1·K)
Thermal Conductivity
(W·m−1·K−1)
1PCM65861(s)–778(l)2131850(s)–2384(l)0.4(s)–0.15(l)
2PCM164149034013200.19
3PCM1851396244.513500.35
4PCM220200010015150.515
Table 3. The Taguchi L16 orthogonal array.
NumberFactor (A)Factor (B)Factor (C)Factor (D)
11111
21222
31333
41444
52123
62214
72341
82432
93134
103243
113312
123421
134142
144231
154324
164413
Table 4. The results of the numerical simulation in L16 orthogonal array.
RunFactor Results
ABCDETEGs (J)Einput (J) η S/N Ratio
150PCM6550%10517.7575,0000.69−3.2189
250PCM16465%20493.9675,0000.66−3.6273
350PCM18580%30468.7675,0000.63−4.0822
450PCM220100%40365.7275,0000.49−6.2383
5100PCM6565%301597.20150,0001.060.5454
6100PCM16450%401542.65150,0001.030.2435
7100PCM185100%101760.98150,0001.171.3933
8100PCM22080%201663.15150,0001.110.8968
9150PCM6580%402943.18225,0001.312.3327
10150PCM164100%302746.54225,0001.221.7321
11150PCM18550%203193.86225,0001.423.0427
12150PCM22065%103303.56225,0001.473.336
13200PCM65100%20448.0653,6000.84−1.5565
14200PCM16480%10307.5739,0000.79−2.0625
15200PCM18565%40859.23115,4000.75−2.5619
16200PCM22050%30702.3888,6000.79−2.0173
Table 5. Mean responses for S/N ratios for each level.
FactorABCD
Level
1−4.2917−0.4743−0.4875−0.1380
20.7697−0.9286−0.5770−0.3111
32.6109−0.5521−0.7288−0.9555
4−2.0495−1.0057−1.1674−1.5560
Delta (effect)6.90260.53130.67991.4180
Rank1432
Disclaimer/Publisher’s Note: The statements, opinions and data contained in all publications are solely those of the individual author(s) and contributor(s) and not of MDPI and/or the editor(s). MDPI and/or the editor(s) disclaim responsibility for any injury to people or property resulting from any ideas, methods, instructions or products referred to in the content.