Article

Modelling and Energy Management of an Off-Grid Distributed Energy System: A Typical Community Scenario in South Africa

by
Adewale Zakariyahu Obaro
1,*,
Josiah Lange Munda
1 and
Adedayo Adedamola YUSUFF
2
1
Department of Electrical Engineering, Tshwane University of Technology, Staatsartillerie Rd, Pretoria West, Pretoria 0183, South Africa
2
Department of Electrical Engineering, University of South Africa, Florida Campus, Johannesburg 1709, South Africa
*
Author to whom correspondence should be addressed.
Energies 2023, 16(2), 693; https://doi.org/10.3390/en16020693
Submission received: 2 December 2022 / Revised: 28 December 2022 / Accepted: 29 December 2022 / Published: 6 January 2023
(This article belongs to the Section A: Sustainable Energy)

Abstract

:
Conventional power systems have been heavily dependent on fossil fuel to meet the increasing energy demand due to exponential population growth and diverse technological advancements. This paper presents an optimal energy model and power management of an off-grid distributed energy system (DES) capable of providing sustainable and economic power supply to electrical loads. The paper models and co-optimizes multi-energy generations as a central objective for reliable and economic power supply to electrical loads while simultaneously satisfying a set of system and operational parameters. In addition, mixed integer nonlinear programing (MINLP) optimization technique is exploited to maximize power system generation between interconnected energy sources and dynamic electrical load with highest reliability and minimum operational and emission costs. Due to frequent battery cycling operation in the DES, rainflow algorithm is applied to the optimization result to estimate the depth of discharge (DOD) and subsequently count the number of cycles. The validity and performance of the power management strategy is evaluated with an aggregate load demand scenario of sixty households as a benchmark in a MATLAB program. The simulation results indicate the capability and effectiveness of optimal DES model through an enhanced MINLP optimization program in terms of significant operational costs and emission reduction of the diesel generator (DG). Specifically, the deployment of DES minimizes the daily operational cost by 71.53%. The results further indicate a drastic reduction in CO2 emissions, with 22.76% reduction for the residential community load scenario in contrast to the exclusive DG system. This study provides a framework on the economic feasibility and effective planning of green energy systems (GESs) with efficient optimization techniques with capability for further development.

1. Introduction

Generally, continuous energy shortage and global exponential population growth have resulted in enormous atmospheric greenhouse gas (GHG) emission, rapid fossil fuel reserve depletion, environmental degradation and high operational costs related to electrical power generation [1]. In most cases, power sectors, diesel-powered energy consumers, firms and investors do not take responsibility for releasing these enormous GHG emissions to the atmosphere. To mitigate these critical and prevailing energy challenges, multiple renewable energy sources (RESs) can be interconnected together, forming power distribution systems for powering electrical load demand, otherwise known as distributed energy systems (DESs) [2]. The DESs are modular multi-energy sources (MESs), which can be installed at distribution systems to provide immediate electrical power demand, improve power reliability and minimize operational cost and power losses, as well as diversify energy sources. These RESs are clean, ubiquitous, sustainable, self-replenishing and cost-efficient when effectively harnessed and efficiently optimized in meeting energy needs [3]. Nevertheless, the uncertainty and dynamic characteristics of the intermittent renewable energy resources (RERs), especially solar radiations and wind speeds, result in irregular power generation, significant electrical power discrepancy and, subsequently, electrical power mismatch. These further complicate the modeling and pose serious techno-economic limitations to the maximum utilization and reliability of the MESs in the DESs [4]. Consequently, energy storage systems (ESS), such as fuel cells (FC), batteries, hydrogen tanks (HTs), super-capacitors (SCs), flywheels, compressed air (CA) and molten salt (MS), can be integrated as backup mechanisms to regulate power exchange, improve operational efficiency and energy utilization for economic, sustainable and reliable operation of the DESs [5,6]. In addition, an optimal design, control strategy and efficient energy optimization mechanism is required to mitigate energy mismatch between generation and consumption inherent with intermittent and irregular power generation behavior, as well as improve energy utilization efficiency in DESs [7,8]. Although oversizing of system’s components in DESs can significantly minimize reliability challenges, this often results in unnecessary high capital and replacement costs. Hence, it is imperative to design DESs for sustainable and economic operation capable of meeting the continuous energy shortage through efficient energy management techniques [9,10,11].

1.1. Related Literature

Recently, an extensive investigation has been conducted on the design and optimization of hybrid renewable energy systems (HRESs), hybrid energy systems (HESs) and DES involving the inclusion of either turbine, diesel generator or grid system, with the aim of providing continuous power supply. More importantly, the emission evaluation released has been neglected in objective function formulation, especially in analyzing the economic implication of these systems. Moreover, several techniques have been widely explored to manage and increase energy supply of hybrid renewable energy systems (HRESs). A stochastic risk-dependent multi-objective assessment model for an optimal energy exchange in a micro-grid (MG) system consisting of a photovoltaic system, wind turbine, energy storage and flexible loads was analyzed in [12] to address inherent volatility and unpredictability of MG. Lin et al. [13] investigated a stochastic control of distributed energy resources (DERs) in which decentralized controllers were used to reduce the expected cost of balancing load profile. An intelligent and self-suited multi-agent system (MAS)-based energy co-ordination for decentralized control of the hybrid electrical system was presented in [14]. The MAS comprises of manager agent and service agents, which supervise the production and various load agents, respectively. The control strategy dictates the interruption, service shift, increase and reduction in the power demand of various flexible consumption sources on the system. The optimal energy management of a stand-alone hybrid micro-grid, which seeks to enhance energy utilization efficiency and minimize fuel emission costs using dynamic programing (DP) method, was expounded in [15]. The simulation results obtained show a reasonable reduction in total cost of the system. In [16], the state of charge (SOC) of the battery energy storage system (BESS), which was incorporated in the optimal control of MGs with alternative current tie-lines, depleted to zero. This indicates an abnormal implementation of control strategy on the battery bank, as it can drastically shorten the lifespan of the BESS. The author in [17] presented a multi-objective technique for modeling an isolated HRES using a backtracking search algorithm (BSA) with inclusion of a dump load. The proposed HRES model was oversized, which could incur additional capital cost and fails to take into consideration operational cost of discharging the dump load. The meta-heuristic firefly algorithm (FA) was applied to regulate load frequency of an MG design linked to a photovoltaic and thermal generators at maximum power point tracking (MPPT) [18]. The results show that the FA-based controllers demonstrated better improvement in terms of different indices and settling times when compared with genetic algorithm (GA) under various disturbances and parameters. In the presented system, the performance of FA is inversely proportional to distance between the fireflies. This means that the performance of FA reduces as the distance between the fireflies increases and, thus, poses a major potential setback to this technique. In [19], the authors introduced an efficient control network for a wind-hydrokinetic pump-back hydropower plant (PHP) integrated with the conventional power system to optimize energy generation of the hydro reservoir with stringent ecological water flow using mixed integer linear programing (MILP). In the proposed system, water regulations adversely impact downstream riverine ecosystem, aquatic biodiversity, human settlement and revenue generation. In addition, a mixed integer nonlinear programing (MINLP) estimation model for demand response programs (DRPs) integrated energy hubs was analyzed in [20]. Simulation results obtained demonstrate the viability of the model presented in powering an energy hub load demand.
Furthermore, a related work presented on the economic emission load dispatch (EELD), aimed at minimizing operating cost and emission levels of thermal generator power systems employing symbiotic organism search (SOS) optimization algorithm, was investigated [21]. The effectiveness of the studied system in the SOS simulation demonstrated reduced emission values and fuel cost in relation to other existing heuristic techniques. A solution network based on Stud Krill Herd (SKH) algorithm for optimal power flow of conventional power systems was also evaluated in [22]. The authors in [23,24] also applied particle swarm optimization (PSO) method to address multi-energy scheduling problems of diverse paused loads in standalone power systems and annual costs reduction in radial distribution networks, respectively. Although the simulation results obtained showed effective performance of the PSO algorithm, the model presented only focused on the capital cost of the system, while the convergence speed was not investigated. In an effort to reduce active power losses and improve voltage profile across a network, [25] presented an optimal sizing and location of distributed generators using strawberry plant propagation algorithm (SPPA). The results showed that the SPPA achieved a reasonable voltage profile improvement and power loss minimization. Additionally, grid-connected and off-grid hybrid energy systems were investigated for the electrification and optimization of selected areas using HOMER simulation software in [26,27], respectively. A comparative study on HOMER and in-house algorithm has shown that the in-house model is far more flexible, efficient and economically viable than the HOMER model, which is susceptible to inaccurate design as it failed to produce results for power shortage in some scenarios [28]. From literature review, it is evident that existing works failed to appropriate the amount of emissions and emission costs associated with fossil fuel consumption in various models of DESs presented [1,2,3,4,5,6,7,8,9,10,11,12,13,14,15,16,17,18,19,20,21,22,23,24,25,26,27,28]. Non-inclusion of both operational and emission costs can exuberate investment and replacement costs, as well as ultimately compromise the overall energy cost. To overcome the aforementioned limitations, an optimal energy model with an efficient power management technique of an off-grid DES is proposed. The proposed DES is a cluster of hybrid power generation mixtures capable of providing a clean, economical and sustainable energy solution to salvage the growing energy scarcity, especially in remote and isolated areas where a conventional power system is inaccessible and economically nonviable. The DES is comprised of a photovoltaic (PV) system, wind turbine (WT), micro-hydro power system (MHPS), battery storage system (BSS) and diesel generator (DG) interlinked via an energy network, which ultimately powers a dynamic electrical load demand. In this DES, inclusion of the multi-RESs is aimed at minimizing operational cost through the maximization of RESs energy generations. Due to its remarkable capability in solving complex, nonlinear optimization problems and efficient performance in numerical optimization, the MINLP optimization technique is exploited to manage power exchange between interconnected energy sources and dynamic electrical load under applicable multi-power exchange limits and system parameters, while rainflow counting algorithm (RCA) is further exploited to monitor the reliability performance status of the BSS during the sampling duration. Effectiveness of the proposed DES is evaluated using a typical community load demand scenario in the optimization simulation. The following are some highlights of this paper’s contributions and originality.

1.2. Novelty and Contributions

  • A comprehensive optimal capacity and efficient multi-objective optimization solution of a DES, which prioritizes utilization of renewable power generation sources and incorporates both operational and emission costs in rural areas, is presented.
  • An MINLP optimization mechanism has been applied in solving the multi-objective cost function of meeting load demand with highest reliability and minimum operational and emission costs, while simultaneously maintaining an optimal power balance and system constraints in the DES.
  • To determine the degradation assessment of the BSS model in the DES, the rainflow counting algorithm is implemented for the estimation of charge/discharge cycle capacity, taking into consideration the dynamics of the state of charge.
  • Typical community load demand scenarios in Pretoria, South Africa, have been utilized in validating the proposed model.
  • Economic and emission cost analyses have been conducted to assess the overall operational benefits of the proposed DES network.
  • The proposed DES network has been implemented using realistic RERs dataset accessible through solar energy and NASA meteorology databases.
The sections of the current paper are structured as follows. Section 2 gives a description of the proposed DES model and computational modeling of the system’s components. In Section 3, optimization of models with necessary system constraints and parameters are described. The case study and simulation parameters are presented in Section 4. Simulation outcomes are discussed in Section 5. Section 6 presents the conclusion of the paper and recommendations for future work.

2. Overview of CO2 Emission, System Description and Modeling

The CO2 emission is a major factor responsible for the rising environmental GHG emissions. For instance, Figure 1 illustrates a two decade overall per capita CO2 emission progression in South Africa commencing from 1991 to 2021 and expected value till 2022. Out of this figure, a great proportion originated from fossil fuel combustion in the same period as depicted in Figure 2 [29]. From the Figure 1 and Figure 2, it is evident that per capita CO2 emission in South Africa is expected to reach 8.90 metric tons in 2022, with an increase in fossil fuel combustions of about 477 million tons in the same year.

2.1. System Modeling and Description

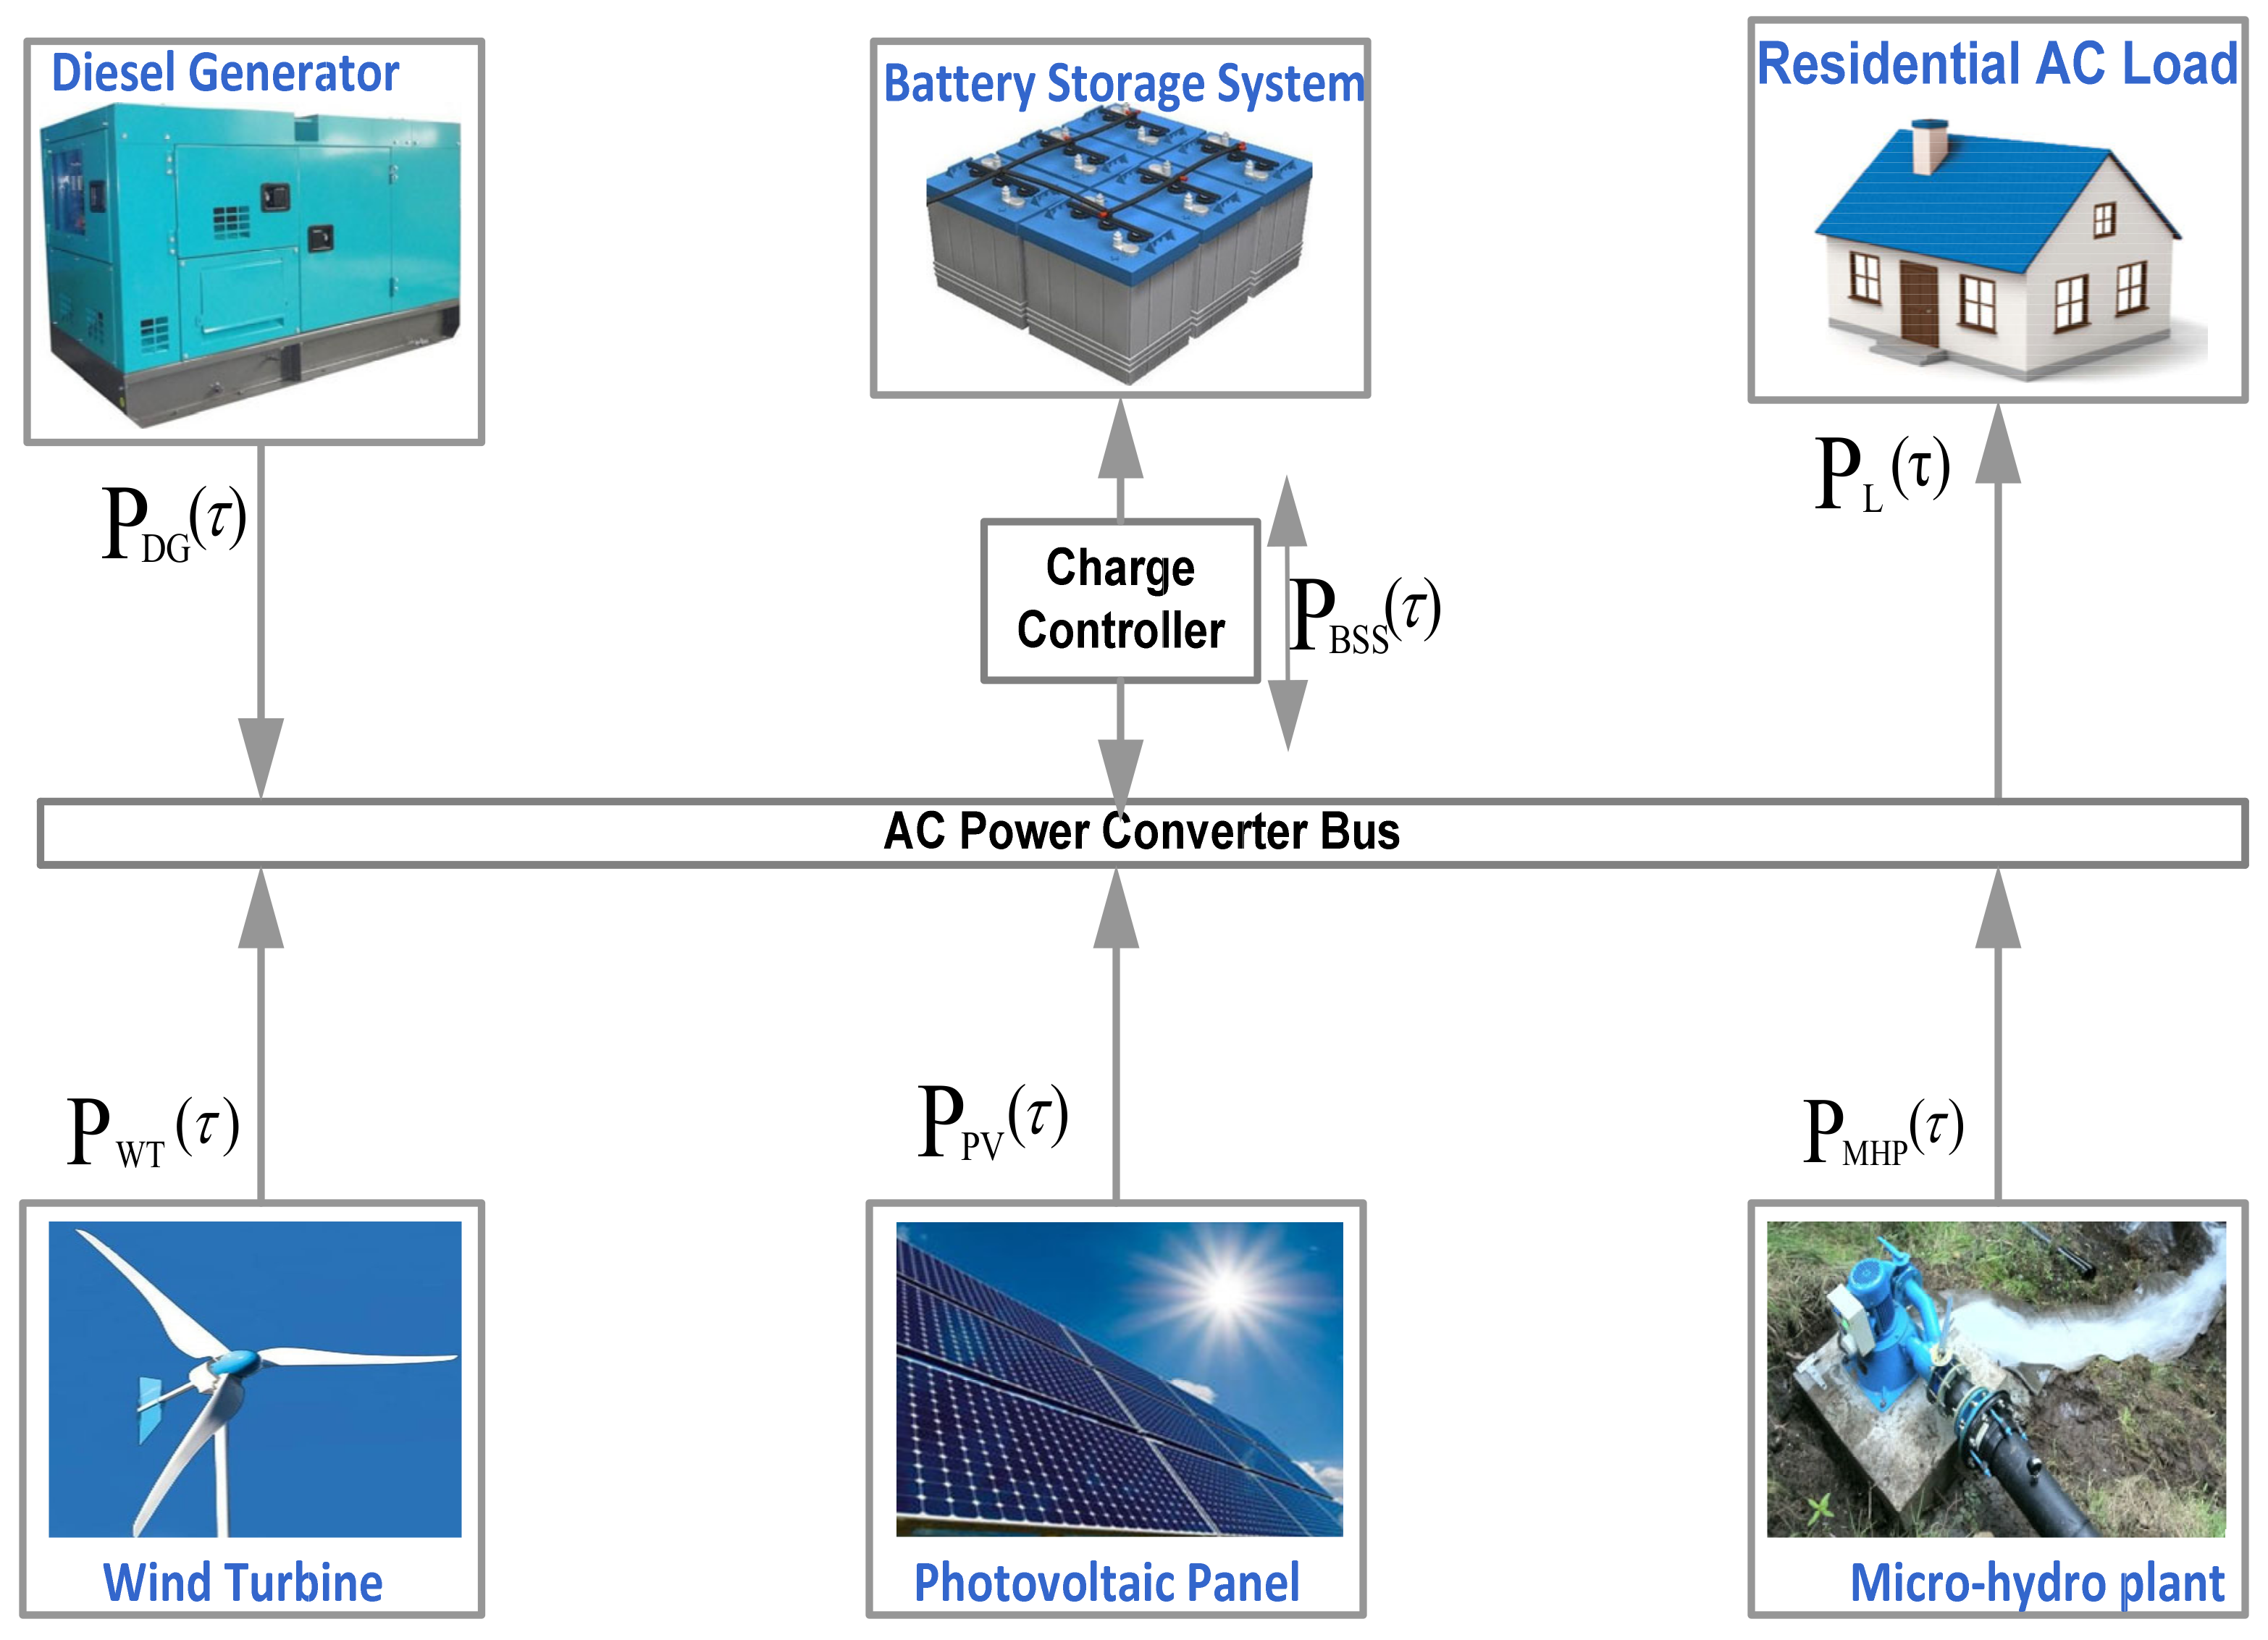
Figure 3 presents a schematic layout of the proposed DES comprised of a PV system, WT and BSS interlinked with dynamic AC load profiles based on the need of energy consumers through a power controller, with directional arrows representing power flow. The integration of a battery system provides for energy mismatch and load variations recovery through injection of excess and compensation for net powers. Therefore, the dual-purpose BSS acts as a sink to conserve surplus power for future energy consumption or need when power generation exceeds load demand and as a source to inject net power when load demand exceeds power generation and, thus, maintains an effective power balance operation. This is made possible through the aid of a bidirectional power flow converter (which regulates the charging and discharging mechanisms) connected to the BSS. The total power of the RES subsystems is prioritized to completely power the dynamic daily load demand profile and, hence, unmet load demand is zero at any instant. Conversely, energy from the BSS and/or a DG may be dispersed to meet a required net power in an event that the dynamic load exceeds total generated power with the aid of an automatic switch. A switch is included on the DG side as a measure to automatically connect or disconnect from the DES based on the available power to cover the load demand. Modeling of the power electronic converters and controllers has been ignored for network system simplicity. The mathematical modeling of the proposed DES components is presented in Section 2.2.

2.2. Mathematical Modeling of the Proposed DES Components

In this section, the mathematical model of individual components is formulated to analyze the performance operation and economic impact of the proposed DES.

2.2.1. Photovoltaic System

The power generation of a photovoltaic (PV) system relies on the hourly solar radiation and ambient temperature and, thus, plays a crucial role in the design of an efficient PV system. Hence, the solar-irradiance-dependent power of the PV module is formulated by using Equation (1) [30]:
P p v τ = P R ,   p v R R r e f   1 + N T T c T r e f
where P R ,   p v ,   P p v τ and τ represent rated power of the PV panel, generated power by the PV system and discrete time horizon set to 1 h in this study, respectively. Tref, R and Rref represent the reference temperature (taken as 25 °C), solar radiation and reference solar radiation (1000 W/m2), respectively. NT represents panel temperature coefficient and equates to −0.0037 per degree Celsius for single and multi-crystalline silicon cells [31]. The temperature of the PV panel is computed using Equation (2):
T C = T a + R 800   N O C T 20
where Ta, NOCT and R represent ambient temperature (°C), normal operating cell temperature (°C), usually specified by the cell manufacturer, and solar radiation, respectively. The overall power produced by the PV system is, thus, estimated as follows:
P P V , T o t a l τ = N p v ,   c e l l × τ = 1 N τ P p v τ
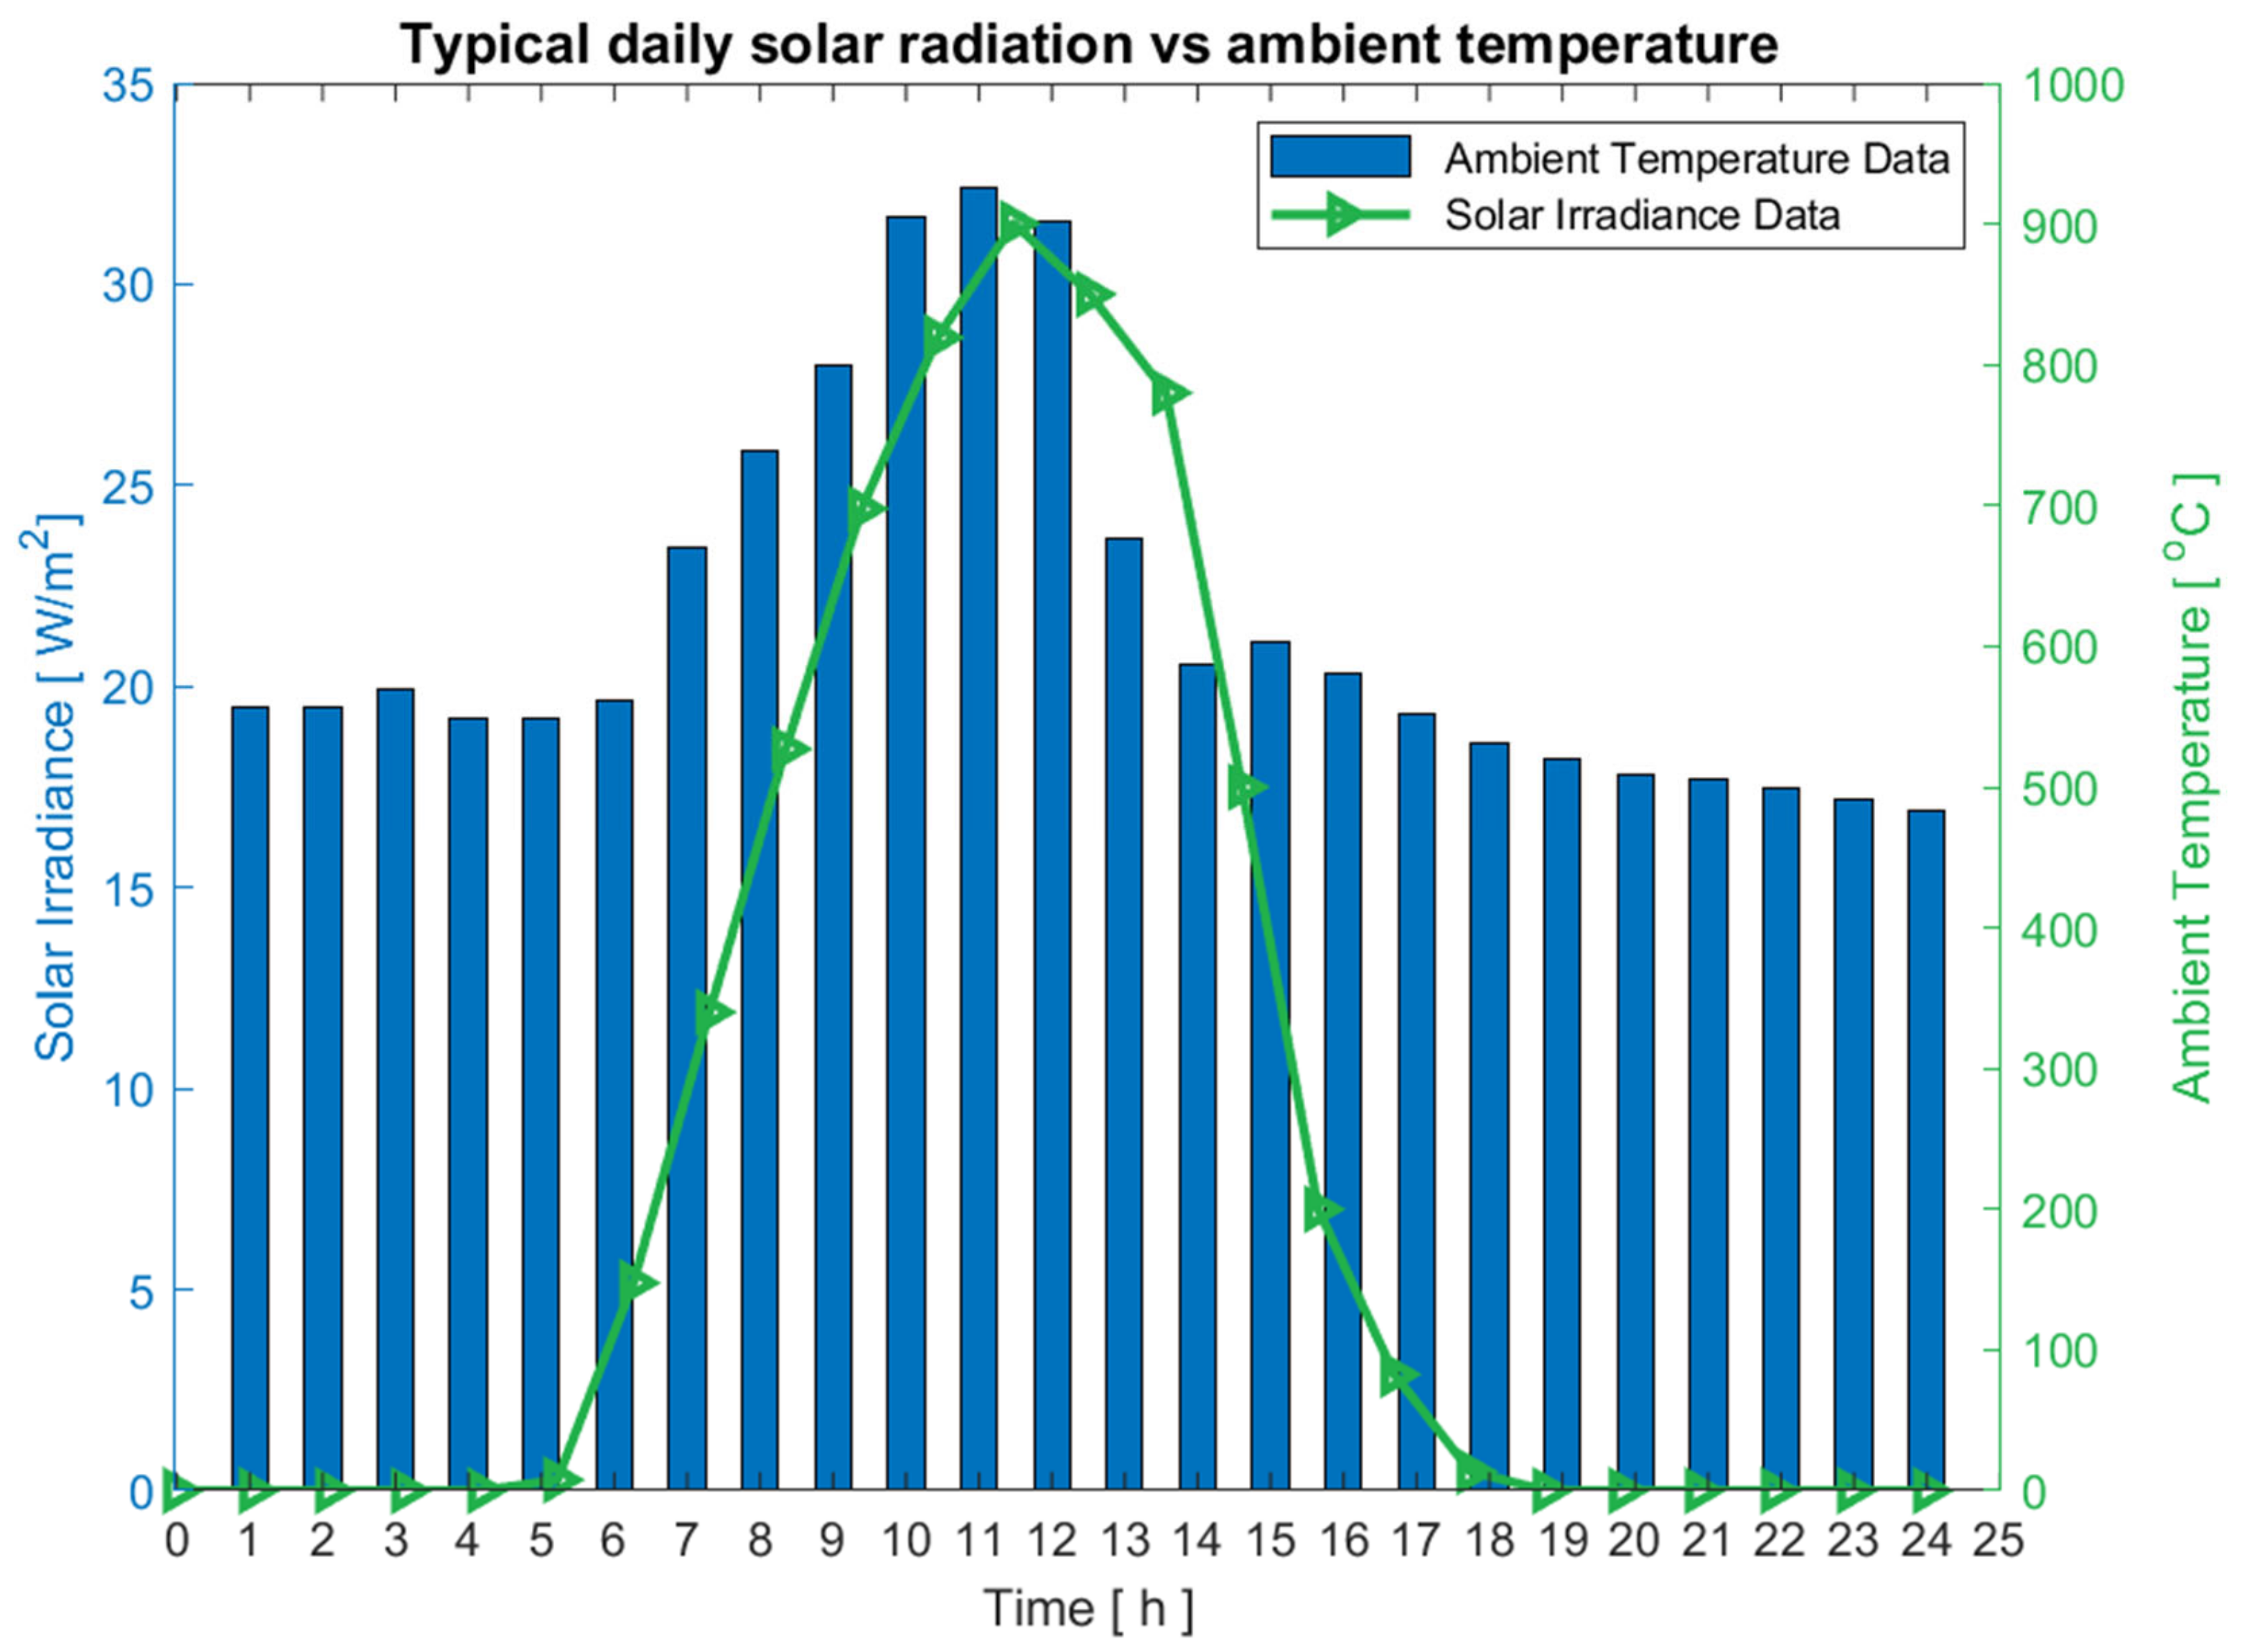
where NPV represents total number of panels utilized. Figure 4 presents the daily ambient temperature and solar radiation data obtained from NASA meteorological site Pretoria, South Africa, located at longitude 28.23° E and latitude 25.75° S and considered for the study. The equivalent network of a PV generator can be found in [32], while the PV cell specifications utilized in this work are presented in Table 1.

2.2.2. Wind Generator Model

A wind turbine (WT) transforms wind’s mechanical power into productive electrical power. The mechanical power of the WG mainly depends on the speed of the wind, which can be mathematically expressed as follows [33]:
P W G τ = 1 2   A S   U w 3   C P   γ
where A S   and   U w   represent the swept area of the rotor blade 1.735   km 2 and wind speed (m/s) of the WG, respectively, and γ   represents the air density   1.25   kg / m 3 . The characteristic nondimensional power coefficient C P of the WT relies on both the blade pitch angle β , as well as the ratio of the tip speed   λ . The tip speed ratio is expressed as a fraction of blade speed tip to the wind speed as follows:
λ = ψ b l a d e   R b l a d e U w
where R b l a d e   and   ψ b l a d e   represent the radius and rotational speed of the blades taken as   23.3   m   and 3.14   rad / s   , respectively. The power coefficient CP can, thus, be expressed as:
C P = 0.44 0.0167 β sin π λ 3 π 15 0.3 β 0.0184 β   λ + 3
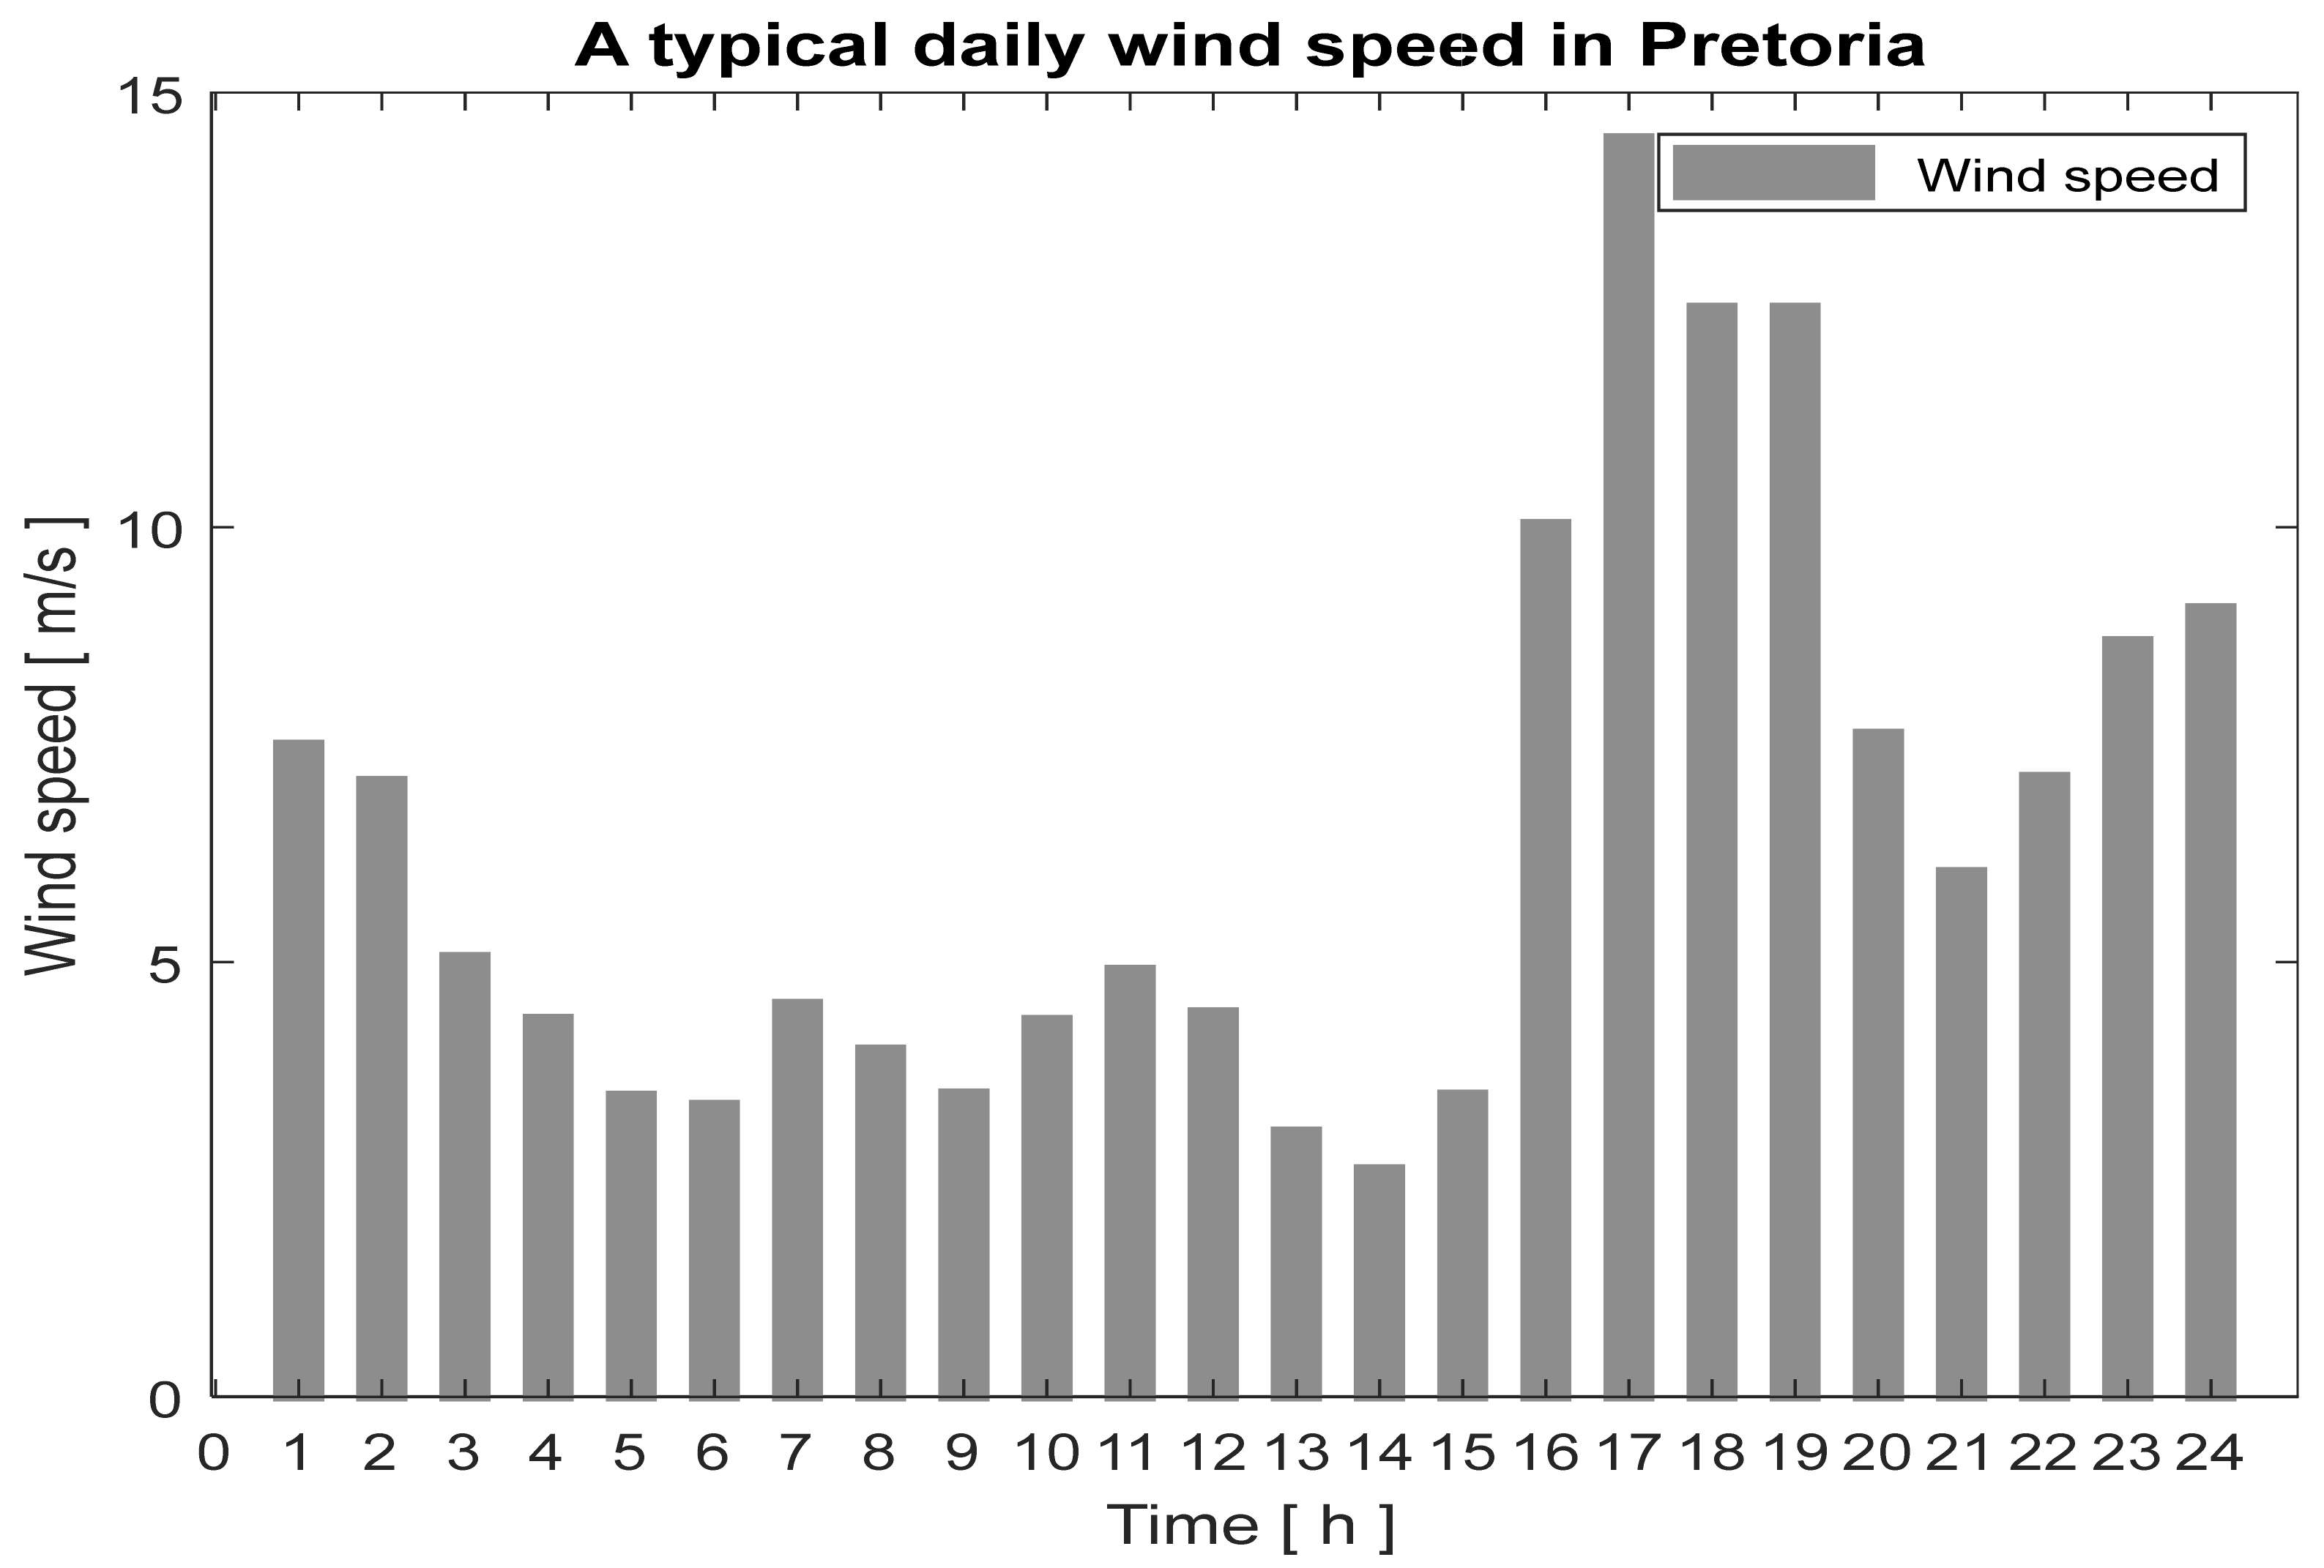
The threshold power coefficient is approximately equal to   0.539 . However, it is crucial to note that the coefficient value may vary based on turbine types and mechanical and aerodynamic losses. Figure 5 depicts the average wind speed data collected from WASA.
Hence, the overall electrical output power of the WT is computed according to Equation (7):
P W τ = 1 2 U w 3   A S   C P   γ     U c i n     U w     U r P W T R a t e d   U r     U w     U c o 0   O t h e r w i s e
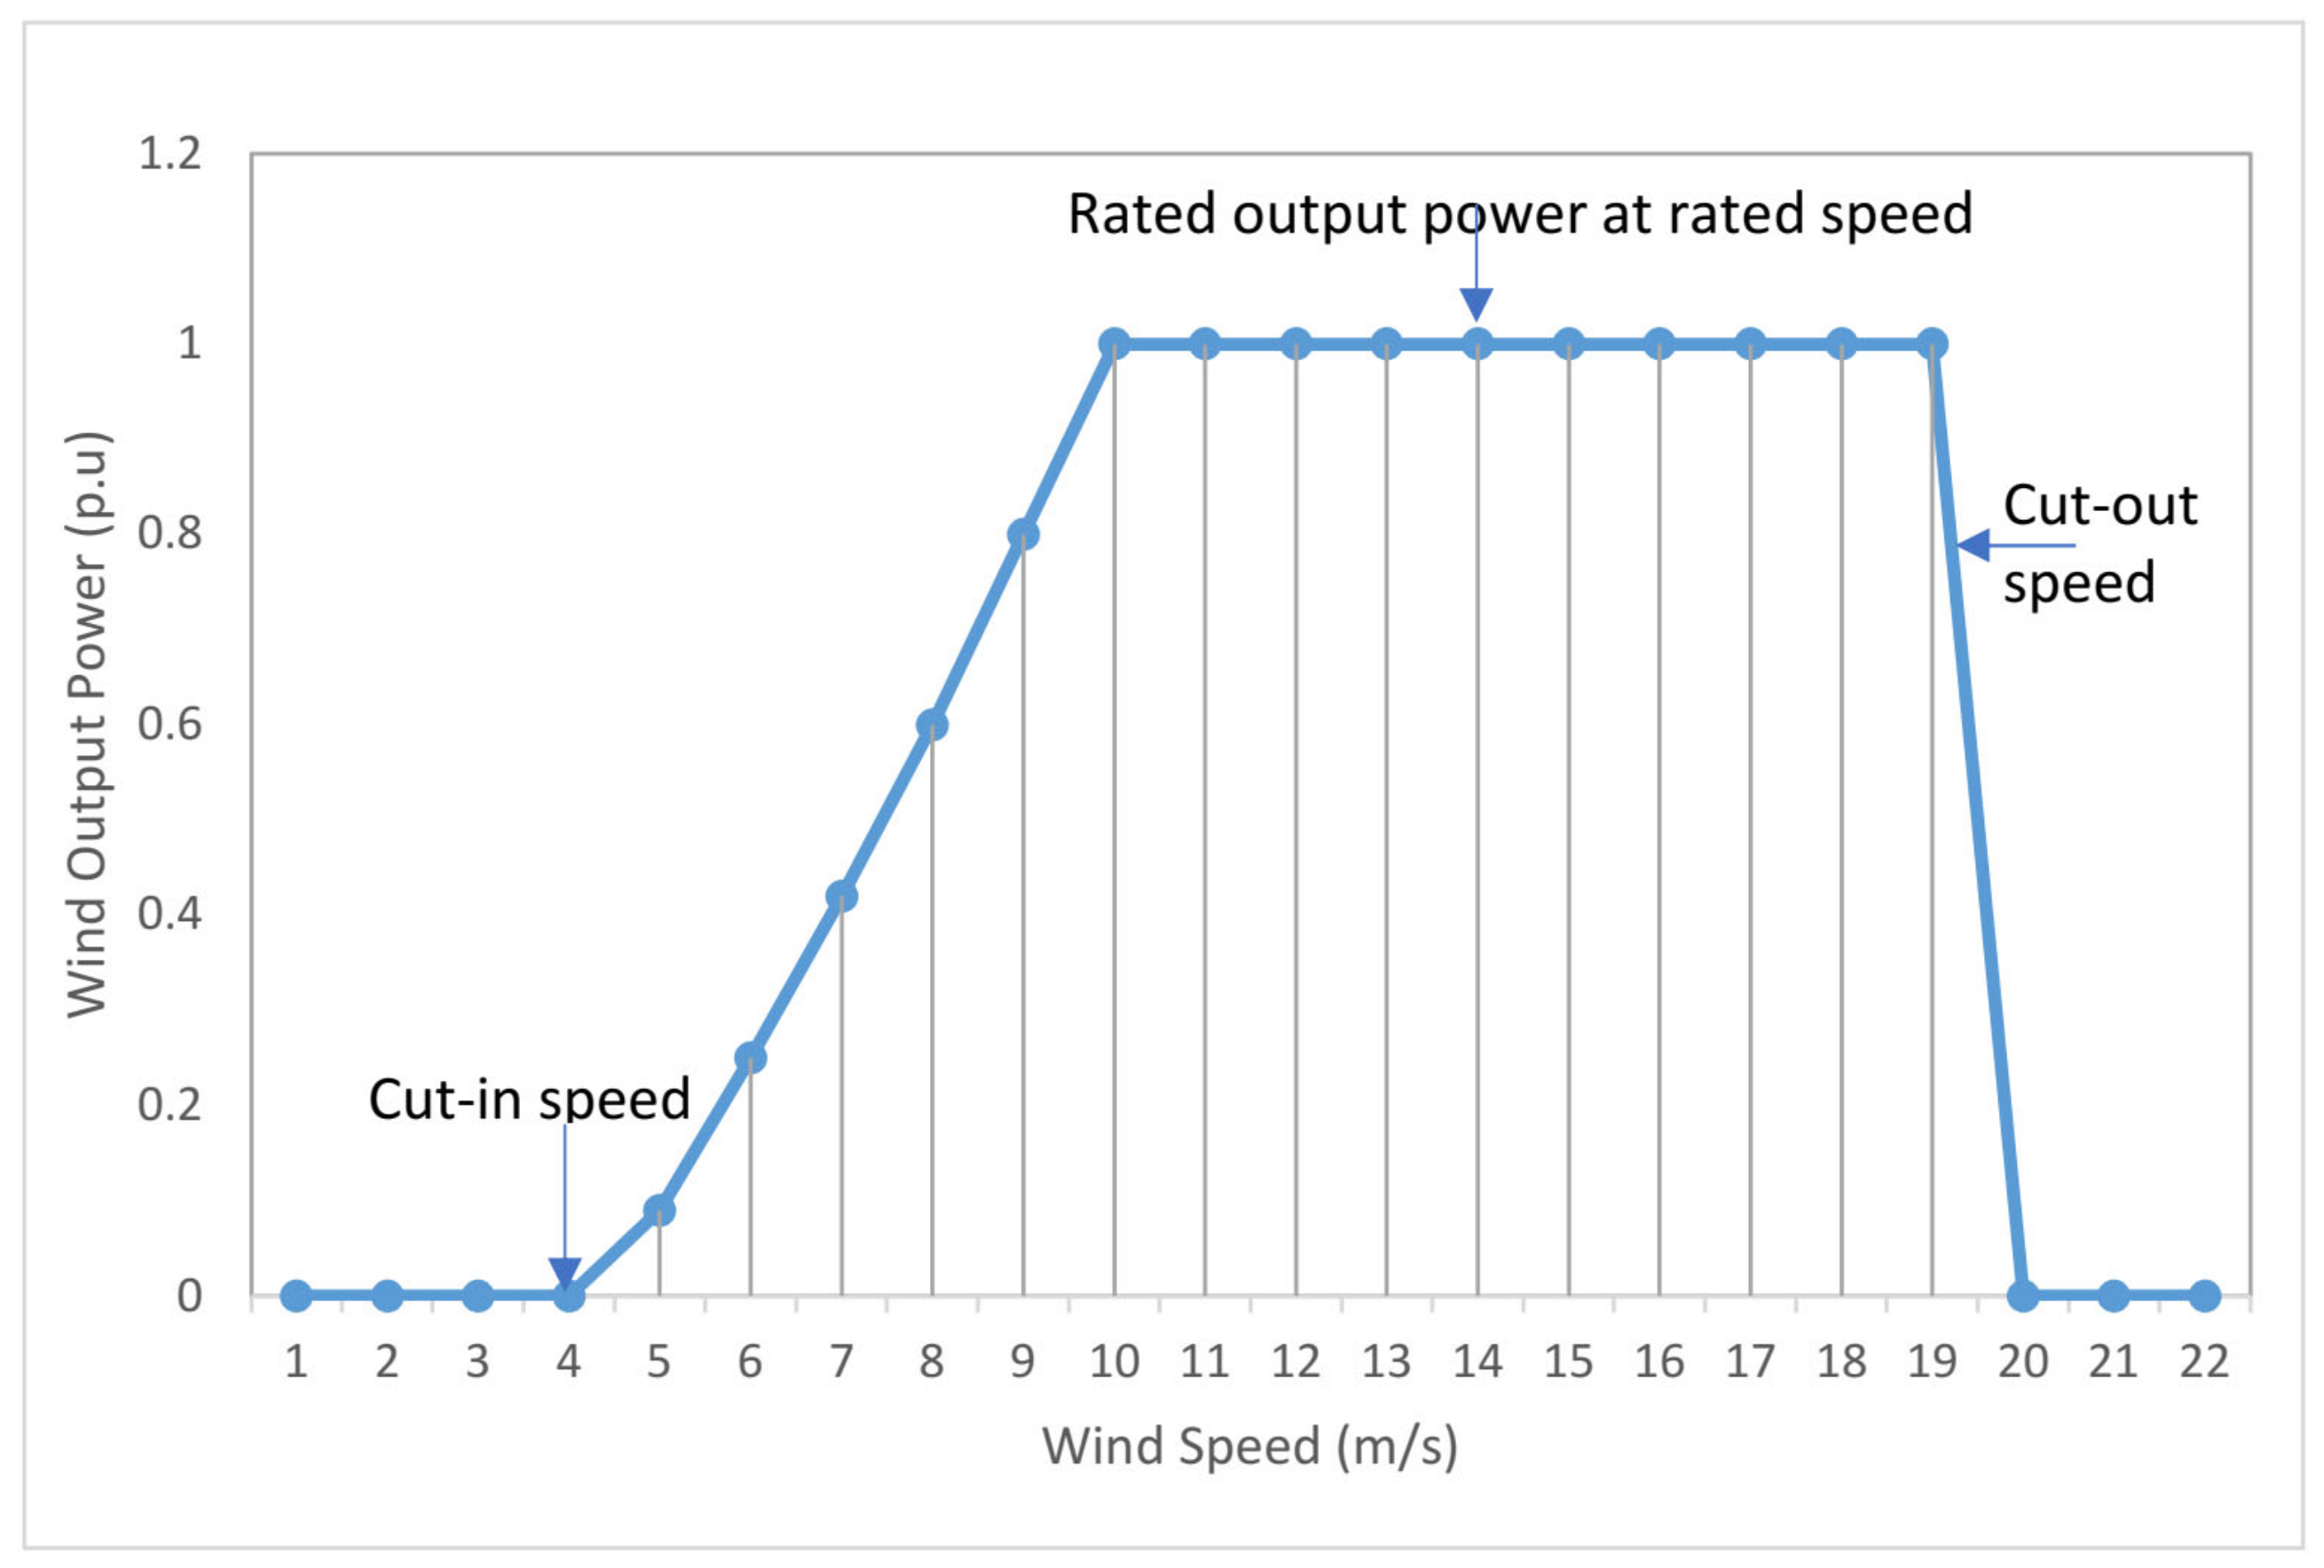
where P W T R a t e d   represents the rated electrical output power of WT;   U w ,   U r   , U c i n   and   U c o represent the real-time, rated, cut-in and cut-out speeds individually. The characteristic curve of the wind speed versus the corresponding mechanical power of the WG under current study is presented in Figure 6.
The number of WTs required to power a daily load demand is calculated using Equation (8):
N W T = P L a v P W T a v
where P L a v   and   P W G a v   represent average power of load demand and average power of the WT, respectively.

2.2.3. Micro-Hydro Power System Model

The micro-hydro power system (MHPS) comprises a small hydro-turbine installed in a dam or reservoir, which converts mechanical power in moving water streams to electrical power through turbine rotation, without the use of fossil fuel. However, the turbine output power viability depends on water flow rate, surface area, head drop and seasonal variability. These variations in water flow rate or level affect the generation capacity and, thus, produce variable power supply. Therefore, the turbine can be installed along waterfall top or artificial reservoir with good topography and high water flow rate, such as streams and rivers, with a few pipes leading to a small generator housing. In addition, the reservoir is designed to allow flexible operation by regulating water flow regimes in response to energy demand, especially during periods of reduced water flow [19].
In this study, the MHPS is designed to complement other renewable energy generators (PV and WT), especially when the solar irradiance and/or wind speed is at minimum. Therefore, the theoretical electrical power generated by the MHS is computed using Equation (9) [34]:
P M H P S τ = Q r × H w × η c o n v × ρ w × α g
where Q r , H w , η c o n v , α g and ρ w denote the water flow rate in m3/s, total water head in meters, which depends on available water, overall energy conversion efficiency (per unit) of the turbine, gravitational acceleration (9.81 m/s2) and water density (typically 1000 kg/m3), respectively. The generated electrical power can then be conveyed to consumers.

2.2.4. Diesel Generator Model

A diesel generator (DG) is a synchronous electro-mechanical machine, which can supply uninterrupted electrical power to load demand using fossil fuel by converting kinetic energy in moving parts to alternating current (AC) power. In the current study, the DG is utilized as a complementary energy generation source to provide uninterruptible and stable power to electrical load demand in the event of power generation deficiency, using a strategy known as load following (LF). The active operation costs are considered in the mathematical formulation of DG’s fuel consumption, so that the primary objective of optimizing the fuel cost would not be compromised. Therefore, DG fuel consumption cost required to power the controllable electrical load demand is formulated as a second-order function of the power generated according to Equation (10) [35]:
F C D G P D G τ = τ = 1 N τ n D G + m D G P D G τ + p D G P D G 2 τ
where n i ,   m i ,   p i represent cost coefficients of DG (specified by the manufacturer), taken as 0.0246, 0.0815 and 0.433 (kWh/l), respectively [1,36]. P D G τ   represents the real power supplied by the DG, measured in kW.

Evaluation of Fossil Fuel Emissions

Although DG can power electrical load reliably, its exhaust releases greenhouse gas (GHG) during operation. According to Global Emissions Center for Climate and Energy Solutions (C2ES), the world emits a million metric tons of GHG with approximately 76% carbon emission originating from fossil fuel consumption (energy generation) [29]. As a result, it is imperative to measure atmospheric GHG emissions of the DG and its cost implication, as this information assists in determining or compensating the mitigating effects and proffers suitable control strategies. The emission factor of DG GHG consists mainly of oxides of sulfur and carbon dioxide discharged into the surroundings during the combustion of fossil fuel. In the current study, the hourly DG GHG emission released per unit of diesel fuel is computed as a product of diesel fuel consumption by the overall emission factor, as in Equation (11) [37,38]:
E C G H G τ = P D G τ × E F S O 2 + E F C O 2   i n   k g
where P D G τ   is the hourly power generation by the DG, and E F S O 2   and   E F C O 2 represent the individual emission factor of SO2 and CO2, considered in South Africa as 0.4 (kg/L) and 0.951 (kg/L), respectively [39,40,41,42].

2.2.5. Electrical Power Converter

A power converter is used as a bidirectional converter to convert DC to AC power. During the charge and discharge operation, the bidirectional converter converts BSS output from DC–AC and vice versa. The capacity of the converter depends on its efficiency and is computed as follows [43]:
η C o n v = P c o P n z 1 + P c o 1 + z 1 P c o P n
where z 1 = 1 99 10 η 10 1 η 100 9 = 1 11 1 η 10 η 100 η 10 η 100
z 2 = 1 η 100 η 10 1
In Equation (12), P c o   and P c n denote the output and nominal powers of the converter, respectively; η 10   and   η 100 denote the efficiencies of the converter at 10% and 100%, respectively, specified by the manufacturer.

2.2.6. Battery Storage System (BSS) Model

The BSS is a complementary energy backup incorporated to mitigate potential disruptive frequency deviation and dwindling power generation in DES due to the irregular characteristics of renewable energy resources (for instance, the wind speed and solar radiation), season and time of the day, as well as uncertainty in net power requirements. In this study, the investment cost is minimized through the optimal sizing of the BSS (in kWh). The capacity of the BSS (kWh) is estimated as:
C B S S = D S S × E L D O D × η t e m p
where D S S ,   E L ,   D O D   and   η t e m p represent the days of self-sufficiency, average daily energy demand kWh / day , depth of discharge and temperature correction factor of the BSS, respectively.
The instantaneous state of charge is a dynamic linear function, which depends on its nominal capacity and net energy balance, evaluated as follows [6,36]:
S o C B S S τ + 1 = S o C B S S τ + η C τ = 1 N τ P i n j τ η D E N o m τ = 1 N τ P d i s τ   x   δ Δ τ  
where S o C B S S τ   and   S o C B S S τ + 1 is the predetermined and current SOC, respectively; η C   and   η C   are the charging and discharging efficiencies of the BSS expressed as 90% and 60%, respectively; P i n j τ   and   P d i s τ   is the hourly surplus and net active powers injected into and discharged from the BSS during charge and discharge operations, respectively; E N o m   is the nominal energy capacity; Δ τ represents sampling time horizon; the positive and negative sign conventions indicate charging and discharging mechanisms, respectively.
Equation (14) implies that the battery energy level (SOC) at any instant depends on the initial energy level and the amount of power conserved into or discharged out of the BSS during the current time horizon. Thus, the current SOC becomes:
S o C B S S τ = S o C B S S 0 + η C τ = 1 N τ P i n j τ δ Δ t η D E N o m τ = 1 N τ P d i s τ  
The injected and discharged power indicate the charging and discharging mechanisms of the BSS, which is computed based on the net load demand according to Equations (16) and (17), respectively:
P i n j τ = P W τ + P P V τ + P M H P S τ P D τ μ C o n v   i f   P W τ + P P V τ + P M H P S τ P D τ 0
P d i s τ = P D τ P W τ + P P V τ + P M H P S τ μ C o n v   i f   P W τ + P P V τ + P M H P S τ P D τ < 0
where P W T τ ,     P P V τ ,   P B G τ   and   P M H P τ   are power flows from the WT, PV and MHPS, respectively. μ C o n v represents the efficiency of the AC converter bus. The following criterion is used to calculate the minimal state of charge:
S o C B S S m i n = S o C B S S m a x 1 D O D
where DOD represents depth of discharge of the BSS, indicated as a percentage; it can also be considered as extent of discharge (EOD) or intensity of discharge (IOD). The design parameters considered for the lead-acid BSS under the current study are given in Table 1.

Total Battery Cost

The overall operational cost of the battery is defined as the sum total of electrical energy cost injected into the battery and approximated degradation cost of the battery and it is expressed as follows [44]:
C T o t a l B S S = τ = 1 N τ P i n j t C e τ d τ + C D B S S
where P i n j t ,     C e τ ,   τ represent the net power injected into the battery, electrical energy cost and charging time. Note that C e τ depends on the current energy cost and P i n j t may either be negative or positive, indicating discharging or charging operation, respectively.
The degradation cost of BSS is a function of its lifespan degradation due to its charge cycle. It can be expressed as follows:
C D B S S = Δ L L × C B S S
where Δ L   and   L   represent the change in charge cycle lifetime degradation and complete lifespan of the battery (BSS) provided that the charge cycle is regularly used until the end of lifespan (EOL) of the BSS, respectively. C B S S   represents the investment cost of the BSS. The BSS lifespan can be maximized through the minimization of degradation cost, C D B S S .

3. Mixed Integer Nonlinear Programing Optimization Energy Model

The energy optimization of the DES network model presented in Section 2 is investigated using MINLP technique. The MINLP co-optimizes energy production and minimizes energy utilization through maximization of the renewable energy sources in the DES, while simultaneously maintaining applicable multi-parametric power constraints and system parameters.

3.1. MINLP Optimization Algorithm

In this study, a multi-objective operational cost function with the aim of minimizing utilization of DG and GHG emission costs through the maximization of RESs power generation in the DES is formulated as an MINLP optimization problem with dependent discrete and continuous control variables. The MINLP is a robust and computationally efficient optimization method capable of prioritizing RESs in meeting load profile with fast convergence speed. In this paper, the MINLP is implemented in MATLAB program using “Intlinprog” solver. The combination of the continuous and binary control variables forms the mixed integer nonlinear constraints. The MNILP algorithm is expressed in a generalized canonical form as follows [45]:
Minimize   J x ,   Subject   to   x R e q x = q e q R i n e q x     q i n e q l b   x     u b x i   D s w
where the nonlinear objective cost function is denoted by J(x).
The equality coefficient matrices are denoted by R e q x and q e q .
The inequality coefficient matrices are denoted by R i n e q x and q i n e q .
The lower and upper nonlinear control variables are, respectively, denoted as lb and ub.
Discrete binary control variable is denoted by D s w .

3.2. Objective Problem Formulation

The current study aims to minimize daily operational costs, consisting of fuel consumption and emission treatment costs incurred by DG through the maximization of renewable power generation while providing reliable power supply to the load demand in the DES. The emission cost relates to the monetized environmental emission associated with the hourly output power produced by the DG. Daily energy demand is supplied primarily from the WT, PV and MHPS generators, while excess power is conserved into the BSS for subsequent energy requirement. The DG is only engaged to power or complement net power demand in the event of power production deficiency. The daily operation cost of WT, PV system and BSS is assumed zero in this paper. Thus, the multi-objective function is formulated in Equation (22) as follows:
Ψ m i n = M i n C D τ = 1 N τ F C D G P D G τ .   D s w + τ = 1 N τ E C G H G τ × C d τ = 1 N τ P R C R ;   R W T ,   P V ,   B S S
where C D   and   D s w represent diesel cost price in USD/l and discrete state of the DG, respectively; C d represents the decontaminant cost by DG, taken as USD 0.0091/kg; and F C D G   and   E C G H G represent the fuel consumption and emission costs released by the DG, respectively. The multi-objective cost function is then subjected to the following operational and decision constraints to evaluate its feasibility:
(i)
Power Equality limits
By applying Kirchhoff’s current law (KCL) to the radial network, the total power generation injected from the DES must be equal to the total power outflowed to the electrical load demand, losses and BSS at any time horizon τ . Thus, the equality constraint is expressed through the power balance equation as follows:
τ = 1 N τ P W T τ + τ = 1 N τ P P v τ + τ = 1 N τ P M H P S τ = τ = 1 N τ P L τ + τ = 1 N τ P L o s s τ + τ = 1 N τ P B S S τ ;
where s is a binary decision variable controlling the charging or discharging operation modes of the BSS and P L o s s e s τ represents the power losses during distribution to consumers. However, the radius of consumption to the generation considered in this study is less than 500 m. Hence, the power losses are negligible and, thus, ignored. It is worthy to note that the unmet energy equates to zero, as the combined generating units are capable of meeting the load demand completely.
(ii)
Power generation inequality constraints
Technically, output power produced by each controllable power source cannot exceed a predefined minimum and maximum boundary limit at any specific operation horizon of the DES. Hence, the continuous hourly output power from each power generation source k should be kept within the lower and upper permissible limits expressed as in Equation (24):
P k m i n     P k τ     P k m a x ;   k M H P S , W T , P V ,   D G
where P k m i n   and   P k r a t e d   are the respective minimum and maximum set points of WT, PV, MHPS and DG. “k” represents control variables.
(iii)
Design variable constraint and node power constraint
The electrical power produced by each RES must be less or equal to the power dispensed to the load demand and power conserved into the BSSS, as represented in Equation (25):
P M τ   P L τ + P B S S τ ;   M W T , P V ,   M H P S
(iv)
Absolute power generation constraint
The power generated by each power-generating unit in the DES must be equal to or exceed zero, as defined in Equation (26):
P N τ   0 ;   N M H P S , W T , P V ,   D G
(v)
State of charge (SOC) inequality boundary
The activity of the BSS, known as state of charge or state of energy is constrained within acceptable minimum and maximum limits to preserve its lifespan and obtain an optimal feasible solution, defined according to Equation (27):
S o C B S S m i n   S o C B S S τ     S o C B S S m a x
(vi)
Binary Switch state control variable
The ON/OFF operation of the DG is determined by a binary state variable, defined as follows:
D s w = 1 ,   0
where D s w indicates the ON or OFF state variable of the DG.
(vii)
Charge and discharge constraints
The charge and discharge powers into and out of the BSS shall not exceed the rated power capacity of the BSSS.
P B S S τ = P i n j τ   P B S S m i n     P i n j τ     P B S S R a t e d   P d i s τ   P B S S R a t e d     P d i s τ     P B S S m i n   0   E l s e w h e r e    
0   P B S S τ     P B S S m a x ;   k c h a r g i n g   a n d   d i s c h a r g i n g   m o d e s
where P B S S τ is the controllable injected and discharged power during charge and discharge mechanisms. The P i n j / P d i s τ   are the controllable injected and discharged powers representing the charging and discharging activities, respectively.
(viii)
Charge and discharge power flow constraint
At any specific horizon, the BSS is permitted to either operate in the charging or discharging mode. Thus, the power injection and power discharge into and out of the BSS during the charging and discharging operation mechanism occur independently and not simultaneously, as in Equation (31):
P B S S ,   i n t × P B S S ,   o u t t = 0   ;     P B S S ,   i n ,   P B S S ,   o u t t 0

3.3. Renewable Energy Factor

To determine the viability and economic impact of the proposed DES, it is crucial to calculate the amount of electrical power that originates from the renewable power sources. This can be referred to as renewable energy factor (REF). The REF is, therefore, expressed as the proportion of total power supplied by a combination of WT, PV generator and MHPS to the load demand over a specific period, expressed in percentage as follows:
R E F % = 1 τ = 1 N τ ( P W T τ + P P V τ + P M H P S τ + P B S S τ ) τ = 1 N τ P L τ × 100 %
where P W T τ ,   P P V τ ,     P M H P τ   and   P B S S τ   represent the overall daily electrical power supplied by the WT, PV, MHPS and BSS, respectively. P L S τ is the total electrical load served (kWh/day).

3.4. Estimation of BSS Degradation Using Rainflow Algorithm

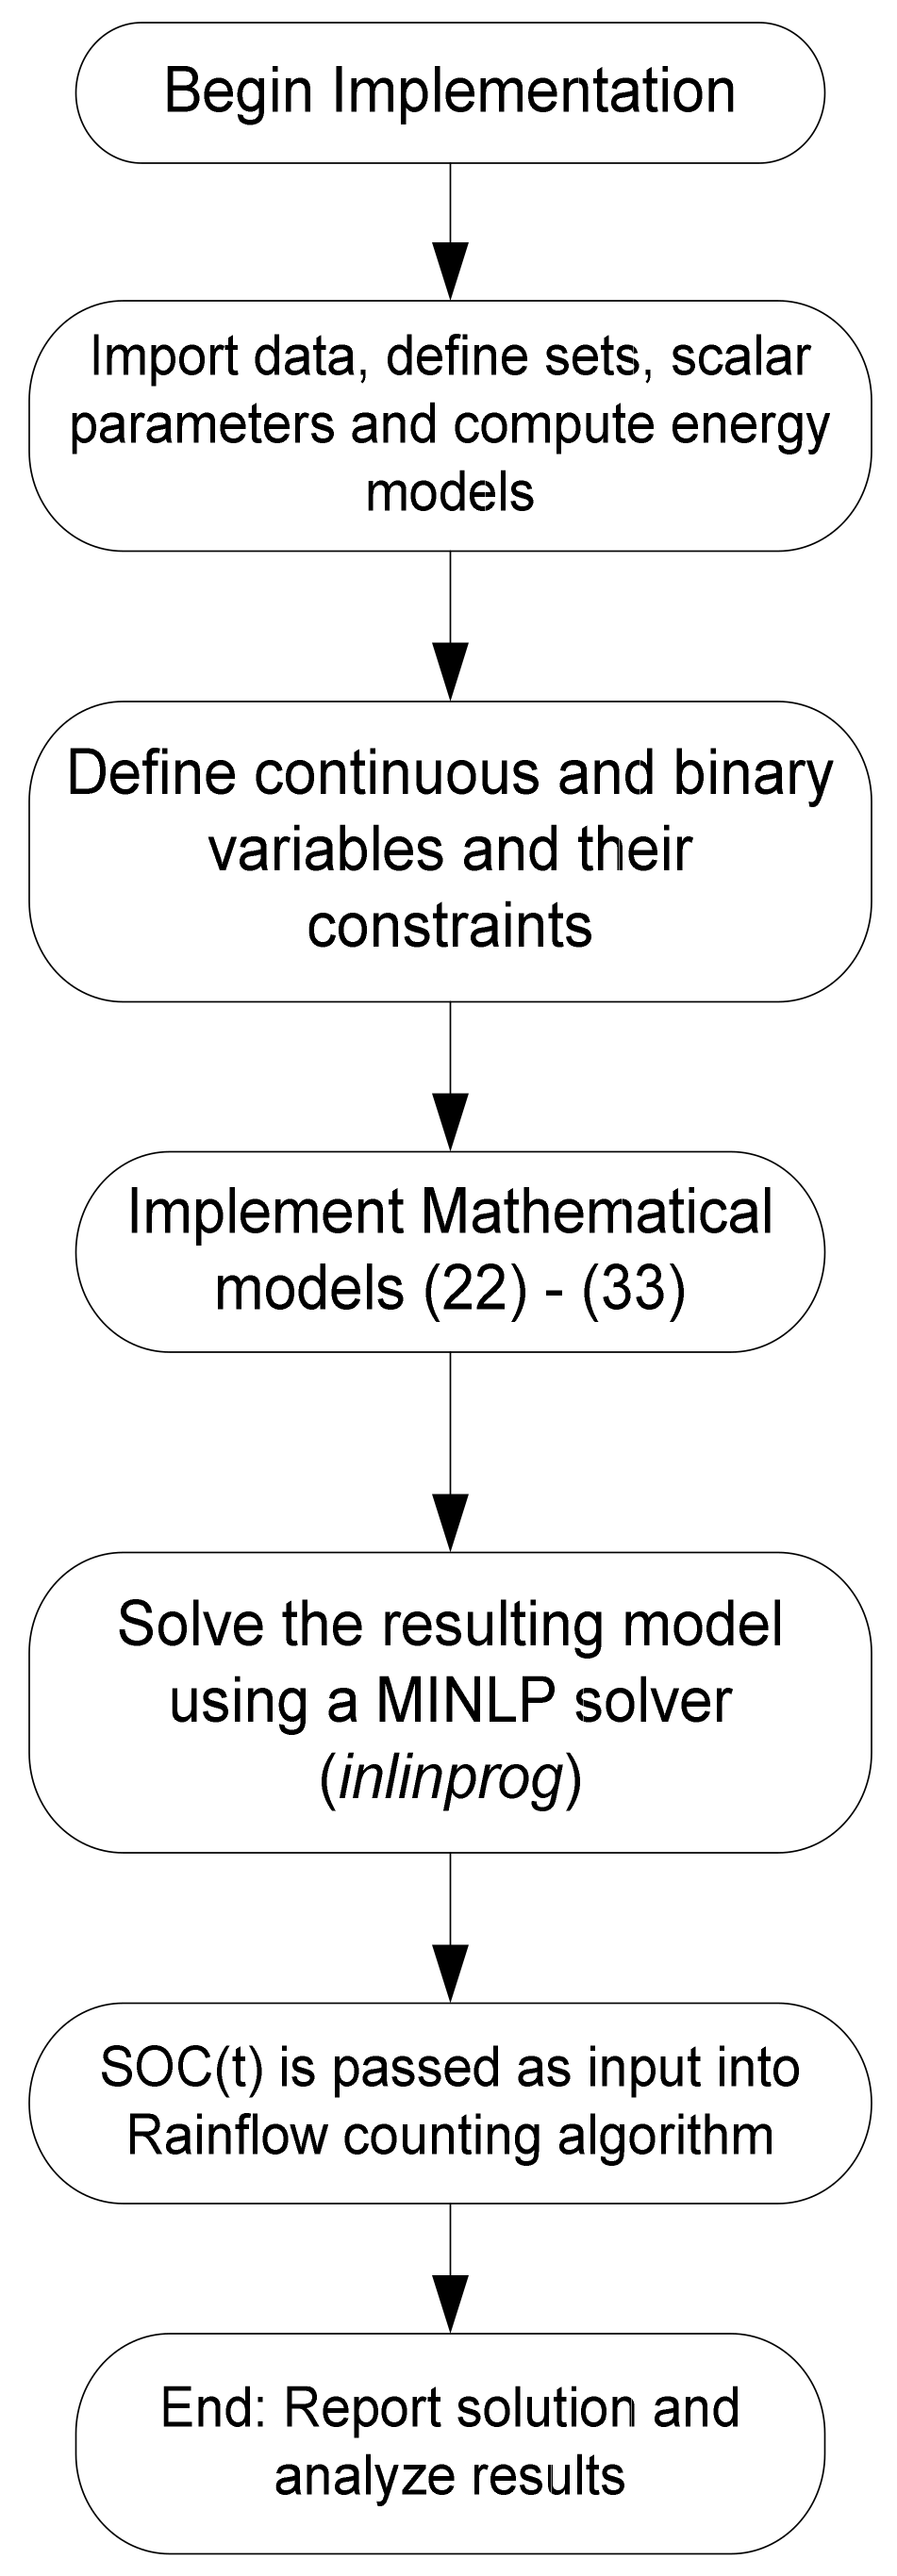
In a DES, accurate cycle estimation of the battery is crucial because it ensures proactive monitoring of its usage capacity and reliable health status during operation [46,47]. Therefore, the current study considers the impact of frequent charge and discharge dynamics on capacity degradation of the BSS under RCA. The RCA is a cycle counting evaluation method capable of determining the performance reliability of BSS [48]. Generally, a battery should be replaced once its capacity diminishes by a specific proportion, as the nominal reliability of the battery cannot be guaranteed [49]. In this study, the RCA is implemented to estimate daily cyclic degradation of the battery system during the cycle charge–discharge operation modes. The RCA uses the SOC data as input to estimate how many cycles are present at each sampling time. The computed charge capacity loss is analyzed to estimate the optimal performance of the battery technology. A flowchart of the MINLP incorporated with the RCA is presented in Figure 7.

3.5. Modeling of Electrical Load demand

A load demand modeling that ensures sustainable power flow to electrical load demand in an economic and reliable manner is essential for effective operational decision making and optimal planning in the DES. In this paper, typical daily load profiles measured for different households through South African electric power utility (ESKOM) prepaid meters were used to model the time-varying load profile for 60 households, representing an aggregate number of houses in a typical South African community using normal distribution (ND) technique. The ND is a probability density function (PDF) suitable to provide a fitting for the collected residential load profiles, given as in Equation (33) [17]:
f l d τ = 1 2 π σ 2   e l d τ μ 2 2 σ 2
The average load profile at each hour is calculated by the probability of every possible event during a particular time frame, which is expressed in Equation (34) as follows:
P l d τ = s t = 1 N l d P l d m a x   x   P L l d τ
where N l d denotes the maximum state number of the load profile; σ   and   μ represent the hourly standard deviation and mean of the load profiles. P l d l d a s t τ represents possible outcome of load demand determined for every state within a sample space as follows:
P L l d τ = m i n s t l d m a x s t l d f l d τ d l  

4. Model Parameters

Table 1 presents the technical and economic simulation parameters comprised of system configuration and operational settings used in the simulations.

Description of Load Profile Scenario

This section presents an outline of a dynamic residential daily load scenario used in the simulation and analysis of the efficiency of MINLP optimization method presented in Section 3. Typical electricity consumptions of three residential households in Mooikloof Ridge, a suburb of Pretoria, South Africa, are considered as scenarios in this study. Each selected household is comprised of various physical and contextual characteristics with respect to design, size, age and thermal comfort, leading to varying weekly and weekend daily demand load profiles, as shown in Figure 8. The households are regular residential buildings, most of which possess basic electrical appliances, such as lights, computers, fans, refrigerators, TVs and washing machines. The weekdays and weekend daily load profiles are taken directly from Impact meters installed at each of the three residential building by Impact meter services, an authorized electricity distribution company approved by ESKOM. The daily load profile is divided into 24 h, with an interval of 30 min sampling time. It should be noted that the load profiles are similar in both weekdays and weekends, except with a higher energy consumption proportion during weekends. These daily load profiles have similar energy demand characteristics, with a relatively low and constant demand between 0:00 and 5:00 due to inactivity of most residents, slight surge and drop in demand between 5:000 and 9:00 resulting from activities of most residents as they prepare for daily activities and work, and maintain relative constant values between 9:00 and 17:00. A progressive and prolonged increase in electricity demand is observed between 17:00 and 22:30 due to a peak activity of energy usage by electricity consumers powering ON most electrical gadgets, such as cooking appliances, thus leading to a significant spike in load demand at this time range. The measured daily energy consumption profiles are then incorporated to the statistical model presented in Section 3.4 to obtain an aggregate daily load profile for 60 residential households (buildings), representing a typical dynamic load profile for a remote community, as shown in Figure 9. In this figure, the daily electricity consumption ranges between 38.45 and 418.06 kWh. The load demand is relatively constant early in the morning, indicating resting activity, when only basic loads are required, steadily rises when residents prepare for work activities and progressively drops when the residents leave the house for work until it reaches and maintains a uniform load demand throughout the daytime. As residents return from work, the load demand rapidly increases again as various electrical appliances are powered ON. Due to the focus of this paper, the community daily load profile is then considered as a load demand case study to evaluate the impacts of the DES and compared to an exclusive DG supply of load demand, intended to optimally service the energy demand regardless of the amount of renewable power available, economic implication and greenhouse emission factor considerations. The daily operation mechanism of the studied DES is examined through the implementation of the MINLP optimization simulation by computing the power supplied by each power generation source to assess their individual performance during the 24 h duration. The MINLP minimizes the daily operational cost of the system in terms of fuel consumption through the maximization of RESs power generation, while simultaneously ensuring reliable supply or satisfaction of the dynamic load demand. In addition, the optimum operational cost and greenhouse gas emission cost of both scenarios (DES configuration and DG sole system) of electricity production under investigation are obtained and analyzed. Efficacy of the proposed DES model at minimizing operational costs, conserving energy and emission reduction is demonstrated using the numerical results obtained in the next section to assess the economic feasibility and adequacy of the efficient MINLP optimization technique. A typical residential summer load profiles obtained and normalized aggregate data obtained for the studied location by the application of the PDF illustrated in Section 3.5 is presented in Table A1 of Appendix A.

5. Simulation Results and Discussion

A discussion and analyses of the simulation results obtained for the proposed DES network using an MINLP technique are presented in this segment. The simulation is performed on a computer fitted with Intel Core i5 processor, 8 GB RAM, 500 GB hard drive capacity. The DES is comprised of five energy sources, which include WG, PV, MHPS, DG and BSS. The MINLP aims to regulate optimal energy flow from energy generation sources in the DES to electrical load demand, as well as minimize daily operational and emission costs, while satisfying various system parameters and operational limits. Efficacy of the MINLP method for the DES is evaluated in powering the load demand elucidated in Section 4 and contrasted with an exclusive usage of DG system in powering the electricity demand profile.

5.1. Analysis of Daily Renewable-Based Multi-Energy Generation for the DES Model

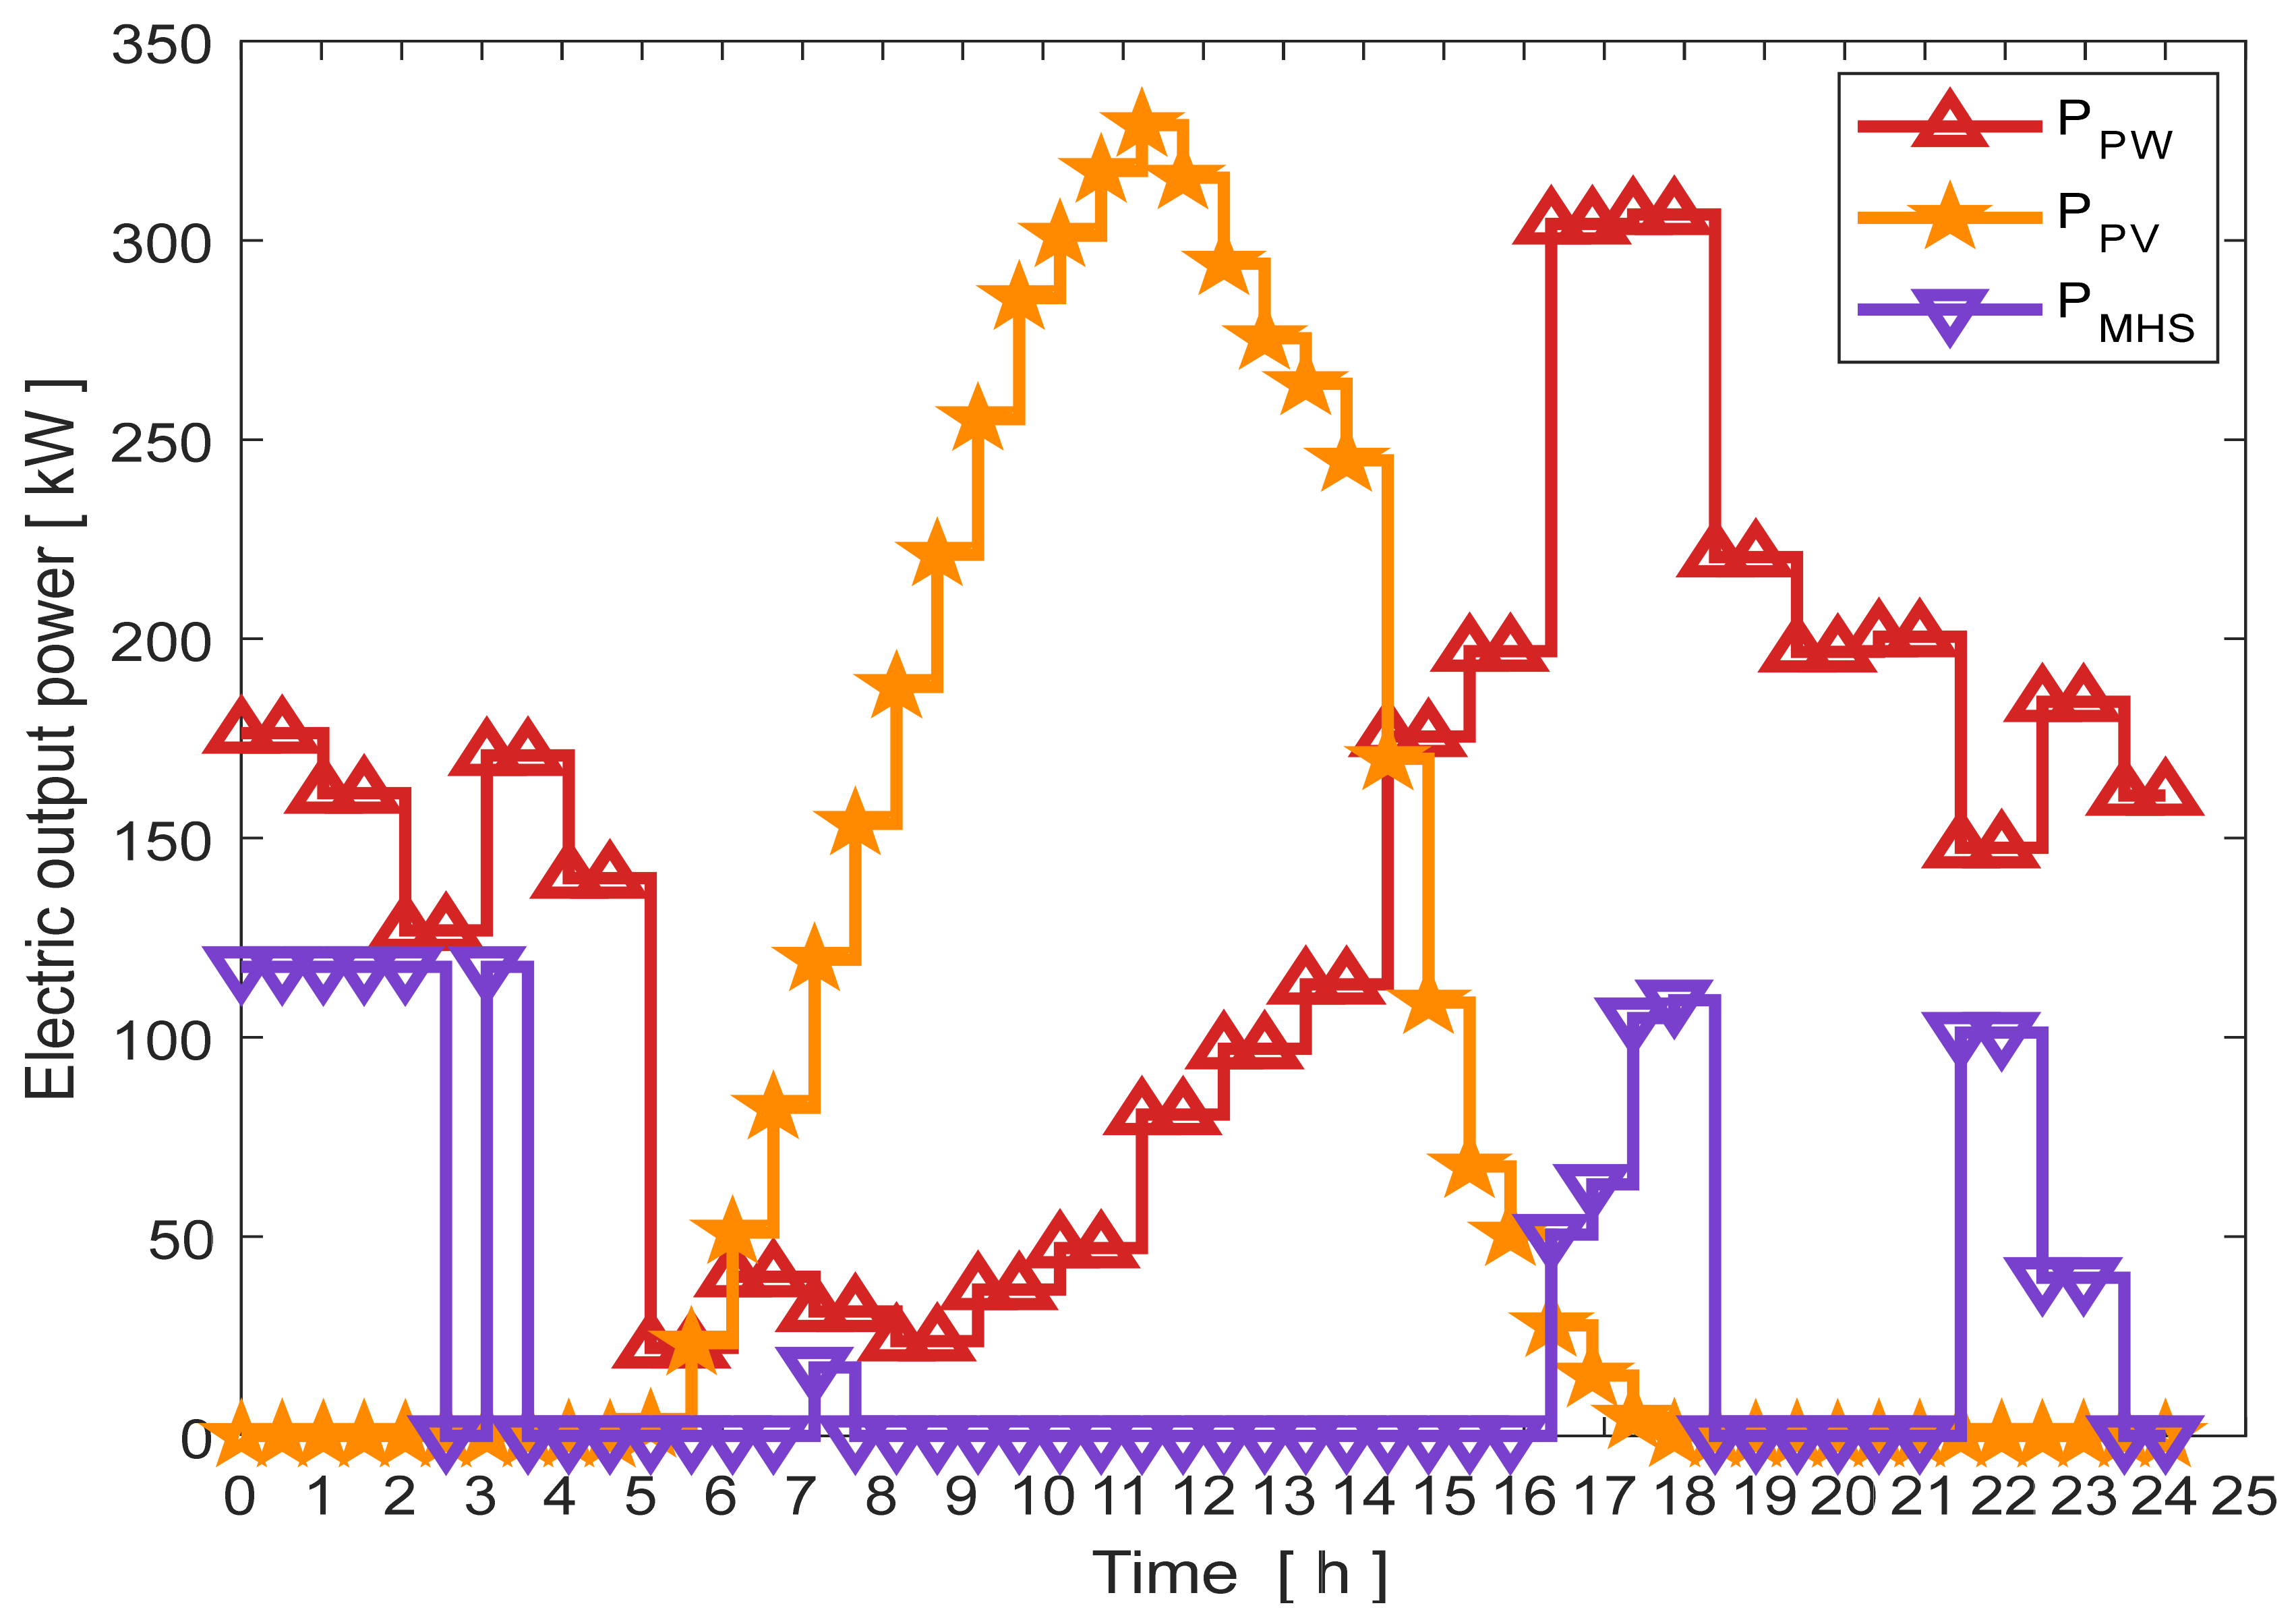
Figure 10 displays the daily power generation analysis of the various RES power mixtures in the DES, which include WT, PV and MHPS generators. The PV turbine progressively produces electrical power (indicated by the color yellow) between 5:45 and 17:30 until it attains its peak power generation of concisely 332 kWh at 11:30 and reaches its lowest generation of approximately 12 kWh at 17:30. During the PV power generation horizon, sufficient power, which optimally covers the load demand, is produced by the multi-power sources, while surplus energy is conserved into the BSS according to Equation (16). The sufficient power generation of the PV system is greatly influenced by the intensity of solar irradiance and ambient temperature. Similarly, the wind energy generation results from the wind speed and the rated capacity of the wind generator. Hence, the BSS operates in the charging state and maintains an optimal energy balance operation. Similarly, the color brown in Figure 10 illustrates the WT power generation. Due to the availability of sufficient wind speed, the WT generates energy throughout the day. A relatively average wind energy of nearly 150 kWh is produced between 0:00 and 5:00, which complements the MHPS power generation, with its lowest power generation between 5:00 and 12:00, while its optimal generation of 310 kWh is attained between 16:30 and 18:30 at the interval of maximum load demand. In Figure 10, the purple color represents the power generation by the MHPS generator. Importantly, the MHPS did not service the load demand during most hours of the day due to the optimum power generation capability illustrated or displayed by both the WT and PV turbines. The MHPS is engaged to contribute power generation in the event of inadequacy by the PV and WT in servicing the load demand optimally. Generally, the electrical power produced by the renewable energy sources is inherently linked to the renewable energy resources in the selected area.

5.2. Evaluation of Diesel Power Generation and Its Operational Efficiency Mode

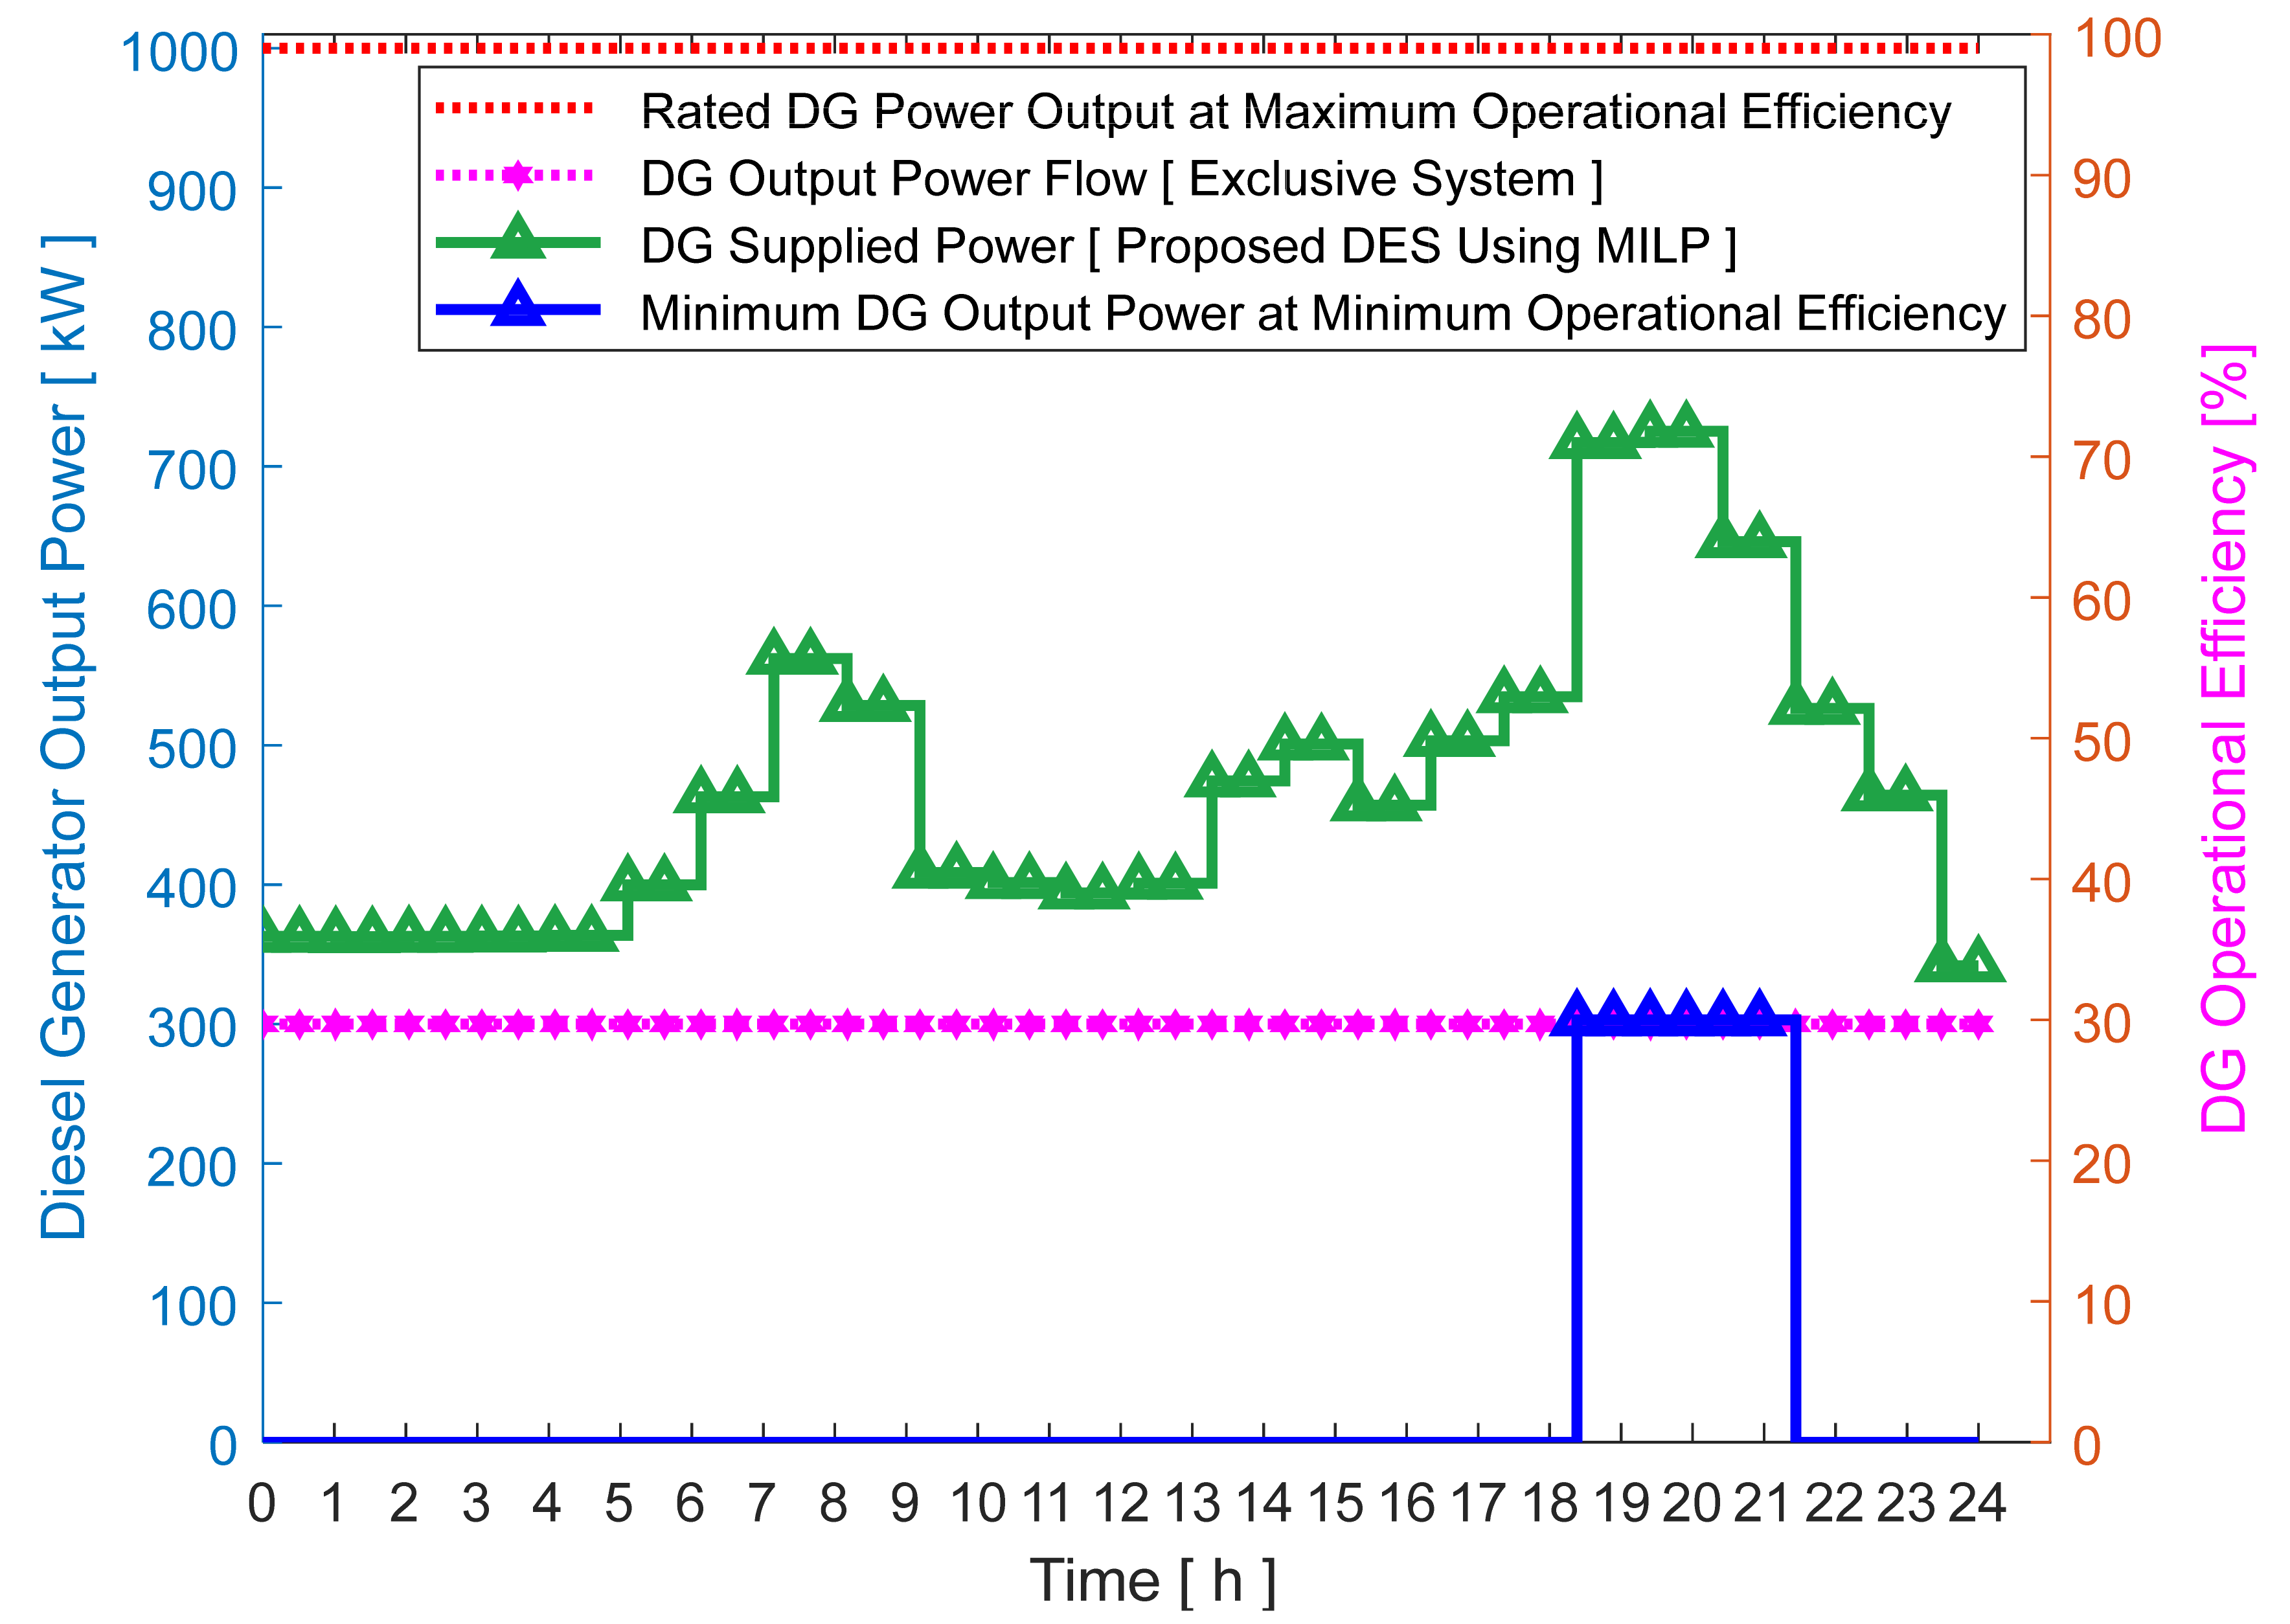
Figure 11 presents the highlights of diesel power generation as well as its operational efficiency for singly operated DG and the proposed DES model to power the load profile. An auto-starting mechanism is adopted for the integrated DG as a complementary energy generation source using a net load following dispatch strategy. Using the MINLP technique, the DG operates in a well-controlled and economical mode, powering electrical load demand through a net load monitoring approach, with at least its minimum operational efficiency during the periods of energy insufficiency or deficiency in order not to compromise its overall efficiency. A typical minimum operating efficiency of the DG proposed in [1] is adopted as a benchmark for reliable lifespan and economic operation, indicated by the purple color, while the maximum operating efficiency is indicated by the red color provided that the DG operates at its highest power capability at any sampling time. Between 0:00 and 18:30, the DG supplies zero power to the load demand due to the sufficient power generation by the complementary combination of PV, WT and MHPS power sources, as well as the BSS. The enormous RERs available for the selected area and optimal capacity of each power source are obviously responsible for the sufficient energy generation during the sampling time. Moreover, the DG is operated at its minimum operational efficiency, supplying electrical power to the net energy demand between 18:30 and 21:30, during which the load profile exceeds total power generation of the hybrid power sources and stored energy. The minimum operational efficiency ensures stable, reliable and economic operation mode of the DG. From 21:30 to 24:00, DG supplies zero power to the load demand due to a decrease in load demand and power generation by the WT, as well as conserved energy into the BSS. In any case, where the DG does not supply any electrical power to the load, the operating efficiency becomes zero.

5.3. Analysis of the State of Energy of the Battery Storage System

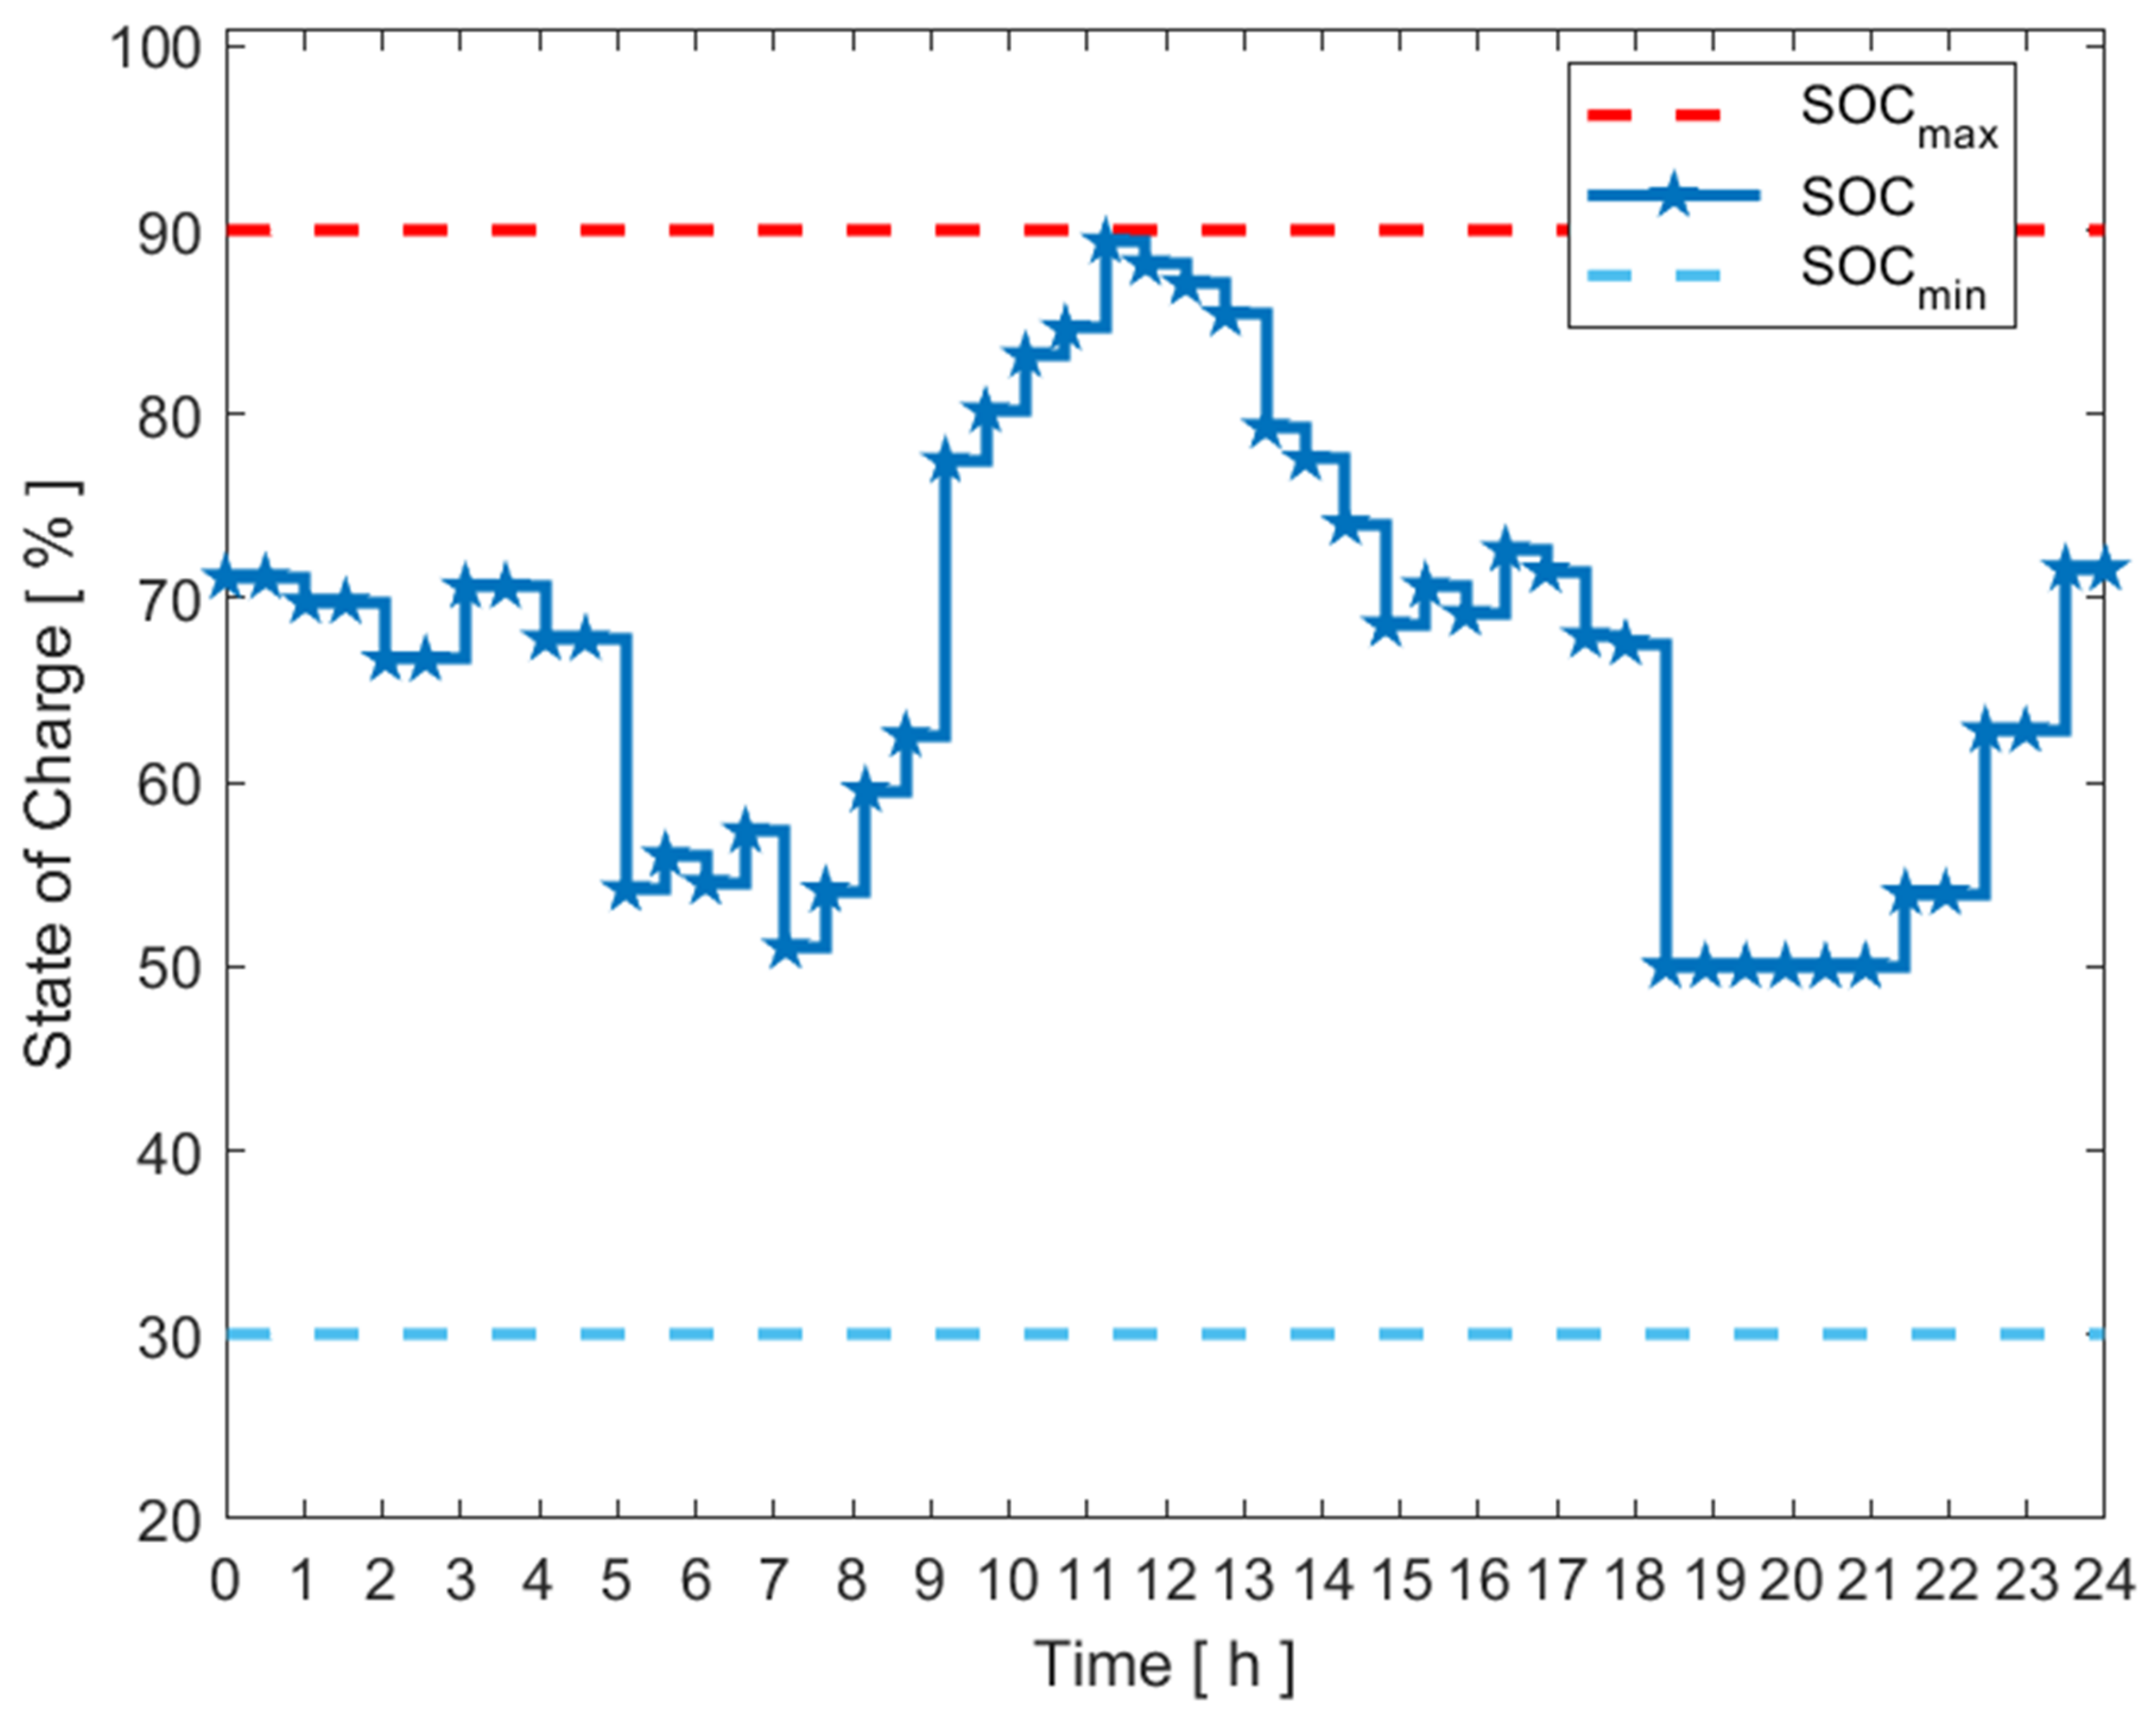
The activity of the BSS is presented as a reflection of the state of energy in Figure 12. The highest and the lowest level of charge are set at 90% and 30%, respectively, for economic and technical reasons. Due to the relatively constant energy demand in the morning (between 0:00 and 5:00) and sufficient power production by the MHPS and WT, the state of energy maintains a relatively constant level during this period. As the energy demand increases between 5:00 and 8:00, while the wind power generation becomes low and the MHPS produces zero power, net energy demand is obtained from the BSS and the state of energy drastically decreases until adequate electrical power is produced by the PV system at 9:00. Then, the state of charge of the BSS starts rising significantly or considerably due to the conservation of net energy produced until the peak state of charge is attained at 12:00, during which the lowest amount of wind power and highest PV energy are produced. Coincidentally, the intensity of solar radiation and wind speed obviously determines the amount of power during the 24 h duration. Thus, the BSS operates in discharging mode according to Equation (17) by discharging its conserved energy to compensate the net load demand in any event where the total power generated from the RESs in the DES proves insufficient to optimally service the load profile completely. It is concluded that the capacity of the BSS determines that amount of stored surplus power from the multi-energy sources and, subsequently, the electrical power that can be drawn from the BSS to cover the net energy demand.

Degradation Assessment of State of Energy Using Rainflow Algorithm

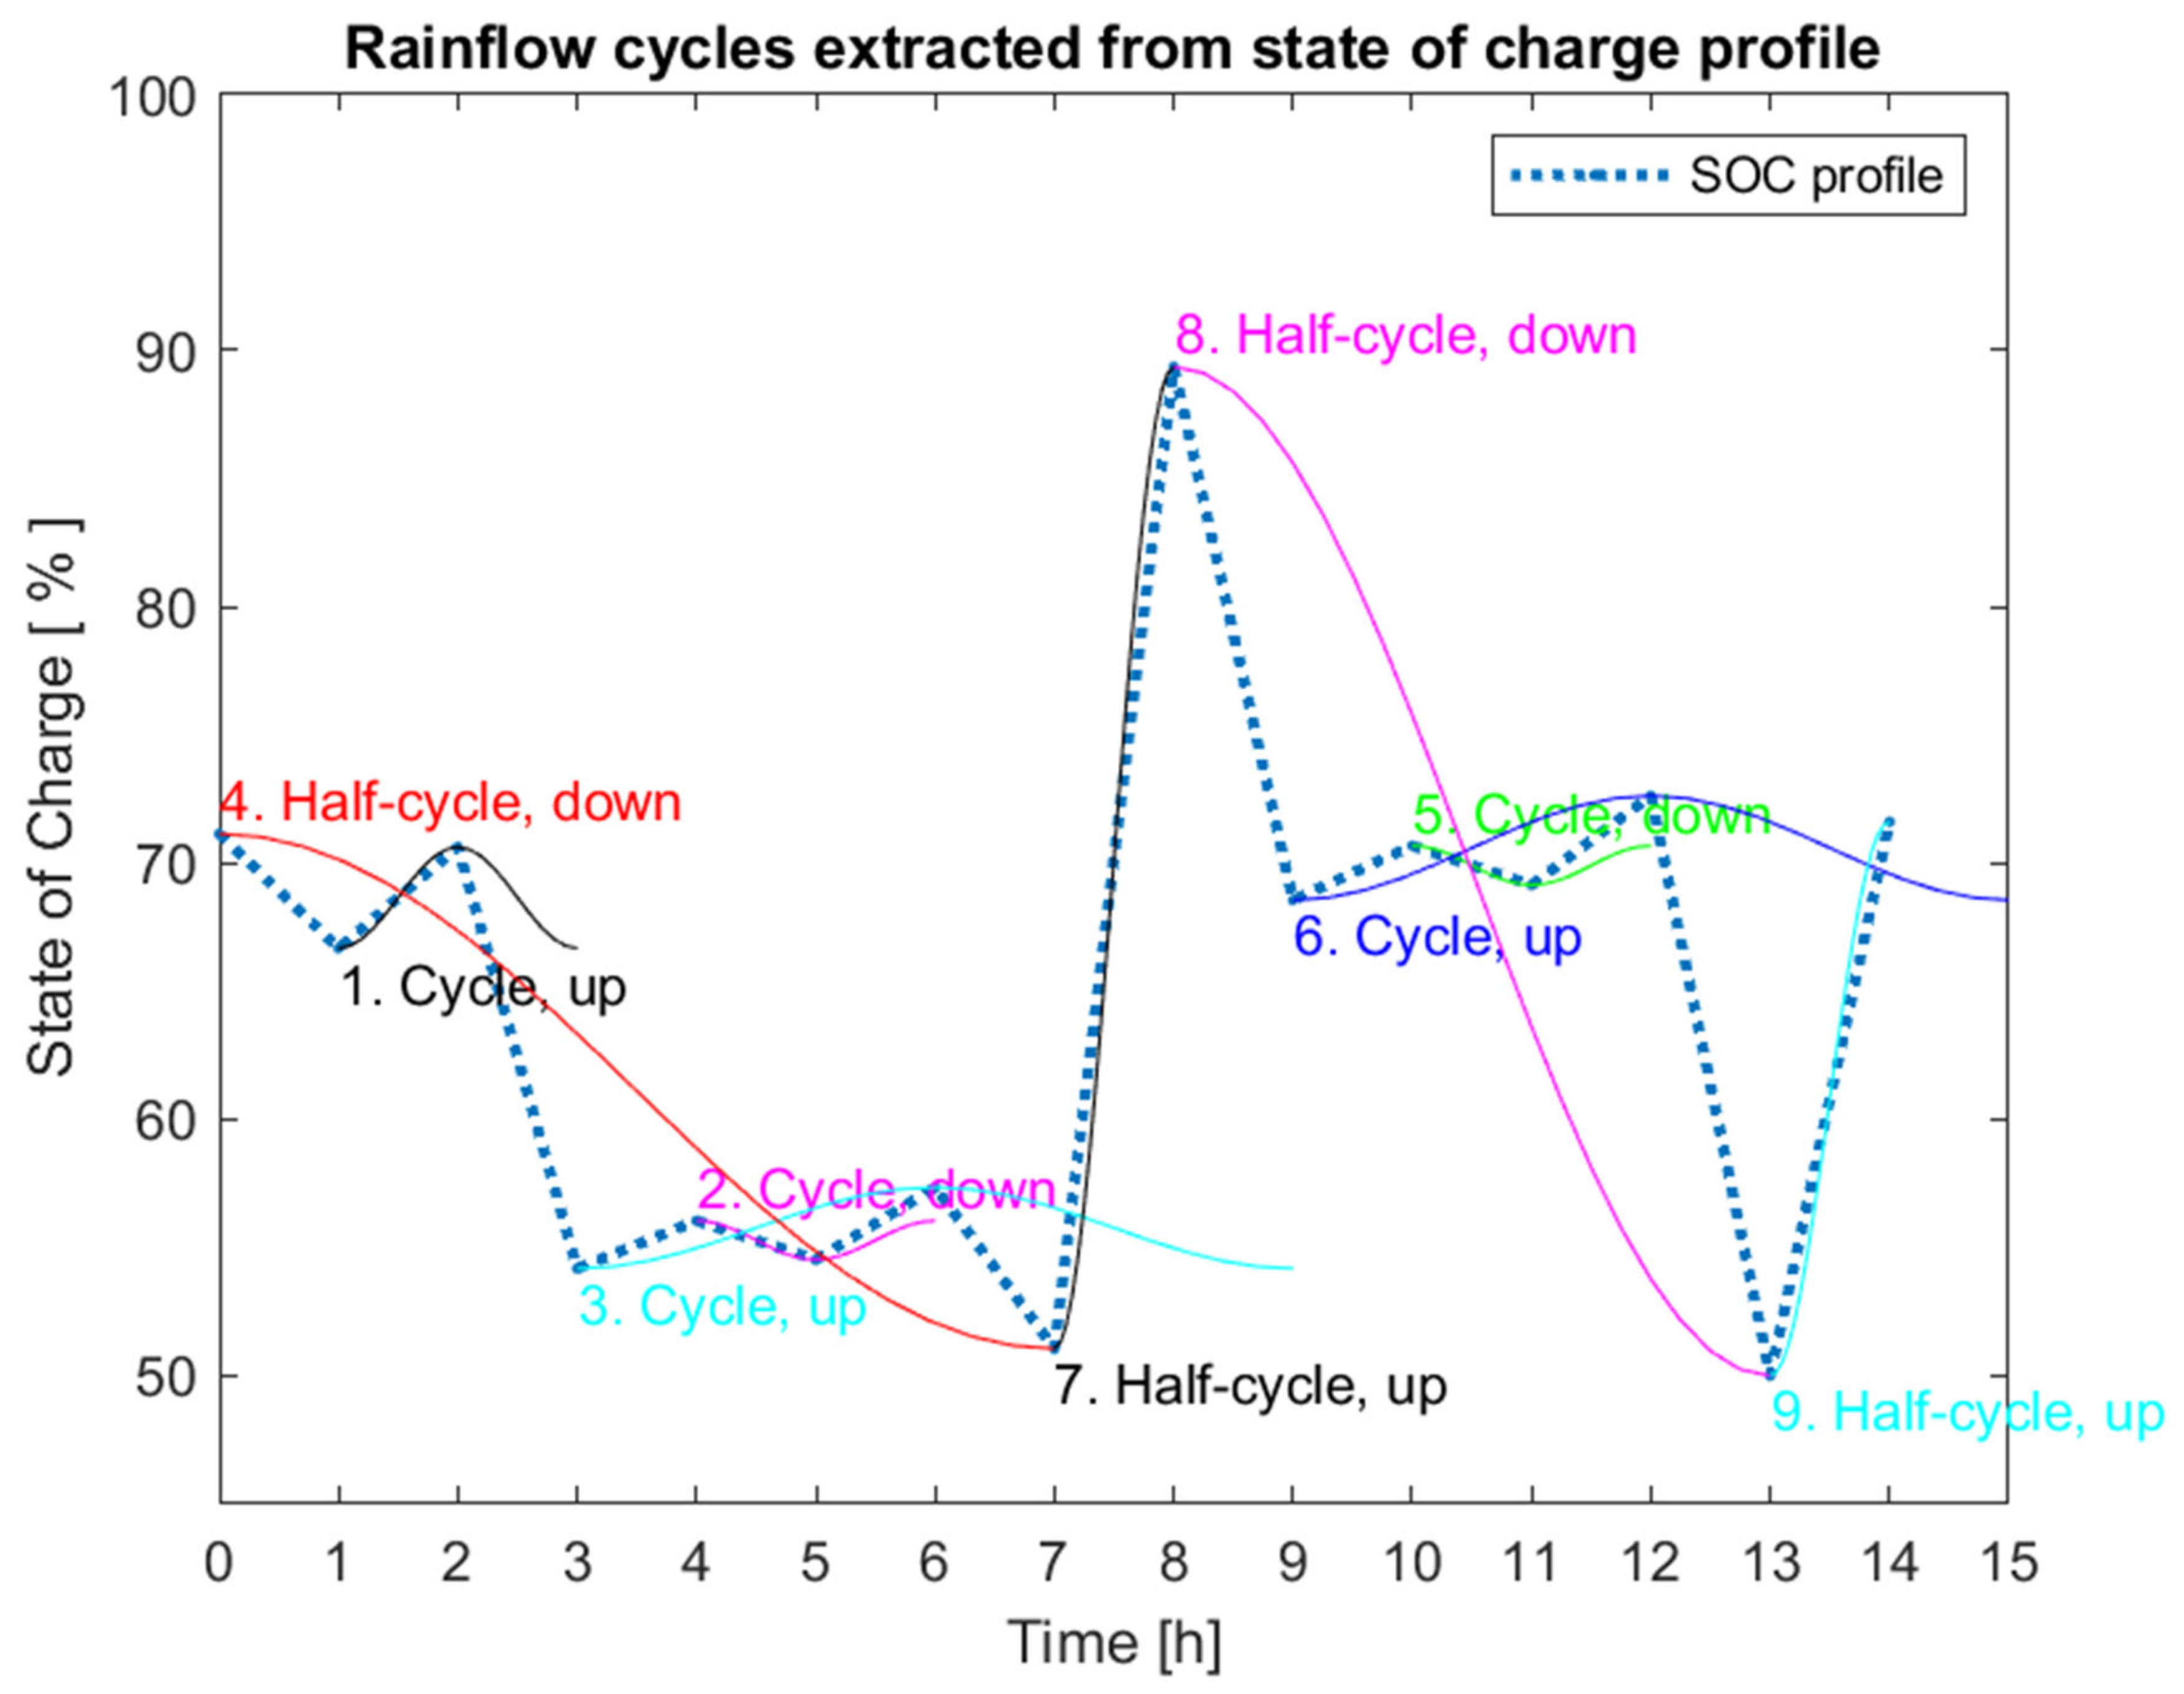
In this study, the RCA estimates the useful life period between the load points. The RCA carefully tracks the daily utilization of the BSS operation and its corresponding degradation lifespan. This is demonstrated by the number of cycles extracted from state of energy (SOE) profile, as shown in Figure 13. Thus, it is imperative to compute the overall capacity loss over every half cycle during the 24 h duration. To achieve the stated objective, the SOC profile obtained from the implementation of MINLP technique is used as input to the RCA. This defines analogous half and full cycles, which then pairs local SOC minima and maxima limits. Overall, five full/complete cycles (black, cyan, magenta, blue and green) and four half cycles (red, black, magenta and cyan) are detected by the algorithm, representing degradation effect on the BSS. This shows good health status, as the higher the number of cycles obtained, the lower the reliability performance of the battery. A full cycle is represented by pairs of up and down half cycles. The number of cycles obtained have an adverse impact on the degradation of the battery incremental lifetime and, subsequently, a reduction in the actual capacity of the battery. A detailed procedure for the computational analysis of the RCA is presented in [46,48]. By optimally lowering the SOC cycle depths, which directly depend on the amount of power supplied to or needed from the battery, it is possible to reduce the battery’s cyclic capacity loss and the associated cost of battery deterioration.

5.4. Power Contribution of Multi-Energy Generators to Daily Load Profile

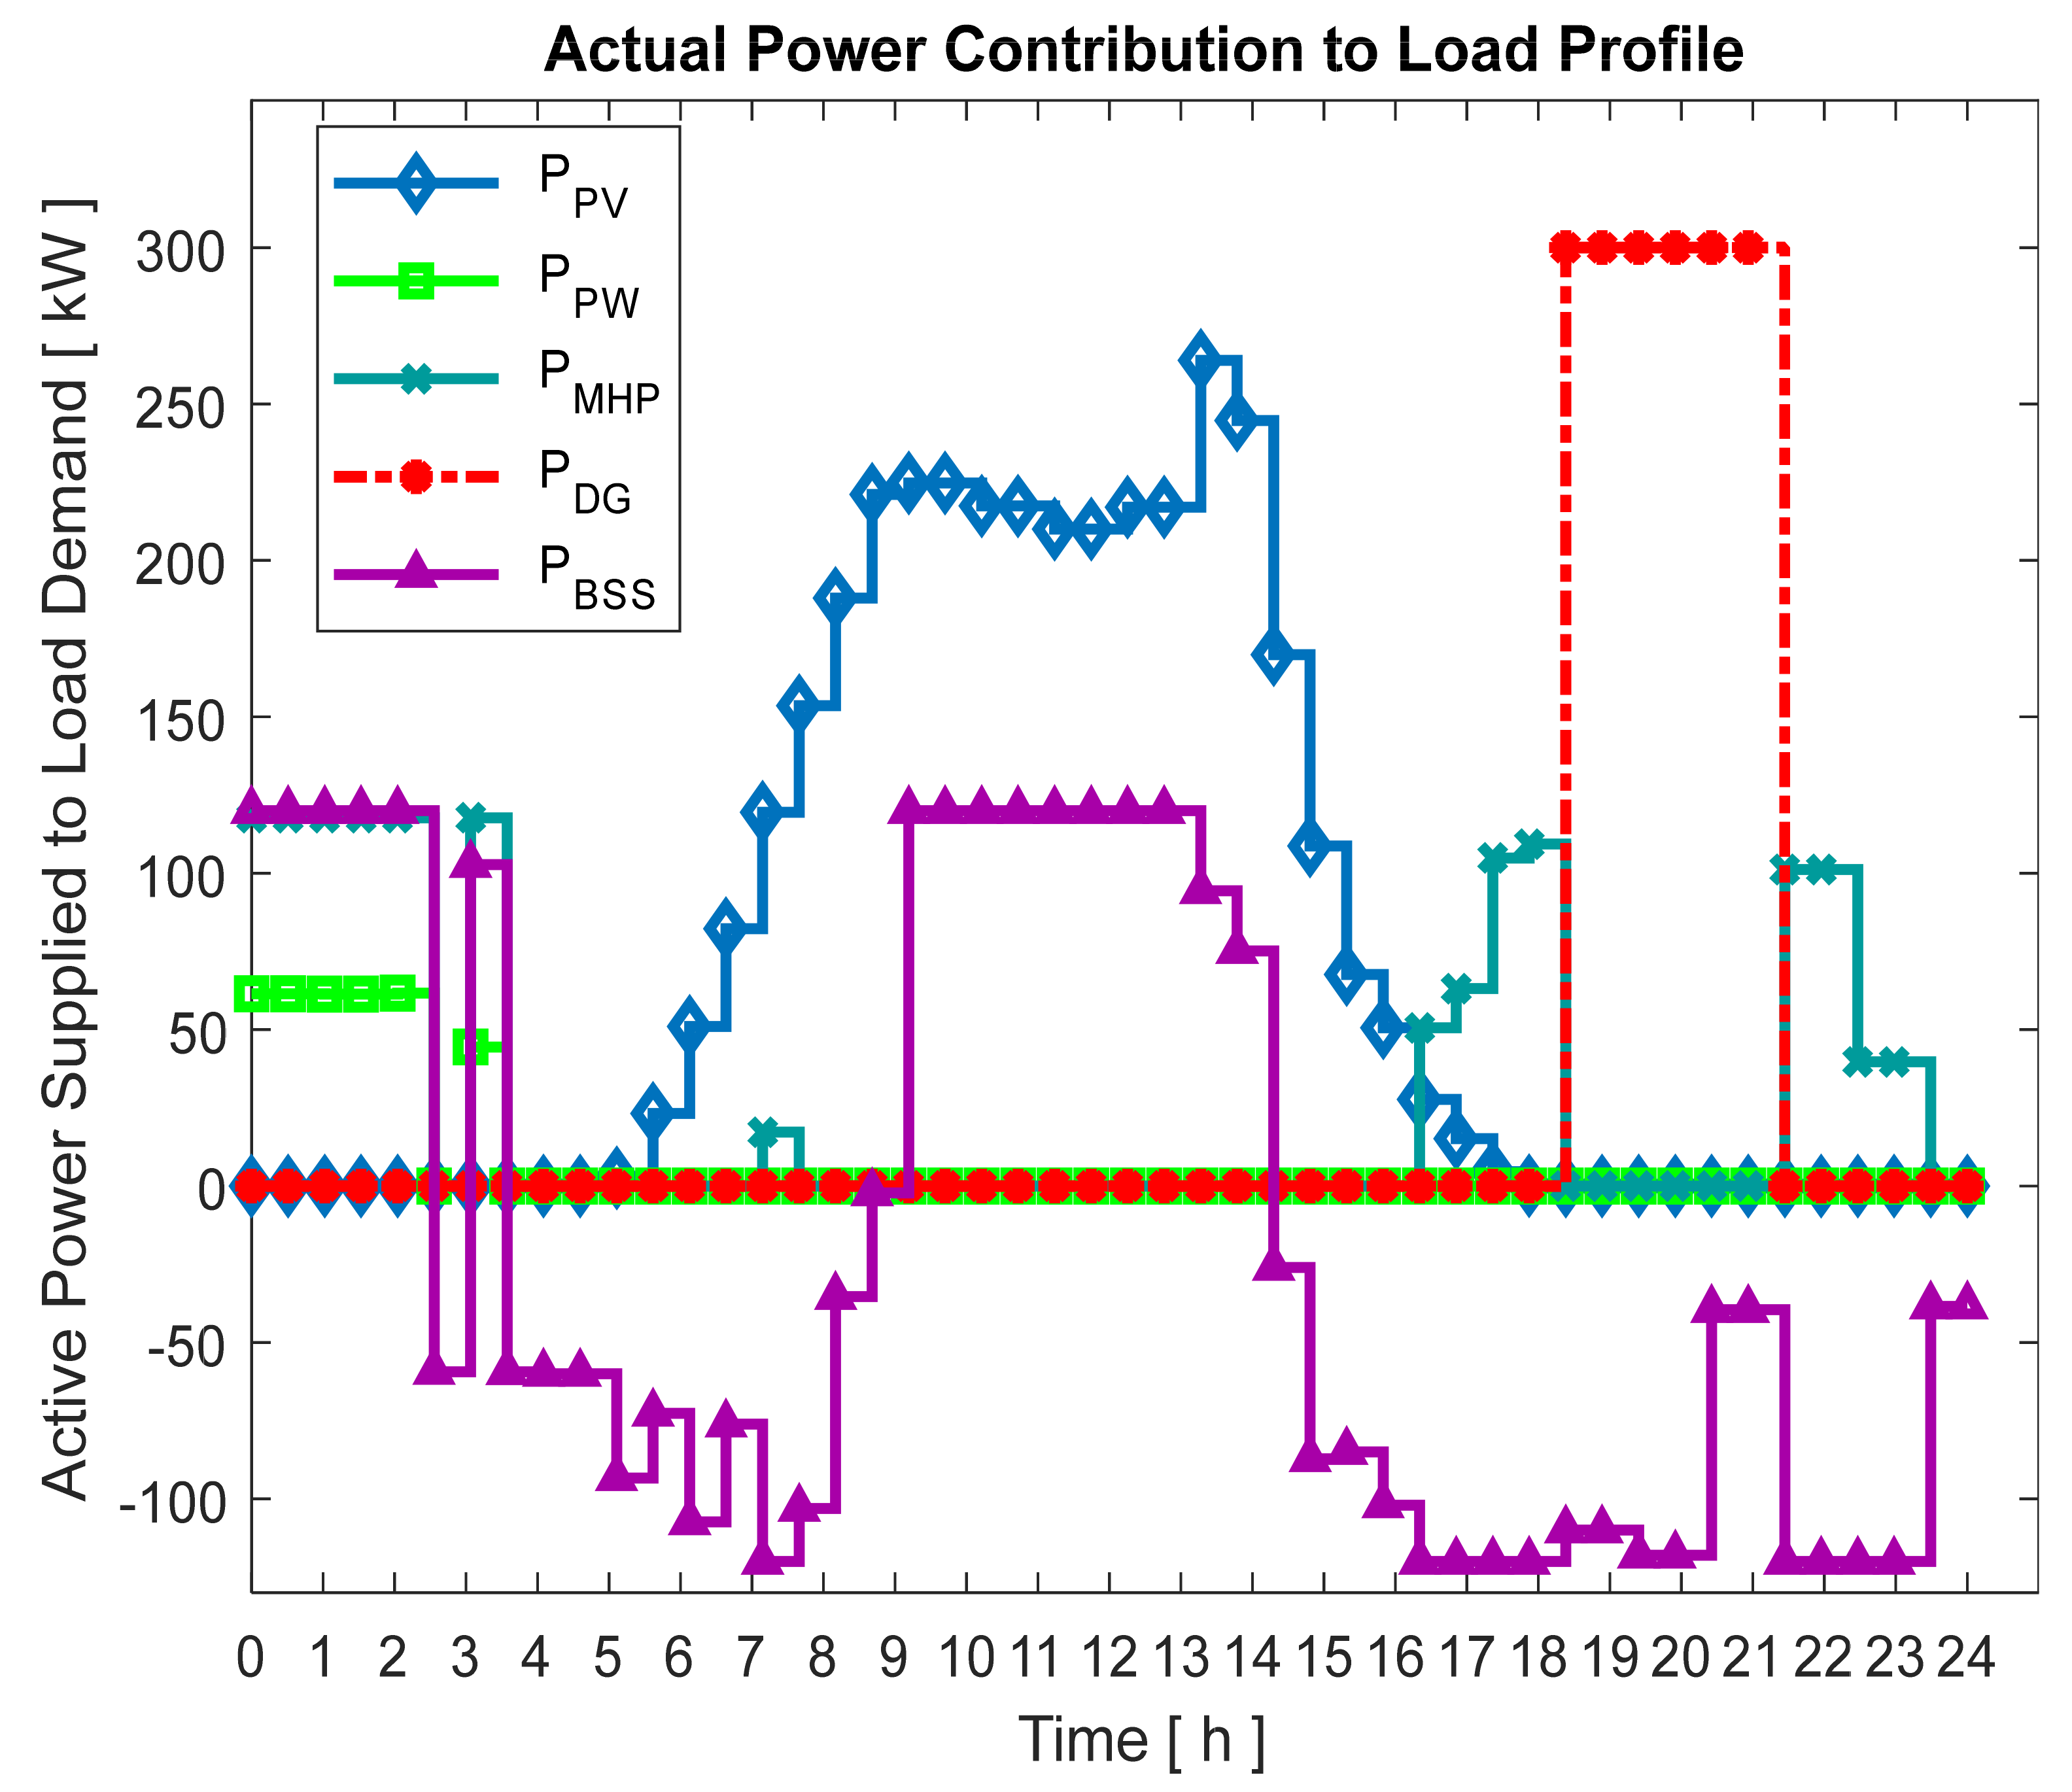
Figure 14 illustrates the actual power flow from individual components making up the DES to the energy demand profile. Apparently, the renewable power sources (WT and MHPS) supply the energy demand between 0:00 and 05:00 due to the unavailability of solar radiation. Considerably, the power produced by the PV and wind generators is more than sufficient to power the total load demand during the day as a result of available wind speed and solar irradiance. Thus, these renewable energy generators contribute a significant proportion of their overall power generations to the load demand, while the excess power is conserved into the BSS using the MINLP optimization method and, thus, maintaining an efficient energy balance scenario in the DES network. During these operating hours, the MHPS contributes an infinitesimal energy to the load, while the DG does not participate in energy contribution to the load requirement until sunset, when PV power generation depleted to zero. The MINLP optimization technique clearly utilized a multistage power-sharing operation mechanism for the DES network model between its power sources, with each energy source contributing or allocating a fraction of its overall electrical power produced to the load profile, subject to availability of resources and applicable system constraints. In the overall operation scenario, the BSS acts as a storage sink, conserving excess power generated, and aids to improve the techno-economic performance feasibility of the DES by complementing the energy dispatched to the load demand in the event of inadequate power generations. In Figure 14, the sink action of the BSS is demonstrated by the charging mechanism indicated by the upward movement of the power, while the downward power movement represents the discharging operation. The results of each energy component are further aggregated to provide a clear performance overview of the impact of the DES network configuration under the current study and are depicted in Figure 15. As depicted in this figure, the PV system contributes the largest proportion of 45%, while other energy sources, such as the DG, WT, MHPS and the BSS contribute 23%, 17%, 4% and 11% to the total energy consumption during the dispatch operation horizon. The lowest energy proportion of the MHPS results from its minimal participation and rated capacity in the energy generation process. Summarily, the REF amounts to 77% of the power supplied to energy demand. Ultimately, there would be unavoidable changes in operational cost and emission released as the number of households increases in the near future, as this would result in higher energy consumption/demand.

5.5. Economic Operational Cost Analysis of the Proposed DES under Two Scenarios

An overall daily operational cost analysis is illustrated in Table 2. In evaluating the daily operational cost of the system, two scenarios are considered, which include (i) the use of exclusive DG system without the application of other complementary energy sources and (ii) the utilization of the proposed DES model, which include DG in powering the load demand under a load following operational strategy. In this study, the daily operational cost considered includes diesel fuel consumed by the DG and GHG emission costs incurred in burning the fossil fuel. The GHGe cost is a polluter-pays tax designed to reduce greenhouse gas emissions economically and sustainably by holding companies and consumers accountable for the negative external costs associated with their production and consumption [50,51,52,53,54,55,56].
As shown in Table 2, the total operating cost incurred in powering the total load demand by the single DG system is USD 1780.26, while the total emission cost produced accounted for 5340.80 kg/kWh. Under the proposed DES model, the DG system operates in restricted mode to satisfy excess load demand and, thus, its power supply results in USD 509.63 operational cost. Overall, the DES considerably accounts for 77% of the total power supplied, providing approximately USD 1308.17 savings in energy cost. It is worthy to note that the available RERs in the studied area, the operational load following strategy and the efficient MINLP scheme contributed to the significant reduction in the overall operational costs. With the MINLP energy optimization technique, the overall operational and GHG emission costs amount to 71.53%, which shows a significant reduction in overall daily power generation costs. The MINLP provides an optimal solution that leads to reliable power supply, fast convergence speed and considerable energy cost savings. The results presented in the table obviously show that the DES gives best outcomes using MINLP optimization technique compared to the DG exclusive system.
By comparing the daily operational and emissions costs of the proposed DES model and the exclusive DG system, we found that both the operation and emission cost essentially depend on a number of salient factors, which are itemized as follows:
  • Optimal capacity of the multi-energy generators making up the DES network.
  • Availablity of RERs and, subsequentluy, the RESs output power.
  • Proficiency of the optimization methodology adopted.
In general, the DG contributes substantially a huge portion of GHG emission, with significant lower energy generation.

5.6. Environmental Evaluation of Greenhouse Gas Emission

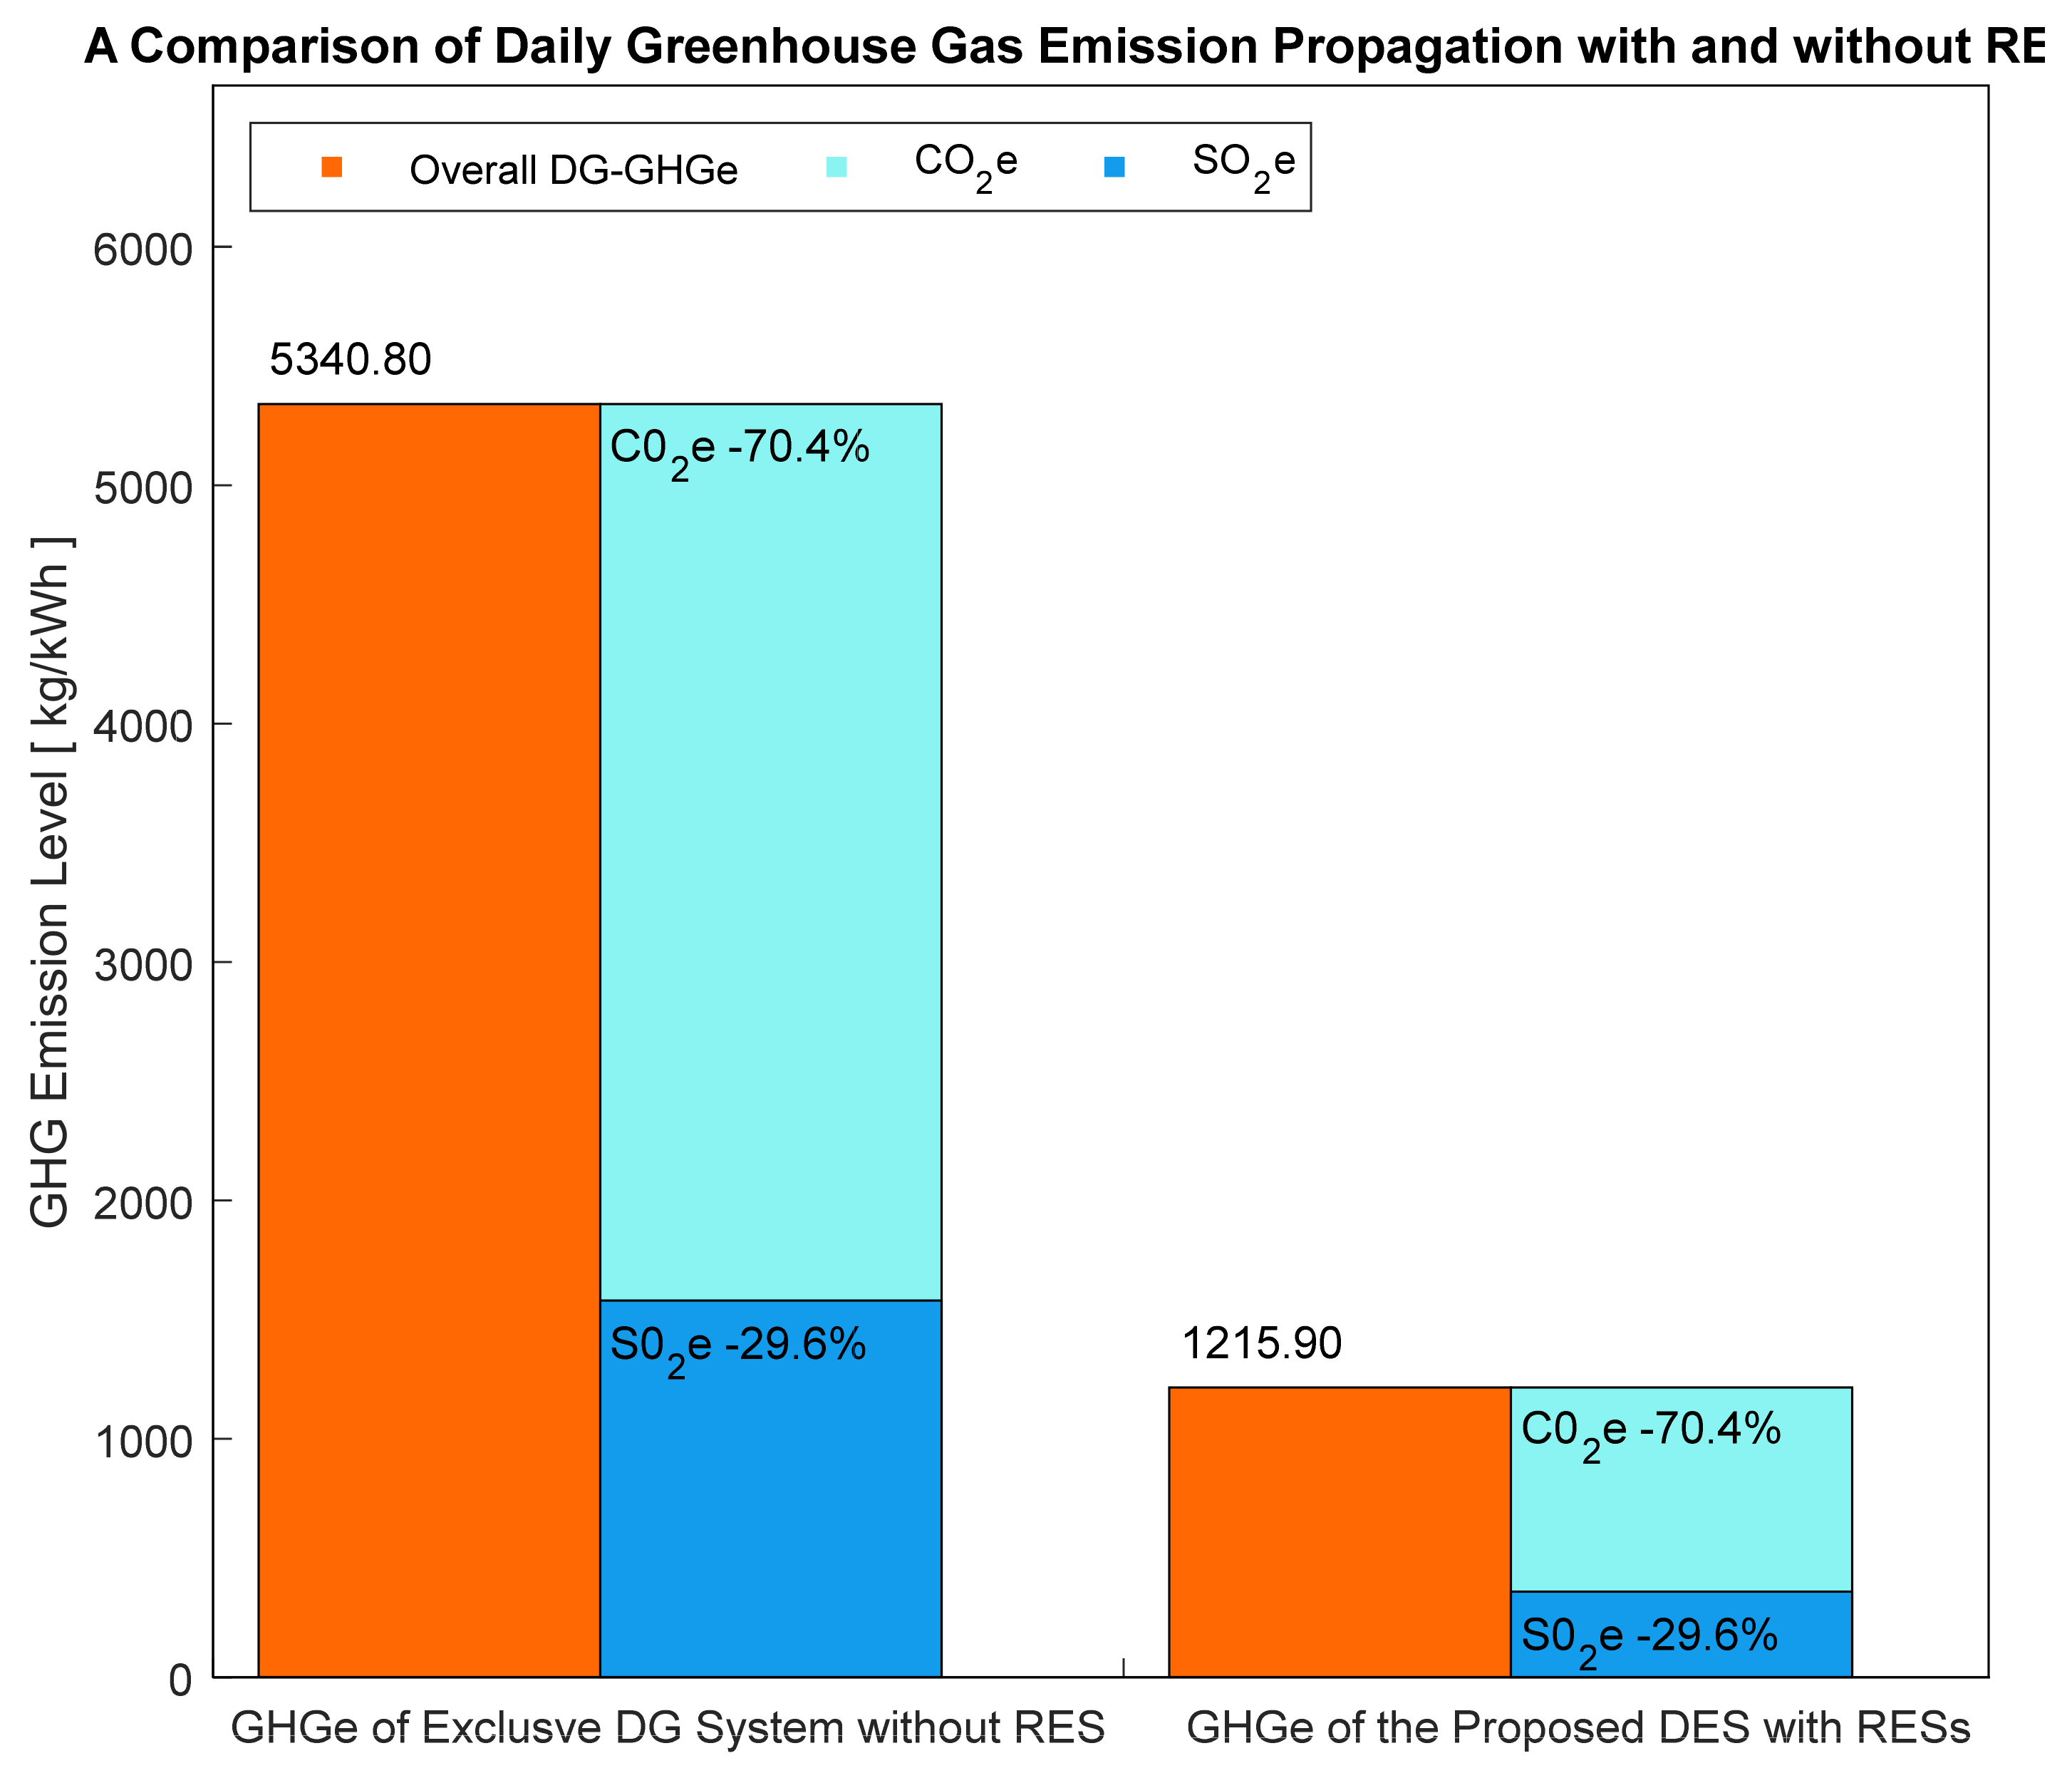
An analytical environmental assessment of GHG emission for the DG-exclusive system and proposed DES network configuration under the MINLP energy optimization technique is presented in Figure 16. The GHG emissions released by the DES model are evaluated by multiplying a specific emission factor per total energy consumption with the electrical load supplied by the DG and contrasted to the scenario of exclusive application of DG in powering the daily load profile. The emission factor considered in this paper is taken as 0.62 kg/kWh [48] and adopted for the evaluation.
In this study, the proposed DES under the MINLP method produces siginificant low GHG emissions due to its minimum efficiency, limited operational time frame and minimum output power supplied during operation. Contrarilly, the total emission released by the exclusive DG system is considerably high as a result of its inherent maximum operation efficiency and total power supply to the load requirements. Specifically, the DG system independently powering electrical load profile released approximately 5340.80 kg/kWh GHG emissions, consisting of 70.4% carbon dioxide (CO2e) and 29.6% sulfur dioxide (SO2E). Conversely, the proposed DES emits an overall 1215.90 kg/kWh GHG emission comprising 70.4% carbon dioxide (CO2e) and 29.6% sulfur dioxide (SO2E). Summarily, the DG-exclusive system propagates about 4124.9 kg GHGe (77.23%) more than the proposed DES. The high level of GHGe released poses great environmental consequence to the climatic atmospehric condition, which can endanger both human and animal lifespan.

6. Conclusions

The current paper primarily focuses on the optimal design and energy management technique of an off-grid DES configuration comprising of multi-energy generators for reliable supply to dynamic daily energy demand of a typical remote community. The paper formulates multi-objective cost function as a convex MINLP aimed at minimizing fuel consumption and emission costs through the maximization of RES power generators in the DES, while reliably satisfying load demand requirement, as well as meeting a set of operational constraints and system parameters. The MINLP technique efficiently regulates optimal active power flow schedule to minimize operational cost and achieve fast convergence speed. To prevent premature degradation in charge capacity of the BSS during usage, RCA was employed to accurately determine the number of charge/discharge cycles and monitor its health or performance status. Performance of the MINLP energy management technique was tested under a typical community daily load demand profile. The simulation results of the current study show that the exploited MINLP technique is efficient at minimizing both operational and emission costs, with 71.53% and 22.76% reductions, respectively, for the residential community load scenario in contrast to the exclusive DG system. Future research is expected to focus on overall incorporation of uncertainties synonymous with RERs into DES formulations.

Author Contributions

A.Z.O.: conceptualization, investigation, methodology, validation, software, visualization, writing—original draft, data curation, formal analysis, writing—review and editing, resources; J.L.M.: supervision, writing—review and editing, project administration, data curation, resources, funding acquisition; A.A.Y.: supervision, writing—review and editing, data curation, project administration, resources. All authors have read and agreed to the published version of the manuscript.

Funding

This research received no external funding.

Data Availability Statement

The article includes the original contributions made and presented in the study. The corresponding author should be contacted for further inquiries.

Acknowledgments

The authors acknowledge the support received from Tshwane University of Technology, South Africa.

Conflicts of Interest

The authors affirm that there is no potential dispute regarding the authorship and findings of this paper.

Nomenclature an Interpretation

SymbolInterpretation
A S Swept area of the rotor blade
BSSBattery storage system
β Blade pitch angle
C P Power coefficient of the wind turbine
DESDistributed energy system
D G G H G DG GHG emission
DGDiesel generator
E F S O 2 / E F C O 2 / E F N O 2 Emission factor of carbon, sulphur and nitrate oxides
E N o m Nominal energy capacity
F C D G Total diesel fuel consumption
GHGGreenhouse gas
H w Total water head
MINLPMixed integer nonlinear programming
NOCTNormal operating cell temperature
NPVNumber of panels
η C / η D charge and discharge efficiencies of BSS
η c o n v Conversion efficiency (per unit) of the turbine
n i / m i / p i Cost coefficients of DG (specified by the manufacturer)
λ Tip speed ratio
Tref,Reference temperature
T C Temperature of the photovoltaic panel
TaAmbient temperature
RERsRenewable energy resources
RESsRenewable energy systems
R Solar radiation
RrefReference solar radiation
RFRenewable Factor
S o C B S S τ Initial (predefined) state of charge of BSS
S o C B S S n + 1 Current state of charge of BSS
U w wind speed (m/s) of the WTG
γ Air density
γ r water flow rate of MHPS
P R ,   p v Rated power of the PV module
  P p v τ Generated power by the photovoltaic system
P W τ Wind turbine power
P W T G τ Mechanical output power of wind turbine or generator
P W T ,     R a t e d τ Rated electrical power of wind turbine
P L a v Average power of load profile
P W T a v Average power of the wind turbine
P D G Real power supplied by the DG
ρ w Water density
P d i s τ discharge power during discharging activity
P i n j τ Injected/conserved power during charging activity
Q D G τ Reactive powers supplied by the DG
τ Discrete time horizon
α g Acceleration due to gravity
σ rated power factor (phase angle) of diesel generator
ψ b l a d e Rotational speed of rotor blade
R b l a d e Radius of rotor blade
U w real-time wind speed
U r Rated speed of wind generator
  U c i n cut-in speed of wind generator
U c o cut-in speed of wind turbine
WGwind generator
WASAWind Atlas for South Africa
ESKOMElectricity Supply Commission, South Africa
HOMERHybrid Optimization of Multiple Energy Resources

Appendix A

Table A1. Typical residential summer load profiles (kWh) in Pretoria, South Africa.
Time IntervalWeekdays Load ProfilesWeekends Load Profiles Average   Load   ( μ ) STd _ Profile   ( σ ) Aggregate Households Load Profile Normalized Load Profile
House 1House 2House 3House 1House 2House 3
0:00–1:000.540.571.030.540.571.010.710.2642.3720.16
1:00–2:000.540.571.010.540.571.010.710.2642.3761.37
2:00–3:000.550.671.090.550.591.030.720.2743.4438.37
3:00–4:000.560.671.110.550.581.090.740.3044.4054.34
4:00–5:000.590.831.140.550.651.110.770.3046.2033.09
5:00–6:000.861.202.290.670.762.081.170.7970.2078.88
6:00–7:001.161.573.141.201.573.141.971.03118.22153.45
7:00–8:001.401.854.562.402.414.563.121.24187.42283.56
8:00–9:002.031.893.711.931.893.512.440.92146.66214.21
9:00–10:001.821.662.721.221.252.321.600.6395.8077.73
10:00–11:001.301.212.831.161.022.131.440.6086.2083.26
11:00–12:001.300.992.811.100.862.11.350.6681.20135.25
12:00–13:001.260.922.841.210.812.181.400.7084.0063.68
13:00–14:001.260.862.791.561.352.811.910.79114.4080.63
14:00–15:001.180.882.991.731.723.82.421.20145.00114.74
15:00–16:001.191.192.841.191.192.841.740.95104.4084.61
16:00–17:002.001.403.12.001.863.12.320.68139.16168.03
17:00–18:002.153.534.692.152.214.693.021.45180.96141.78
18:00–19:002.534.195.682.904.195.684.261.39255.44303.97
19:00–20:003.454.776.683.454.776.684.971.62298.05306.06
20:00–21:002.753.835.222.753.835.223.931.24235.90349.07
21:00–22:002.712.974.422.532.974.423.310.99198.30193.17
22:00–23:001.532.183.371.432.183.372.330.98139.71120.80
23:00–24:001.371.102.321.071.102.321.500.7189.8450.55

References

  1. Obaro, A.Z. Energy Dispatch of Decentralized Hybrid Power System. Int. J. Renew. Energy Res. 2018, 8, 2131–2145. [Google Scholar]
  2. Zheng, W.; Zhu, J.; Luo, Q. Distributed dispatch of integrated electricity-heat systems with variable mass flow. IEEE Trans. Smart Grid 2022. [Google Scholar] [CrossRef]
  3. Cao, J.; Du, W.; Wang, H.; McCulloch, M. Optimal sizing and control strategies for hybrid storage system as limited by grid frequency deviations. IEEE Trans. Power Syst. 2018, 33, 5486–5495. [Google Scholar] [CrossRef]
  4. Pavankumar, Y.; Kollu, R.; Debnath, S. Multi-objective optimization of photovoltaic/wind/biomass/battery-based grid-integrated hybrid renewable energy system. IET Renew. Power Gener. 2021, 15, 1528–1541. [Google Scholar] [CrossRef]
  5. Gou, X.; Chen, Q.; Sun, Y.; Ma, H.; Li, B.-J. Holistic analysis and optimization of distributed energy system considering different transport characteristics of multi-energy and component efficiency variation. Energy 2021, 228, 120586. [Google Scholar] [CrossRef]
  6. Liu, Z.; Guo, J.; Wu, D.; Fan, G.; Zhang, S.; Yang, X.; Ge, H. Two-phase collaborative optimization and operation strategy for a new distributed energy system that combines multi-energy storage for a nearly zero energy community. Energy Convers. Manag. 2021, 230, 113800. [Google Scholar] [CrossRef]
  7. Boqtob, O.; El Moussaoui, H.; El Markhi, H.; Lamhamdi, T. Energy Scheduling of Isolated Microgrid with Battery Degradation Cost using Hybrid Particle Swarm Optimization with Sine Cosine Acceleration Coefficients. Int. J. Renew. Energy Res. 2020, 10, 704–715. [Google Scholar]
  8. Guo, Y.; Gao, H.; Wu, Q.; Østergaard, J.; Yu, D.; Shahidehpour, M. Distributed coordinated active and reactive power control of wind farms based on model predictive control. Int. J. Electr. Power Energy Syst. 2019, 104, 78–88. [Google Scholar] [CrossRef] [Green Version]
  9. Parisio, A.; Rikos, E.; Glielmo, L. A model predictive control approach to microgrid operation optimization. IEEE Trans. Control Syst. Technol. 2014, 22, 1813–1827. [Google Scholar] [CrossRef]
  10. Longo, M.; Roscia, M.; Lazaroiu, G.C.; Pagano, M. Analysis of sustainable and competitive energy system. In Proceedings of the 2014 International Conference on Renewable Energy Research and Application (ICRERA), Milwaukee, WI, USA, 19–22 October 2014; pp. 80–86. [Google Scholar]
  11. Shi, W.; Xie, X.; Chu, C.-C.; Gadh, R. Distributed optimal energy management in microgrids. IEEE Trans. Smart Grid 2014, 6, 1137–1146. [Google Scholar] [CrossRef]
  12. Gazijahani, F.S.; Ravadanegh, S.N.; Salehi, J. Stochastic multi-objective model for optimal energy exchange optimization of networked microgrids with presence of renewable generation under risk-based strategies. ISA Trans. 2018, 73, 100–111. [Google Scholar] [CrossRef] [PubMed]
  13. Lin, W.; Bitar, E. Decentralized stochastic control of distributed energy resources. IEEE Trans. Power Syst. 2018, 33, 888–900. [Google Scholar] [CrossRef]
  14. Bari, Z.; Yakhlef, M. Ben A MAS based energy-coordination for decentralized control of the hybrid electrical system. In Proceedings of the 2017 Intelligent Systems and Computer Vision (ISCV), Fez, Morocco, 17–19 April 2017; pp. 1–6. [Google Scholar]
  15. Moradi, H.; Esfahanian, M.; Abtahi, A.; Zilouchian, A. Optimization and energy management of a standalone hybrid microgrid in the presence of battery storage system. Energy 2018, 147, 226–238. [Google Scholar] [CrossRef]
  16. Tungadio, D.H.; Bansal, R.C.; Siti, M.W. Optimal control of active power of two micro-grids interconnected with two AC tie-lines. Electr. Power Components Syst. 2017, 45, 2188–2199. [Google Scholar] [CrossRef]
  17. Patibandla, A.; Kollu, R.; Rayapudi, S.R.; Manyala, R.R. A multi-objective approach for the optimal design of a standalone hybrid renewable energy system. Int. J. Energy Res. 2021, 45, 18121–18148. [Google Scholar] [CrossRef]
  18. Abd-Elazim, S.M.; Ali, E.S. Load frequency controller design of a two-area system composing of PV grid and thermal generator via firefly algorithm. Neural Comput. Appl. 2018, 30, 607–616. [Google Scholar] [CrossRef]
  19. Sichilalu, S.; Wamalwa, F.; Akinlabi, E.T. Optimal control of wind-hydrokinetic pumpback hydropower plant constrained with ecological water flows. Renew. energy 2019, 138, 54–69. [Google Scholar] [CrossRef]
  20. Alipour, M.; Zare, K.; Abapour, M. MINLP probabilistic scheduling model for demand response programs integrated energy hubs. IEEE Trans. Ind. Inform. 2018, 14, 79–88. [Google Scholar] [CrossRef]
  21. Dosoglu, M.K.; Guvenc, U.; Duman, S.; Sonmez, Y.; Kahraman, H.T. Symbiotic organisms search optimization algorithm for economic/emission dispatch problem in power systems. Neural Comput. Appl. 2018, 29, 721–737. [Google Scholar] [CrossRef]
  22. Pulluri, H.; Naresh, R.; Sharma, V. A solution network based on stud krill herd algorithm for optimal power flow problems. Soft Comput. 2018, 22, 159–176. [Google Scholar] [CrossRef]
  23. Li, F.; Liu, D.; Qin, B.; Sun, K.; Wang, D.; Liang, H.; Zhang, C.; Tao, T. Multi-Objective Energy Optimal Scheduling of Multiple Pulsed Loads in Isolated Power Systems. Sustainability 2022, 14, 16021. [Google Scholar] [CrossRef]
  24. Bilal, M.; Shahzad, M.; Arif, M.; Ullah, B.; Hisham, S.B.; Ali, S.S.A. Annual Cost and Loss Minimization in a Radial Distribution Network by Capacitor Allocation Using PSO. Appl. Sci. 2021, 11, 11840. [Google Scholar] [CrossRef]
  25. Shahzad, M.; Akram, W.; Arif, M.; Khan, U.; Ullah, B. Optimal siting and sizing of distributed generators by strawberry plant propagation algorithm. Energies 2021, 14, 1744. [Google Scholar] [CrossRef]
  26. Shahzad, M.; Qadir, A.; Ullah, N.; Mahmood, Z.; Saad, N.M.; Ali, S.S.A. Optimization of On-Grid Hybrid Renewable Energy System: A Case Study on Azad Jammu and Kashmir. Sustainability 2022, 14, 5757. [Google Scholar] [CrossRef]
  27. Odou, O.D.T.; Bhandari, R.; Adamou, R. Hybrid off-grid renewable power system for sustainable rural electrification in Benin. Renew. Energy 2020, 145, 1266–1279. [Google Scholar] [CrossRef]
  28. Kumar, A.; Zaman, M.; Goel, N.; Goel, N.; Church, R. In search of an optimization tool for renewable energy resources: Homer vs. in-house model. In Proceedings of the 2013 IEEE Electrical Power & Energy Conference, Halifax, NS, Canada, 21–23 August 2013; pp. 1–7. [Google Scholar]
  29. Databank World Development Indicator. Washington DC, United States. Available online: https://www.c2es.org/content/international-emissions/ (accessed on 20 November 2022).
  30. Zhang, G.; Wu, B.; Maleki, A.; Zhang, W. Simulated annealing-chaotic search algorithm based optimization of reverse osmosis hybrid desalination system driven by wind and solar energies. Sol. Energy 2018, 173, 964–975. [Google Scholar] [CrossRef]
  31. Ismail, M.S.; Moghavvemi, M.; Mahlia, T.M.I. Techno-economic analysis of an optimized photovoltaic and diesel generator hybrid power system for remote houses in a tropical climate. Energy Convers. Manag. 2013, 69, 163–173. [Google Scholar] [CrossRef]
  32. Boumaaraf, B.; Touafek, K.; Ait-cheikh, M.S.; Slimani, M.E.A. Comparison of electrical and thermal performance evaluation of a classical PV generator and a water glazed hybrid photovoltaic-thermal collector. Math. Comput. Simul. 2020, 167, 176–193. [Google Scholar] [CrossRef]
  33. Dhundhara, S.; Verma, Y.P. Application of micro pump hydro energy storage for reliable operation of microgrid system. IET Renew. Power Gener. 2020, 14, 1368–1378. [Google Scholar] [CrossRef]
  34. Michael, P.A.; Jawahar, C.P. Design of 15 kW Micro Hydro Power Plant for Rural Electrification at Valara. Energy Procedia 2017, 117, 163–171. [Google Scholar] [CrossRef]
  35. Khan, I.; Li, Z.; Xu, Y.; Gu, W. Distributed control algorithm for optimal reactive power control in power grids. Int. J. Electr. Power Energy Syst. 2016, 83, 505–513. [Google Scholar] [CrossRef]
  36. Obaro, A.Z.; Munda, J.L.; Siti, M.W. Optimal Energy Management of an Autonomous Hybrid Energy System. In Proceedings of the 2018 IEEE 7th International Conference on Power and Energy (PECon), Kuala Lumpur, Malaysia, 3–4 December 2018; pp. 316–321. [Google Scholar]
  37. Mokheimer, E.M.A.; Al-Sharafi, A.; Habib, M.A.; Alzaharnah, I. A new study for hybrid PV/wind off-grid power generation systems with the comparison of results from homer. Int. J. Green Energy 2015, 12, 526–542. [Google Scholar] [CrossRef]
  38. Hannan, M.A.; Abdolrasol, M.G.M.; Faisal, M.; Ker, P.J.; Begum, R.A.; Hussain, A. Binary particle swarm optimization for scheduling MG integrated virtual power plant toward energy saving. IEEE Access 2019, 7, 107937–107951. [Google Scholar] [CrossRef]
  39. Jakhrani, A.Q.; Rigit, A.R.H.; Othman, A.-K.; Samo, S.R.; Kamboh, S.A. Estimation of carbon footprints from diesel generator emissions. In Proceedings of the 2012 International Conference on Green and Ubiquitous Technology, Bandung, Indonesia, 7–8 July 2012; pp. 78–81. [Google Scholar]
  40. Allison, C. Climate Resilience Assessment for the 1 200 MW Thabametsi Coal-Fired Power Station in Lephalale, Centre for Environmental Rights, Limpopo Province, South Africa. 2017. Available online: https://cer.org.za/wp-content/uploads/2018/04/Annexure-C-Climate-Resilience-Assessment-Report.pdf (accessed on 20 November 2022).
  41. Rippon, S.; Design, B. University of Cape Town Carbon Footprint Report 2013. Cape T. Univ. Cape T. 2014. Available online: https://uct.ac.za/sites/default/files/content_migration/uct_ac_za/39/files/UCT_Carbon_Footprint_Report_2014.pdf (accessed on 20 November 2022).
  42. Spalding-Fecher, R. What is the carbon emission factor for the South African electricity grid? J. Energy S. Afr. 2011, 22, 8–14. [Google Scholar] [CrossRef]
  43. Hossain, M.A.; Pota, H.R.; Squartini, S.; Zaman, F.; Muttaqi, K.M. Energy management of community microgrids considering degradation cost of battery. J. Energy Storage 2019, 22, 257–269. [Google Scholar] [CrossRef]
  44. Hoke, A.; Brissette, A.; Smith, K.; Pratt, A.; Maksimovic, D. Accounting for lithium-ion battery degradation in electric vehicle charging optimization. IEEE J. Emerg. Sel. Top. Power Electron. 2014, 2, 691–700. [Google Scholar] [CrossRef]
  45. Belotti, P.; Kirches, C.; Leyffer, S.; Linderoth, J.; Luedtke, J.; Mahajan, A. Mixed-integer nonlinear optimization. Acta Numer. 2013, 22, 1–131. [Google Scholar] [CrossRef] [Green Version]
  46. Dragičević, T.; Pandžić, H.; Škrlec, D.; Kuzle, I.; Guerrero, J.M.; Kirschen, D.S. Capacity optimization of renewable energy sources and battery storage in an autonomous telecommunication facility. IEEE Trans. Sustain. Energy 2014, 5, 1367–1378. [Google Scholar] [CrossRef] [Green Version]
  47. Loew, S.; Anand, A.; Szabo, A. Economic model predictive control of Li-ion battery cyclic aging via online rainflow-analysis. Energy Storage 2021, 3, e228. [Google Scholar] [CrossRef]
  48. Anand, A.; Loew, S.; Bottasso, C.L. Economic control of hybrid energy systems composed of wind turbine and battery. In Proceedings of the 2021 European Control Conference (ECC), Delft, The Netherlands, 29 June–2 July 2021; pp. 2565–2572. [Google Scholar]
  49. Fallahifar, R.; Kalantar, M. Optimal planning of lithium ion battery energy storage for microgrid applications: Considering capacity degradation. J. Energy Storage 2023, 57, 106103. [Google Scholar] [CrossRef]
  50. Zahar, A. The Polluter Pays Principle and its Ascendancy in Climate Change Law. Natl. Taipei Univ. Law Rev. 2020, 114, 129–180. [Google Scholar]
  51. Mintz-Woo, K.; Leroux, J. What do climate change winners owe, and to whom? Econ. Philos. 2021, 37, 462–483. [Google Scholar] [CrossRef]
  52. Khan, M.R. Polluter-Pays-principle: The cardinal instrument for addressing climate change. Laws 2015, 4, 638–653. [Google Scholar] [CrossRef]
  53. Pinto-Bazurco, J.F. How to Enforce the Polluter-Pays Principle; International Institute for Sustainable Development: Winnipeg, MB, Canada, 2022; Available online: https://www.iisd.org/articles/polluter-pays-principle (accessed on 20 November 2022).
  54. Pill, M. Towards a funding mechanism for loss and damage from climate change impacts. Clim. Risk Manag. 2022, 35, 100391. [Google Scholar] [CrossRef]
  55. Barresi, P.A. The polluter pays principle as an instrument of municipal and global environmental governance in climate change mitigation law: Lessons from China, India, and the United States. Clim. Law 2020, 10, 50–93. [Google Scholar] [CrossRef]
  56. South African Revenue Service, (SARS) A Report on Environmental-Levy-Products. 2021. Available online: https://www.sars.gov.za/customs-and-excise/excise/environmental-levy-products/carbon-tax/ (accessed on 7 July 2022).
Figure 1. Per capita CO2 emission in South Africa.
Energies 16 00693 g001
Figure 2. Fossil fuel consumption CO2 emission in South Africa.
Energies 16 00693 g002
Figure 3. A network structure of the proposed distributed energy system.
Energies 16 00693 g003
Figure 4. A real-time daily solar radiation and ambient temperature data on a typical summer day in Pretoria.
Energies 16 00693 g004
Figure 5. A typical 24 h daily wind speed in Pretoria.
Energies 16 00693 g005
Figure 6. Characteristic curve of wind speed against mechanical output power for the studied WT [33].
Energies 16 00693 g006
Figure 7. Flow chart of the proposed MINLP optimization technique for the energy management of the DES.
Energies 16 00693 g007
Figure 8. Daily household electricity consumption variation curve for three different households’ daily load profiles during weekdays and weekends in Pretoria. Corresponding color names: blue, orange, purple, teal, green, magenta, red.
Energies 16 00693 g008
Figure 9. An aggregate daily energy demand profile of a typical remote community.
Energies 16 00693 g009
Figure 10. Power production of renewable-based multi-energy sources.
Energies 16 00693 g010
Figure 11. Analysis of power generation by DG power supply and operational efficiency.
Energies 16 00693 g011
Figure 12. State of energy of the BSS for the DES model.
Energies 16 00693 g012
Figure 13. Estimation of charge–discharge cycle extraction of the BSS using state of charge profile.
Energies 16 00693 g013
Figure 14. Actual energy contribution to load demand profile by individual power sources.
Energies 16 00693 g014
Figure 15. Net power provided by each energy source to the load profile under MINLP.
Energies 16 00693 g015
Figure 16. Comparison of greenhouse gas emission for the exclusive DG system and DES configuration.
Energies 16 00693 g016
Table 1. Simulation technical specifications.
ParametersSymbolValueUnit
Simulation duration N τ 24hours
Sampling time τ 30minutes
Wind turbine generator parameters
Rated power of turbine P W T ,     R a t e d 400kW
Swept area of the rotor blade A S 1.735 km 2
Air density γ 1.25 kg / m 3
Rotational speed of blade ψ b l a d e   3.14 rad/s
Radius of blade R b l a d e 13.3 m
Pitch angle of blade β Degree (o)
Rated speed U r m
Cut-in speed U i n m
Cut-out speed U o u t m
Battery storage system parameters
Nominal capacity of battery E N o m 80kWh
Nominal voltageV52V
Current CapacityAh1600Ah
Depth of dischargeDOD80%
Charge/Discharge efficiencies η C / η D 90/60Dimensionless
Minimum state of charge S o C B S S m i n 30%
Initial state of charge S o C B S S 0 40%
Maximum state of charge S o C B S S m a x 95%
Capital cost (excluding installation cost) C s 4316.13kWh
Photovoltaic cell parameters
Rated power of the cell P R ,   p v 20kW
Reference solar radiationRref1000W/m2
Reference temperatureTref25°C
Temperature coefficientNT−3.7 × 10⁻³°C−1
Normal operating cell temperatureNOCT20°C
Sum of PV panels interlinked in seriesNs12Dimensionless
Sum of PV cells interlinked in parallelNp8Dimensionless
Diesel Generator parameters
Cost Coefficientsa, b, c0.01840, 0.2088, 0.433L/kWh
Rated power capacity P D G R a t e d 1000kW
Power factorpf0.85Dimensionless
Diesel cost (price) C D 1.12USD/L
Emission factors E F S O 2 / E F C O 2 0.4/0.951(kg/L)
Micro-hydro power parameters
Water flow rate Q r m3/s
Total or net water head H w 10m
Overall energy conversion efficiency of turbine η c o n v 60%
Water density ρ w 1000kg/m3
Gravitational acceleration α g 9.81m/s2
Table 2. Daily operational and emission cost analysis of the DES model under study.
ModesFuel Consumption (L)Diesel Consumption Cost (USD)GHG Emission (kg/kWh)GHG Emission Cost (USD)Total Cost (Fuel Cost + GHG Emission Cost)REF (%)Convergence Speed (Seconds)
DG Exclusive System1156.101780.265340.8048.601828.8606.09
Proposed DES330.93509.631215.9011.06520.6971.539.97
Savings in incurred cost825.171270.634124.9037.541308.1771.533.88
Disclaimer/Publisher’s Note: The statements, opinions and data contained in all publications are solely those of the individual author(s) and contributor(s) and not of MDPI and/or the editor(s). MDPI and/or the editor(s) disclaim responsibility for any injury to people or property resulting from any ideas, methods, instructions or products referred to in the content.