Abstract
Renewable energy sources are an attractive alternative to fossil fuels for several reasons. Firstly, these are ecological arguments, mainly reducing greenhouse gas emissions. Secondly, there are legal issues, particularly the obligations of the European Community countries in the field of climate as part of the implementation of the European Green Deal and the joint achievement of 40% of energy from renewable sources by 2030. Thirdly, these are international issues, primarily regarding reducing dependence on uncertain oil or gas markets. And finally, they may be economic reasons, such as diversification of energy supplies and associated costs, as well as opportunities for profits on the capital market. In Poland, over the last decade, a certain kind of boom in photovoltaics has been visible, both in terms of the number of companies dealing with solar collectors, as well as the annual increase in new capacity, or the level of installed capacity. Also, on the Warsaw Stock Exchange, photovoltaic companies have introduced much confusion in the tier of quotations in recent years. Solar energy has become a kind of gateway for companies to increase their results, stock exchange quotations, or acquire new customers. It is not surprising that more and more investors want to invest their money in this segment. Given the above, this article attempts to answer the question: Is there a risk of a stock market bubble among photovoltaic companies in the near future? For this purpose, we used the financial indicators of photovoltaic companies listed on the Warsaw Stock Exchange, and with the help of the Taxonomic Measure of Attractiveness of Investments, we created rankings of the investment attractiveness of these companies in 2017-2019. The leaders include companies listed on the main market as well as in the alternative trading system of the Warsaw Stock Exchange. It should be borne in mind that regardless of the undertaken diversification and analytical activities, the risk of an investment bubble has been and will remain an indispensable element in the functioning of every capital market in the world.
1. Introduction
Investing in the financial market is a complex mechanism that is accompanied by selecting and ranking securities listed on a regulated market or in the formula of an alternative trading system outside this market. One of the methods of selecting companies for the portfolio is to conduct a fundamental and technical analysis of the company before its acquisition. These analyzes can run through the prism of many different financial indicators, which can be used to characterize individual areas of the company’s operations, such as liquidity, profitability, indebtedness, or operational efficiency. Undoubtedly, the financial statements are, in this case, an invaluable source of information about the financial situation of a given company. In order to determine the financial condition of the entity, the investor, at the very beginning, uses a system of measures in the form of various financial indicators, which in practice, are grouped according to a pattern of similar economic content. The classic parceling of financial indicators describing the financial condition of an enterprise is also supplemented by, inter alia, capital market indicators allowing for the assessment of the attractiveness of investing in entities or even entire industries listed on the capital market.
An upward trend in the value of companies and share prices of entities dealing with broadly understood renewable energy is visible in the world—however, the boom mainly affects photovoltaic companies (PV) and wind turbine producers. As indicated by the director of CMC Markets for Eastern Europe, in 2019–2020, the basket of shares of such companies increased its value by several dozen or even several hundred percent. The governments of other countries announce the abandonment of traditional energy sources in favor of creating new solar, wind, and water farms. At the same time, investing in renewable energy companies has recently become very fashionable in all parts of the world, and hence the likelihood of stock market speculation is also increasing. In addition to market risk, political changes should also be taken into account, for example, regarding delays in the green transformation of the European Union due to the economic effects of the recent coronavirus pandemic. On the other hand, according to Goldman Sachs analysts, companies from the green energy sector may turn out to be one of the most significant investment opportunities of the coming decade.
However, history has shown that excessively high profits and sudden increases in stock prices in one industry can quickly turn into an artificially inflated bubble which, under the influence of further speculation, will eventually burst, resulting in enormous financial losses. The photovoltaic sector, thus dealing with the conversion of sunlight into electricity, is one of the fastest-growing renewable energy sectors in Poland and in the world. The photovoltaic market in Poland has enormous, but so far still highly unused, potential for development. No wonder the popularity of the subject of renewable sources is also growing on the Warsaw Stock Exchange (WSE), where listed photovoltaic companies are valued with increasingly higher premiums from year to year. Therefore, this article aims to compare the condition of photovoltaic companies listed on the Polish stock market by building their rankings for 2017–2019. We are using the Taxonomic Measure of Attractiveness of Investments (TMAI) to assess further investment prospects in the renewable energy sector. In view of the main goal formulated in this way, the article attempts to answer the question: Is there a risk of a stock market bubble among photovoltaic companies in the near future?
2. The Biggest Speculative Bubbles—A Historical Outline
Contemporary market-regulated economies are undoubtedly accompanied by the cyclical nature of their development. The natural consequence of the growth of economies is an increase in their level of complexity. Moreover, as historical experience shows, the recurring crises are becoming more and more felt on a global scale, and a more diverse form characterizes their causes. Crises break out suddenly, but they are the result of phenomena, including speculative bubbles, which build up over an extended period of time in a favorable economic phase.
According to dictionary definitions [1,2], a speculative bubble occurs when the value of assets within a specific industry, commodity, or asset class spikes to an unjustified level, driven by irrational speculative activity unsupported by any rational basis and information. Moreover, as emphasized by De Long et al. [3], speculative bubbles, as opposed to rational bubbles, are amplified by the reinforcement mechanisms used by investors who are seeing an upward trend succumb to investment fashion and environmental pressure, hoping to obtain an above-average rate of return on investment. Rational bubbles represent the actual difference between stock prices and the cumulative discounted value of future dividends. Their formation is not influenced by any speculative mechanisms [4]. Bubbles can be a profitable opportunity, although, in fact, most investors lose from them. Why is this happening? The reason is straightforward—speculative bubbles are hard to recognize. However, when someone succeeds, it is difficult to determine exactly when to sell the assets in order to gain as much as possible. As Rodrigue [5] points out, the development of bubbles (also known as mania) occurs in several stages (there is a Hidden Phase (also known as a Stealth), a Conscious Phase (also known as Awareness) Mania Phase, and Crash Phase (also known as a Blow-off) followed by the bursting of the speculative bubble), which is a phenomenon observed over the 500-year economic history. The best time to sell assets is at the end of the third phase [5]. Although each of the bubbles that have occurred so far had a different character, we can see certain regularities that were repeated in each of them. Stock exchanges are a frequent place of bubble formation. Investors saw a sudden upward trend in prices and bought stocks to obtain a quick profit, often ignoring the lack of price justification in the current financial results of companies [6]. Such speculative bubbles, however, do not last too long. Tiny bubbles affecting individual companies are part of the day-to-day functioning of the world’s capital market. In turn, really big bubbles happen rarely and remain in the memory for a long time, especially by investors who have lost their money. History knows many examples of speculative bubbles [7]—but the most important ones are The Dutch Tulip Bubble (1634–1637) [8,9], The South Sea Bubble (1711–1720) [10,11], Mississippi Bubble (1716–1720) [12,13], The Railway Mania (1845–1847) [14,15], Japan’s Real Estate and Stock Market Bubble (1986–1991) [16,17], The Dotcom Bubble (1995–2001) [18,19], The U.S. Housing Bubble (2007–2009) [20,21], and The Bitcoin Bubble (2016–2018) [22,23,24,25]. It should be emphasized at this point that some bubbles are more accessible to predict than others. In turn, in some situations, speculative bubbles are only detectable after they burst. When it comes to the stock market, traditional valuation measures can be used to identify extreme overvalues in a financial instrument.
The speculative bubble is a phenomenon that is identified with the process of unsustainable price growth of a self-perpetuating nature. Most often, it is associated with market hyperactivity, which is temporary, but as history shows, it can last up to several years. For many investors, a drastic drop in prices means a loss of value of the acquired resources or even bankruptcy. In the following years, many scientists [26,27,28,29,30] have attempted to determine the causes of bubbles in the stock market, and their consequences, visible in various areas. Girdzijauskas et al. [31] developed an approach to explain bubble formation based on the logistic growth model of encountering limited capital resources of various origins. In their study, they emphasize that, as a rule, it is difficult to precisely indicate which indicators are the causes and which are the consequences of a particular bubble. However, they are convinced that the emerging bubbles intensify inflationary processes in the economy. Ikeda and Shibata [32] also see the effect of bubbles on the dynamics of the exchange rate. In turn, Lachota [33] shows the impact of speculative financial bubbles on the real sphere of the economy.
On the other hand, when analyzing the causes of bubbles, more and more attention is paid to their behavioral background [34,35], especially the behavior of investors [19,36,37] or even the level of their moods [38,39,40]. Because of the increasing role of psychological aspects in the functioning of the market, Soros [41] formed a theory of maneuverability which assumes that there is a two-way relationship between perception and reality that can support the growth of a self-reinforcing and ultimately self-extinguishing wave of change. Thus, in his opinion, each bubble consists of a trend and misconception that interact with each other. The author of the concept argues that it is incorrect to assume that people who have access to information always behave rationally and make decisions based on the acquired knowledge. Based on his previous investment experience, he emphasizes that human behavior is governed by two interrelated elements: cognitive and manipulation functions. Maneuverability consists of the fact that expectations depend on the perception of the situation, and the case is shaped by the expectations of investors—often speculators. Both of these functions work in parallel, not sequentially. This means that people are changing the situation at the same time as they are watching it. This inevitably leads to further errors and difficulties in planning and making the right investment decisions [41]. Despite being aware of the existence of speculative bubbles, market participants have fallen into the trap for centuries, marginalizing that extremely profitable investments are related mainly to an irrational boom that will pass sooner or later.
As indicated above, speculative bubbles often start a recession. There is a well-known example of the subprime financial crisis of 2009, which was caused, among others, by the bubble in the American real estate market [42]. The growing financial credit and macroeconomic ties, or how investors perceive certain groups of countries, mean that turbulences originating in a given country’s market may extend to other economies, geographically distant or even seemingly unrelated to the place of the collapse [43,44]. The phenomenon of “spilling” the effects of the recession to other countries took place in the case of the above subprime crisis [45,46,47] or Dotcom Bubble [48,49]. Of course, the economic crisis itself has a negative impact on stock prices. The most famous economic crises resulted from inflated bubbles that eventually burst. The financial bubbles described above are selected examples of crises of this type in human history. They caused enormous financial losses and deprived relatively strong countries and their inhabitants of any hope for a better tomorrow. The mechanisms of financial crashes are very similar, no matter when and where they occur. They indicate the need for a rational assessment of the risks associated with investing.
Global capitalism has undeniably entered a new era. World trade is no longer governed by the logic of supply and demand and is replaced by panic and euphoric attacks followed by enormous waves of financial resources. In order to avoid the phenomenon related to the emergence and subsequent bursting of the bubble when buying securities, real estate, or other assets, investors should carefully check whether they are not overvalued. To reliably assess the prospects of a given listed company, investors should get to know not only the company itself but also the macroeconomic environment and the sector in which it operates. Determining the financial condition of companies in the investor’s interest is a mandatory element facilitating the comparison of potential listed objects.
3. The Situation of the Photovoltaic Market in Poland
Hypothetically, a person can survive without food for several weeks, without water for several days, but without air for only a few minutes. Could we live without electricity? It’s hard to say for sure. Indeed, life without electricity would mean paralysis, not only in the functioning of households but also in urban infrastructure, the Internet, or business operations. In many countries, electricity is generated in coal and lignite-fired power plants and combined heat and power plants. As a result of its combustion, energy is provided to millions of entities, but the side effect is the emission of vast amounts of CO2 and harmful chemicals into the atmosphere. And this is not a problem that can be postponed for years with impunity. Nature is being significantly destroyed, and the air we breathe is of increasingly poor quality. Renewable energy can solve these problems. Renewable energy sources (RES) have many advantages that make the ongoing energy transformation a necessity and a real benefit for the economy, society, and the environment. The energy potential from the sun often exceeds our energy needs. It is already considered one of the most valuable renewable sources that can be used by installing photovoltaic panels or collectors. Solar energy is a source of cheaper and clean electricity.
The International Energy Agency (IEA) forecasts that in the next two decades, globally, a decisive upward trend in solar energy generation capacity will be visible (see Figure 1). The dominant share of energy generated from conventional sources, such as coal or gas, is to be broken.
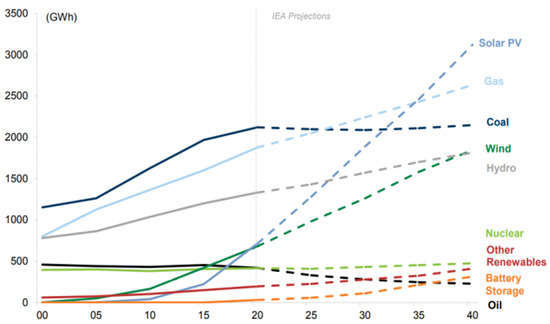
Figure 1.
Power generation capacity by a source according to IEA forecasts. Source: [50].
Changes in the structure of obtaining energy from traditional sources to renewable sources are desirable not only at the international level. However, they are also visible in an increasing number of countries—as many as 165 countries have formulated renewable energy targets or policies [51]. The energy transformation is the result of not only individual activities and programs dedicated to this change but also results from extremely dynamic technological changes and, thus, the efforts to reduce carbon dioxide emissions. This state of affairs is confirmed by the results of the share of individual sources in energy generation—in the last decade; there has been a global increase in the share of renewable sources by eight percentage points, which took place in the field of solar and wind energy [51]. Therefore, entities operating in these industries will be required to expand further and undertake various activities in producing, distributing, and promoting of green energy. Therefore, it should be assumed that some of these entities will again or, for the first time, use an additional investment financing source, the stock market.
As one of the leading forms of renewable energy sources, photovoltaics significantly contributes to a breakthrough in many countries that begins or continues their energy transformation. In Poland, PV is the main area of investment in renewable energy and the entire power industry. PV, as the only branch of RES, was able, according to the Polish Institute for Renewable Energy (IRE), to mobilize more capital for investments in 2019–2020 than the entire conventional energy sector [52]. Moreover, as indicated by the Central Statistical Office, in 2016-2020, the share of energy from renewable sources in total primary energy increased from 13.76% to 21.59% [53]. In the RES sector, photovoltaics ranks first with 52% of installed capacity—in November 2021, it overtook wind farms for the first time, which account for 37% of installed capacity in Poland. The remaining percentage of the installed RES capacity in Poland is obtained from hydroelectric power plants (5%), biomass (5%), and biogas (1%) [53]. The Energy Regulatory Office in Poland (ERO) keeps statistics on the number of renewable energy installations created, their capacity, and the amount of electricity generated from RES and confirmed by issued certificates of origin. According to ERO, at the end of 2021, there was an increase in the number of renewable energy installations by as much as 65% compared to the data at the end of 2017. Importantly, in the case of only photovoltaic installations in the last five years, there has been a more than fourfold increase in their number [54]. Table 1 below presents a cross-section of installed and generated capacity structures thanks to renewable sources in the world in Europe and Poland.

Table 1.
Renewable energy sources—a compilation of statistical data.
The presented records for Total Renewable Energy, both in terms of installed capacity and energy generation, show a growing trend in 2017–2021 for the world, Europe and Poland. Analyzing the calculated year-on-year dynamics ratio, it is clear that the increase in installed capacity in global terms oscillated around 10%; for Europe, it was in the range of 5–7%, and the largest changes were visible for Poland, where the last two years the 30%. However, despite the annually increasing levels of installed capacity and the level of energy produced from renewable sources in total for Poland, the data on the share of RES in these categories compared to European values are not so satisfactory—the differences oscillate between 20–26 percentage points for installed capacity and between 18–22 percentage points for power generation. It is worth emphasizing that the directions of development of the renewable energy sector depend mainly on national and EU regulations, which were adopted and enforced relatively recently. In global and European statistics, the share of energy from photovoltaics in the installed capacity and produced solar energy is dominant and amounts to 97–99%—the rest is the thermal system. In the case of Poland, solar photovoltaics is responsible for 100% of the installed capacity and is generated by solar energy. It is worth emphasizing the dynamic growth in 2017–2021 from less than 300 to over 7.660 MW of photovoltaic installations in Poland and an almost twelve-fold increase in the level of energy production from photovoltaics over the last four years [55]. Taking into account the dynamics index in the analyzed period, the growing potential of photovoltaics in Poland is confirmed, which has reached three-digit values in the last four years. The surveyed countries recorded dynamics in the range of 20–30% year on year. In turn, for European countries, the change in the level of installed photovoltaic power did not exceed 20%.
In addition, as shown by the latest data from the Institute for Renewable Energy in Poland reports, the photovoltaic market is developing the fastest among all renewable energy sectors in this country. After the very good year 2020, in which the capacity increase amounted to 2.4 GW, the next year turned out to be even better. The annual increase in PV capacity amounted to as much as 3.7 GW, and the installed capacity at the end of 2021 reached 7.67 GW. Data from the end of the first quarter of 2022 indicate the achieved capacity at 9.4 GW. Almost 80% of the installed capacity is accounted for by prosumers, whose number in Poland is close to a million [52]. In 2021, Poland moved up from the fifth place it had a year earlier and was ranked second among the European Union countries in terms of the increase in installed PV capacity. As the government plenipotentiary for renewable energy sources predicts, in 2021 and 2022, there will be an investment boom in the PV farm sector when projects from three auctions are implemented. In 2022 and 2023, the share of PV farms in the total installed capacity will be equal to the share of micro-installations. The PV market will change from typically prosumer, as it is today, to more sustainable.
The total turnover of the Polish photovoltaic market in 2021 was estimated at PLN 16.7 billion, including the value of the market of capital expenditures alone of about PLN 15.4 billion. It is forecasted that in 2022 the trade turnover of photovoltaics will increase and amount to over PLN 20 billion, and the value of the PV investment market will be at the level of PLN 19 billion [52]. Currently, several thousand companies in Poland are dealing with producing and installing solar energy. The positive forecasts for the Polish photovoltaics segment are also confirmed by the leading companies in the industry that participated in the market research commissioned by PIRE. Their analyzes show that these entities are still planning rapid expansion, despite temporary difficulties caused by the COVID-19 pandemic. The most frequently indicated direction of development was a further increase in employment, executive capacity, expansion of activities, or the introduction of innovative offers in the form of, for example, photovoltaic tiles or energy storage [52]. IRE points out that the key events for the development of the PV market in Poland included: the lifting of the need to issue grid connection conditions for prosumers (2013), the announcement of the “Prosument” program (2014), a positive industry reaction to the adoption of the prosumer amendment with feed-in tariffs (2015) and the implementation of the “My Electricity” program with tax credits (2018), which is still being continued. In addition, in 2016, an auction system was introduced to replace the green certificate system, which was extended in line with the decision of the European Commission until the end of 2027. However, it is difficult to judge which of the above-mentioned instruments would give better results today [52].
4. Materials and Methods
The method of Hellwig’s economic development pattern [56] is used in this study. It is one of the methods of linear ordering that allows for determining the ranking of objects described by many diagnostic variables (features) aggregated into one synthetic variable, generally referred to as Hellwig’s economic development measure. One example of such a metric is the Taxonomic Measure of Investment Attractiveness (TMAI) used in this paper. This measure enables a comprehensive analysis of companies from the point of view of investment attractiveness and risk [57]. Therefore, TMAI was used to achieve the main goal of the work, which is to compare the condition of photovoltaic companies listed on the Warsaw Stock Exchange by building their rankings for investment attractiveness for 2017–2019.
The basis for constructing TMAI was the matrix of observation of diagnostic variables X = [xij], where any element xij (i = 1, …, n; j = 1, …, m) denotes the value of the variable Xj observed for the i-th object.
Diagnostic variables (called explanatory variables) were chosen based on substantive premises and the results of previous research on the use of TMAI in various sectors of economic activity [58,59,60,61,62,63].
Initially, 12 indicators relevant to making investment decisions were proposed for the study (Table 2). These were the indicators that characterize the most important aspects of the company’s operations, i.e., profitability (X1–X5), operational efficiency (X6–X9), liquidity (X10), and debt (X11 and X12) [64,65,66,67].
Table 2.
Initial set of diagnostic variables.
Subsequently, the initial set of explanatory variables was subjected to a two-stage selection procedure. The first stage aimed to eliminate quasi-constant variables, i.e., variables characterized by low variability and thus with low discriminatory power. To assess the level of variability of individual diagnostic variables, we used the absolute coefficient of variation (ACV) [69] determined by the formula:
where:
- —standard deviation of the variable
- —absolute value of the arithmetic mean of the variable
An acceptable value of the coefficient of variation was 10%, which meant that the variables satisfying the condition ACV < 10% were eliminated from the diagnostic variables.
The second step of the selection procedure was the elimination of collinearity between diagnostic variables. For this purpose, the inverted correlation matrix method was used [70]. The diagonal elements of this matrix, called variance inflation factor (VIF), measure the degree of collinearity between diagnostic variables. A high value of the VIF index indicates a high correlation between a given variable and other diagnostic variables and indicates that the model includes variables with a similar informative capacity (or variables that provide similar information about the analyzed phenomenon). In practice, VIF > 10 is considered to indicate the existence of multicollinearity [71,72]. Thus, according to the concept of the inverse matrix method, variables for which the VIF is greater than ten were removed from the set of diagnostic features.
The transformation of nominantes unified the finally determined set of explanatory variables into stimulants according to the following formula (the final set of diagnostic variables did not include any destimulants):
where:
- is the value of the variable observed for the i-th object,
- is the value of after stimulation,
- is the lower limit of the j-th variable’s tolerance interval,
- is the upper limit of the j-th variable’s tolerance interval.
The next step relied on achieving comparability of diagnostic variables by using standardization:
where and denote the arithmetic mean and standard deviation of the variable respectively.
A reference object (called development pattern) was established based on standardized diagnostic variables. It was the theoretical (non-authentic) object, that had the most favorable values from each of the variables. More precisely, the development pattern was taken as a vector in which j-th coordinates are the maximum observed value of the j-th normalized variable among all objects:
Then, for each of n analyzed objects the distance from the pattern was determined using the Euclidean distance formula:
where denote weights.
The study adopted a system of weights based on the coefficient of variation based on a statement that the variable with the highest variability has the highest discriminatory power and should be assigned a greater weight/importance:
where is the absolute coefficient of variation of , determined by the Formula (1).
After calculating the distance between all analyzed objects and the pattern, they were normalized according to the formula:
where denote the arithmetic mean and standard deviation of the variable defined by the Formula (5).
The synthetic development index determined by the Formula (7) is called the Taxonomic Measure of Investment Attractiveness (TMAI). This index is usually within the range from 0 to 1. The higher value of the synthetic measure, the higher similarity to the pattern, and the higher the level of investment attractiveness of a given object.
5. Results
The research covered companies operating in the renewable energy sector, which is 2017–2019 were listed on the main floor of the Warsaw Stock Exchange and the New Connect market (included in the eco-energy index). The study examines the financial data of companies for which PV was the main or additional area of activity. Out of 17 companies operating in the renewable energy sector between 2017 and 2019, only 11 companies met the above criteria and were selected for further analysis: 01Cyberaton SA (01C), Columbus Energy SA (CLS), ELQ SA (ELQ), Foto Volt Eko Energia SA (FVE), Novavis SA (NVV), Remor Solar Polska SA (RSP), Grodno SA (GRN), MDI Energia SA (MDI), ML System SA(MLS), Sunex SA (SNX) and TIM SA (TiM). The financial ratios used for the analysis come from the annual reports of the surveyed companies.
Twelve indicators were initially proposed for analysis of the investment attractiveness of PV companies with the use of TMAI). Next, the initial set of diagnostic variables was selected according to the statistical methods described in the methodological part of this paper. The data in Table 3 shows that all proposed diagnostic variables had high variability (all variables satisfied condition ACV > 10%); therefore, none of them were removed due to this criterion (see Section 4).
Table 3.
Descriptive statistics of diagnostic variables.
Subsequently, the potential set of explanatory variables was selected using the statistical methods described in the methodological part (see Section 4). All the initially proposed diagnostic variables were characterized by a high level of variability, which indicated their high discriminatory power and did not provide grounds for removing any of them due to this criterion. Consequently, the inverse matrix method was used to eliminate collinearities between variables. The results of this method are presented in Table 4.
Table 4.
Results of the reduction of variables by the inverse matrix method.
To ensure the comparability of TMAI from different periods, the same final set of explanatory variables was established for each year. Therefore, the variables that met the criteria in at least two analyzed years were selected for further analysis. Finally, a set of 8 diagnostic variables (6 stimulants and 2 nominants) was established to calculate of the synthetic index of investment attractiveness. The specificity of these variables is presented in Table 5.
Table 5.
The set of diagnostic features after reduction.
Based on the set of diagnostic variables specified in Table 4, the Taxonomic Measure of Investment Attractiveness was calculated for each of the surveyed companies in 2017–2019 (Table 6). This index was also used to make a ranking of PV companies in terms of investment attractiveness.
Table 6.
Ranking of companies based on the TMAI in 2017–2019.
Both the features of financial indicators and the rules for their interpretation make it easy to draw appropriate conclusions based on the results of the calculations. However, financial indicators are, in principle, simple measures; therefore, the conclusions of the analysis should not be obvious. The ratio analysis results are only a signal indicating that specific issues should be examined more thoroughly. This is undoubtedly a limitation of this article. Financial indicators only signal the possibility of specific problems with the enterprise’s financial condition [63]. As a rule, the applications relate to a narrow aspect of economic activity.
When analyzing the rankings of enterprises for all the surveyed years, it can be noticed that the most frequently the highest places are occupied by the following companies: MDI and CLC. The first company listed on the main market of the Warsaw Stock Exchange—MDI Energia Inc.—is a Warsaw construction company that operates in the renewable energy sector and specializes mainly in the implementation of wind farm projects and biogas plants. As an additional activity, they also provide services in the field of photovoltaic installations. In addition, the parallel entity builds housing estates complexes all over Poland. Since 2015, the company has been characterized by a perfect financial situation—net sales revenues remain stable, similarly at a similar level, despite the pandemic, and the company’s operating profits or book value per share remain. The most significant increase in the quotation of the company’s stock exchange was recorded in the second half of 2020, where at the turn of June and August, the share price increased by 106.9% in just a few days [76]. The specificity of the construction industry in which a given company operates and numerous investment projects implemented by this entity imply relatively low but stable and positive profitability ratios. It should be emphasized that the debt ratios and the company’s liquidity fluctuate in optimal ranges, coinciding with the average values set for a given industry.
The second leader in the ranking is Columbus Energy Inc., listed on New Connect. A Krakow company in which photovoltaics is the main activity. The company provides comprehensive services in the field of renewable energy installations. In addition to supplying photovoltaic installations, from 2020 also deals with the sale and assembly of heat pumps and energy storage. The company is systematically developing, as evidenced by the increase in the employment level from 11 people in 2016 to 835 people in 2021. Over the last five years, there has been a very dynamic increase in the level of net sales revenues and the accompanying level of operating profit. In view of the significant measures taken to develop the technologies used to manage distributed energy and electro-mobility, which constitute the essence of the implemented strategic changes, in 2021, the company recorded a relatively small loss in operating activities. However, as British entrepreneur Richard Branson repeats, “You will never have long-term success if the only reason you do something is profit.” It should be emphasized that CLC took first place in terms of its share in the professional market of photovoltaic micro-installations in Poland. So far, the company has already invested over PLN 500 million in green assets. In a similar period, there was a sharp jump in the prices of the company’s shares—in the third quarter of 2020 the increase was as high as 671.4% [76]. In the analyzed ranking of investment attractiveness, it took a stable second place. It owes its high result to growing profitability ratios, fast rotation of individual liabilities or receivables, and stable financial liquidity. Despite the growing tendency, the company’s overall debt ratio in 2017–2019 was within the designated optimal range for the renewable energy industry.
In the analyzed sample, two companies achieved slightly worse results: RSP and FVE—both of them are included in the Eco-energy index listed on New Connect, and for both of them, photovoltaics is their core business. Remor Solar Polska S.A., a micro-company from Recz (Poland), is one of the largest producers of assembly systems for solar panels. The company’s investment attractiveness is not the best in the analyzed period. Negative profitability ratios in the first two years, growing excess liquidity, and increasing receivables turnover largely reflect the last positions in the ranking. Noteworthy, however, is the stable and optimal level of the company’s overall debt ratio and the quite significant shortening of the liabilities rotation cycle. In 2019, the improvement of all the indicators, as mentioned earlier, is visible to such an extent that in the following years, it will achieve much better financial results and generate profits from operating activities. The increase in share prices between the second and third quarters of 2020 was not spectacular compared to the companies described above, as it amounted to 44% [76].
On the other hand, Foto Volt Eko Energia S.A., a Warsaw-based micro-company, deals with consulting, design, sale, assembly, and servicing of photovoltaic installations up to 50 kW. The first two of the three analyzed periods, despite the final positions in the TMAI ranking, were not the worst for the company. There was a stable level of asset turnover, an increasing price/operating profit ratio, and a decreasing turnover of both liabilities and receivables. As with RSP, FVE struggled with very high excess liquidity and low levels of the company’s overall debt. In 2019, the basic measures proving its attractiveness deteriorated drastically. Moreover, the company also recorded a loss this year. However, looking at the following year, the situation improved. In the same period of the stock exchange boom in the photovoltaic industry, the company recorded an increase in the value of the exchange rate by over 600% [76].
The created ranking also includes two extreme cases, i.e., the 01C company, which in 2017 took third place in the ranking, and in 2019 it closed the ranking, and the TiM company, which, in turn, advanced from the penultimate position in 2017 to the podium two years later. Such fluctuations may be related to the implemented business model, the time needed to reimburse the incurred costs of large development installations, the preparation of appropriate documentation, as in the case of 01Cyberaton Proenergy Inc., or the specificity of business activities related to the emerging challenges on a dynamic market. E-commerce, as was the case with TiM Inc. In the case of other photovoltaic companies distinguished in the TMAI ranking, their situation is relatively stable, confirmed by the liquidity, profitability, debt, and rotation ratios they achieve.
6. Discussion
The potential of renewable energy sources, including photovoltaics, has been noticed by investors in the Polish market and international markets (see the selected stock indices in Figure 2, Figure 3 and Figure 4). The valuations of many companies in this sector in just a few months in 2020 increased by tens or even hundreds of percent.
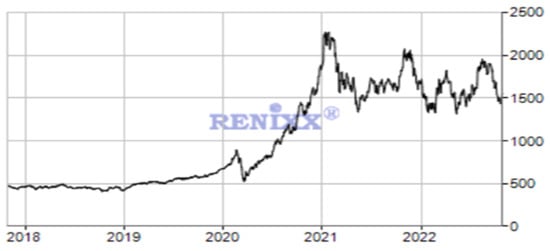
Figure 2.
Renewable Energy Industrial Index World: Five-years quotes. Source: [77].
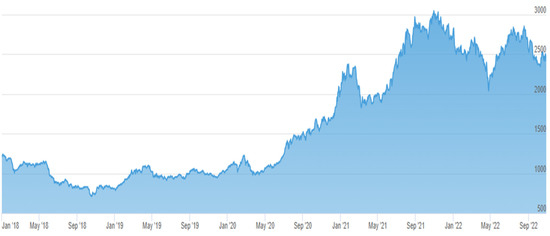
Figure 3.
Solactive China Clean Energy Index PR: five-years quotes. Source: [78].
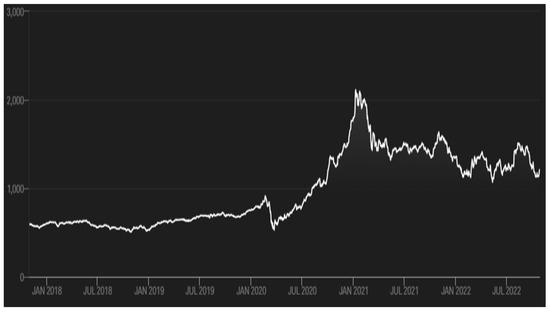
Figure 4.
S&P Global Clean Energy Index: five-year quotes. Source: [79].
The Renewable Energy Industrial Index for renewable energy tracks the 30 largest companies in the renewable energy industry worldwide by market capitalization. These are usually companies from the USA and Canada, but also include European companies (including France, Germany, Spain, and Denmark) and entities from China. The stocks listed in the RENIXX World cover a broad spectrum of activities, products, and services. For example, in the solar energy sector, RENIXX World contains companies such as manufacturers of PV-Cells and Modules, PV manufacturing equipment, supplier, project developers, or renewable energy utilities [77]. The last five years of the index can be divided into two periods: the first (2018–Q1 2020) was a relatively stable period, in which the quotations hovered around 500 points, and the second (Q2 2020–Q3 2022), in which the quotations, after significant initial increases, stabilized their level between 1500-2000 points (see Figure 2).
As part of the Solactive China Energy Index PR, listed companies are active in a Chinese clean energy factory. In 2022 due to the association of this industry and the desire to diversify, there was an increase in the commitment related to having funds to be carried out from 20 to 35. In addition, the index components will be selected using the RBICS sub-industry classification scheme instead of the FactSet industry matrix due to its greater detail to make the selection process more robust [78]. Similar fluctuations in the stock exchange rate in the last five years were also recorded in the Solactive China Clean Energy Index PR case. From the beginning of 2008 to mid-2020, the index value did not exceed 1300 points. In subsequent periods, noticeable growth spikes and relative stabilization of around 2500 points. In the fourth quarter of 2021, we managed to exceed the ceiling of 3000 points several times, but these were only single fluctuations (see Figure 3).
Another example of an index, this time from the American stock exchange, shows similar tendencies to perform admission activities. The S&P Global Clean Energy Index aims to measure the performance of companies in global clean energy companies in both developed and emerging markets, with a component target of 100 [79]. It is worth noting that among the Top 10 ingredients according to the weight of the index, in the case of most companies, these are entities whose main or additional activity is related to photovoltaics. Analyzing the country of origin of listed companies according to their weight in the index, nearly 60% of them are US and Chinese. Two Danish companies have less than 9% of the index share. In the case of other representatives of European countries (e.g., Portugal, Spain, Germany, Switzerland, Norway, France), American (e.g., Brazil), Asian (e.g., Japan, India, South Korea, Thailand, Israel), and African (e.g., Singapore) their weight share in the index do not exceed 5%. In the case of the S&P Global Clean Energy Index, it did not exceed the threshold of 1000 points only in August 2020. In the next two quarters, the index peak is visible until it exceeds the ceiling of 2000 points in January 2021. In the following periods, the exchange rate’s slight decline and stabilization at 1200–1500 points are visible. The five-year rate of return of the index stood at 15.24% (see Figure 4).
Bearing in mind the title of the prepared study, it is impossible not to present the graph of the economic situation of the photovoltaic market in Poland, which was developed by IRE (see Figure 5).
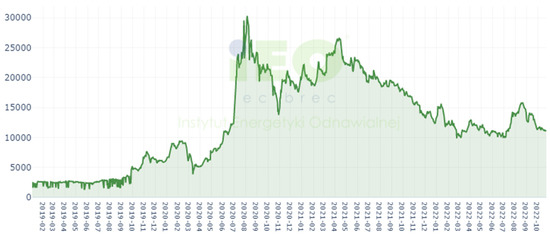
Figure 5.
Institute for Renewable Energy Photovoltaic Index: four-year quotes. Source: [80].
There is the WIG-Energy index on the main market of the WSE, but it also includes companies from the energy sector in which renewable sources are not included in their core business. Therefore, for the sake of transparency of industry results, it was decided to use an index made up of strictly photovoltaic companies, most of which are also the subject of the authors’ previous analyzes in terms of the investment attractiveness ranking. The IRE_PV index has been quoted since the beginning of 2019 when the “stock exchange boom” of photovoltaic companies became noticeable. IRE_PV consists of three companies listed on the New Connect exchange: Columbus Energy, Novavis (currently Voolt), and 01Cyberaton, and four companies listed on the WSE main market: ML System, Photon Energy, Sunex, and Grodno [80].
Since the inception of the IRE_PV index, the value did not exceed 3000 points during the first three-quarters of its operation. In the next six months, the rate finally peaked at 9000 points. In subsequent periods, a reduction in its value to the level of 5000 points was visible, which initiated significant increases, mainly due to the outstanding results of Columbus Energy Inc., which has the largest share in the index. The peak of the economic situation is for IRE_PV in August 2020, when the index exceeded the threshold of 30,000 points. The following months brought some stabilization, but starting in April 2021, the trend began to lower, falling below the level of 15,000 points at the end of 2021. Currently, it oscillates between 11–15 thousand points (see Figure 5).
In addition to the current situation on the IRE_PV exchange rate market, it is worth analyzing here two indicators that can support decisions made—Altman EM Score and Piotroski F-Score. The first one assesses the company’s financial condition and its bankruptcy risk. Based on the calculated value of the index, a rating on a scale from AAA to D is adopted, where the AAA rating represents the best financial condition. It is assumed that the value of the ratio above 5.5 (above BB+) signifies a low risk of bankruptcy. In turn, the F-Score is based on nine criteria for changing trends in indicators assessing the enterprise’s profitability, operational efficiency, and indebtedness. The index ranges from 0 to 9. Higher index values indicate positive dynamics of changes in the criteria components [81]. Most of the analyzed photovoltaic companies listed on the New Connect market improved their positions in the abovementioned measures. The most remarkable progress compared to 2020 was recorded for 01Cyberaton Inc. and Foto Volt Eko Energia Inc. Columbus Energy Inc. and Remor Solar Polska Inc. are currently struggling with slightly lower ratings than two years ago.
7. Conclusions
Most financial indicators are interpreted based on similar rules. Therefore, the presented principles can significantly help create an accurate description of the results of the analysis and facilitate investment decisions by potential investors. However, it should be emphasized that the knowledge of general principles is not enough to interpret financial ratios’ value correctly. Regardless of the considered financial ratio, one should understand the meaning of individual elements of the financial statements that have been included in its structure. In addition, you should thoroughly familiarize yourself with the essence of a given measure and industry specificity and understand what aspect of the company’s activity it relates to. The stock market itself is also changing dynamically and stochastic, so the risk associated with making investment decisions should always be taken into account.
In turbulent times, which are still accompanied by the consequences of the past pandemic, and in fact, which is still the great unknown, and with the specter of further socio-economic constraints, photovoltaics, and the entire renewable energy sector, can be included among the few areas of the economy that remain attractive for investment. On the one hand, their unwavering popularity results from the durability of the implemented actions, and on the other hand, it is the aftermath of the irreversibility of these processes in order to adapt to the guidelines related to energy transformation. These premises can be seen as the reasons for the growing interest in photovoltaics not only on the part of investors but also as shown by the data of issuers, which increase from year to year. In 2022, 23 companies dealing in photovoltaics will be listed on the Warsaw Stock Exchange. Among them, eight are on the Main Market, and the rest are on New Connect. In April 2022, BEEIN made its debut on the alternative market. From February 2022, VORTEX ENERGY SA is preparing for its debut, but the company is postponing the date due to the unstable market situation. At the beginning of October 2022, the total market value of the photovoltaic companies listed on the WSE amounted to over PLN 3.3 billion [82,83]. Listed companies, in their essence, are perceived as the source and cause of modernization processes in Poland and other countries. In addition, thanks to the status of a public company, they have much greater prospects and opportunities in terms of the availability of capital concerning competitors that do not issue their securities. In addition, as the director of CMC Market for Eastern Europe emphasizes, “the RES basket gives investors around the world well over 50 percent. profit. This indicates a boom in the renewable energy industry recently. It is worth noting that due to the very high valuations of listed companies, there is also a risk of a speculative bubble.
On the other hand, there is an ever more decisive ecological lobby behind the renewable energy industry and a business lobby behind it”. It is worth emphasizing that using the stock market as an alternative source of financing for developing photovoltaic companies is accompanied by several costs related to the emission and reporting requirements that a potential company must meet. Therefore, it is instead a solution used by larger photovoltaic companies. As shown by the data in 2022, among 32 companies debuting on the New Connect Stock Exchange in Warsaw, only one conducted activities related to photovoltaics. Similarly, on the main market of the WSE, in 2022, only one company from the renewable energy industry decided to issue its securities [82,83]. Speculative risk, as confirmed by the examples described in the article, was, is, and will always be an inherent attribute of every stock market. However, this risk can be significantly reduced by exercising the greatest possible diligence in conducting analyses and using common sense when making investment decisions. Entities in the renewable energy industry have always been accompanied by economic, political, and regulatory risks [84]. For many years, investments grew thanks to public support and regulations ordering an increase in the share of renewable energy sources in energy sales. It should be assumed that after the completion of individual government programs, the interest in investments in photovoltaics will decline, and the companies in which PV was the main activity will be obliged to extend it to other areas, such as heat pumps or energy storage. Awareness related to the protection of our planet and our health is, of course, the critical determinant of the expansion of the renewable energy industry. However, the market is also influenced by the constantly growing demand for electricity, energy prices, and EU obligations regarding RES. In addition, it is not difficult to disagree with Goldman Sachs analysts, who believe that the several times higher capital intensity of green infrastructure compared to conventional mining methods implies further work at the national and international level in the implementation of administrative and legal simplifications in this area and lowering the cost of capital.
The article’s main aim was to compare the condition of photovoltaic companies listed on the Polish stock market in 2017–2019. The implementation of the main goal formulated in this way consisted, firstly, in building rankings of investment attractiveness using the TMAI methodology and, secondly, an attempt to assess the development and further prospects of the renewable energy sector, especially photovoltaics, including the possibility of a speculative bubble on this market. It is worth emphasizing that even now on the RES market, including in the photovoltaic industry, you can find companies that are attractive from the perspective of the relation of the growth potential to their fundamental indicators. Of course, the market attitude should be updated on the one hand with the significant increases in share prices observed in mid-2020 so that the current market situation may have little to do with the fundamental analysis of these companies. However, on the other hand, the significant growth potential of the RES sector should be taken into account. According to numerous forecasts, it is significant. As a result, the renewable energy sector is now valued at a considerable premium resulting not only from current trends and actions by legislative bodies but also from potential future growth.
It can be assumed that there will be more and more photovoltaic companies on the stock exchanges. Investing in photovoltaics is, therefore, possible not only by mounting it on the roof, and possible income can also be obtained as a shareholder. However, many companies are trying to benefit from fashionable industries, and certainly not all of these companies will be successful, which should always be remembered. Despite the dynamic development of photovoltaic projects in Poland and around the world, investors were concerned about the photovoltaic sector and the downward trend in the share prices of major companies in the industry. It can be said that there has been a certain adjustment of the rate, i.e., its adjustment to the fundamental values. It is impossible to disagree with Prosper Capital analysts, who claim that “the good sentiment for renewable energy sources disappeared from the Warsaw (and not only) trading floor in the first quarter of 2022. However, if you compared the value of the IRE_PV index at the end of October 2022 with the same moment 12 months ago, it is still on a double-digit plus amounting to 14.2%” [85]. They forecast that the end of the year should bring about a relative stabilization of the economic situation in the photovoltaic market. There are many indications that in the coming years, a lot will happen in the field of renewable energy sources, especially in the photovoltaic sector. Of course, high rates of return go hand in hand with a high level of risk—this industry is exceptionally susceptible to legal changes and changes in fiscal policy. The kind of resistance of solar companies to fluctuations caused by the coronavirus pandemic was related mainly to the momentum that the industry fell into before 2019. To a large extent, the stimulus for changes was government programs aimed at achieving goals limiting CO2 emissions by increasing the share of energy from renewable sources. However, government initiatives are not the only reason for the increases, just like the growing climate awareness of the society or pro-ecological activities carried out by enterprises. Further prospects for the RES sector include, for example, efforts to minimize the costs associated with electricity production. In this context, it is worth thinking about the future rather than the present because it is the future that discounts the market.
Author Contributions
Conceptualization, A.K. (Agnieszka Kuś 1) (75%) and A.K. (Agnieszka Kuś 2) (25%); methodology, A.K. (Agnieszka Kuś 1) (30%) and A.K. (Agnieszka Kuś 2) (70%); investigation, A.K. (Agnieszka Kuś 1) (50%) and A.K. (Agnieszka Kuś 2) (50%); resources, A.K. (Agnieszka Kuś 1) (80%) and A.K. (Agnieszka Kuś 2) (20%); writing—original draft preparation, A.K. (Agnieszka Kuś 1) (70%) and A.K. (Agnieszka Kuś 2) (30%); supervision, funding acquisition, A.K. (Agnieszka Kuś 1) (50%) and A.K. (Agnieszka Kuś 2) (50%). All authors have read and agreed to the published version of the manuscript.
Funding
This research received no external funding.
Data Availability Statement
Not applicable.
Conflicts of Interest
The authors declare no conflict of interest.
References
- Twin, A. Speculative Bubble Definition. Available online: https://www.investopedia.com/terms/s/speculativebubble.asp (accessed on 24 April 2021).
- Kenton, W. What Is an Economic Bubble and How Does It Work, with Examples. Available online: https://www.investopedia.com/terms/b/bubble.asp (accessed on 30 October 2022).
- De Long, J.B.; Shleifer, A.; Summers, L.H.; Waldmann, R.J. Noise Trader Risk in Financial Markets. J. Polit. Econ. 1990, 98, 703–738. [Google Scholar] [CrossRef]
- Blanchard, O.J.; Watson, M.W. Bubbles, Rational Expectations and Financial Markets. In Crises in the Economic and Financial Structure; Wachtel, P., Ed.; D.C. Heath and Company: Lexington, MA, USA, 1982; pp. 295–316. [Google Scholar]
- Rodrigue, J.-P. The Geography of Transport Systems; Routldge: New York, NY, USA, 2020. [Google Scholar]
- Minsky, H.P. Stabilizing an Unstable Economy; McGraw-Hill Education: New York, NY, USA, 2008. [Google Scholar]
- Quinn, W.; Turner, J.D. Bubbles in history. Bus. Hist. 2020, 1–20. [Google Scholar] [CrossRef]
- Garber, P.M. Famous First Bubbles. J. Econ. Perspect. 1990, 4, 35–54. [Google Scholar] [CrossRef]
- Ross, B.E. Great Bubbles: Reactions to the South Sea Bubble, the Mississipi; Routledge: New York, NY, USA, 2000; Volume 1. [Google Scholar]
- Hoppit, J. The Myths of the South Sea Bubble. Trans. R. Hist. Soc. 2002, 12, 141–165. [Google Scholar] [CrossRef]
- Kleer, R. ‘The folly of particulars’: The political economy of the South Sea Bubble. Financ. Hist. Rev. 2012, 19, 175–197. [Google Scholar] [CrossRef]
- Halliday, E.M. The Mississippi Bubble. American Heritage. February/March 1978. Available online: https://www.americanheritage.com/mississippi-bubble (accessed on 30 October 2022).
- Neal, L.; Schubert, E. The First Rational Bubbles: A New Look at the Mississippi and South Sea Schemes; Faculty Working Paper No. 1188; University of Illinois: Urbana, IL, USA, 1985. [Google Scholar]
- McCartney, S.; Arnold, A. The railway mania of 1845–1847: Market irrationality or collusive swindle based on accounting distortions? Account. Audit. Account. J. 2003, 16, 821–852. [Google Scholar] [CrossRef]
- Campbell, G. Deriving the railway mania. Financ. Hist. Rev. 2013, 20, 1–27. [Google Scholar] [CrossRef]
- Oizumi, E. Property Finance in Japan: Expansion and Collapse of the Bubble Economy. Environ. Plan. A Econ. Space 1994, 26, 199–213. [Google Scholar] [CrossRef]
- Shimizu, C. What have we learned from the real estate bubble? Jpn. J. Real Estate Sci. 2011, 25, 29–38. [Google Scholar] [CrossRef]
- Wang, Z. Technological innovation and market turbulence: The dot-com experience. Rev. Econ. Dyn. 2007, 10, 78–105. [Google Scholar] [CrossRef]
- Griffin, J.M.; Harris, J.H.; Shu, T.; Topaloglu, S. Who Drove and Burst the Tech Bubble? J. Financ. 2011, 66, 1251–1290. [Google Scholar] [CrossRef]
- Levitin, A.J.; Wachter, S.M. Explaining the Housing Bubble. Georget. Law J. 2012, 100, 1177–1205. [Google Scholar] [CrossRef]
- Meng, H.; Xie, W.J.; Jiang, Z.-Q.; Podobnik, B.; Zhou, W.-X.; Stanley, H.E. Systemic risk and spatiotemporal dynamics of the US housing market. Sci. Rep. 2014, 4, 3655. [Google Scholar] [CrossRef]
- Corbet, S.; Lucey, B.; Yarovaya, L. Datestamping the Bitcoin and Ethereum bubbles. Financ. Res. Lett. 2018, 26, 81–88. [Google Scholar] [CrossRef]
- Gerlach, J.C.; Demos, G.; Sornette, D. Dissection of Bitcoin’s multiscale bubble history from January 2012 to February 2018. R. Soc. Open Sci. 2019, 6, 180643. [Google Scholar] [CrossRef]
- Shu, M.; Zhu, W. Real-time prediction of Bitcoin bubble crashes. Phys. A Stat. Mech. Its Appl. 2020, 548, 124477. [Google Scholar] [CrossRef]
- Duan, K.; Li, Z.; Urquhart, A.; Ye, J. Dynamic efficiency and arbitrage potential in Bitcoin: A long-memory approach. Int. Rev. Financ. Anal. 2021, 75, 101725. [Google Scholar] [CrossRef]
- Michie, R.C. Money, Mania and Markets: Investment, Company Formation, and the Stock Exchange in Nineteenth-Century; John Donald Publishers: Edinburgh, UK, 1981. [Google Scholar]
- Adam, M.C.; Szafarz, A. Speculative Bubbles and Financial Markets. Oxf. Econ. Pap. 1992, 44, 626–640. [Google Scholar] [CrossRef]
- Kaizoji, T. Speculative bubbles and crashes in stock markets: An interacting-agent model of speculative activity. Phys. A Stat. Mech. Its Appl. 2000, 287, 493–506. [Google Scholar] [CrossRef]
- Szumny, B. Speculative bubbles as anomaly of modern capital markets. Equilibrium 2009, 2, 39–47. [Google Scholar] [CrossRef]
- Greenwood, R.; Shleifer, A. Expectations of Returns and Expected Returns. Rev. Financ. Stud. 2014, 27, 714–746. [Google Scholar] [CrossRef]
- Girdzijauskas, S.; Štreimikienė, D.; Čepinskis, J.; Moskaliova, V.; Jurkonytė, E.; Mackevičius, R. Formation of Economic Bubbles: Causes and Possible Preventions. Technol. Econ. Dev. Econ. 2009, 15, 267–280. [Google Scholar] [CrossRef]
- Ikeda, S.; Shibata, A. Fundamentals uncertainty, bubbles, and exchange rate dynamics. J. Int. Econ. 1995, 38, 199–222. [Google Scholar] [CrossRef]
- Latocha, W. Finansowe Bańki Spekulacyjne i Ich Wpływ Na Sferę Realną Gospodarki—Prawda i Mity. Wrocław, Poland, 2009. Unpublished Paper. Available online: http://www.hossaprocapital.ue.wroc.pl/referaty/Finansowe%20banki%20spekulacyjne%20-%20Wojciech%20Latocha.pdf (accessed on 30 October 2022).
- Mazur, K. Mechanizmy baniek spekulacyjnych—Spojrzenie psychologiczne i ekonomiczne. Ogrody Nauk. Szt. 2012, 2, 274–282. [Google Scholar] [CrossRef]
- Masiukiewicz, P.; Dec, P. Behawioralne Aspekty Baniek Cenowych i Sposoby Ich Dezaktywacji. Ekonomista 2015, 4, 491–513. [Google Scholar]
- Brunnermeier, M.K.; Nagel, S. Hedge Funds and the Technology Bubble. J. Financ. 2004, 59, 2013–2040. [Google Scholar] [CrossRef]
- Cheng, P.-K.; Kim, Y.S. Speculative bubbles and crashes: Fundamentalists and positive-feedback trading. Cogent Econ. Financ. 2017, 5, 1381370. [Google Scholar] [CrossRef]
- Qiu, L.; Welch, I. Investor Sentiment Measures; NBER Working Paper No. 10794; National Bureau of Economic Research: Boston, MA, USA, 2004. [Google Scholar]
- Baker, M.; Wurgler, J. Investor Sentiment in the Stock Market. J. Econ. Perspect. 2007, 21, 129–151. [Google Scholar] [CrossRef]
- Edelen, R.M.; Marcus, A.J.; Tehranian, H. Relative Sentiment and Stock Returns. Financ. Anal. J. 2010, 66, 20–32. [Google Scholar] [CrossRef]
- Soros, G. The New Paradigm for Financial Markets; PublicAffairs: New York, NY, USA, 2008. [Google Scholar]
- Kindleberger, C.P.; Aliber, R.Z. Manias, Panics, and Crashes: A History of Financial Crises, 7th ed.; Palgrave Macmillan: London, UK, 2015. [Google Scholar]
- Allen, F.; Gale, D. Bubbles and Crises. Econ. J. 2000, 110, 236–255. [Google Scholar] [CrossRef]
- Abreu, D.; Brunnermeier, M.K. Bubbles An Crashes. Econometrica 2003, 71, 173–204. [Google Scholar] [CrossRef]
- Fratzscher, M. On currency crises and contagion. Int. J. Financ. Econ. 2003, 8, 109–129. [Google Scholar] [CrossRef]
- Wang, P.; Wen, Y. Speculative Bubbles and Financial Crises. Am. Econ. J. Macroecon. 2012, 4, 184–221. [Google Scholar] [CrossRef]
- Drews, A. Twórcza destrukcja jako szansa dla polskich MŚP w czasie światowego kryzysu gospodarczego. Acta Univ. Nicolai Copernic. Zarządzanie 2015, 41, 111. [Google Scholar] [CrossRef]
- Wheale, P.R.; Amin, L.H. Bursting the dot.com “Bubble”: A Case Study in Investor Behaviour. Technol. Anal. Strat. Manag. 2003, 15, 117–136. [Google Scholar] [CrossRef]
- Kohn, M.-B.H.; Pereira, P.L.V. Speculative bubbles and contagion: Analysis of volatility’s clusters during the DotCom bubble based on the dynamic conditional correlation model. Cogent Econ. Financ. 2017, 5, 1411453. [Google Scholar] [CrossRef]
- IEA. Renewables 2021 Data Explorer; IEA: Paris, France, 2021; Available online: https://www.iea.org/data-and-statistics/data-tools/renewables-2021-data-explorer (accessed on 30 October 2022).
- REN. Renewables 2022; Global Status Report; REN21: Paris, France, 2022; Available online: https://www.ren21.net/wp-content/uploads/2019/05/GSR 2022_Full_Report.pdf (accessed on 30 October 2022).
- IRE; Bogacz, A. Raport Rynek Fotowoltaiki w Polsce w 2021; Polish Institute for Renewable Energy: Warsaw, Poland, 2022. [Google Scholar]
- CSO; Walkowska, K. Raport Energia ze źródeł Odnawialnych w 2020; Polish Central Statistical Office: Warsaw, Poland, 2021.
- ERO. Potencjał Krajowy OZE w Liczbach—Urząd Regulacji Energetyki; Polish Energy Regulatory Office. Available online: https://www.ure.gov.pl/pl/oze/potencjal-krajowy-oze (accessed on 28 October 2022).
- IRENA. Renewable Energy Statistics 2022; International Renewable Energy Agency: Abu Dhabi, United Arab Emirates, 2022; Available online: https://www.irena.org/publications/2022/Jul/Renewable-Energy-Statistics-2022 (accessed on 30 October 2022).
- Hellwig, Z. Zastosowanie metody taksonomicznej do typologicznego podziału krajów ze względu na poziom ich rozwoju oraz zasoby i strukturę wykwalifikowanych kadr. Przegląd Stat. 1968, 4, 307–327. [Google Scholar]
- Tarczyński, W. Metody Wielowymiarowej Analizy Porównawczej na Rynku Kapitałowym; Wydawnictwo Naukowe PWN: Warszawa, Poland, 2006. [Google Scholar]
- Goncharuk, A.G.; Karavan, S. The Investment Attractiveness Evaluation: Methods and Measurement Features. Pol. J. Manag. Stud. 2013, 7, 160–166. [Google Scholar]
- Juszczyk, M. Powiązanie kondycji finansowej spółek giełdowych określonej syntetycznym miernikiem atrakcyjności inwestowania (TMAI) z kształtowaniem się kursów ich akcji. Zesz. Nauk. Szkoły Głównej Gospod. Wiejskiego. Ekon. Organ. Gospod. Żywnościowej 2015, 81–95. [Google Scholar] [CrossRef]
- Chrzanowska, M.; Zielińska-Sitkiewicz, M. Wielowymiarowa analiza porównawcza jako narzędzie oceny spółek deweloperskich notowanych na GPW. Econom. Ekonom. Adv. Appl. Data Anal. 2013, 4, 60–71. [Google Scholar]
- Pieloch-Babiarz, A. Determinants of payout policy and investment attractiveness of companies listed on the Warsaw Stock Exchange. Equilibrium 2017, 12, 675–691. [Google Scholar] [CrossRef]
- Fura, B.E. Using TMAI to Determine the Competitive Position of Companies in Poland’s Chemical Industry. Econ. Environ. Stud. 2019, 19, 31–54. [Google Scholar] [CrossRef]
- Witkowska, D.; Kuźnik, P. Does Fundamental Strength of the Company Influence Its Investment Performance? Dyn. Econom. Model. 2019, 19, 85–96. [Google Scholar]
- Ritchie, J.C. Fundamental Analysis; WIG-PRESS: Warsaw, Poland, 1997. [Google Scholar]
- Osadchy, E.A.; Akhmetshin, E.M.; Amirova, E.F.; Bochkareva, T.N.; Gazizyanova, Y.Y.; Yumashev, A.V. Financial Statements of a Company as an Information Base for Decision-Making in a Transforming Economy. Eur. Res. Stud. J. 2018, XXI, 339–350. [Google Scholar] [CrossRef] [PubMed]
- Hasanaj, P.; Kuqi, B. Analysis of Financial Statements. Humanit. Soc. Sci. Res. 2019, 2, 17–27. [Google Scholar] [CrossRef]
- Yin, H.; Yang, Q. Investor financial literacy, decision-making behavior, and stock price volatility—Evidence from behavioral experiments. J. Neurosci. Psychol. Econ. 2022, 15, 69–88. [Google Scholar] [CrossRef]
- BiznesRadar.pl. 2022. Available online: https://www.biznesradar.pl (accessed on 30 October 2022).
- Bindu, K.H.; Raghava, M.; Dey, N.; Rao, C.R. Coefficient of Variation and Machine Learning Applications, 2nd ed.; CRC Press: Boca Raton, FL, USA, 2020. [Google Scholar]
- Malina, A.; Zeliaś, A. On building taxonometric measures on living conditions. Stat. Transit. 1998, 3, 523–544. [Google Scholar]
- Hair, J.F.; Anderson, R.E.; Tatham, R.L.; Black, W.C. Multivariate Data Analysis; Prentice-Hall: New York, NY, USA; Englewood Cliffs, NJ, USA, 1995. [Google Scholar]
- Chatterjee, S.; Hadi, A.S. Regression Analysis by Example, 5th ed.; Wiley: Hoboken, NJ, USA, 2012. [Google Scholar]
- Gabrusewicz, W. Podstawy Analizy Finansowej; PWE: Warszawa, Poland, 2005. [Google Scholar]
- Sierpińska, M.; Jachna, T. Ocena Przedsiębiorstw Według Standardów Światowych; Wydawnictwo Naukowe PWN: Warszawa, Poland, 2011. [Google Scholar]
- Korol, T. Nowe Podejście Do Analizy Wskaźnikowej w Przedsiębiorstwie; Wolters Kluwer: Warszawa, Poland, 2013. [Google Scholar]
- Bankier.pl. Available online: https://www.bankier.pl/inwestowanie/profile/quote.html?symbol=REMORSOL (accessed on 30 October 2022).
- RENIXX. RENIXX® by IWR.de GmbH. 2022. Available online: https://www.renewable-energy-industry.com/stocks/ (accessed on 30 October 2022).
- Solactive. 2022. Available online: https://www.solactive.com/Indices/?index=DE000SLA9KC9 (accessed on 30 October 2022).
- Standard & Poors. 2022. Available online: https://www.spglobal.com/spdji/en/indices/esg/sp-global-clean-energy-index/#overview (accessed on 30 October 2022).
- Polish Institute for Renewable Energy. 2022. Available online: https://ieo.pl/pl/indeks-pv (accessed on 30 October 2022).
- BiznesRadar.pl. 2022. Available online: https://www.biznesradar.pl/spolki-rating/sektor:nc-eco,1,1 (accessed on 30 October 2022).
- WSE. Available online: https://www.gpw.pl/statystyki-gpw (accessed on 30 October 2022).
- New Connect. Available online: https://newconnect.pl/statystyki-okresowe (accessed on 30 October 2022).
- Jianu, I.; Jianu, I. The Share Price and Investment: Current Footprints for Future Oil and Gas Industry Performance. Energies 2018, 11, 448. [Google Scholar] [CrossRef]
- Prosper Capital. 2022. Available online: https://www.pcdm.pl/artykuly-eksperckie/ (accessed on 30 October 2022).


Disclaimer/Publisher’s Note: The statements, opinions and data contained in all publications are solely those of the individual author(s) and contributor(s) and not of MDPI and/or the editor(s). MDPI and/or the editor(s) disclaim responsibility for any injury to people or property resulting from any ideas, methods, instructions or products referred to in the content. |
© 2023 by the authors. Licensee MDPI, Basel, Switzerland. This article is an open access article distributed under the terms and conditions of the Creative Commons Attribution (CC BY) license (https://creativecommons.org/licenses/by/4.0/).