Article

Capacity Estimation of Lithium-Ion Batteries Based on Multiple Small Voltage Sections and BP Neural Networks

1
College of Physics and Optoelectronic Engineering, Shenzhen University, Shenzhen 518060, China
2
Guangdong Laboratory of Artificial Intelligence and Digital Economy (SZ), Shenzhen 518060, China
*
Author to whom correspondence should be addressed.
Energies 2023, 16(2), 674; https://doi.org/10.3390/en16020674
Submission received: 5 December 2022 / Revised: 28 December 2022 / Accepted: 4 January 2023 / Published: 6 January 2023
(This article belongs to the Special Issue New Advances in Battery Technologies)

Abstract

:
Accurate capacity estimation of onboard lithium-ion batteries is crucial to the performance and safety of electric vehicles. In recent years, data-driven methods based on partial charging curve have been widely studied due to their low requirement of battery knowledge and easy implementation. However, existing data-driven methods are usually based on a fixed voltage segment or state of charge, which would be failed if the charging process does not cover the predetermined segment due to the user’s free charging behavior. This paper proposes a capacity estimation method using multiple small voltage sections and back propagation neural networks. It is intended to reduce the requirement of the length of voltage segment for estimating the complete battery capacity in an incomplete charging cycle. Firstly, the voltage segment most possibly covered is selected and divided into a number of small sections. Then, sectional capacity and skewness of the voltage curve are extracted from these small voltage sections, and severed as health factors. Secondly, the Box–Cox transformation is adopted to enhance the correlation between health factors and the capacity. Thirdly, multiple back propagation neural networks are constructed to achieve capacity estimation based on each voltage section, and their weighted average is taken as the final result. Finally, two public datasets are employed to verify the accuracy and generalization of the proposed method. Results show that the root mean square error of the fusion estimation is lower than 4.5%.

1. Introduction

Due to the rising primary energy shortage and environmental degradation, many countries around the world are highly encouraging and supporting the development of new energy vehicles. New energy vehicles mainly include electric vehicles, hydrogen energy vehicles and other environmental-friendly energy vehicles. Among them, electric vehicles (EVs) have received extensive attention due to their high efficiency, security and reliability [1]. Currently, lithium-ion batteries are the most widely used energy storage system for EVs, and they highly determine EVs’ endurance and power performance. The capacity of lithium-ion batteries gradually degrades with the increase in cycle. According to the IEEE Standard 1188.1996, the battery needs to be replaced as its capacity drops to 80% of the rated capacity. In addition, some key states of the battery are closely related to the capacity, such as state of charge (SOC) [1], state of health (SOH) [2] and remaining useful life (RUL) [3]. Therefore, it is of great significance to estimate battery capacity online.

1.1. Literature Review

A large number of capacity estimation methods have been proposed, which can mainly be divided into two categories: model-driven methods and data-driven methods.
The model-driven methods are usually based on the electrochemical model or the equivalent circuit model. The electrochemical model [4,5,6] is based on the physical and chemical properties of the battery. It has the advantages of definite physical meaning and high accuracy. However, it is too complicated to be applied online and has many parameters to calibrate. The equivalent circuit model [7,8] is based on the electrical characteristics of the battery and uses electrical components, such as a resistor and a capacitor, to model the battery. Compared with the electrochemical model, the parameter number of the equivalent circuit model is greatly reduced, but the accuracy is lower. Generally, the model-driven methods require electrochemical knowledge and a profound understanding of the operating mechanism of the battery. Their flexibilities are also limited because different battery types, even cells, usually need to be modeled individually.
In contrast, the data-driven methods are more flexible and easier to use than the model-driven methods since they need not pay much attention to the complex electrochemical reactions inside the battery; rather, they only need to extract health features (HFs) representing the behavior of capacity degradation from historical data and then establish a machine learning model between HFs and the capacity. Chen et al. [9] extracted four geometric HFs from the current and voltage curves. The Laplacian Eigenmap algorithm was employed to establish an intrinsic manifold, and the geodesic on the manifold was used to estimate battery capacity. Chao et al. [10] extracted five HFs from the battery charging curve and then used the relevance vector machine (RVM) to model the relationship between HFs and the capacity. Zheng et al. [11] extracted three HFs from the incremental capacity (IC) and differential voltage (DV) curves, and proposed a joint estimation method for SOC and capacity. In addition, some scholars use ultrasonic methods to extract HF. For example, Li et al. [12] used a laser Doppler vibrometer to obtain the scanning signal of a lithium battery under different aging degrees and extract HF from it; Li et al. [13] used ultrasonic signals to conduct non-destructive battery testing, and selected seven high-quality HF.
The machine learning model also plays an important role in the accurate estimation of battery capacity. With the rapid development of machine learning and artificial intelligence, an increasing number of algorithms, such as support vector machine (SVM) [14,15], correlation vector machine [16], and Gaussian process regression [17], are being introduced to battery capacity estimation. With the rise in neural networks (NNs), especially due to their outstanding nonlinear fitting ability, these are being widely used for capacity or SOH estimation. Zhang et al. [18] constructed a three-layer back propagation neural network (BPNN) to train the model between internal resistance and capacity for achieving accurate state estimation. Wen et al. [19] extracted HFs from IC curves and established an SOH estimation model at different temperatures also using BPNN. Pan et al. [20] extracted multi-dimensional HFs from historical data, and established the extreme learning machine (ELM) to realize the SOH estimation. Li et al. [21] proposed a framework incorporating the concepts of transfer learning and network pruning to build compact convolutional neural network (CNN) models on a relatively small dataset with improved estimation performance. Tan et al. [22] proposed a SOH prediction method based on transfer learning, and designed a model by combining the long short-term memory (LSTM) and fully connected (FC) layers.
Most existing studies on capacity estimation are realized on the basis of full charging/discharging conditions. However, this is not practical for EV applications. EV users prefer to recharge the battery before its full discharging to 0% SOC due to range anxiety, while also preferring to stop charging before 100% SOC to avoiding over-charging. Especially in the case of fast charging, the battery is only charged to about 80% SOC. In other words, lithium-ion batteries are likely to experience an incomplete charging process. Accordingly, some researchers proposed capacity estimation methods based on fixed voltage/SOC segments. Fan et al. [23] extracted HFs from specific segments in the constant current stage (3.8–4.1 V) and constant voltage stage (1.5–0.2 A), respectively, and utilized Gaussian process regression (GPR) to establish a model between HFs and the capacity. Schaltz et al. [24] introduced a first-order linear equation to model the relationship between the sectional capacity and full capacity, verifying that different charging rates have little impact on the estimation results. Zheng et al. [25] proposed the particle swarm optimization (PSO) algorithm to select an optimal charging voltage segment under different conditions and employed a linear model to estimate full capacity based on sectional capacity. Park et al. [26] chose the sectional capacity corresponding to a fixed SOC segment as HF, and constructed a multi-layer perceptron (MLP) model for capacity estimation based on the extracted HF.
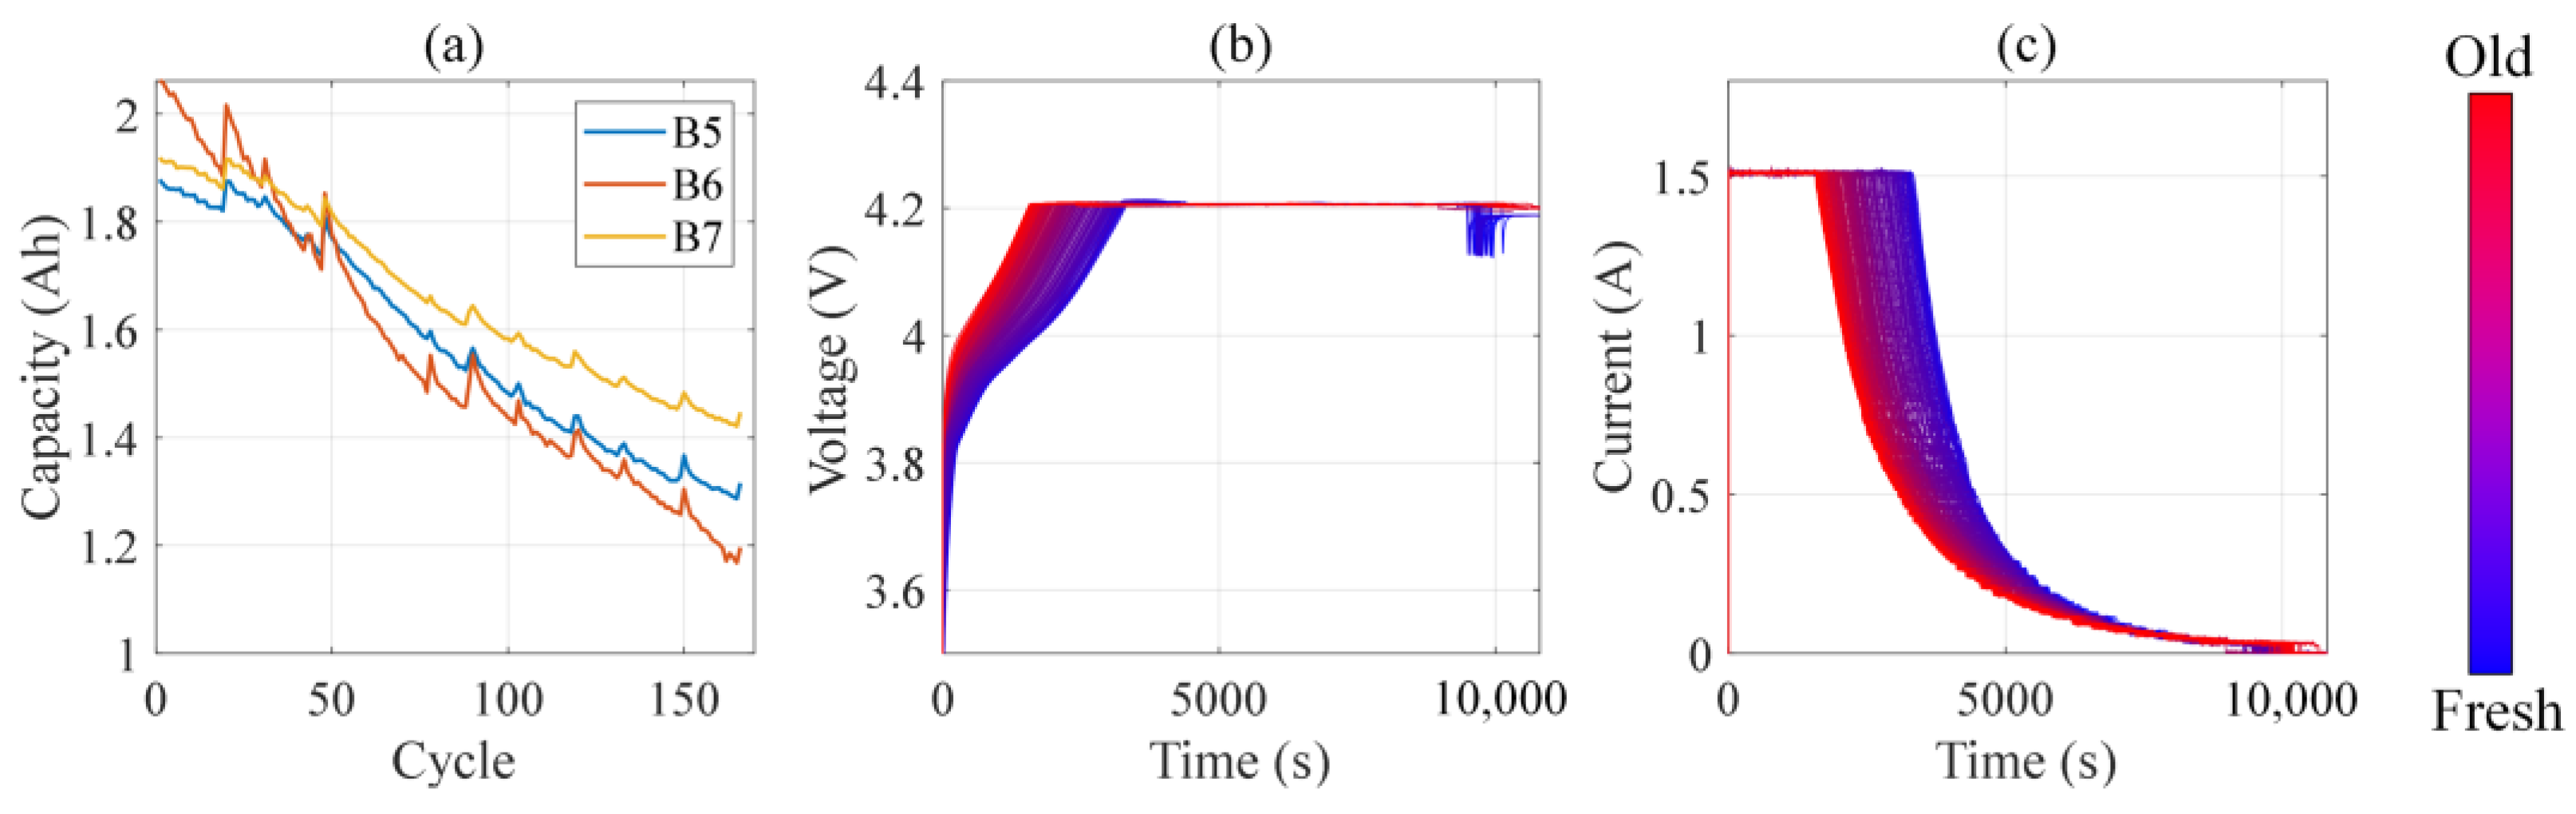
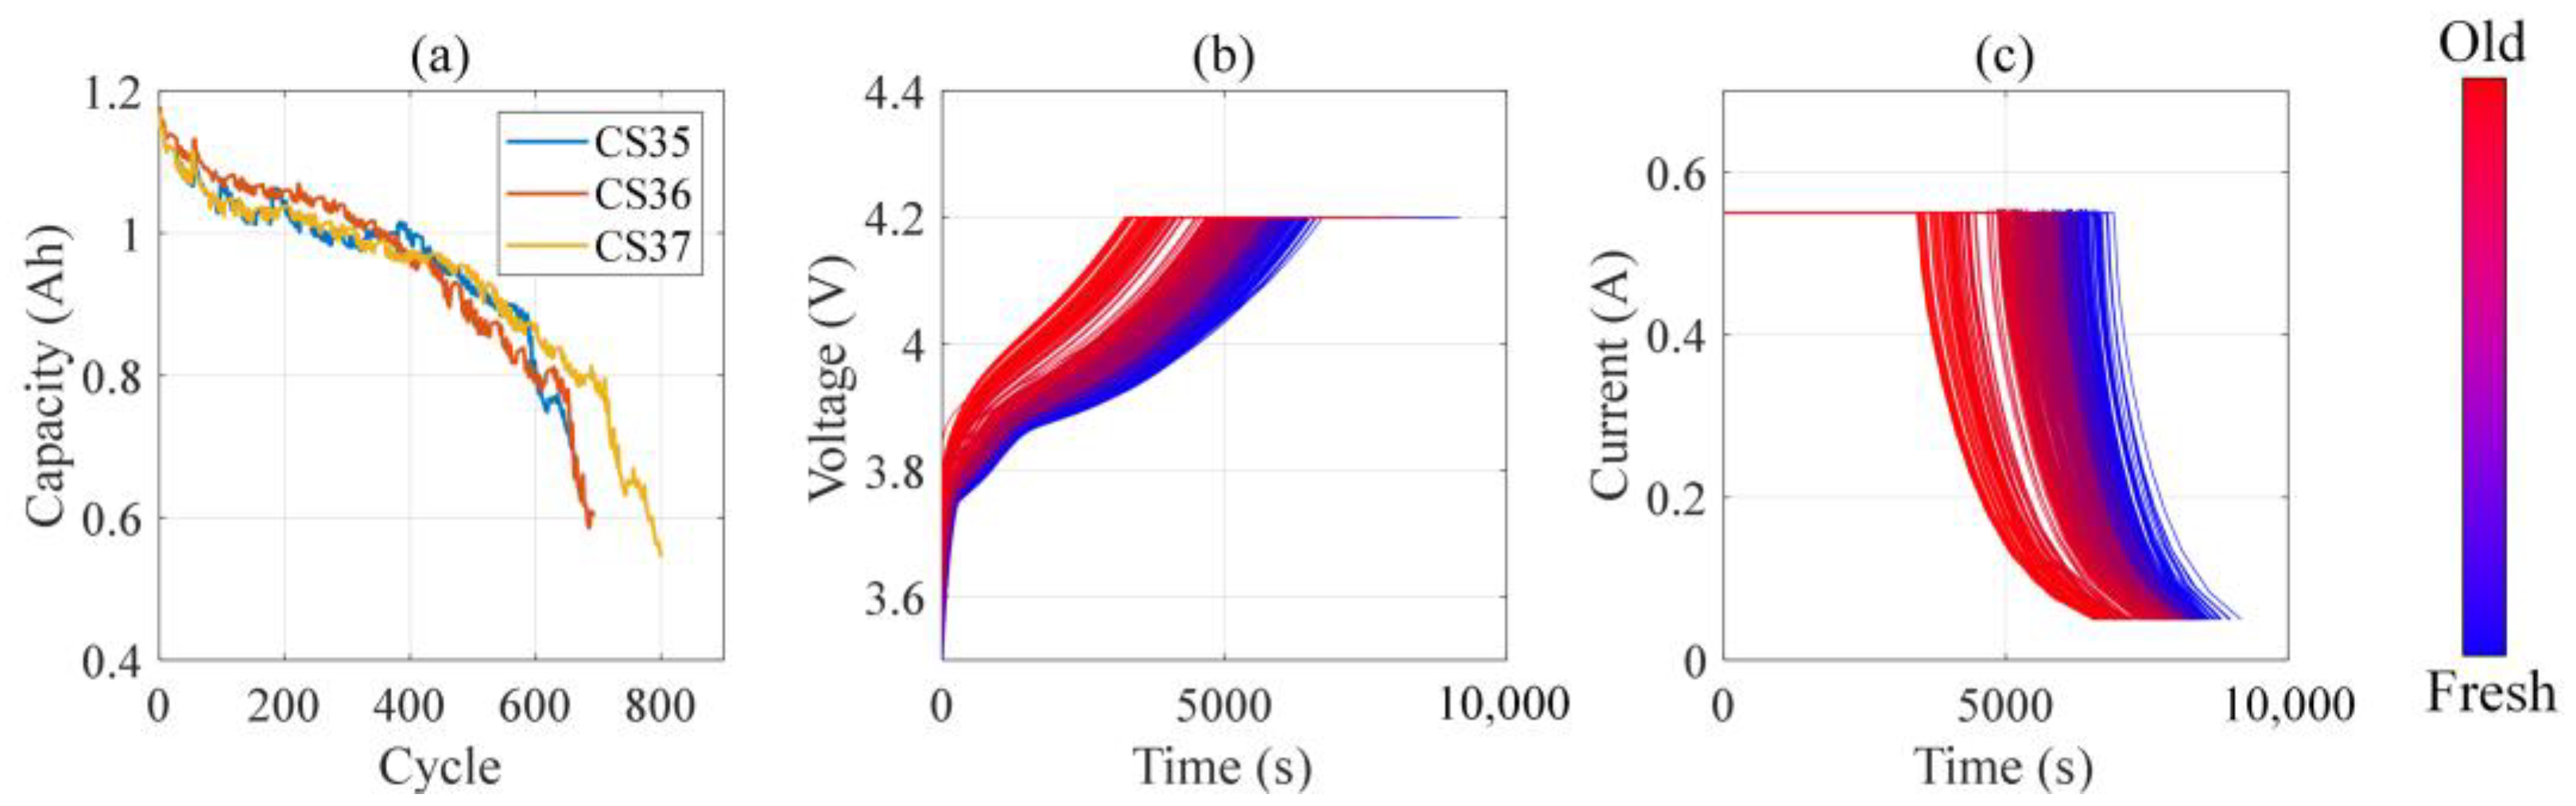
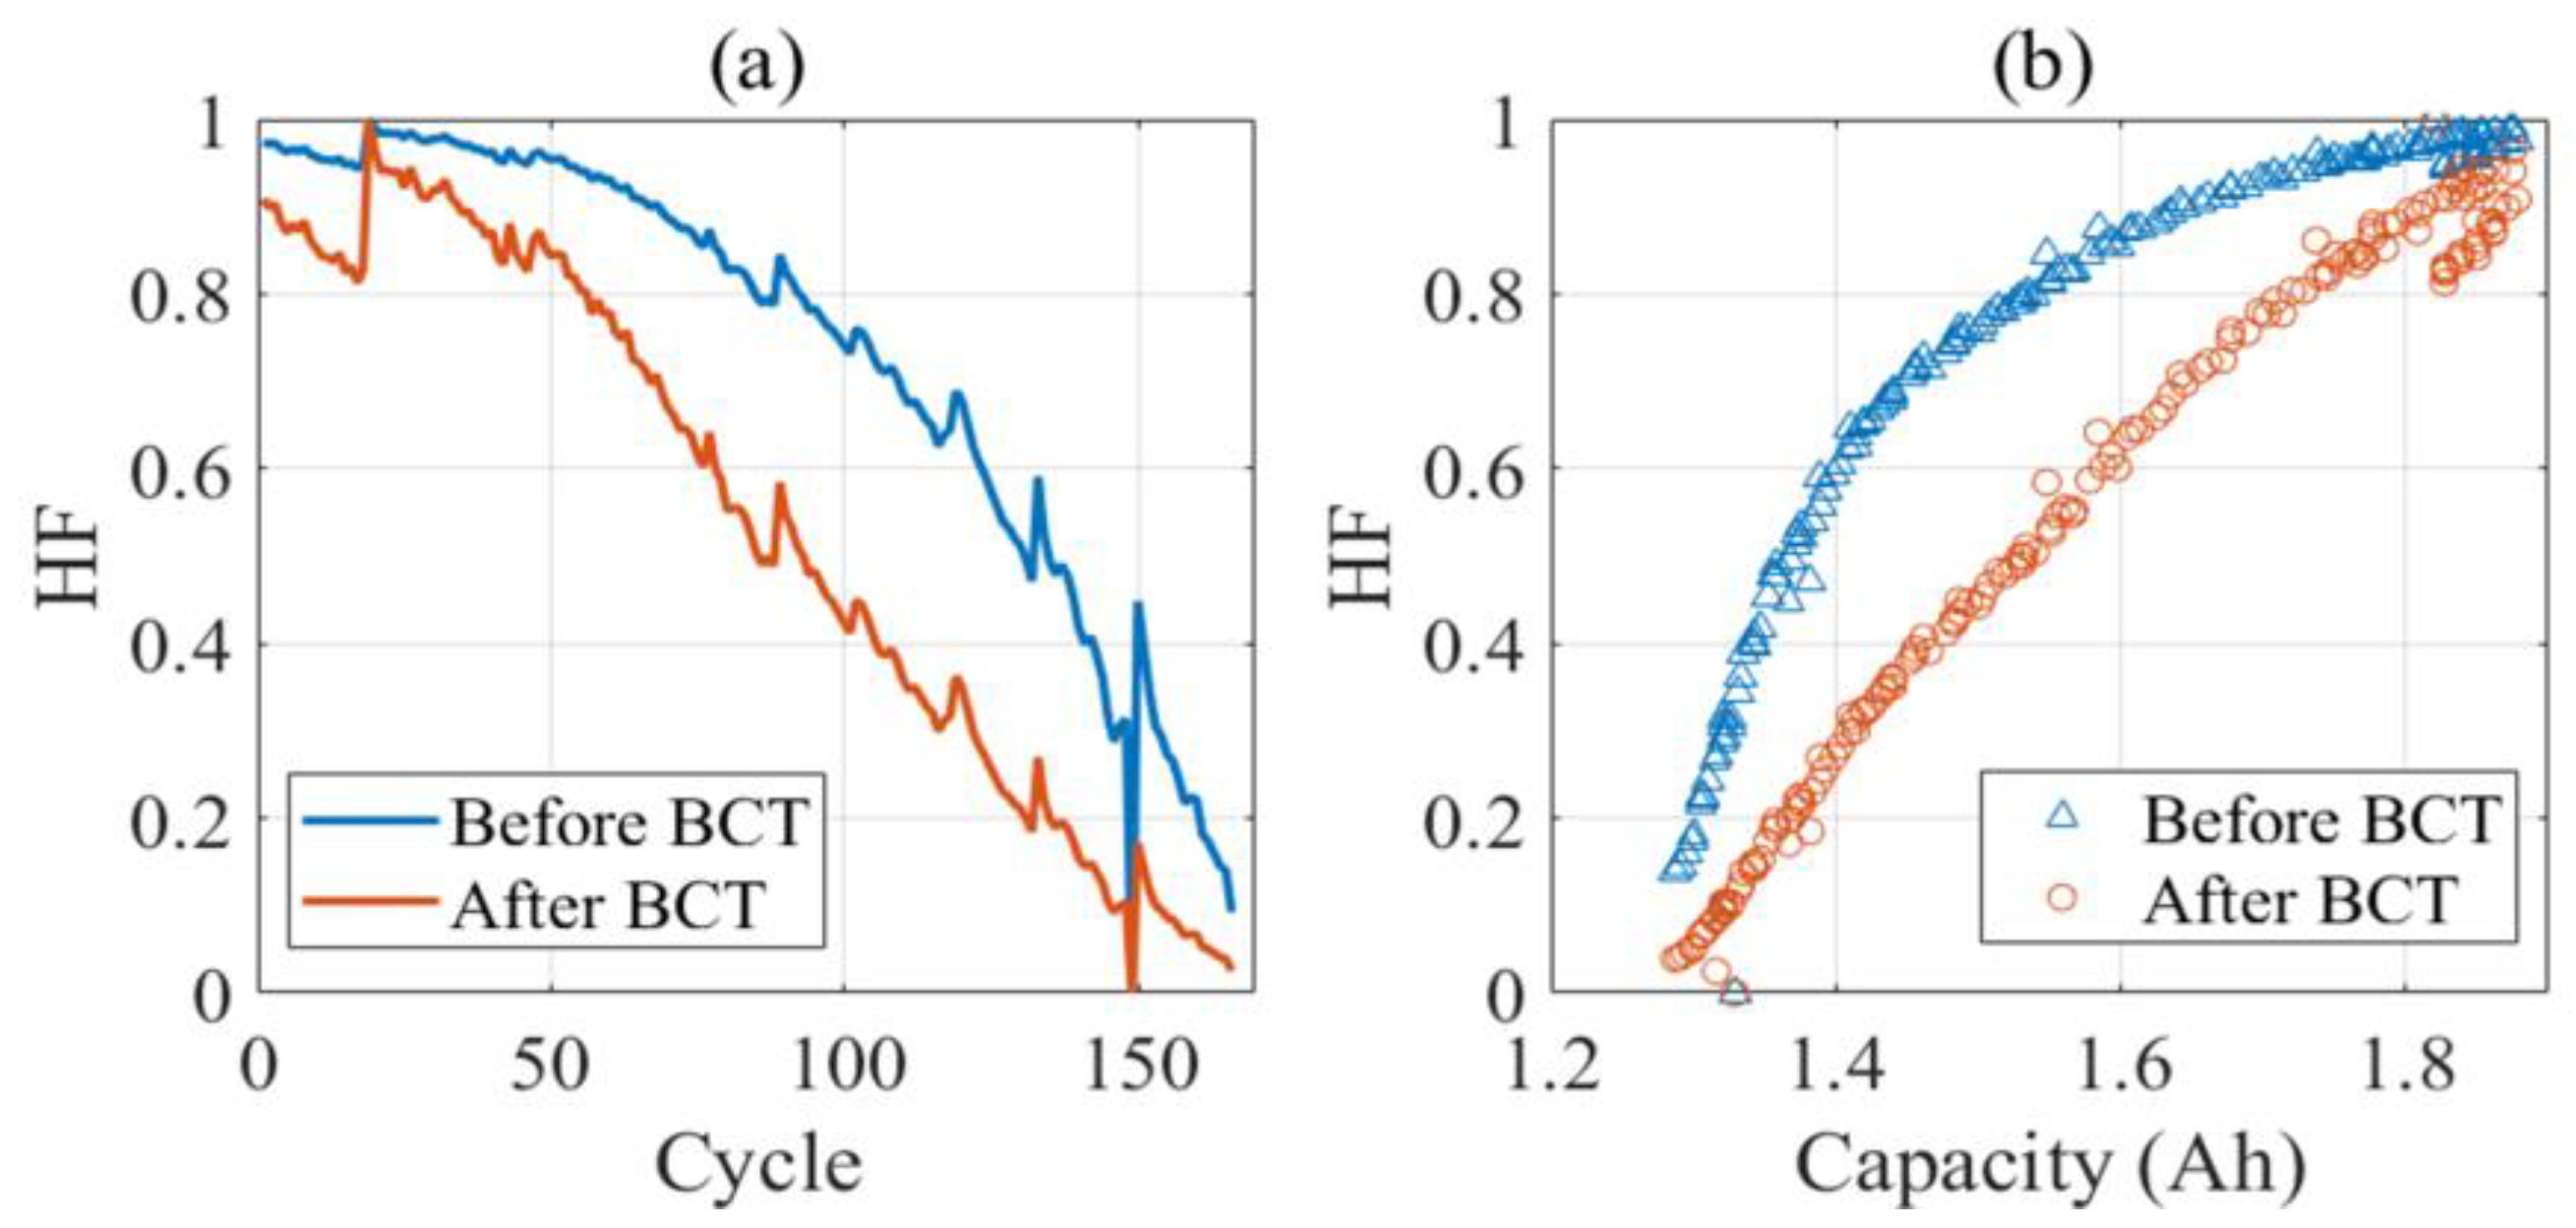
The above studies have proven the feasibility of using a charging segment for capacity estimation. In practice, however, EV users often exhibit free and inconsistent charging behaviors. In this case, a pre-determined and fixed charging segment cannot be fully covered (called a valid voltage segment in this paper), as shown in Figure 1, leading to the failure of existing methods.

1.2. Motivation and Main Contributions

This paper proposes a capacity estimation method based on multi-BPNN. Firstly, the commonly used voltage segment is further divided into a number of small sections. Then, HFs are extracted from these small sections, and the Box–Cox transformation (BCT) is adopted to obtain a higher correlation between HFs and the full battery capacity. Finally, multi-BPNN models are developed to achieve an accurate and flexible capacity estimation. The main purpose of the proposed method is to increase the probability that a selected charging segment can be covered in every charging cycle.
The innovations and contributions of the paper mainly include the following:
(1)
A charging voltage segment is further divided into a number of overlapped small sections, which increases the availability of an arbitrary voltage segment in an incomplete charging cycle for capacity estimation.
(2)
The sectional capacity and skewness extracted from each small voltage section are used as HF candidates, and a selection strategy is introduced to obtain an optimal HF for each single section. Additionally, the BCT strategy is adopted to enhance the correlation between HFs and the full battery capacity.
(3)
The multi-BPNN is utilized to establish the mapping model between HFs and the full battery capacity. In addition, a fusion method based on weighted average is developed to achieve the final estimation result when the charging segment covers more than one small section.
(4)
The proposed method is comprehensively demonstrated on two public battery datasets using comparison studies, including (1) capacity estimation with the small sections before and after BCT transformation, and (2) capacity estimation with the proposed method and conventional method.

1.3. Paper Organization

The rest of the paper is organized as follows. Section 2 introduces the battery datasets used in this paper. Section 3 details the principle of the proposed method. In Section 4, the feasibility and accuracy of the proposed method are validated by experiments on two public datasets. Finally, main conclusions of the paper are summarized in Section 5.

2. Battery Datasets

Two public battery datasets from NASA and CALCE are used in this paper. This section introduces these two datasets in brief.

2.1. NASA Battery Dataset

NASA lithium-ion battery dataset [27] is provided by NASA Ames Research Center. Three battery cells, namely B5, B6, and B7, are selected in this study. B5 is used as a training dataset, while the other two batteries are used for test datasets. These batteries have a nominal capacity of 2 Ah, and cathode material of lithium cobalt oxide (LiCoO2). Experiments at room temperature are carried out as follows:
  • Charging: the batteries are charged with a constant current of 1.5 A until their voltage reaches 4.2 V, followed by a constant voltage stage until the current is below 20 mA;
  • Discharge: the batteries are discharged with a constant current of 2 A to a predefined cut-off voltage. The cut-off voltages of the three batteries are 2.7 V (B5), 2.5 V (B6) and 2.2 V (B7), respectively;
  • Impedance measurement: the electrochemical impedance spectroscopy (EIS) is utilized to measure the battery impedance with a scanning frequency range of 0.1–5 kHz.
Steps (1)–(3) are repeated until the capacity is lower than 70% of the rated capacity of the battery.
The capacity degradation curves of B5, B6, and B7 are shown in Figure 2a, and, as examples, the changes in voltage and current with the increase in cycle of B5 are shown in Figure 2b,c, respectively. The voltage and current changes of the other two batteries are similar to those of B5.

2.2. CALCE Battery Dataset

This battery dataset is provided by the Center for Advanced Life Cycle Engineering (CALCE) of the University of Maryland [28]. In this paper, three battery cells, namely CS35, CS36, and CS37, are selected. The former is used for training, while the other two batteries are used for testing. The nominal capacity of these batteries is 1.1 Ah, and their cathode material is also LiCoO2. At room temperature, these batteries are tested with the following steps:
  • Charging: the batteries are charged with a constant current of 0.55 A (0.5C) until their voltage reach 4.2 V, followed by a constant voltage stage till the current is below 20 mA;
  • Discharging: with a constant current of 1.1 A (1C), the batteries are discharged to the cut-off voltage of 2.7 V;
  • Impedance measurement: the impedance of the battery is measured by EIS;
Steps (1)–(3) are repeated until the capacity is lower than 80% of the rated capacity of the battery.
The capacity degradation curves of the three cells are shown in Figure 3a, and the voltage and current curves of CS35 are shown in Figure 3b,c, respectively. The voltage and current changes of the other two cells are similar to those of CS35.

3. Proposed Method

In practical applications, the battery is often charged randomly and incompletely; therefore, it is difficult to estimate the capacity by a fixed voltage/SOC segment. To solve this problem, this paper proposes a capacity estimation method using small voltage sections and multi-BPNN. It contains two stages, namely offline training and online estimation. The former includes four steps: segment division, HF extraction, HF transformation, and model construction. The latter includes three steps: segment division, HF extraction and transformation, and capacity estimation and fusion. The flowchart is shown in Figure 4.

3.1. HF Extraction

During the charging and discharging processes of the battery, Li+ is repeatedly detached between the positive and negative electrodes, which is accompanied by side-reactions, resulting in the irreversible loss of the chemical substances in the battery. With the increase in cycles, the side-reactions gradually intensify. In the micro view, the solid electrolyte interphase (SEI) will grow, and the electrodes will dissolve. In the macro view, the internal resistance will increase, and the capacity will decrease [29].
Because the internal resistance and capacity cannot be acquired directly, it is needed to extract HF from the historical data to characterize the law of capacity degradation. The HF influences the accuracy and robustness of the model significantly. This paper uses the Pearson correlation coefficient to measure the HF quality, which is formulated as follows:
r = i = 1 n ( H F i H F ¯ ) ( Q i Q ¯ ) i = 1 n ( H F i H F ¯ ) 2 i = 1 n ( Q i Q ¯ ) 2
where HFi and Qi are values of the i-th data of HF and capacity, H F ¯ and Q ¯ are the average of HF and Q, respectively. The range of r is [–1, 1]. The r is closer to 1 or −1, the better the positive/negative correlation between HF and capacity, and the higher the HF quality.
The voltage segment corresponding to 10–50% SOC of the NASA dataset is 3.9–4.07 V, and the CALCE dataset is 3.85–3.98 V, as shown in Figure 5.
It can be seen from Figure 5 that the slope of the voltage curve increases, while the charging time shortens gradually with the increase in cycle. In other words, the corresponding sectional capacity decreases with the increasing cycle. Therefore, the sectional capacity can be used as an HF for battery degradation. In this paper, this is expressed as HFsc, and the Pearson correlation coefficient between HFsc and the full battery capacity is named rsc.
However, with the rise in the voltage section, the curves gradually become parallel to each other, as shown in Figure 6 and Figure 7. Especially for the CALCE dataset in the range of 3.928–3.980 V, the sectional capacity can no longer be suitable for distinguishing differently aged batteries because it changes very slightly. In addition, the rsc in these sections decreases obviously, which will be validated in Section 4.
To ensure the accuracy of the model in high voltage sections, it is necessary to introduce a new HF. From the perspective of statistics, the distribution of voltage data changes with the cycle, as shown in Figure 8. It is clear that the voltage data distribution is very different in the two voltage sections. In the high voltage section, the peak of the curve gradually shifts to the right. Therefore, the skewness is selected as a supplementary HF, which is expressed as HFskew, and the correlation between HFskew and capacity is named rskew.
The skewness is an important parameter in statistics, representing the asymmetry of data distribution, and it is formulated as:
S k e w n e s s = 1 n i = 1 n ( v i μ σ ) 3
where vi is the i-th voltage data, μ and σ are the average and standard deviation of v, respectively.
Pearson correlation coefficients between the skewness and the capacity are calculated and plotted in Figure 9 and Figure 10, where both the skewness and capacity are normalized by:
Y = X i X min X max X min
where, Y is the normalized value, Xi is the i-th original data, Xmin and Xmax are the minimum and maximum values in vector X, respectively.
It can be seen from Figure 9 and Figure 10 that with the rise in voltage sections, the correlation between the skewness and the capacity generally increases. As a result, the skewness can be used as a supplement HF, making up the failure of HFsc in high voltage sections.
In some middle voltage sections, the rsc and rskew are very close to each other, and both are highly correlated with the capacity. If the bigger one is selected as HF directly, some valuable information in the smaller HF may be missed. To obtain an optimal HF in a voltage segment, a fused method is proposed as follows:
HF = { HF sc   ,   r sc r skew > 0.05 HF skew   ,   r skew r sc > 0.05 HF pca   ,   | r skew r sc | 0.05
When the difference between the two HFs is greater than 0.05, the bigger one is selected. Otherwise, the principal component analysis (PCA) is adopted to fuse the HFsc and HFskew, and the first principal component is selected as HF, which is expressed as HFpca in Equation (4). It is worth mentioning that the threshold value, 0.05, is determined using the trial-and-error method.

3.2. Segment Division

The purpose of segment division is to increase the coverage probability of the required charging voltage segment for capacity estimation by reducing the length of small sections.
Coverage probability, HF quality and number of neural networks are three indicators for the selection of small section length, among which we have to make a trade-off because they contradict each other. For example, a longer voltage segment increases the HF quality; however, it reduces the coverage and requires more neural networks. To simulate the user’s random charging behavior, the coverage is calculated as follows: (1) 10,000 random segments with a length greater than the small section length are generated; (2) If a random segment could cover one or more small sections, it is determined as a valid segment; (3) The percentage of valid segments to the total 10,000 segments is defined as the coverage probability.
As an example, coverage probability, HF quality and number of neural networks at different section length are plotted in Figure 11, where r1, r2, r3 are the correlation between the capacity and HFs extracted from NASA B5, B6 and B7 cells, respectively. It is clear that with the increase in section length, the required neural networks reduces, and the correlation of the three batteries increases, but the coverage lowers.
Due to the contradiction between correlation and coverage, it is practical to improve the coverage without lowering correlation. For this purpose, this study divides the voltage segment into a number of overlapped small sections as follows:
{ S t a r t i = S t a r t i 1 + L × ( 1 o v e r l a p ) E n d i = S t a r t i + L ,   i = 1 , 2 , n
where Starti and Endi are the start point and end point of the i-th small voltage sections, respectively, L is the length of the small voltage section, and Start0 is the start point of the segment.
Figure 12a shows the segment division when the overlap is 0, while Figure 12b plots the segment division when the overlap is equal to 50%. Figure 13 shows the influence of the overlap length on the three indicators.
It can be seen from Figure 13 that with the increase in the overlap, the coverage also increases, especially for L = 0.055 V, presenting a sharp rise. When the overlap reaches 60%, the coverage is about 95%, and after that, the coverage is almost no longer improved. Moreover, HF is almost unaffected by the overlap.
Based on the above results, a section length of 0.035 V and an overlap of 60% are selected in this paper to make a good trade-off among HF quality, coverage and the number of required neural networks.

3.3. HF Transformation

Generally, the correlation between the HF and capacity is expected to present a linear relationship. However, the normality and stability of data are disturbed by battery system complexity and inevitable external interference. Therefore, it is necessary to transform the data appropriately to meet a normal distribution as much as possible.
Commonly used methods include logarithmic, square root, reciprocal transformation, etc. However, for different data, the corresponding transformation methods should also be different. To find a transformation method that can be flexibly applied to different data, Box and Cox designed a novel transformation method, Box–Cox transformation (BCT) [30], which transforms the data through parameter λ to realize a flexible data transformation, and it is formulated as:
y = { ( x + c ) λ 1 λ ,   λ 0 ln ( x + c ) ,   λ = 0
The inverse transformation is:
x = { ( 1 + λ y ) 1 / λ ,   λ 0 exp ( x ) ,   λ = 0
where x is the original data, y is the transformed data, λ is the transformation parameter, and c is a constant to ensure the data positive.
Different data transformations can be realized by controlling λ, which is calculated with the maximum likelihood estimation and the Bayesian method. This paper uses the maximum likelihood estimation method to obtain λ, and the specific derivation process is detailed in [30]. As an example, the changes of HF with cycle and capacity before and after BCT are compared in Figure 14. It is clear that the correlation between HF and capacity has been significantly improved after BCT transformation.

3.4. Capacity Estimation Model

Due to the complex aging mechanism inside the battery and external interference, the relationship between HF and capacity is nonlinear. The neural network is an abstraction and simulation of the human brain achieved by establishing “neurons” and “synapses” between input and output. Because of the excellent nonlinear fitting ability of the neural network, it is widely used for various estimation and prediction problems.
In this study, a three-layer BPNN is applied to model the nonlinear relationship between the HF and capacity. As shown in Figure 15, the first layer is input layer (HF), the second layer is hidden layer, the third layer is output layer (capacity), and each layer is fully connected by weight and bias.
The calculation of BPNN mainly consists of two parts: forward propagation and back propagation. During the forward propagation, data in the input layer are processed by the hidden layer and then transferred to the output layer to attain results, which can be formulated as:
{ h i = f ( Z h ) = f ( W h , i x + b h , i ) O = f ( Z O ) = f ( i = 1 n ( W O , i h i ) + b O ) , i = 1 , 2 , , n
where hi is the output of i-th node in the hidden layer, O is the output result (Qest), x is the input data (HF), W is weight, b is bias, n is the number of nodes in the hidden layer, and f(.) is the activation functions, which is chosen as Sigmoid function:
f ( z ) = 1 1 + e z
The back propagation’s purpose is to minimize the error by adjusting the weight and bias. In this paper, the mean squared error (MSE) is selected to be the loss function as follows:
E = 1 n i = 1 n ( y ^ i y i ) 2
where y ^ is the estimated capacity, and y is the real capacity.

3.5. Fusion of Estimation Results

In practical applications, there would be more than one estimation result in which the charging voltage segment covers multiple sections. In this case, the multiple estimation results are fused to attain the final estimated capacity, as shown in Figure 16, where k is the first small voltage section that can be covered by the charging segment, m refers to the number of covered small voltage section (k + mn), HFkrepresents the HF extracted from the k-th small section, BPNNkrepresents the trained BPNN for the k-th small section, and Qest,k is the estimated result by the k-th BPNN.
In this paper, the weighted averaging is employed to fuse the multi-estimated results as follows:
C a p a c i t y = i = k k + m ( 1 / exp ( R M S E i ) i = k k + m ( 1 / exp ( R M S E i ) ) Q e s t , i )   ,   k + m n
where RMSEi is the root mean square error of the i-th estimated capacity, and exp(.) is employed to widen the difference among estimation results so that the better estimation result can be assigned a higher weight.

4. Results and Discussion

To evaluate the feasibility and accuracy of the proposed method comprehensively, two indexes, including the root mean square error (RMSE), and mean absolute percentage error (MAPE), are utilized, which are formulated as follows:
R M S E = 1 N i = 1 N ( q i q ^ i ) 2 × 100 %
M A P E = 1 N i = 1 N | q i q ^ i q i | × 100 %
where qi is the real capacity, q ^ i is the estimated capacity, and N is the number of cycle.

4.1. Details of Small Sections

As aforementioned, the selected segment in this paper is the voltage corresponding to 10–50% SOC, i.e., voltage segment of [3.9 V, 4.07 V] for NASA dataset, and voltage segment of [3.85 V, 3.98 V] for CALCE dataset. The two datasets are divided using a section length of 0.035 V and an overlap of 60%, and the details are listed in Table 1.
As can be seen from Table 1, the charging time of a section is reduced dramatically in comparison with the entire segment. For NASA and CALCE datasets, the average charging time is 352 s and 662 s, respectively, which accounts for 20–35% of the segment charging time, and only accounts for 2–7% with respect to the full charging time. Such a small-time proportion is beneficial for reducing the data and time required for capacity estimation, as well as being practical.

4.2. HF Extraction Results

As analyzed in Section 3.1, a single HF cannot meet the quality requirement for accurate capacity estimation. Along with sectional capacity, this paper selects the skewness of the voltage section curve as a supplementary HF. The HF extraction results are shown in Table 2.
It can be seen that the rsc is always high for the NASA dataset; especially in low voltage sections, the rsc is greater than 0.98; even in the high voltage sections, the rsc is higher than 0.93. In addition, the difference between rsc and rskew is slight. Therefore, the extracted HF in high voltage sections are HFpca.
For the CALCE dataset, the rsc is greatly affected by the voltage rise. In high voltage sections, rsc drops sharply, becoming lower than 0.9. In contrast, rskew rises with the increase in voltage range, making up the failure of HFsc in high voltage sections. As a result, the complementarity between HFsc and HFskew ensures that each small section has a high-quality HF.

4.3. Verification of BCT Transformation

The quality of HF highly affects the accuracy of capacity estimation. To improve the normal distribution of HF and its correlation with capacity, BCT transformation is employed as described in Section 3.3. The correlations between HFs and capacity before and after BCT transformation are listed in Table 3.
After BCT transformation, the average HF correlation coefficient for NASA dataset increases from 0.983 to 0.987, achieving an improvement of 0.6%; for the CALCE dataset, the average HF correlation coefficient increases from 0.937 to 0.960, which rises by 2.5%. To further verify the effectiveness of BCT, capacity estimation are implemented using HF before and after BCT, respectively. The comparison of RMSE and MAPE is summarized in Table 4 and Table 5.
It can be seen from Table 4 and Table 5 that in each voltage section of the two datasets, the capacity estimation is more accurate after BCT transformation, especially in the low voltage sections. As for the NASA dataset, the average RMSE of B7 cell is lowered by 27%. In addition, the estimation accuracy of B6 and B7 are very different because of their individual discharging profiles. As for the CALCE dataset, the capacity estimation results after BCT transformation also achieve notable improvement. Different from the NASA dataset, CS36 and CS37 exhibit similar capacity estimation accuracy because of their consistent operating profiles.

4.4. Verification of Capacity Estimation Fusion

In this section, four voltage segments that cover different small voltage sections are selected to verify the fusion method for capacity estimation. The details of the four voltage segments are listed in Table 6, where “time proportion” denotes the ratio of the sectional charging time to full charging time. Capacity estimation results are plotted in Figure 17, Figure 18, Figure 19 and Figure 20 and estimation errors are summarized in Table 7, where Case 1 refers to the capacity estimation using the proposed method in this paper, while Case 2 represents the capacity estimation using the full voltage segment of 10–50% SOC.
According to Figure 17, Figure 18, Figure 19 and Figure 20, it is evident that the error distribution of Case 1 is very similar to that of Case 2, indicating that the proposed method can capture the capacity degradation trend of the lithium-ion battery. As seen from Table 7, both the RMSE and MAPE present little difference between Case 1 and Case 2. Particularly, the average RMSE in Case 1 is about 3%, while it is about 2.75% in Case 2. However, the average voltage length in Case 1 only accounts for 13.5% of the full charging time. In other words, the proposed method significantly reduces the required data for capacity estimation and only lowers the estimation accuracy slightly. Taking the NASA B6 cell as an example, when the voltage segment (3.89–3.97 V) only covers Section 1, Section 2 and Section 3, the RMSE increases from 3.9% to 4.4%, but the corresponding time reduces to 3.1% of the full charging time. Additionally, the proposed method is very flexible because it does not require a fixed voltage or SOC section. This is valuable for practical applications. By comparing Table 7 to Table 4 and Table 5, it can be concluded that the proposed fusion method makes the final capacity estimation be closer to that estimated by the small voltage section with higher accuracy. Taking the NASA B7 cell as an example, the RMSE with respect to S2–S6 is 3.7%, 3.7%, 4.4%, 3.6%, 2.9% and 3.1%, respectively. After fusion, the RMSE changes to 3.3%, and it is obviously close to the two highest accuracies of 2.9% and 3.1%.

5. Conclusions

A lithium-ion battery capacity estimation method based on small charging voltage sections and multiple back propagation neural networks has been proposed in this paper. To increase the availability of data required for capacity estimation, the voltage segment corresponding to 10–50% SOC is selected and divided into a number of overlapped small sections. The sectional capacity and skewness of voltage curve extracted from each small section are combined to achieve a high-quality health factor. Additionally, the Box–Cox transformation is introduced to improve the correlation between the health factor and the capacity. Subsequently, an individual three-layer back propagation neural network is designed for each voltage section to realize capacity estimation based on the health factor, and the estimation results of the multiple networks are fused through weighted averaging to attain the final estimated capacity. Experimental results indicate that: (1) with the help of the Box–Cox transformation, the correlation between the health factor and the capacity increases by 0.6% and 2.5% for the NASA and CALCE datasets, respectively; (2) Compared with the results directly using the extracted health factor, the root mean square error of capacity estimation after the Box–Cox transformation can be, on average, reduced by 21%; (3) The proposed method can highly reduce the amount and improve the availability of required data for capacity estimation without lowering the estimation accuracy.
Compared with the existing segment capacity estimation methods, that is, using fixed segments for capacity estimation, the biggest advantage of the method proposed in this paper is that it reduces the amount of data required for capacity estimation and increases the flexibility of capacity estimation, so that any available segment of the user can be used for capacity estimation, which is more conducive to practical use. From the view of electrochemistry, the advantage of the capacity estimation method based on segment data is that it can avoid excessive activation of active substances in the battery due to full charging/discharging, which will slow down the loss of battery materials and battery aging process. Moreover, the electrochemical mechanism of the fragment charge discharge process requires further discussion.
Furthermore, there are the limitations of our current work. Firstly, the drastic change of temperature will constantly change the aging trend of the battery, making the estimated results unreliable, especially in the capacity estimation by segment data. Therefore, the effect of temperature change on the estimation results needs further discussion. Secondly, in this work, we only used one type of battery for verification, and the applicability of this method in other types of batteries is also worthy of further discussion.

Author Contributions

Y.T.: conceptualization, methodology, software, validation, writing—original draft, project administration, funding acquisition. Q.D.: software, validation, data curation, writing—original draft. J.T.: conceptualization, supervision, writing—review and editing. X.L.: conceptualization, writing—review and editing, Funding acquisition. All authors have read and agreed to the published version of the manuscript.

Funding

This work was supported by the open research fund from Guangdong Laboratory of Artificial Intelligence and Digital Economy (SZ) (No. GML-KF-22-19), the National Natural Science Foundation of China (No. 52177219) and the Natural Science Foundation of Guangdong Province (2021A1515010525).

Data Availability Statement

The data set used in this paper are from the NASA Ames Research Center, and the Center for Advanced Life Cycle Engineering (CALCE) of the University of Maryland, which could be accessed on the website: https://data.nasa.gov/dataset/Li-ion-Battery-Aging-Datasets/uj5r-zjdb, and https://calce.umd.edu/data#CS2, accessed on 5 December 2022.

Conflicts of Interest

The authors declare that they have no known competing financial interest or personal relationships that could have appeared to influence the work reported in this paper.

References

  1. Hannan, M.A.; Lipu, M.S.H.; Hussain, A.; Mohamed, A. A review of lithium-ion battery state of charge estimation and management system in electric vehicle applications: Challenges and recommendations. Renew. Sustain. Energy Rev. 2017, 78, 834–854. [Google Scholar] [CrossRef]
  2. Tian, H.; Qin, P.; Li, K.; Zhao, Z. A review of the state of health for lithium-ion batteries: Research status and suggestions. J. Clean Prod. 2020, 261, 120813. [Google Scholar] [CrossRef]
  3. Tang, T.; Yuan, H. A hybrid approach based on decomposition algorithm and neural network for remaining useful life prediction of lithium-ion battery. Reliab. Eng. Syst. Safe 2022, 217, 108082. [Google Scholar] [CrossRef]
  4. Xiong, R.; Li, L.; Li, Z.; Yu, Q.; Mu, H. An electrochemical model based degradation state identification method of Lithium-ion battery for all-climate electric vehicles application. Appl. Energ. 2018, 219, 264–275. [Google Scholar] [CrossRef]
  5. Liu, B.; Tang, X.; Gao, F. Joint estimation of battery state-of-charge and state-of-health based on a simplified pseudo-two-dimensional model. Electrochim. Acta 2020, 344, 136098. [Google Scholar] [CrossRef]
  6. Li, X.; Huang, Z.; Tian, J.; Tian, Y. State-of-charge estimation tolerant of battery aging based on a physics-based model and an adaptive cubature Kalman filter. Energy 2021, 220, 119767. [Google Scholar] [CrossRef]
  7. Fang, L.; Li, J.; Peng, B. Online estimation and error analysis of both SOC and SOH of lithium-ion battery based on DEKF method. Energy Procedia 2019, 158, 3008–3013. [Google Scholar] [CrossRef]
  8. Yu, M.; Li, Y.; Podlubny, I.; Gong, F.; Sun, Y.; Zhang, Q.; Shang, Y.; Duan, B.; Zhang, C. Fractional-order modeling of lithium-ion batteries using additive noise assisted modeling and correlative information criterion. J. Adv. Res. 2020, 25, 49–56. [Google Scholar] [CrossRef]
  9. Lu, C.; Tao, L.; Fan, H. Li-ion battery capacity estimation: A geometrical approach. J. Power Sources 2014, 261, 141–147. [Google Scholar] [CrossRef]
  10. Hu, C.; Jain, G.; Schmidt, C.; Strief, C.; Sullivan, M. Online estimation of lithium-ion battery capacity using sparse Bayesian learning. J. Power Sources 2015, 289, 105–113. [Google Scholar] [CrossRef]
  11. Zheng, L.; Zhu, J.; Lu, D.D.; Wang, G.; He, T. Incremental capacity analysis and differential voltage analysis based state of charge and capacity estimation for lithium-ion batteries. Energy 2018, 150, 759–769. [Google Scholar] [CrossRef]
  12. Li, X.; Wu, C.; Fu, C.; Zheng, S.; Tian, J. State Characterization of Lithium-Ion Battery Based on Ultrasonic Guided Wave Scanning. Energies 2022, 15, 6027. [Google Scholar] [CrossRef]
  13. Li, X.; Hua, W.; Wu, C.; Zheng, S.; Tian, Y.; Tian, J. State estimation of a lithium-ion battery based on multi-feature indicators of ultrasonic guided waves. J. Energy Storage 2022, 56, 106113. [Google Scholar] [CrossRef]
  14. Feng, X.; Weng, C.; He, X.; Han, X.; Lu, L.; Ren, D.; Ouyang, M. Online State-of-Health Estimation for Li-Ion Battery Using Partial Charging Segment Based on Support Vector Machine. IEEE T. Veh. Technol. 2019, 68, 8583–8592. [Google Scholar] [CrossRef]
  15. Ma, C.; Zhai, X.; Wang, Z.; Tian, M.; Yu, Q.; Liu, L.; Liu, H.; Wang, H.; Yang, X. State of health prediction for lithium-ion batteries using multiple-view feature fusion and support vector regression ensemble. Int. J. Mach. Learn Cyb. 2019, 10, 2269–2282. [Google Scholar] [CrossRef]
  16. Guo, P.; Cheng, Z.; Lei, Y. A data-driven remaining capacity estimation approach for lithium-ion batteries based on charging health feature extraction. J. Power Sources 2019, 412, 442–450. [Google Scholar] [CrossRef]
  17. Yu, J. State of health prediction of lithium-ion batteries: Multiscale logic regression and Gaussian process regression ensemble. Reliab. Eng. Syst. Safe 2018, 174, 82–95. [Google Scholar] [CrossRef]
  18. Zhang, C.; Jiang, J.; Zhang, W.; Wang, Y.; Sharkh, S.; Xiong, R. A novel data-driven fast capacity estimation of spent electric vehicle lithium-ion batteries. Energies 2014, 7, 8076–8094. [Google Scholar] [CrossRef]
  19. Wen, J.; Chen, X.; Li, X.; Li, Y. SOH prediction of lithium battery based on IC curve feature and BP neural network. Energy 2022, 261, 125234. [Google Scholar] [CrossRef]
  20. Pan, H.; Lü, Z.; Wang, H.; Wei, H.; Chen, L. Novel battery state-of-health online estimation method using multiple health indicators and an extreme learning machine. Energy 2018, 160, 466–477. [Google Scholar] [CrossRef]
  21. Li, Y.; Li, K.; Liu, X.; Wang, Y.; Zhang, L. Lithium-ion battery capacity estimation—A pruned convolutional neural network approach assisted with transfer learning. Appl. Energ. 2021, 285, 116410. [Google Scholar] [CrossRef]
  22. Tan, Y.; Zhao, G. Transfer learning with long short-term memory network for state-of-health prediction of lithium-ion batteries. IEEE T. Ind. Electron. 2020, 67, 8723–8731. [Google Scholar] [CrossRef]
  23. Fan, L.; Wang, P.; Cheng, Z. A remaining capacity estimation approach of lithium-ion batteries based on partial charging curve and health feature fusion. J. Energy Storage 2021, 43, 103115. [Google Scholar] [CrossRef]
  24. Schaltz, E.; Stroe, D.; Norregaard, K.; Johnsen, B.; Christensen, A. Partial charging method for lithium-ion battery state-of-health estimation. In Proceedings of the 14th International Conference on Ecological Vehicles and Renewable Energies, Monte-Carlo, Monaco, 8–10 May 2019; pp. 1–5. [Google Scholar]
  25. Zheng, Y.; Wang, J.; Qin, C.; Lu, L.; Han, X.; Ouyang, M. A novel capacity estimation method based on charging curve sections for lithium-ion batteries in electric vehicles. Energy 2019, 185, 361–371. [Google Scholar] [CrossRef]
  26. Park, M.; Seo, M.; Song, Y.; Kim, S. Capacity estimation of li-ion battery using constant current charging voltage. In Proceedings of the IEEE Asia Pacific Conference on Circuits and Systems (APCCAS), Penang, Malaysia, 22–26 November 2019. [Google Scholar]
  27. Goebel, K.; Saha, B.; Saxena, A.; Celaya, J.R.; Christophersen, J.P. Prognostics in Battery Health Management. IEEE Instru. Meas. Mag. 2008, 11, 33–40. [Google Scholar] [CrossRef]
  28. He, W.; Williard, N.; Osterman, M.; Pecht, M. Prognostics of lithium-ion batteries based on Dempster–Shafer theory and the Bayesian Monte Carlo method. J. Power Sources 2011, 196, 10314–10321. [Google Scholar] [CrossRef]
  29. Barré, A.; Deguilhem, B.; Grolleau, S.; Gérard, M.; Suard, F.; Riu, D. A review on lithium-ion battery ageing mechanisms and estimations for automotive applications. J. Power Sources 2013, 241, 680–689. [Google Scholar] [CrossRef] [Green Version]
  30. Box, G.E.P.; Cox, D.R. An Analysis of Transformations. J. R. Stat. Soc. Ser. B Methodol. 1964, 26, 211–243. [Google Scholar] [CrossRef]
Figure 1. Incomplete charging processes: (a) a valid voltage segment; (b) an invalid voltage segment.
Energies 16 00674 g001
Figure 2. Details of the NASA dataset: (a) capacity degradation curves; (b) voltage curves of B5; (c) current curves of B5.
Energies 16 00674 g002
Figure 3. Details of the CALCE dataset: (a) capacity degradation curves; (b) voltage curves of CS35; (c) current curves of CS35.
Energies 16 00674 g003
Figure 4. The flowchart of the proposed method.
Energies 16 00674 g004
Figure 5. The voltage curves corresponding to 10–50% SOC: (a) NASA; (b) CALCE.
Energies 16 00674 g005
Figure 6. Variation of voltage curves in different sections of NASA.
Energies 16 00674 g006
Figure 7. Variation of voltage curves in different sections of CALCE.
Energies 16 00674 g007
Figure 8. Examples of voltage data distribution in different sections.
Energies 16 00674 g008
Figure 9. The correlation between capacity and skewness of NASA.
Energies 16 00674 g009
Figure 10. The correlation between capacity and skewness of CALCE.
Energies 16 00674 g010
Figure 11. Variation of three selection indicators with section length.
Energies 16 00674 g011
Figure 12. Segment division as the overlap is equal to (a) 0% and (b) 50%.
Energies 16 00674 g012
Figure 13. Variation of three selection indicators with overlap length.
Energies 16 00674 g013
Figure 14. HF changes with (a) cycle and (b) capacity before and after BCT transformation.
Energies 16 00674 g014
Figure 15. Schematic diagram of a three-layer BPNN.
Energies 16 00674 g015
Figure 16. Fusion of the multiple estimated capacity results.
Energies 16 00674 g016
Figure 17. Capacity estimation results of NASA B6 3.89–3.97V: (a) Case 1; (b) Case 2.
Energies 16 00674 g017
Figure 18. Capacity estimation results of NASA B7 3.92–4.01V: (a) Case 1; (b) Case 2.
Energies 16 00674 g018
Figure 19. Capacity estimation results of CALCE CS36 3.88–3.95V: (a) Case 1; (b) Case 2.
Energies 16 00674 g019
Figure 20. Capacity estimation results of CALCE CS37 3.85–3.98 V: (a) Case 1; (b) Case 2.
Energies 16 00674 g020
Table 1. Details of divided small voltage sections.
NASACALCE
SectionVoltage (V)Charging Time (s)Voltage (V)Charging Time (s)
Segment3.900–4.07013003.850–3.9802134
S13.900–3.9352403.850–3.885626
S23.914–3.9493063.864–3.899719
S33.928–3.9633703.878–3.913733
S43.942–3.9773953.892–3.927700
S53.956–3.9913953.906–3.941657
S63.970–4.0053993.920–3.955616
S73.984–4.0193953.934–3.980581
S83.998–4.033372
S94.012–4.047341
S104.026–4.070312
Table 2. Results of health factor extraction.
NASACALCE
SectionrscrskewHFrscrskewHF
S10.9920.761HFsc0.9560.726HFsc
S20.9930.842HFsc0.9660.503HFsc
S30.9930.757HFsc0.9560.404HFsc
S40.9860.763HFsc0.9740.824HFsc
S50.9800.843HFsc0.9230.957HFpca
S60.9850.675HFsc0.8730.957HFskew
S70.9620.948HFpca0.7620.945HFskew
S80.9760.985HFpca
S90.9530.977HFpca
S100.9340.942HFpca
Table 3. HF correlation comparisons before and after BCT.
NASACALCE
SectionBefore BCTAfter BCTBefore BCTAfter BCT
S10.9920.9940.9240.956
S20.9930.9950.9360.965
S30.9930.9930.9190.959
S40.9830.9850.9450.975
S50.9800.9890.9520.960
S60.9880.9930.9490.955
S70.9890.9890.9330.952
S80.9880.988
S90.9720.985
S100.9470.975
Improvement0.6%2.5%
Table 4. Comparison of capacity estimation before and after BCT (NASA dataset).
B6 RMSEB6 MAPEB7 RMSEB7 MAPE
SectionBeforeAfterBeforeAfterBeforeAfterBeforeAfter
S16.3%4.3%3.5%2.1%4.7%3.9%2.6%1.9%
S26.8%4.6%3.9%2.6%4.8%3.7%2.7%1.9%
S37.8%4.8%4.4%2.9%7.1%3.7%4.0%1.9%
S48.4%5.4%4.8%3.1%7.4%4.4%4.2%2.1%
S56.4%6.1%3.8%3.2%5.1%3.6%2.8%1.5%
S65.4%5.3%3.1%2.9%4.2%2.9%2.2%1.2%
S74.5%4.3%2.4%2.1%3.4%3.1%1.5%1.3%
S86.7%5.3%3.9%3.1%4.4%3.3%1.9%1.2%
S98.9%8.9%4.9%4.9%7.7%5.9%3.7%2.2%
S109.0%8.1%4.9%4.3%7.0%5.9%2.9%2.4%
Improvement17.5%19.6%27.1%38.1%
Table 5. Comparison of capacity estimation before and after BCT (CALCE dataset).
CS36 RMSECS36 MAPECS37 RMSECS37 MAPE
SectionBeforeAfterBeforeAfterSectionBeforeAfterBefore
S15.2%3.4%5.0%2.9%S15.2%3.4%5.0%
S23.9%2.8%3.4%2.2%S23.9%2.8%3.4%
S32.6%1.9%2.2%1.6%S32.6%1.9%2.2%
S43.0%2.6%2.4%1.7%S43.0%2.6%2.4%
S53.6%3.2%2.7%2.4%S53.6%3.2%2.7%
S63.3%2.9%2.7%2.7%S63.3%2.9%2.7%
S74.6%4.1%3.5%2.7%S74.6%4.1%3.5%
Improvement20.7%26.1%22.6%25.3%
Table 6. The details of four selected voltage segments.
No.BatterySegment (V)Time ProportionCovered Sections
1NASA B63.89–3.973.1%S1–S3
2NASA B73.92–4.018.0%S2–S6
3CALCE CS363.88–3.9516.6%S4, S5
4CALCE CS373.85–3.9826.1%S1–S7
Table 7. Errors of capacity estimation fusion.
Case 1Case 2
No.RMSEMAPERMSEMAPE
14.4%2.4%3.9%2.2%
23.3%1.6%2.8%1.4%
32.8%2.2%2.0%1.9%
41.7%1.5%1.5%1.3%
Disclaimer/Publisher’s Note: The statements, opinions and data contained in all publications are solely those of the individual author(s) and contributor(s) and not of MDPI and/or the editor(s). MDPI and/or the editor(s) disclaim responsibility for any injury to people or property resulting from any ideas, methods, instructions or products referred to in the content.

