Article

Bus Voltage Violations under Different Solar Radiation Profiles and Load Changes with Optimally Placed and Sized PV Systems

1
Department of Electrical Engineering, Motilal Nehru National Institute of Technology Allahabad, Prayagraj 211004, India
2
Fredrikstad Campus, Østfold University College, 1671 Fredrikstad, Norway
*
Author to whom correspondence should be addressed.
Energies 2023, 16(2), 653; https://doi.org/10.3390/en16020653
Submission received: 25 November 2022 / Revised: 24 December 2022 / Accepted: 30 December 2022 / Published: 5 January 2023
(This article belongs to the Special Issue Development Strategies of Distributed Power Generation)

Abstract

:
This study mainly discusses the implications of solar radiation profiles and changes in load with respect to base load conditions on the PV placement, size, voltage violations, and curtailment cost of PV generation in the network. The PV installation is optimized using yearly solar radiation profiles, low, medium, and high, corresponding to three different locations. The network in the study is represented as a multiphase, with provision for the installation of both single- and three-phase PV systems. For the different load changes in either one of the phases or all three phases, the optimal placement and size of PV inverters are discussed. It is indicated that with load increase in all three phases, for low solar radiation profiles, the placement and size of PVs remain non-uniform, while for medium and high solar radiation, the distribution becomes comparatively uniform throughout the network. However, with a load increase in one of the phases, for low solar radiation, optimal placement compensates with three-phase PV installation, while for medium/high solar, the corresponding load increase phase contributes to greater PV installation. The voltage rise is observed at both load-connected and non-load-connected buses. Such buses in the network are those that form the common junction with the branches connected to another set of buses having optimally placed PVs. The voltage violations are experienced at the feeder end buses with single-phase PV installation, not only in the phase having a connected load but also in one of the other phases.

1. Introduction

Several research studies encourage small-scale distributed generation resources integration due to savings on fuel costs, deferral on infrastructure upgrades, etc. [1,2]. On the other hand, their inappropriate planning in terms of site location and sizing [3] may result in negative economic, voltage violation, high thermal loss, etc.
Several factors: penetration level, concentration, network parameters, load characteristics, and passive/active operation of distributed generators (DGs), govern positive or negative impacts on economics [4]. Studies [5,6,7] indicate that a high penetration level of distributed PVs can lead to the increased lifespan of the transformer, while high penetration level motivates for reinforcement of the network, causing over-voltages and increased losses. A review based on the classification of DG units, challenges of placement, and push factors in the growth of DGs with the advantages of PV integration into the grid is presented in [8].
Studies on DG placement and size have been extensively reported in recent years. These fall in the category of planning and operational, distribution network and DG models, the inclusion of uncertainty in renewable generation/load, and a solution approach. The authors [9] presented the placement and sizing of one or two DGs while minimizing the power losses, having considered aggregated real power balance equations of unbalanced distribution networks. An exhaustive reported work having wind power forecast, placement, and sizing of DG with loss minimization and voltage stability assessment is discussed in [10]. The studies on placement, sizing taking into account stochastic DG with capacitor banks [11], and coordination of DGs along with reactive power allocation based on probabilistic load flow analysis [12] are also proposed.
The above studies [9,10,11,12] have been limited to single-phase, aggregate power balance formulation without any assessment of multiphase power flow constraints. The low voltage distribution network is usually unbalanced and has both single- and three-phase loads connected. Due to unevenly distributed single-phase loads and asymmetrical line impedances, the prevailing voltage unbalance may lead to increased network losses and even instability in the system [13]. Researchers [14] presented approaches to mitigate voltage unbalance in multi-folds: dynamic switching of residential loads, charging and discharging of electric vehicles, control of inverters, energy storage units, and many more. Their study proposed a two-stage framework to quantify the impact of variable output power from distributed generation resources on voltage unbalance and its remedial measures. The first stage involves quantifying the impact of generation resources and whether critical resources significantly impact voltage unbalance. This follows the second stage with allocating energy storage units against voltage deviations. This means that once critical generation resources have been identified against voltage unbalance, energy storage units are responsible for mitigating voltage unbalance. The said situation further deteriorates with the integration of single- and three-phase inverter interfaced PV resources.
Recently, the authors [15] proposed the placement and sizing of DGs in a multiphase distribution network. Both single- and three-phase inverters are modeled as nodal admittances, taking into account uncertainty in power injection into the distribution network. In a two-stage stochastic formulation, the first stage results in the placement and sizing of DGs, while the second stage makes the decision about real power curtailment, reactive power support, and voltage changes along the network.
A high level of PV penetration changes the direction of the power flow and significantly affects the voltage deviation along the network. With uncertainties in PV output power and load demand in the distribution network, probabilistic approaches in studying voltage unbalance have been in focus. The probabilistic load flow and sensitivity analysis to understand the influence of variable loads on voltage unbalance is discussed in [16].
An optimization-based approach applying individual phase regulation via coordination of the on-load-tap-changer (OLTC), switched capacitor bank, and volt-var characteristic of the PV inverter is discussed in [17]. The authors [18] presented an integrated approach towards voltage regulation, with PV re-phasing through switches combined with the dynamic line rating of the overhead conductors. The coordination between OLTC and PV inverter for reactive power injection is performed to enhance the current carrying capacity of overhead lines. The optimization function for the optimal placement and size of DGs with a loss minimization objective in an unbalanced network cannot prove the optimality of solutions mathematically due to the non-convexity of the problem. Researchers [19,20] discussed the optimal tap control to regulate OLTCs along with capacitor banks in the network having multiple distributed energy resources.
Although the placement and size of DGs in distribution networks have been extensively discussed in several forms, including a reduction in losses [21], stochastic modeling [22,23], aided with storage [24,25], there is still a knowledge gap of the economic and technical (voltage unbalance) impacts against the concentration of PV inverters placed and its size associated with different solar radiation profiles. A brief review of the present retail electricity market, power requirements, challenges, and next-generation electricity market is presented in [26].
Many studies [9,10,11,12] limit their scope to the placement and size of DGs and do not assess other impacts on the network. For instance, in [9], only one or two DGs are placed. On the other hand, Ref. [10] includes forecasting the DGs’ placement and size. Further, the study [14] assumed that size and placement of generation resources as three-phase in the network have been pre-determined, with voltage unbalance mitigation achieved via optimal allocation of energy storage units [27,28,29,30,31]. As such, the role of generation resources and uncertainty in output power cannot be ascertained in mitigating issues of voltage unbalance.
The distribution system resilience can be enhanced with the increased penetration of distributed forms of energy resources [32]. However, Refs. [32,33] makes assumptions about the even placement and penetration being high enough to meet the nearby load in the form of the number of microgrids. Multiple sets of self-supplied microgrids cannot be established if a given section of the distribution network is heavily loaded but placed with low or moderate levels of energy resources.
With high PV penetration levels, their placement can be planned upstream of the network to effectively reduce the voltage deviation problem caused by the distributed location of PVs [34]. A two-stage stochastic programming approach, with the first stage involving apparent power capability and the second stage involving reactive power support for optimal placement and size of PV inverters, is found in [35]. The potential of enhancement in PV hosting capacity [36] is evaluated using a two-stage transmission and generation expansion planning model, while [37] reviews hosting capacity. The hosting capacity is changeable based on its placement and applied strategy on reactive power compensation towards voltage violations [38]. The uniformity in this distribution across the complete power network can further improve the ability to recover from power outages due to accidents or natural disasters. Additionally, the distribution network’s being associated with a low impedance path, and the presence of unbalance energy resources affects more voltage unbalance levels in the branch than between the buses [39]. The hosting capacity of the PV based on a mixture of deterministic methods using time series data is reported in [40], and they suggest using year-wise data to analyze the seasonal effect in future studies. The authors [41] have examined the impact of different generation profiles in large-scale PVs integrated into a weak grid.
Past studies do not evaluate more realistic situations. With the assessment of the distribution of DGs across the network for different solar radiation profiles, uncertainty in load/generation is considered. One can observe that most efforts have been directed to optimal placement and sizing, including the assessment of voltage unbalance. The relation between the variation in solar radiation profiles and the distribution of optimally placed DGs across the network has not been explored in the context of voltage unbalance.

1.1. Problem Statement

Generally, transmission networks consist of non-radial topologies, such as loop networks, and thus do not change often. In contrast, medium voltage and low voltage distribution networks, such as radial topology, can change much more frequently.
Although the problem of placement and size of PV resources adopts optimal objectives, with uncertainties in generation and load taken into account, a high concentration or non-uniformity may lead to node voltage variations not aligned with the output power variation of energy resources. In other words, the consistency of voltage drop can become more complicated. This study on voltage violations is motivated by findings reported in [29]. The changes in optimal placement, size of PV (single-phase or three-phase) distribution among three phases throughout the network, and resulting voltage profile against connected load and solar radiation profiles provide follow-up for further investigation.
The study uses the method to explore the placement and sizing of PV inverters in the IEEE 37-bus distribution network [15]. The PVs are integrated as three- and single-phase inverters. The solar radiation data from three sites, corresponding to 13 h × 365 days, are accessed from NREL’s PVWatts (National Renewable Energy Laboratory’s power calculator). The total load connected in the bus network [15] is considered the base case in the analysis. Subsequently, with changes in load applied in each phase or all three phases, this study investigates changes in the calculated inverter size, their placement, and finally, the voltage profile along the network. In other words, the overall network hosting capacity is analyzed in terms of PV inverter location and size against the randomness in load changes and solar radiation profiles. The study is emphasized to investigate the voltage profile, being a function of optimal PV placement and location as a consequence of randomness in connected load changes and solar radiation profiles.

1.2. Contribution and Paper Organization

As mentioned above, this study aims to analyze voltage violations, particularly at feeder-end buses, with optimized PV placement and size, curtailment cost against different solar radiation profiles, and randomness in connected load. This paper presents an assessment of the distribution of optimally placed and sized PV inverters across the network and its impact on voltage unbalance. The primary objective is to achieve the maximum capacity of PV placement without violation of operational constraints. This criterion is specified on the basis of an index such as voltage deviation referred to throughout the network. Some examples of load imbalance are considered to analyze the voltage profile due to different PV output generations corresponding to solar radiation profiles.
The main contributions of the paper include the followings:
  • Discussion on the distribution of single-phase and three-phase PV installation and size across the distribution network.
  • Discussion on the maximum/minimum voltage and the voltage index (per phase) calculated for optimized solutions obtained using average yearly, monthly, daily, and hourly solar radiation data.
  • Discussion on the voltage profile distribution and curtailment cost with respect to the PV installation.

2. Distribution Network and PV Inverter Output Modeling

2.1. Distribution Network

A given distribution network with n bus is connected to either single- or three-phase given as Ω n = { ( 1 Φ A , B , C ) , 3 Φ } .
Load change introduced in the individual phase from the base load at bus   n in phase A , B , C is written as
S L , Ω n = k Ω n S L , Ω n B
where, S L , Ω n is the load (kVA) at the bus, k Ω n is the load scale factor, S L , Ω n B is the base value of load power (kVA) (connected load) drawn at each bus.
The vector of nodal current injections in terms of the vector of nodal voltages is written as
I Ω n = d i a g V Ω n 1 Δ S Ω n *
where, Δ S Ω n = S G , Ω n S L , Ω n , S G , Ω n is the apparent power (kVA) injection at bus n in phase Ω n , S L , Ω n is the AC load (kVA) at bus n in phase Ω n .
Following nodal current injections at bus n , according to Ohm’s Law, written in nodal admittance models, we can write power imbalance as [15]:
Δ S Ω n M V V ˜ + Ψ V V ˜ * + v
where, M = d i a g Y V ˜ * + d i a g Y N S V S * , Ψ = d i a g V ˜ Y * , V ˜ = d i a g V ˜ Y * V ˜ * + d i a g V ˜ Y N S * V S * , V S is slack bus voltage (p.u.), Y N S is the node admittance between non-slack buses and slack buses, V ˜ is the voltage profile (p.u.) in the absence of PV resource at the base load value.
The real power injection from the slack bus is given as
P S = R e V S T Y S N V + Y S S V S T
Assuming voltage deviation Δ V n , Φ = V n , Φ V ˜ n , Φ V ˜ n , Φ for solving linear power flow Equation (4), a lower bound on V n , Φ is now given as V ˜ n , Φ Δ V n , Φ , where V n , Φ is voltage (p.u.) in the presence of PV at bus n in phase Φ .
In the study, either a single-phase inverter or three-phase inverter or both may be installed at the potential bus, i.e., Ω n .

2.2. PV Inverter

With PV output being a function ( h ) of solar radiation (kWh·m−2·day−1) for rated (R) real power P Ω n R (kW) through inverter AC power rating S G , Ω n R the real power injection, corresponding to the base (B) load value, can be given as
P G , Ω n B = P Ω n R B h Ɛ Ω n B
S G , Ω n R B = P G , Ω n B + j Q G , Ω n B
The PV output curtailment term Ɛ Ω n is taken into account to keep the limit on overvoltage caused by excess PV generation.
Similarly, real and inverter AC power is written for changes in connected load condition, i.e., S L , Ω n is given as
P G , Ω n L = P Ω n R L h Ɛ Ω n L
satisfying constraints
P G , Ω n L = P Ω n R L , m a x ;   S G , Ω n L S G , Ω n R
Now, the change in PV inverter size at bus n is given as
Δ P Ω n = P G , Ω n B P G , Ω n L
In this study, the placement and size of both single-phase and three-phase PV inverter is optimized according to changes in the connected load condition. As such real and reactive power injection from the installed PV inverter is given as
R e S G , Ω n L = P G , n , 1 Φ L + P G , n , 3 Φ L = P G , Ω n L
I m S G , Ω n L = Q G , n , 1 Φ L + Q G , n , 3 Φ L
The back-forward sweep power flow algorithm is a better option for analyzing unbalanced radial distribution systems since it considers factors such as mutual impedance among phase conductors and different types of loads. The complete process includes: (i) assignment of initial nominal three-phase voltage at buses, (ii) calculation of branch current (backward sweep) starting from the most faraway bus and moving towards the grid connection (source) end, according to the type of loads modeled in the network, (iii) calculation of bus voltages in each phase, starting from grid connection bus to the last bus, (iv) calculation of voltage error, till its value is less than the predefined bus voltage error, (v) new power flow calculation with the integration of PV.

2.3. PV Power Curtailment

Each phase voltage V n , Φ at every bus is monitored. During the situation of overvoltage towards the upper voltage limits, the PV power is sequentially (partially) curtailed by a factor Ɛ Ω n L to bring down the voltage until an optimal solution of the objective function is achieved.

2.4. System Loss

Line loss cannot be avoided but can be reduced to an optimum level while achieving optimal placement, size, and number of PVs. The active power loss of the distribution network between bus n and m with the addition of PV unit is computed and limited to
P n , m l o s s P n , m l o s s , m a x Ɛ l o s s
Next, a new PV unit is added to the network in every iteration, and total system power loss is computed again. When increasing the number of PVs, the total power loss is checked regularly. If it has a lower value than the previous loss, then the PV number increases. This procedure is repeated until a higher value than the preceding one is achieved.

2.5. Objectives Function

The objective function towards optimal placement and size is formulated to minimize the PV systems installation, grid electricity import, and curtailed power costs, and it is written as:
m i n = n Ω n + s
The cost term Ω n takes into account the cost of PV (including the inverter) installation as single-phase and three-phase at candidate buses for optimal location in the network. The cost s is scenario dependent, which includes the grid electricity import cost and the economic loss due to PV curtailed power.
Equation (13) becomes a mixed integer second-order cone program due to the second-order cone constraint defined for:
  • The upper limit on voltage magnitude, V n , Φ   v m a x ;
  • Operational region of single-phase inverter or three-phase inverter, P G , Ω n L + j Q G , Ω n L S G , Ω n L .

3. Methodology

Figure 1a presents the layout of the IEEE 37-bus distribution network, showing the connected load and provision for installation of the PV system. For instance, bus #1 is shown to have a connected load in all three phases, and also, both single-phase and three-phase PVs can be optimally placed. On the other hand, bus #12 has a connected load only in phase C, and a single-phase PV can be placed in either of the three phases. It may be understood that three-phase, being balanced, results in lower voltage peaks. A single-phase connection may lead to a voltage rise in one of the phases, which can counter-effect due to the three-phase presence at the bus. Bus #1, 14, 17, 21, and 34 have three-phase PV installation in addition to the option for single-phase installation. Out of these buses, #1 and 21 have a load connected in all three phases. Other buses in the network have connected loads either in phases A, B, or C. The chosen IEEE 37 bus feeder has base power and line voltage of 2.5 MVA and 4.8 kV, respectively. The total load in the network is 1.009 + j0.4998 p.u. distributed among phases A, B, and C with values of 0.3582 + j0.2263, 0.2736 + j0.1557 and 0.3770 + j0.1177 p.u., respectively.
The optimization objective [15] is introduced in two stages; the first is on installation cost, while the second stage accounts for power input cost and economic loss due to excess power curtailment. The first stage determines the location of the PV installation and its initial capacity, and the second stage involves maximizing the investment benefits, keeping the voltage within limits, and minimizing the line losses. The objective function is solved as a mixed integer second-order cone program. The exact version of the flowchart [15] is not reproduced here, but it is represented in Figure 2 to align with the study. The optimization step begins with the placement and sizing of the PV inverter. The network and solar radiation data of three different locations are uploaded. The optimal placement and sizing objective function defined in terms of cost is solved based on the Z-bus method to compute the voltage at every bus V n , Φ .

Data Preparation

The uncertainty in system parameters is modeled via stochastic programming methods by random scenarios, according to probability distribution on measured data. On the one hand, the use of a few numbers of scenarios will degrade the accuracy and reliability of the optimal solution, while a large number of scenarios will incur a heavy computational burden.
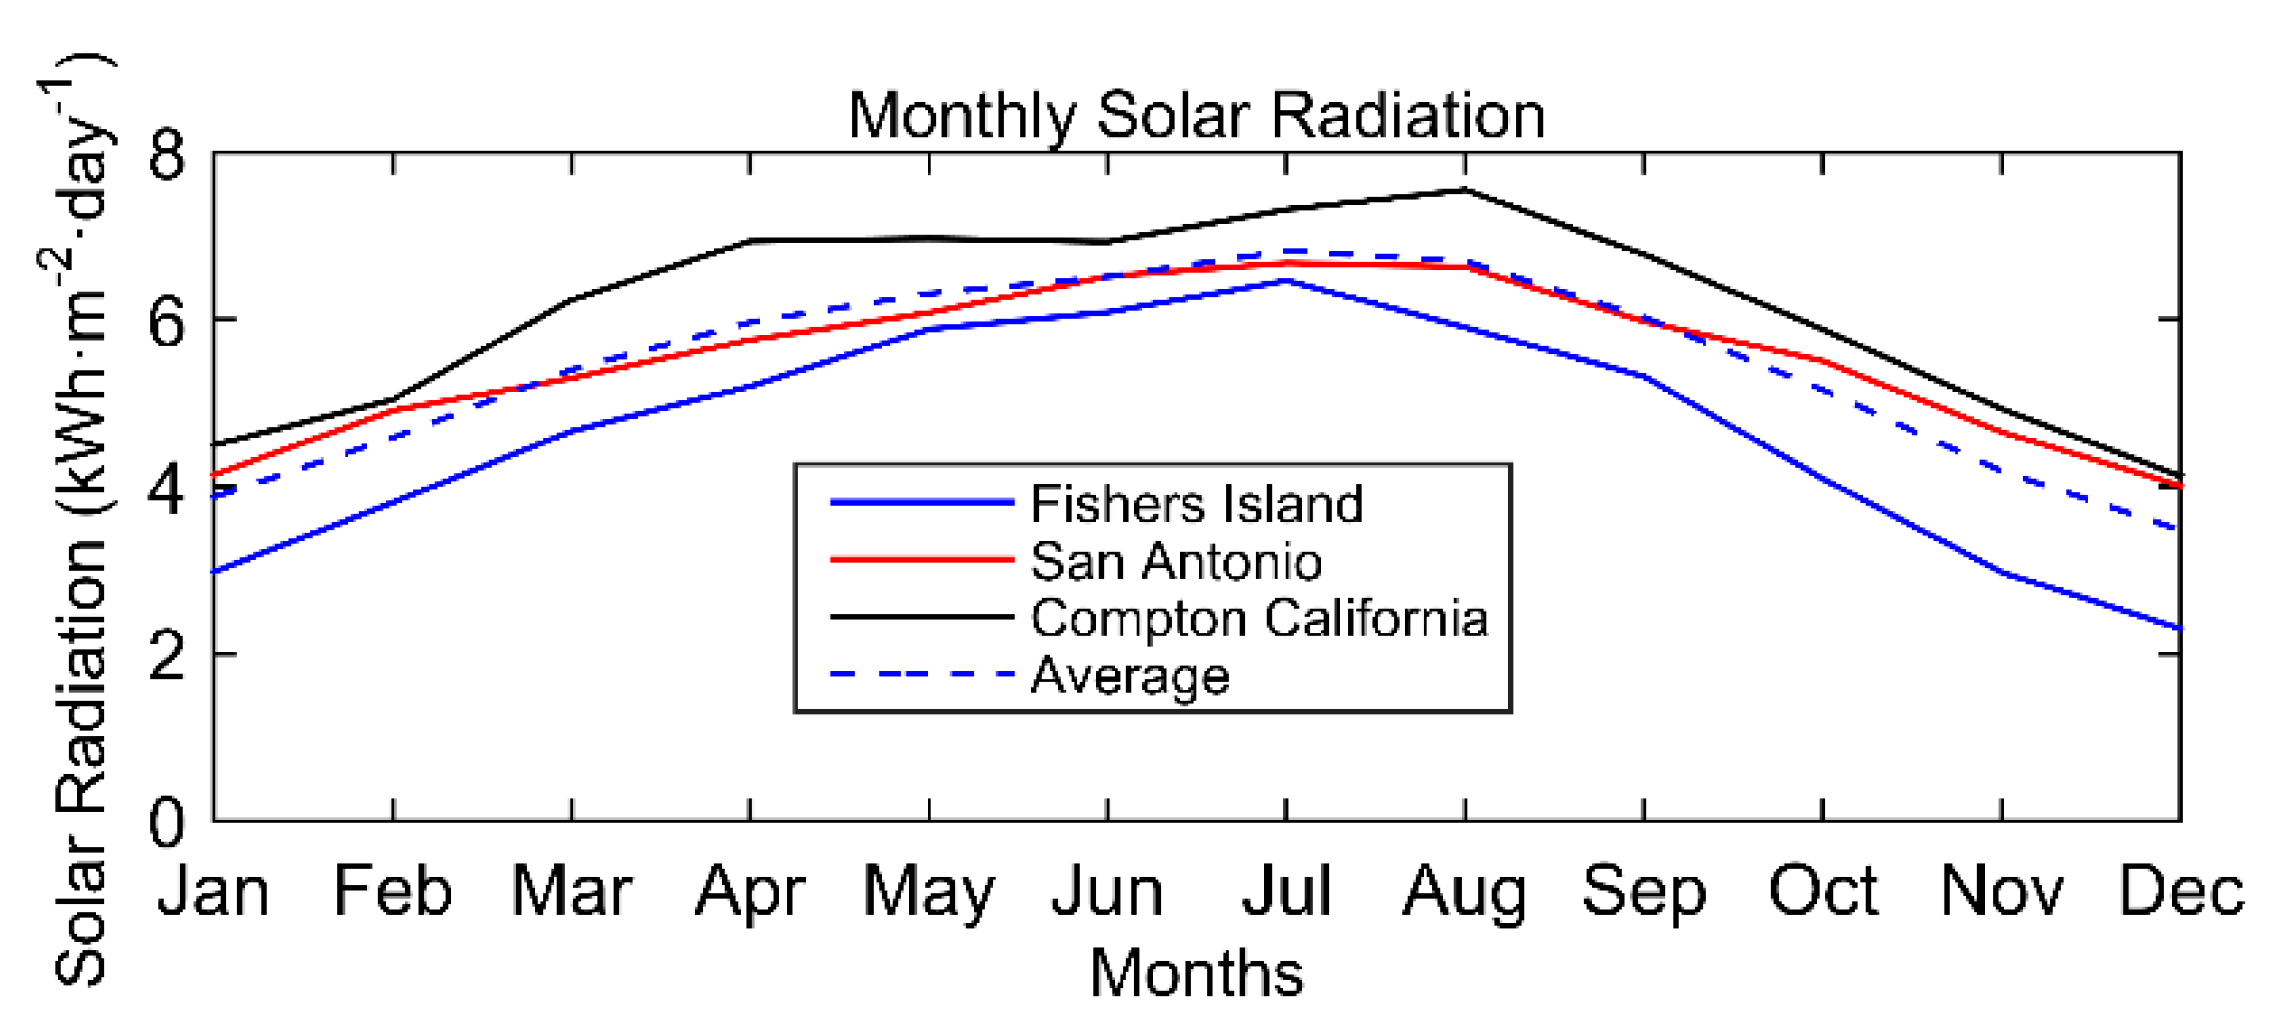
The solar radiation data for the year 2019 from three locations, Fishers Island (zip code—06390), San Antonio (zip code—78249), and Compton, California (zip code—90224), is downloaded from [42] having 4745 samples. The monthly solar radiation profile for the year 2019 is illustrated in Figure 2, wherein, during the discussion, these profiles are referred to as low (Fishers Island), medium (San Antonio), and high (Compton California). The categorization of solar radiation profiles as low, medium, and high is considered on the basis of their distribution throughout the year.
An uncertainty analysis is performed to consider the stochastic variation in solar radiation/PV output power and the variability of load demand. Monte Carlo sampling is applied to generate 5 random scenarios of PV output and load demand based on a Gaussian distribution function (with the standard deviations equal to 5% and 2%, respectively, of the expected values). Next, the reduction of the data set using Kantorovich distance is applied so that its value is 0.2231, 0.1339, 0.0674, 0.0527, and 0.0427 for Fishers Island, 0.2331, 0.1393, 0.0691, 0.0563, and 0.0448 for San Antonio, and 0.2588, 0.1601, 0.0711, 0.0559, and 0.0465 for Compton California respectively so as to fit the best approximations of variable uncertainty. With the connected load change k Ω n introduced in the phase at a time, the given algorithm is run for solar radiation from three different locations.

4. Results and Discussion

The algorithm is run for the placement and sizing of the PV inverter at every bus for the base load conditions. Equation (8) computes the change in PV inverter size on every bus for load change conditions against those at the base load. The load flow is run during the optimization and validation steps to compute the corrected and validated voltages at every bus. The voltage violation in the set v m i n , v m a x corresponding to the corrected and validated voltages is computed at the base load condition in the network. Next, the voltage violation set is determined at load change conditions. In order to understand the impact of unbalance levels on different buses in the same branch, PV inverters are optimally placed and sized for different changes (in percentage) in loads applied from the base value.
The maximum (max) and minimum (min) voltage limit at every bus is set as v m i n = 0.9   p . u . , v m a x = 1.1   p . u . Now, the voltage change at every bus is determined as the difference of voltages for the load change conditions against the base load. The statistical value of the voltage index, V n , Φ i n d e x to quantify the voltage variation throughout the network at every bus is used, given as:
V n , Φ i n d e x = i = 1 n 1 V n , Φ 2

4.1. Placement and PV Inverter Size

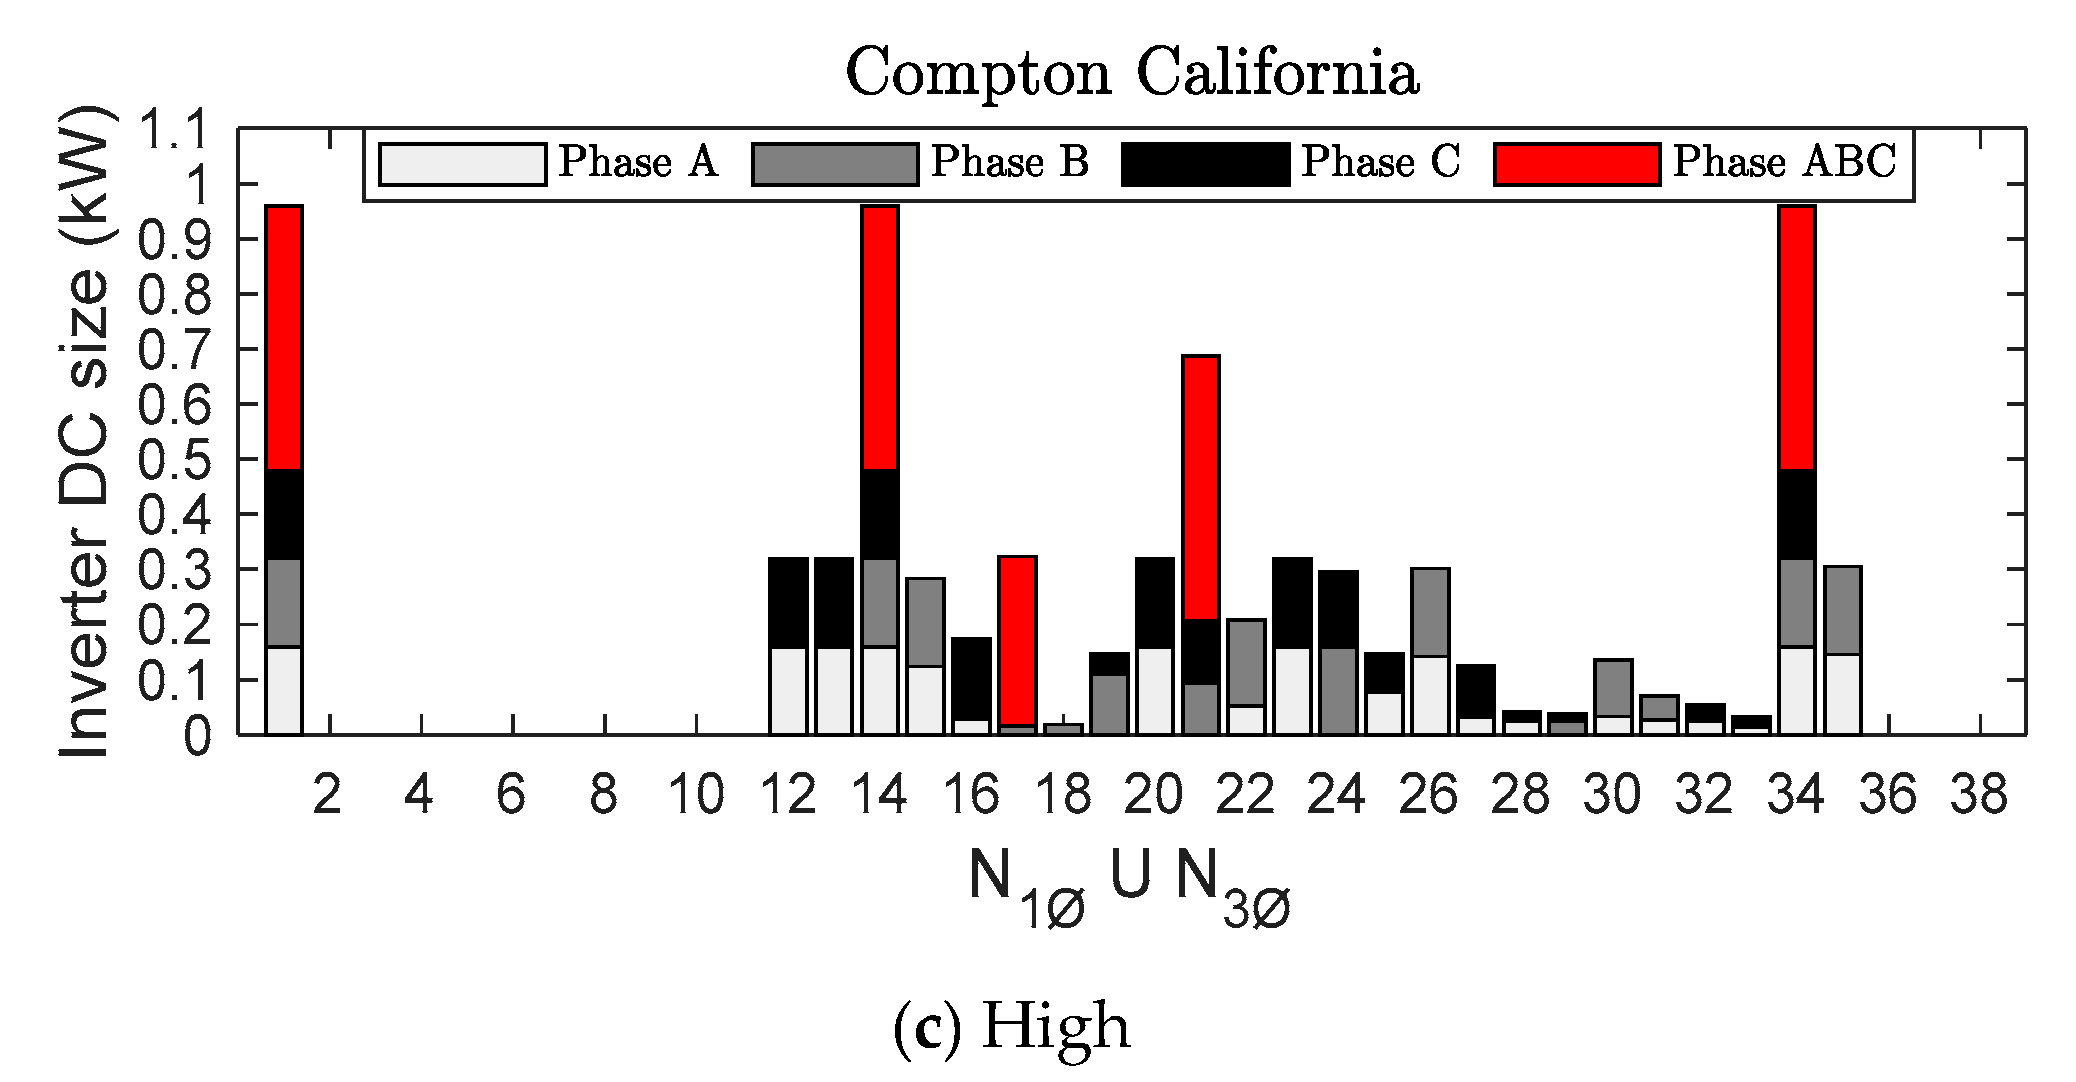
The discussion of the results begins with an investigation as a reference presented for existing base load conditions in the IEEE 37 bus network. The three-phase PV system is selected to be optimally placed at buses #1, 14, 17, 21, and 34. The optimal placement of the single-phase PV across the network for three different solar radiation profiles can be observed in Figure 3. The inverter size of optimally placed PV resources can also be noted in said figure. As suggested in Figure 3a, for a low solar radiation profile, a single-phase inverter accounts for just 15.08% of the total PV generation. Single-phase PVs are not located on buses lying in region 1. With a medium solar radiation profile, in Figure 3b, bus #1 has the largest size of the inverter, placed in all three phases. As can be observed in Figure 3c, most of the buses have placement of the PV system in at least two of the phases and single-phase PV installation accounts for 70.52% of the total PV size. The high solar radiation profile results in comparatively greater PV installation across the network. Bus #1, 14, and 34 have PVs installed as both three-phase and single-phase in all three phases.
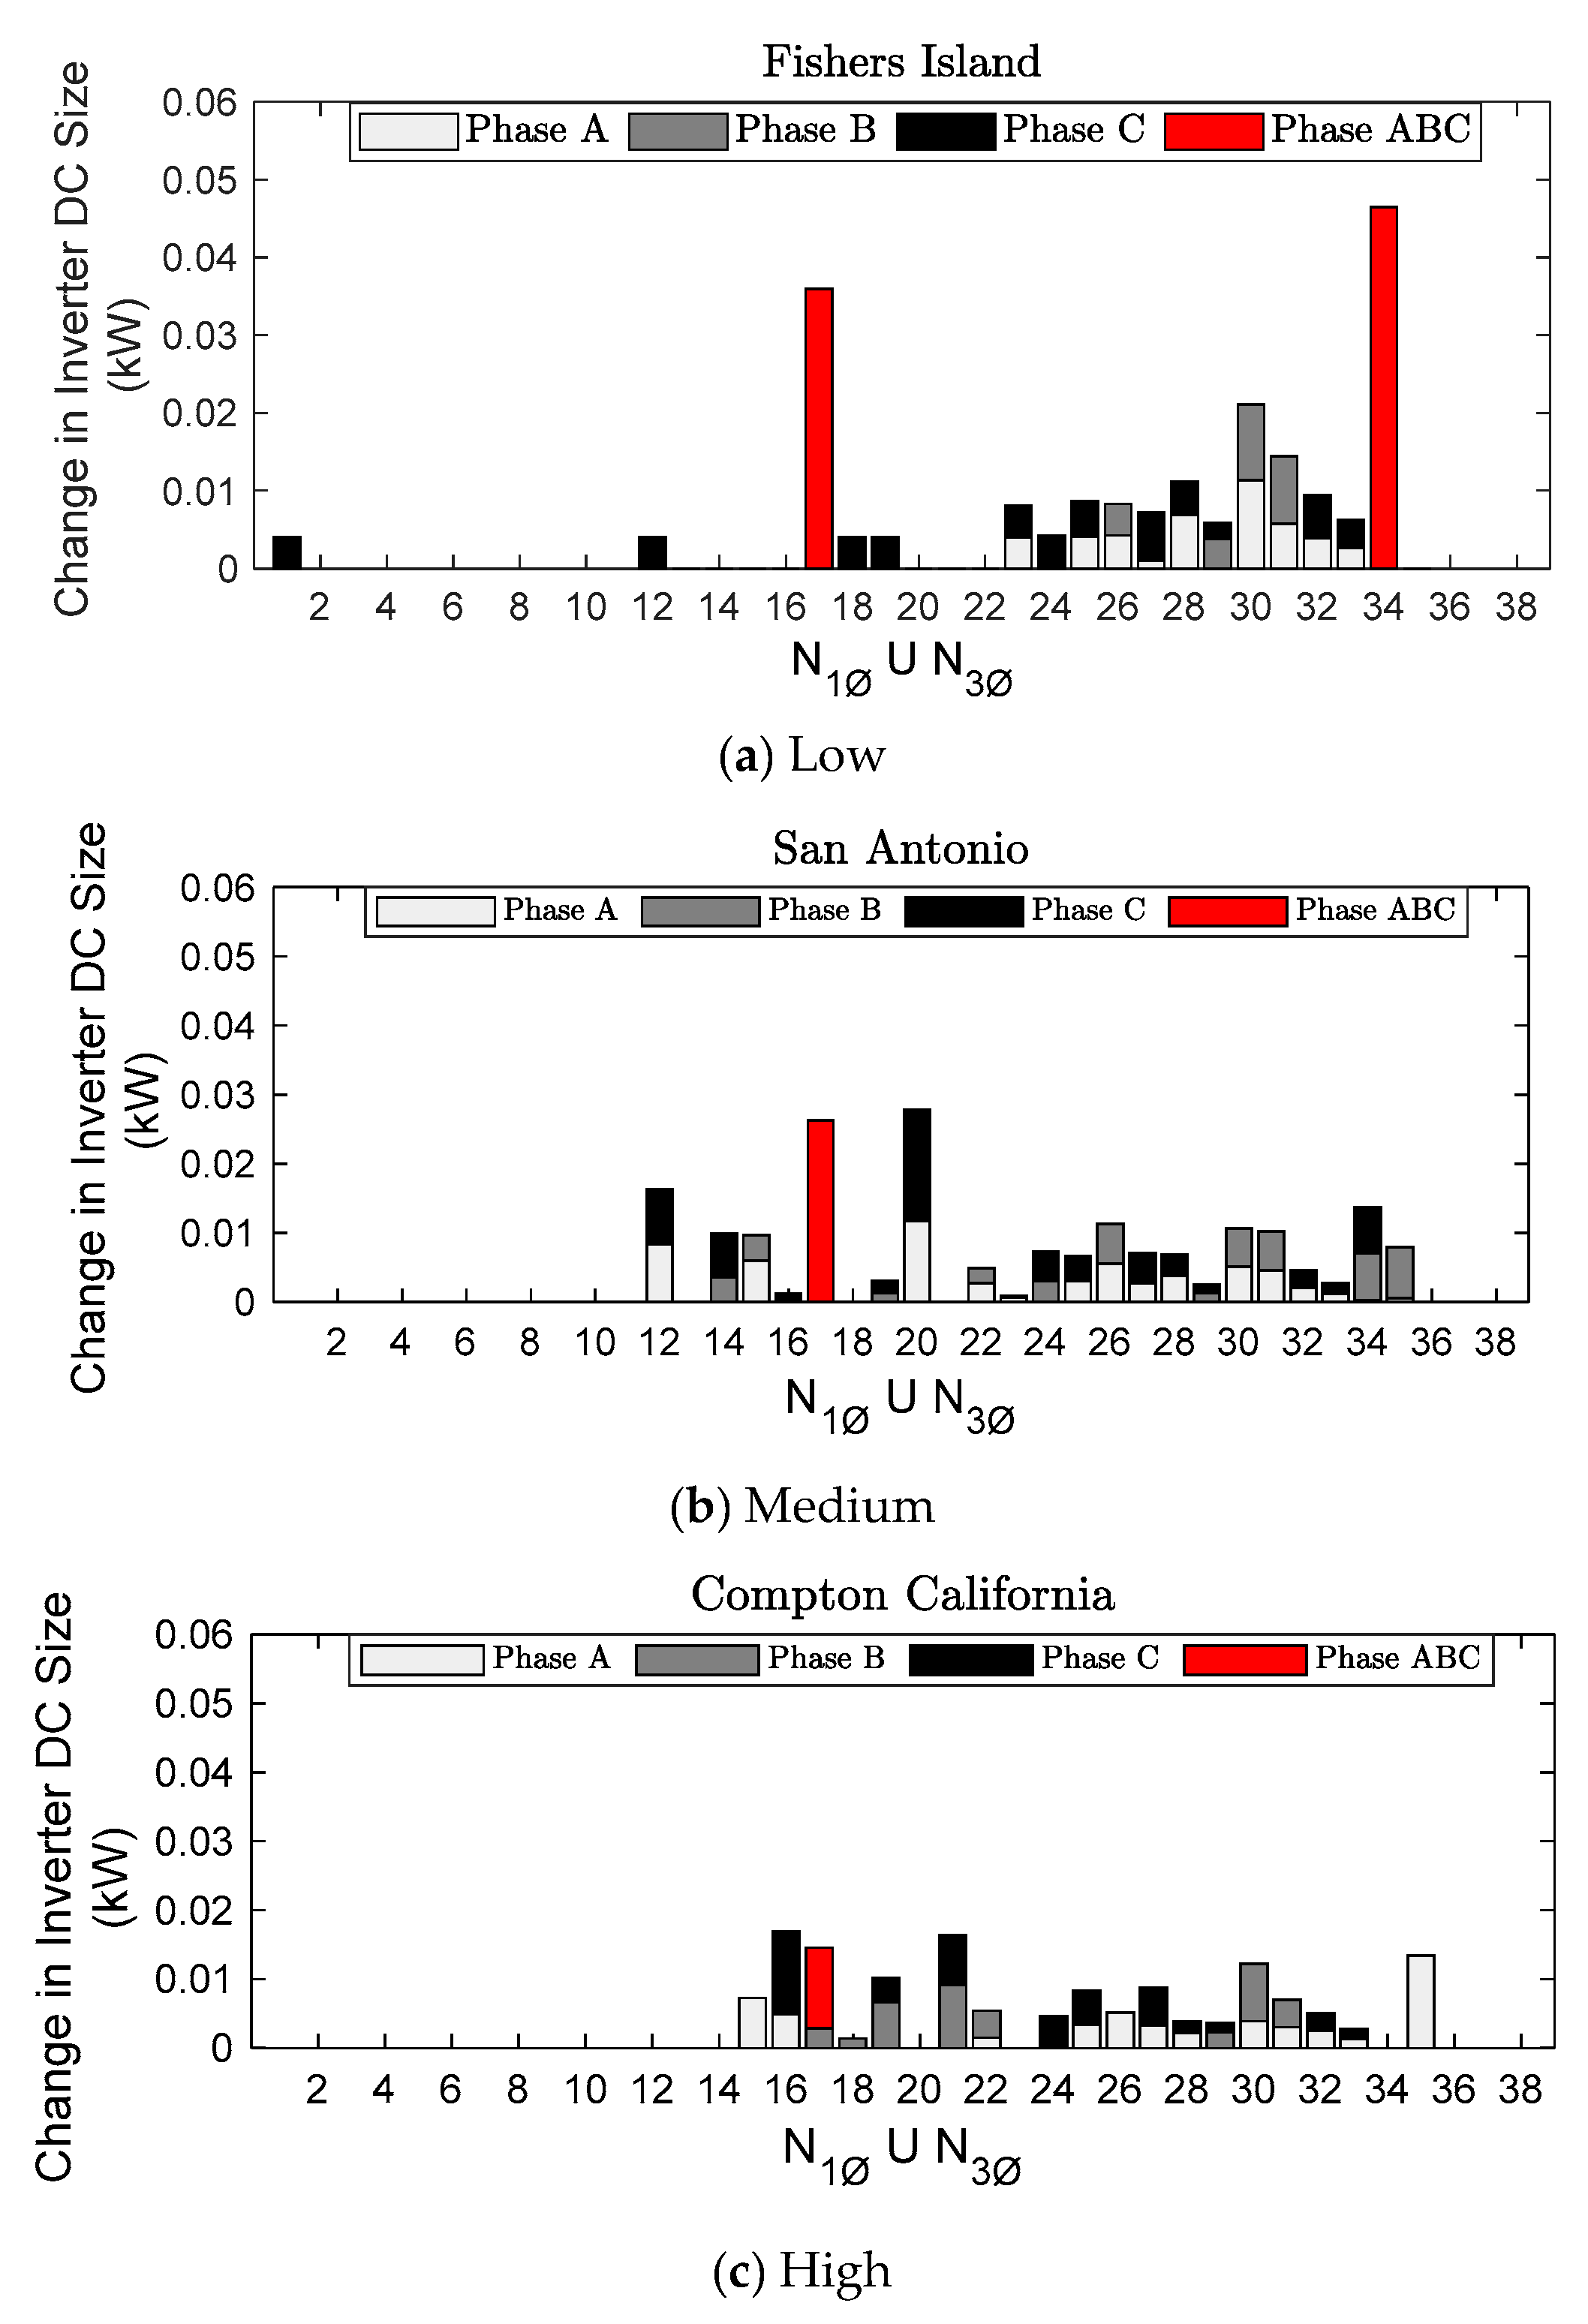
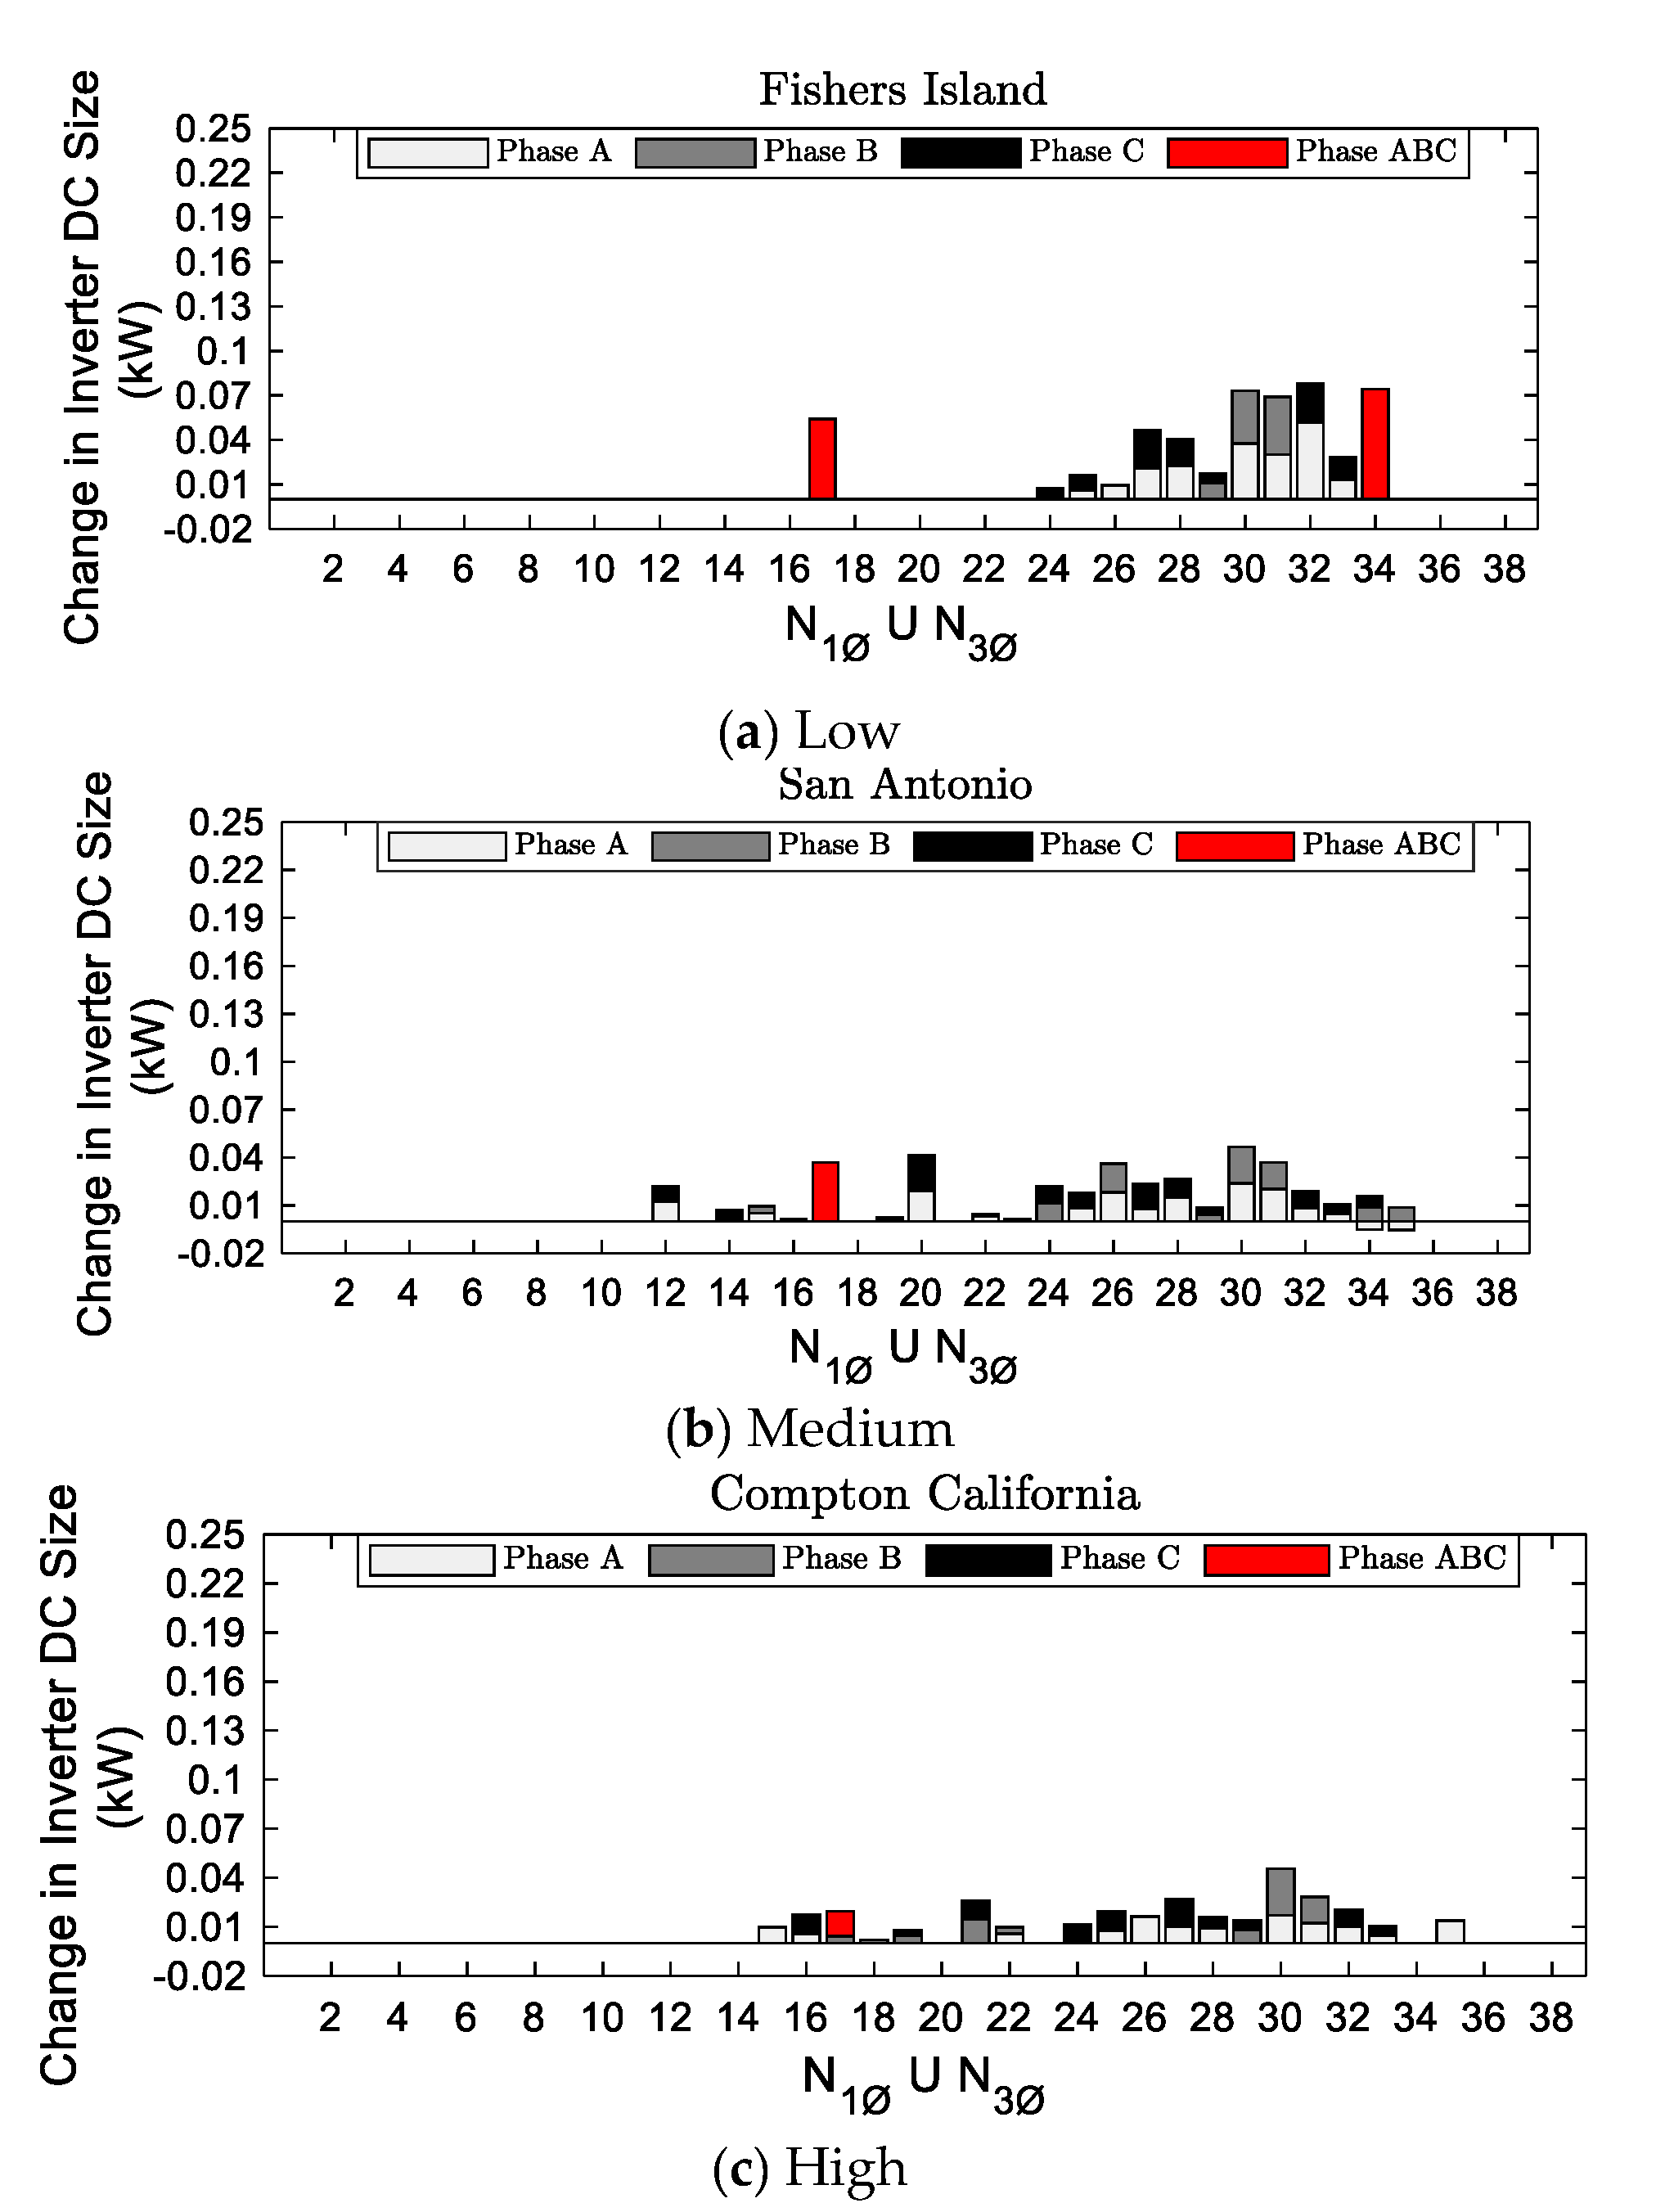
The analysis is further extended, with the connected load increasing by 10% in all phases. The change in inverter size for the said condition with respect to the base load condition is computed and shown in Figure 4. There is an addition of three-phase PV installation at buses #17 and 34. Moreover, changes are applied for single-phase PVs but not uniformly throughout the network. With a low solar radiation profile, buses (in region 2) that are far away from the grid connection have larger inverters placed than nearby buses (in region 1). Altogether, phase A and phase B share 21.64% and 12.92% of the total PV installed.
On the other hand, with a medium solar radiation profile, the change in inverter size in regions 1 and 2 is 63.51% and 36.49%, respectively. Similarly, with high solar radiation profiles, this percentage margin between regions 1 and 2 becomes closer and amounts to 55.81% and 44.19%, respectively, out of the total PV capacity installed. Note a larger share of installation is at buses in region 2. Additionally, no PVs are located on buses where there does not exist any connected load.
It is quite obvious to expect an increase in PV installation for increased connected load, as illustrated in Figure 5. Having a load increase by 40% in all phases leads to major changes in inverter size at buses located in region 2, with 60.68% of the total PV capacity. This is shown in Figure 5a for the low solar radiation profile. The largest three-phase inverter size change takes place on bus #17. Similarly, as discussed above, for medium and high solar radiation profiles, the share of PV installation in region 2 of the network remains higher, as indicated in Figure 5b,c. Further, it is indicated that the change in inverter size for medium and high solar radiation is 44.66% and 34.62% of the total size change reported for the low solar radiation profile. Three-phase installation takes place only on bus #17.
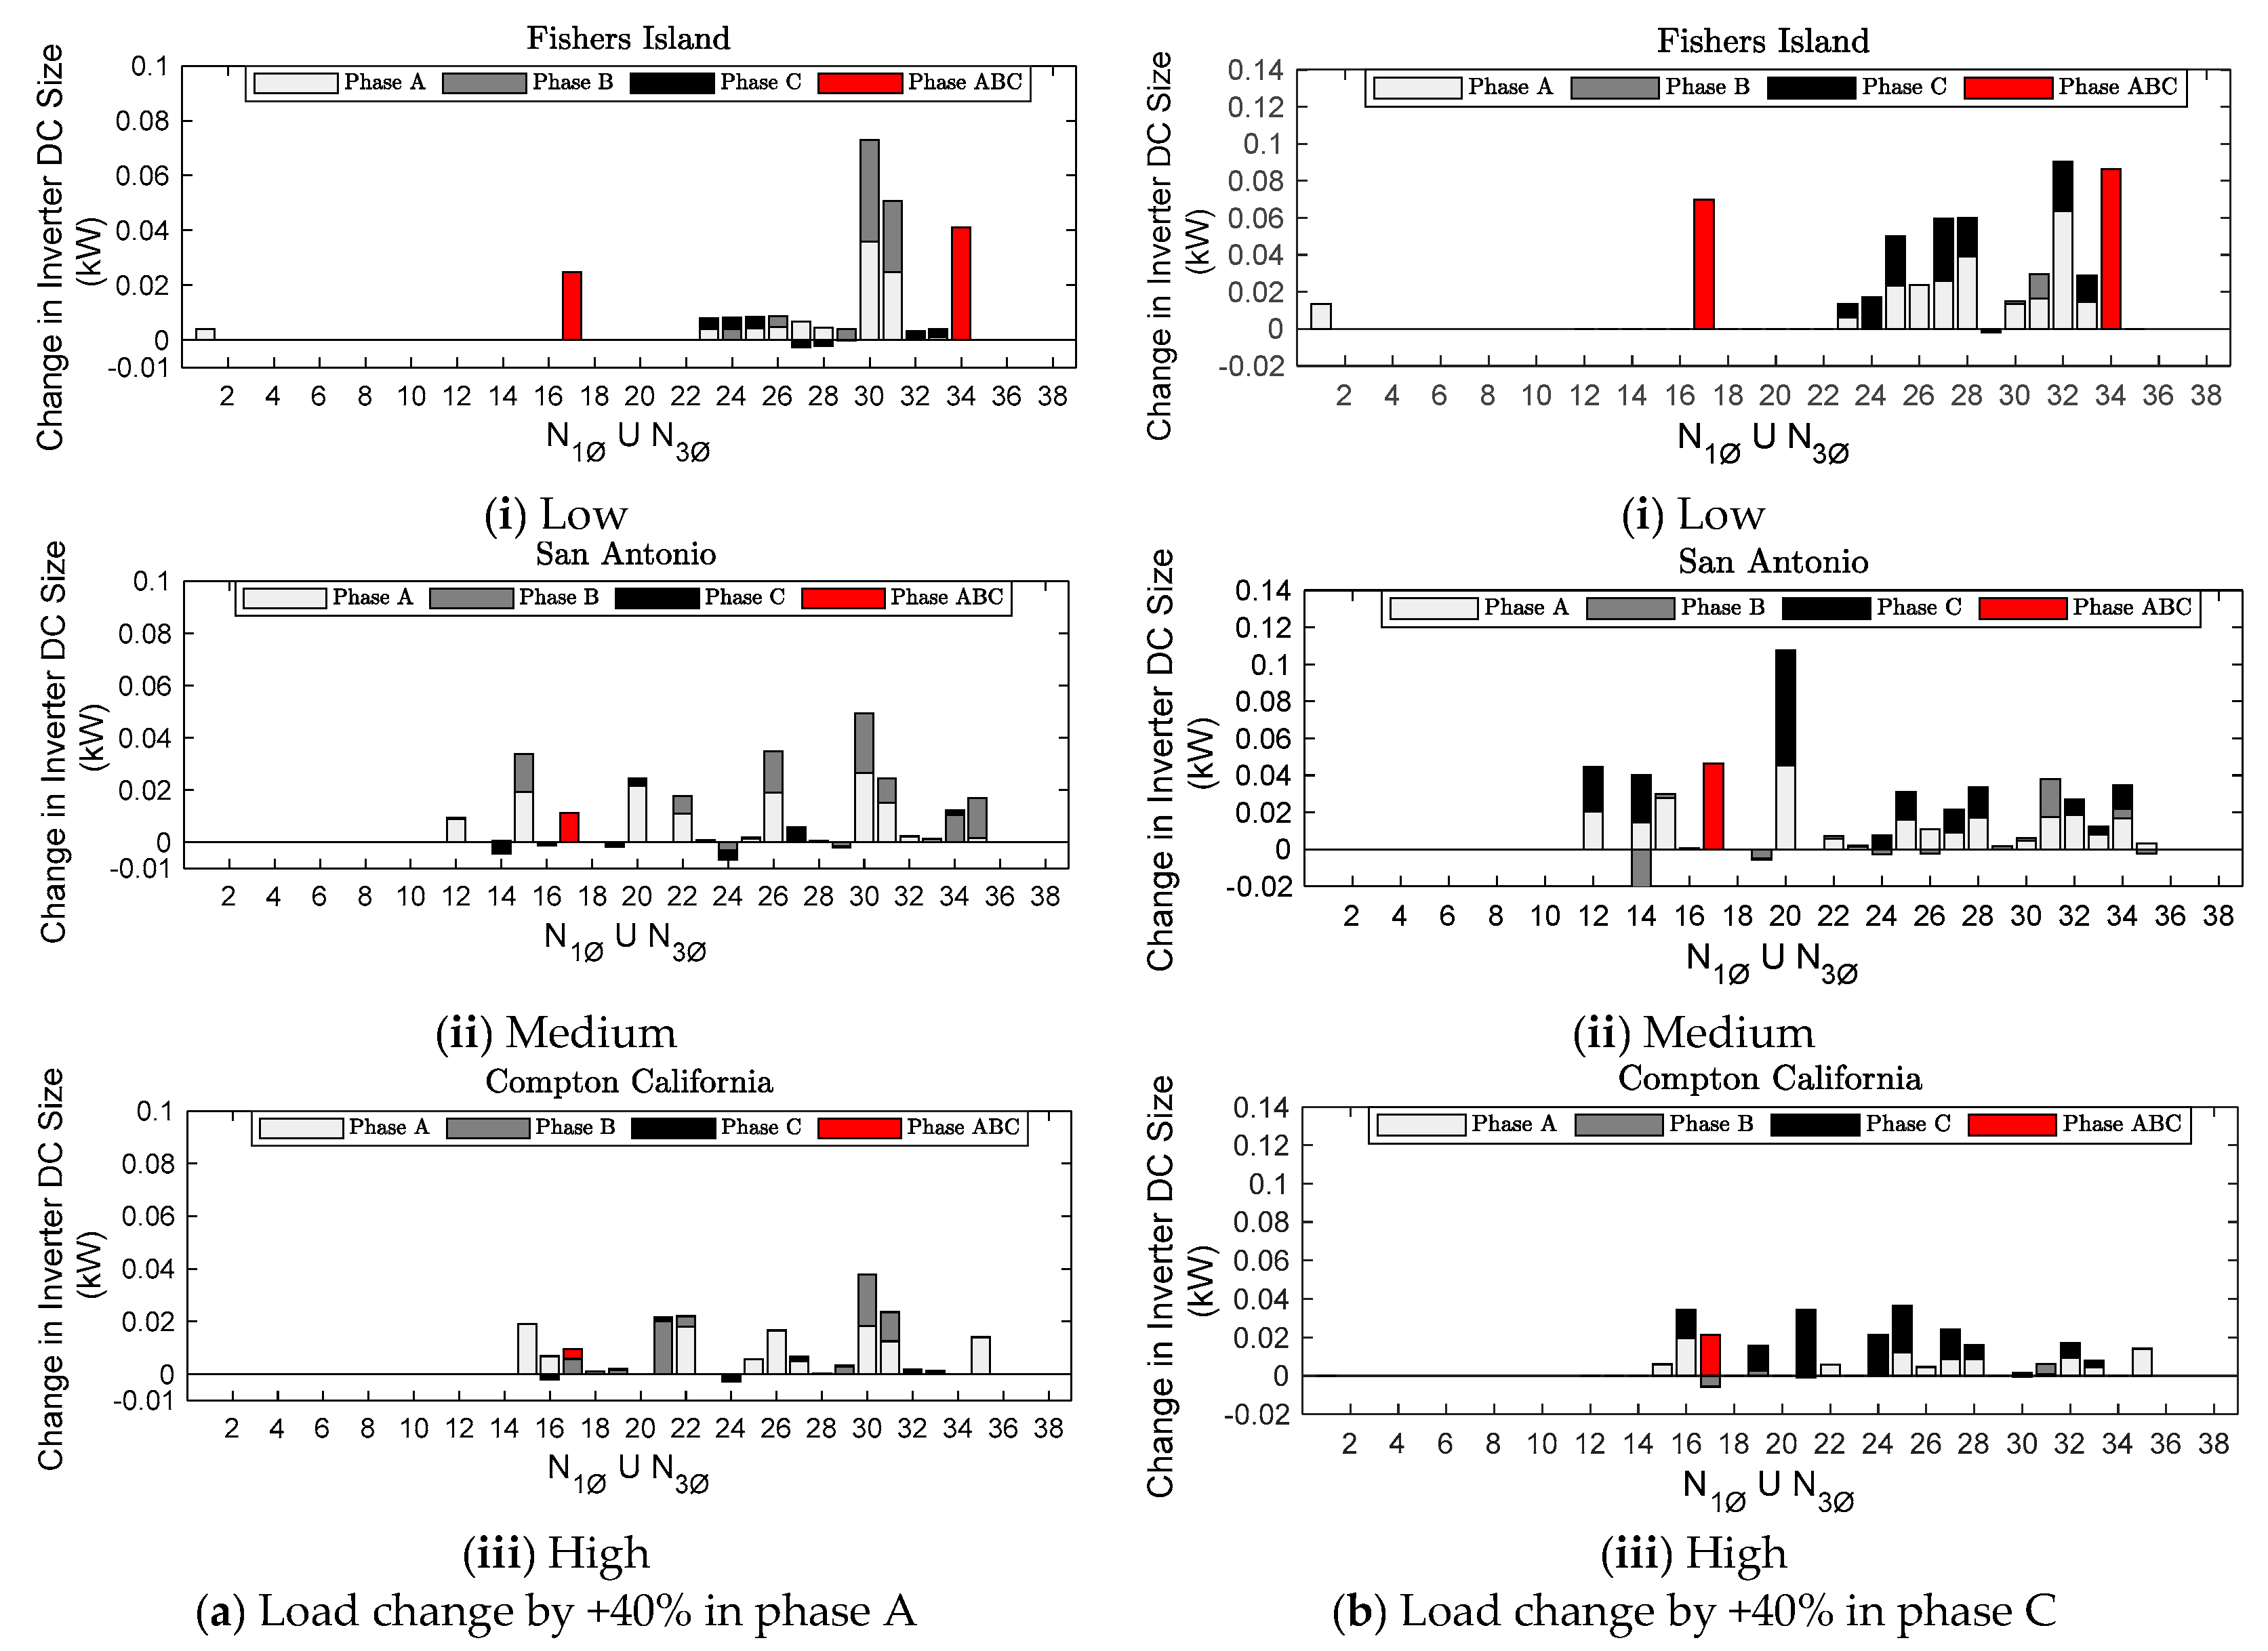
Considering a load increase of 40% in phase A only, the changes in inverter size obtained for three solar radiation profiles are shown in Figure 6a. The single-phase PV installation, mostly on buses in region 2, can be observed in Figure 6a(i). The increase in the connected load in phase A is also shared by the three-phase installation of an amount of 27.01% with a low solar radiation profile. On the other hand, this distribution remains similar for most of the buses in region 2 for medium and high solar radiation, as suggested in Figure 6a(ii,iii). Phase A accounts for 36.96%, 55.76%, and 62.27% of the total PV installation for low, medium, and high solar radiation profiles, respectively. In other words, with a low solar radiation profile, the reduced PV installation in phase A is compensated with a three-phase installation. Further, to note for medium and high solar radiation profiles, there is a negative change in the inverter size, i.e., at these buses, the size of the PV installation with respect to the base load is reduced.
Similarly, as shown in Figure 6b(i), with a low solar radiation profile, phase A and the three-phase PV installation share a maximum contribution towards the increased load (+40%) in phase C. Moreover, the distribution remains uniform at most of the buses in region 2 for medium and high solar radiation, as suggested in Figure 6b(ii,iii). Phase C accounts for 26.31%, 40.21%, and 54.81% of the total PV installation for the low, medium, and high solar radiation profiles.
Now, the study is extended to the assignment on optimal placement and size of PV installation against changes in connected load in the two regions. Figure 7a shows that bus #17 and 34 (in region 1) includes three-phase PV installation. The remaining buses in region 1 have single-phase PVs installed only in two phases. There are no PVs located on the buses, which do not have any connected load. On the other hand, it is also indicated that PV integration is more uniformly distributed at buses located in region 2, as compared to region 1. This is expected since only a single-phase load (Figure 1) distribution exists across the buses in region 2. With a medium solar radiation profile, the changes in inverter size are insignificant, as depicted in Figure 7b. In other words, for the amount of solar radiation available, there cannot be further addition of PV systems in the network for increased load demand. None of the buses have the addition of single-phase PV in all three phases. Similarly, as shown in Figure 7c, adding a PV inverter accounts for 5.18% of the total amount at the base load condition.
With the connected load reversed between the regions, the results are shown in Figure 8. No change was observed in placement (mainly in region 2) and size of the PV inverter for the low solar radiation profile, as shown in Figure 8a against the above-discussed case. One exception has a comparatively increased three-phase inverter at bus #17. The increase in the inverter size noted for medium solar radiation is just 12.58% of the total PVs installed at the base load. From Figure 8b, regions 1 and 2 shares 76.38% and 23.62% of the total PV installed for this load distribution. Bus #14 and #34 have single-phase PV installation in all three phases. Similarly, with a high solar radiation profile, regions 1 and 2 shares 72.64% and 27.36% of the total PV installed, as depicted in Figure 8c. Even with the increased 40% connected load in region 1, some buses (#12, 13, 14, 20, 23) with single-phase loads do not have any PV installed. Additionally, bus #16 indicates a negative change in PV installation.

4.2. Discussion on Voltage Index

The assignment on optimal placement and size of PV is based on the available solar radiation and the connected load demand in the network. The algorithm should compute the number of PVs integrated into the distribution network while maintaining the allowable voltage limits. When a PV system installed at a given bus is subjected to active (reactive power) generation (injection), the corresponding active/reactive power injections at bus n will also change. The buses, which do not have any PV installation, enforce zero power injections.
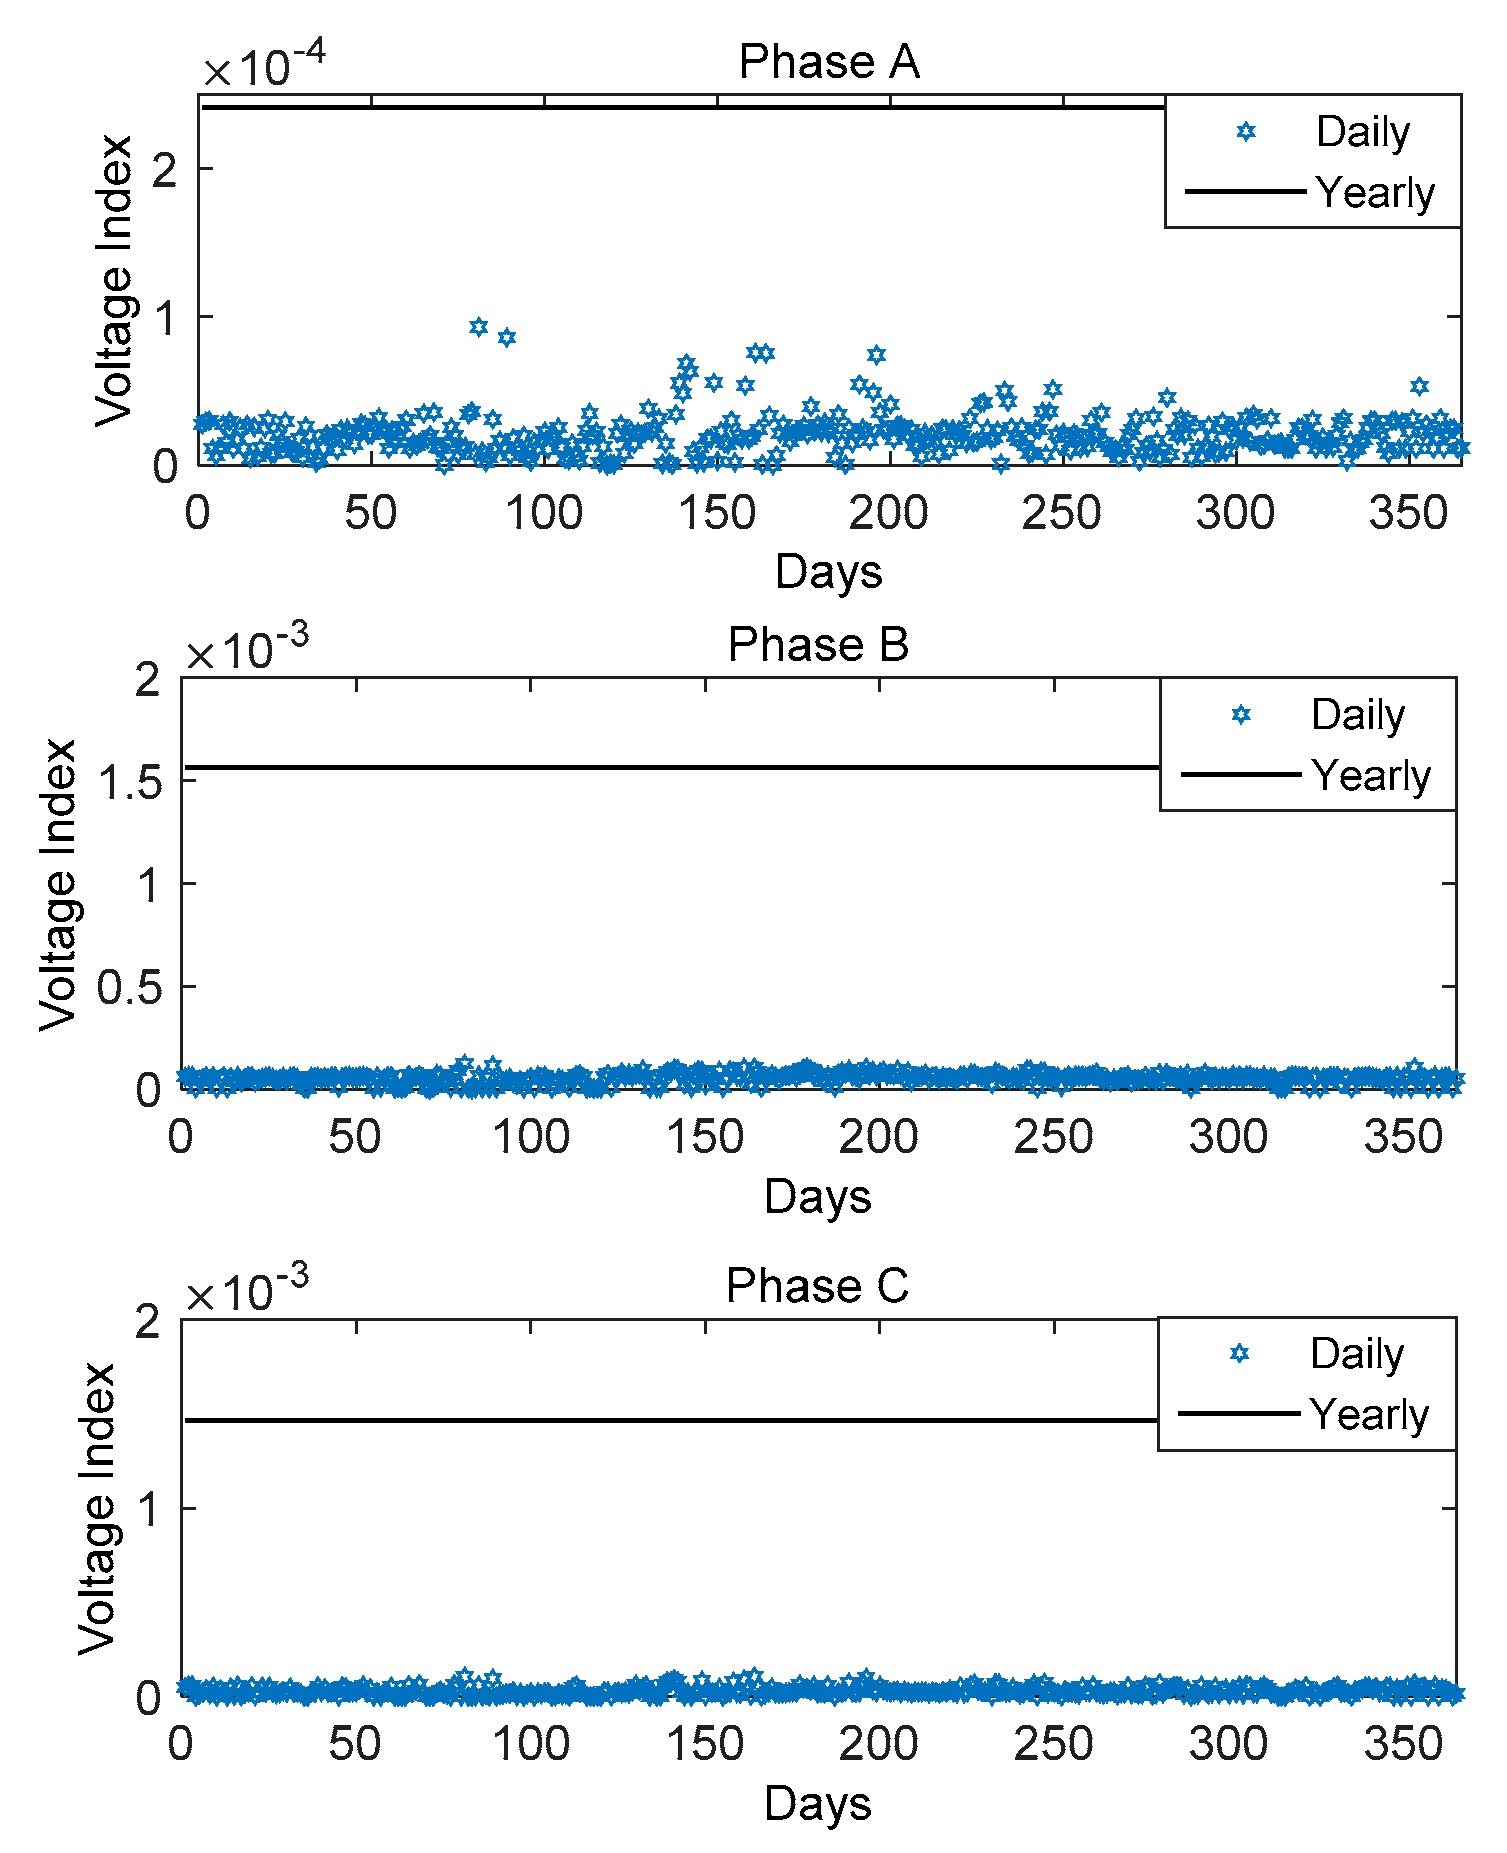
The calculated value of the voltage index throughout the network, using yearly and daily solar radiation data, is shown in Figure 9. The daily calculated values lie far lower throughout 365 days than the average yearly value. The scatter of the voltage index in phase A is sparsely placed.
Figure 10 indicates the maximum and minimum voltage index maintained throughout the network in a month. With placement and size of the PV installation obtained for the base load condition, it is possible to achieve a minimum value of voltage index close to zero. Additionally, its value remains in the same range as those calculated using daily solar radiation data. This analysis makes it difficult to say anything about the voltage limit violations. The maximum value of the voltage index for these three phases is found for the month of March, which does not coincide with maximum PV generation in accordance with available solar radiation (Figure 1). On the other hand, during the summer months (May, June, and July), the variation in the maximum voltage index follows the solar radiation pattern. Furthermore, for Phase B, during the month of December, the maximum-minimum voltage index is at par with those of the summer months. The difference between the maximum and minimum values is found to be the least for several months in phase A.
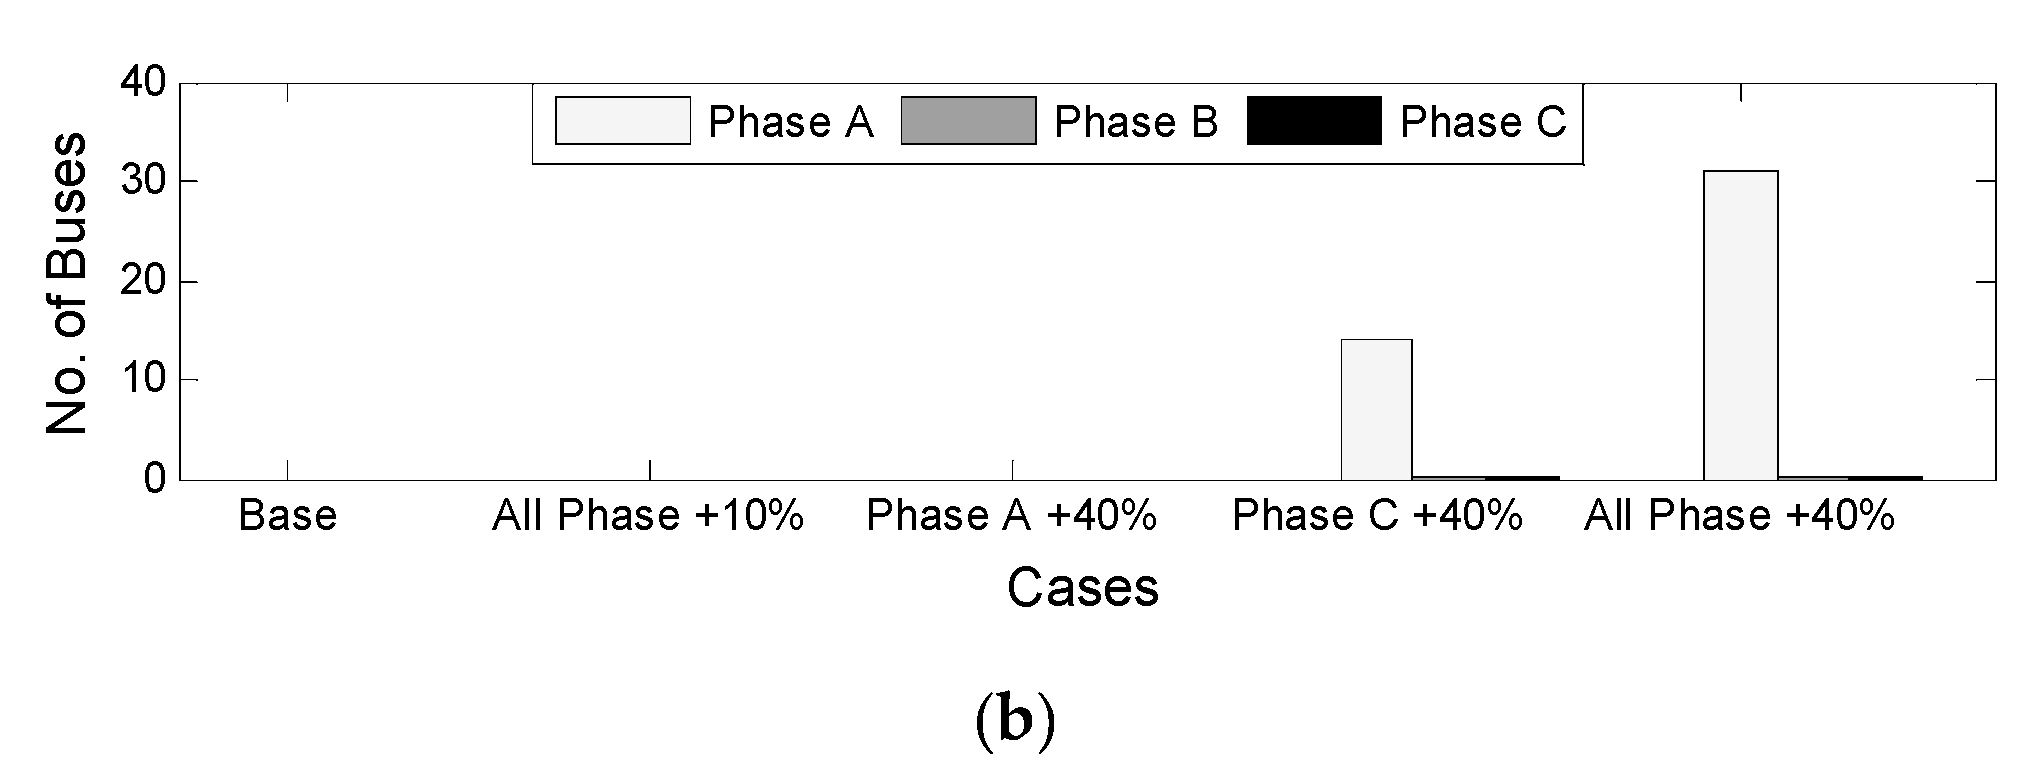
The calculated bus voltage of each phase is shown in Figure 11a. The minimum/maximum value of voltage in the network beyond the acceptable range corresponds to the voltage collapse condition. As can be seen, phases A and C result in a higher number (worst) of violations compared to phase B. Furthermore, phase A includes voltage violations on both sides, higher and lower, while phase C has violations only on the higher side. In fact, phases A and C experience upper voltage limit violations every day, while phase A also undergoes lower limit violations on 42 days in a year. The algorithm running on average daily solar radiation data reveals voltage violation on several days, which could not be observed with the solution obtained using yearly data (Figure 9). Figure 11b shows the total number of buses that violate the voltage limits, which is significantly indicated in phase A. This voltage violation is suggested for an additional 40% load in phase C and all three phases.
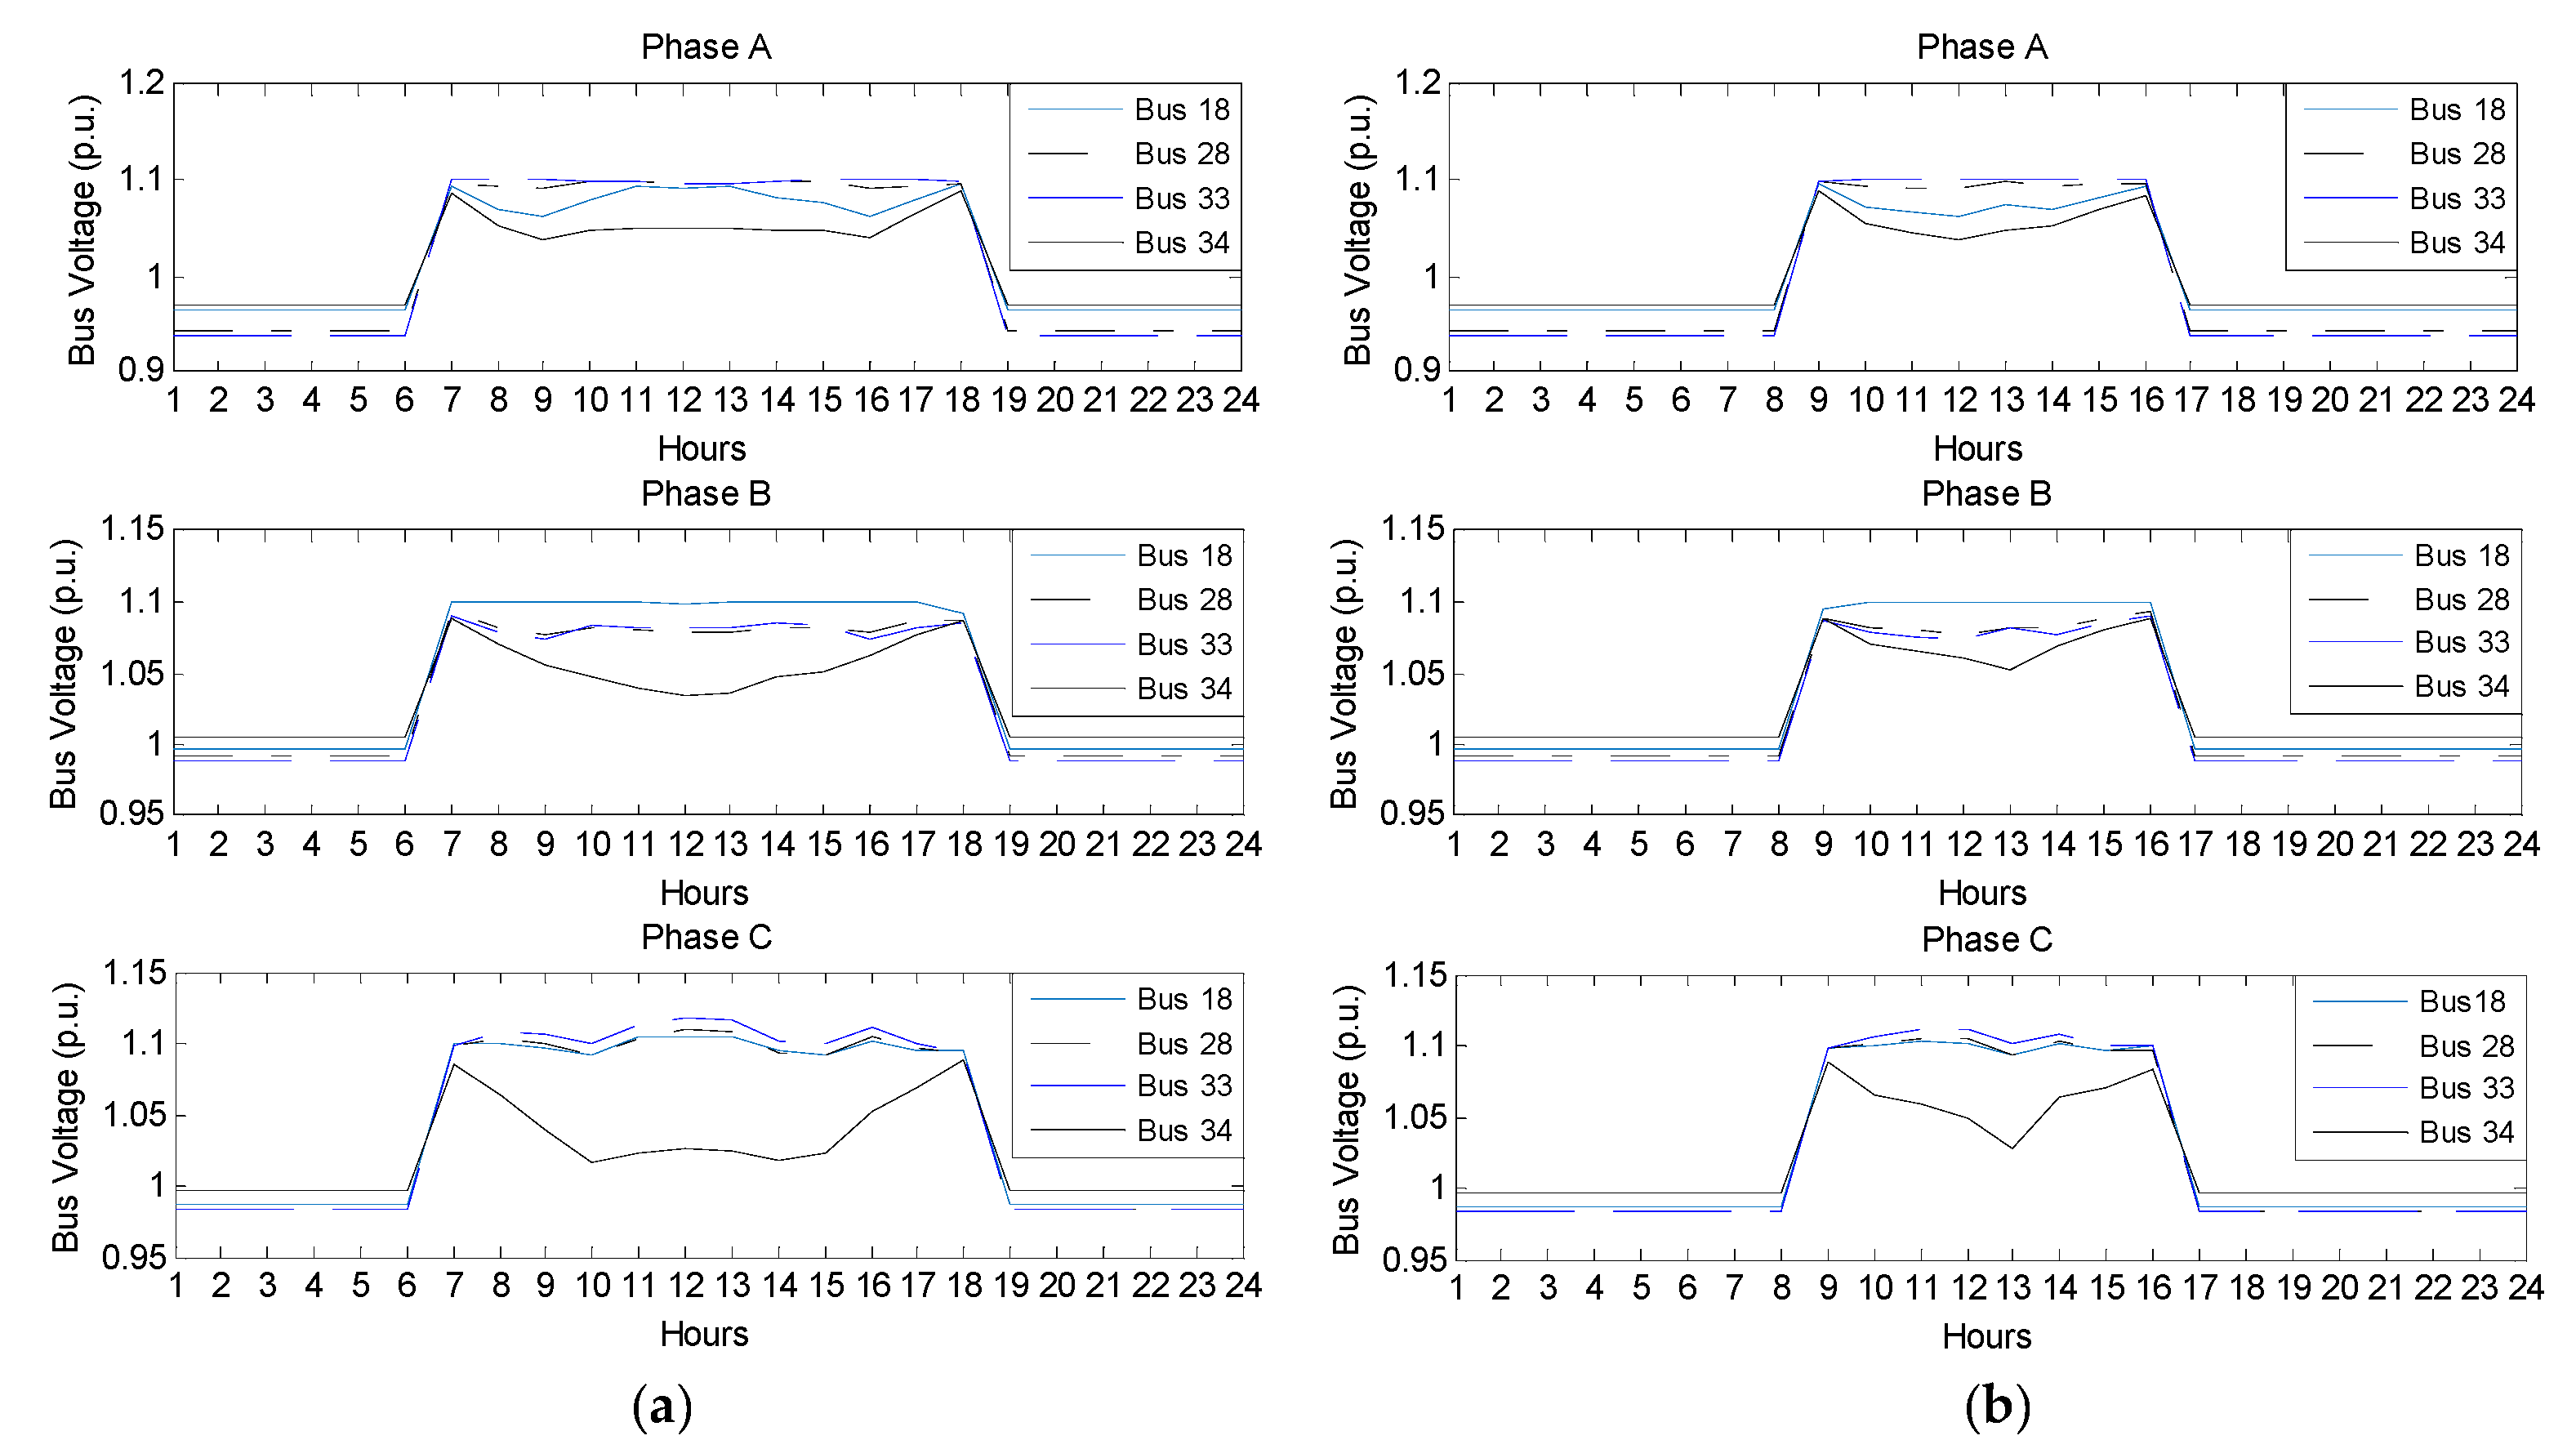
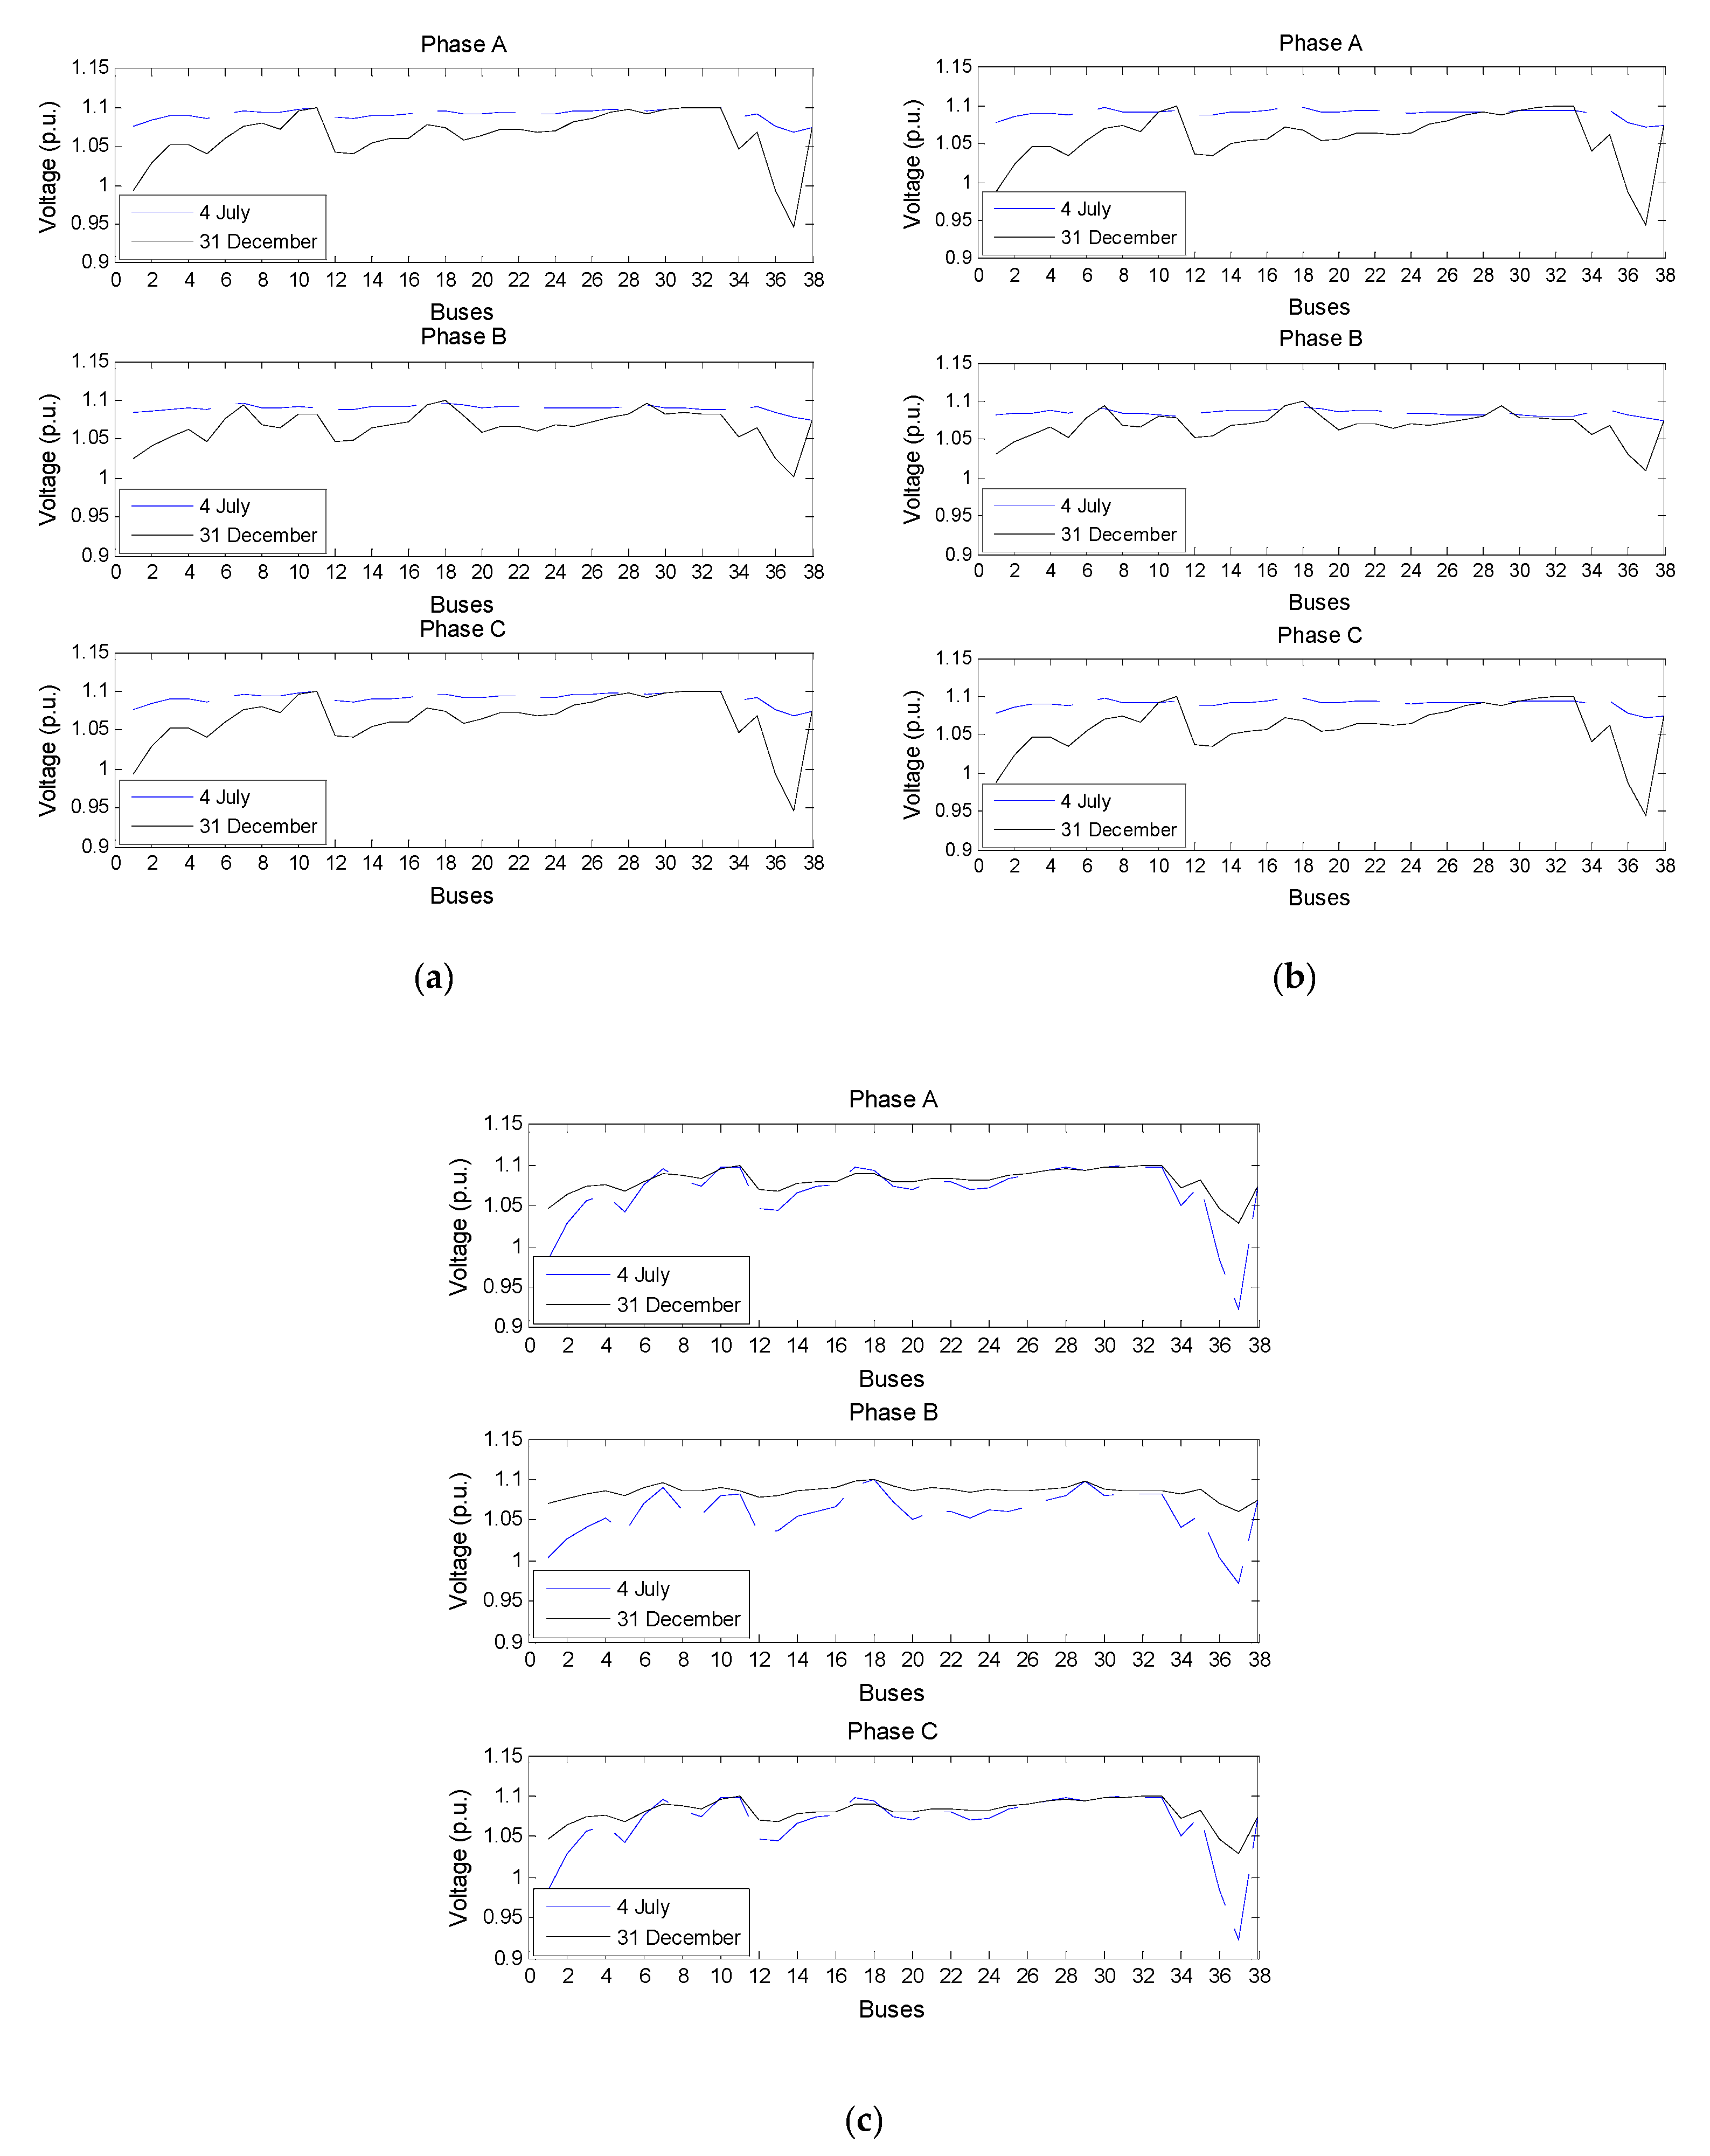
Next, the solution of the algorithm to satisfy the voltage constraint at the feeder end node for hourly data is discussed. It would be interesting to investigate the duration of overvoltage violations throughout the day. The variation in voltage profile at feeder end buses throughout the 24 h for a day during summer and winter months, with low solar radiation, is shown in Figure 12. Two feeder-end buses, #18 and 34, are located at extreme points toward the grid, while the other two feeder-end buses, #28 and 33, are at the opposite end of the grid connection. Only bus #34 has a connected load in phases A and B, with optimal PV placement as single- and three-phase. The remaining feeder end buses, #18, 28, and 33, have a load connected in phases B, C, and C, respectively, and can have single-phase PV installation.
During the sunshine hour, at bus #18, phase B keeps its voltage at maximum violation limits (middle subplot). On the other hand, phase C of said bus violates the limits. Phase C, at bus #28 and 33, experience voltage violation (sudden rises) during a certain period of sunshine (lower subplot), while phase A reaches maximum voltage limits. This means the integration of a single-phase PV influences not only an increase in the voltage of the phase having a connected load but also one of the other phases as well. This is attributed to non-uniformity in the amount of PV installed among the phases.
Important to note that bus #34 (load in phases A and B), having three-phase PV installation, keeps the least variation in voltage profile without reaching the voltage violations. Such an installation performs satisfactorily in keeping the voltages within the set limits, as constrained by the optimization algorithm. In other words, the sensitivity of the voltage magnitude is less for the bus, which has three phase PV installation, towards the injected active power or reactive power as compared to the ones that have a single-phase PV.
Having PVs installed in the network for summer and winter days, the variation in bus voltage is shown in Figure 13. This study is carried out for different connected loads. The variation in bus voltages reaches a maximum violation limit for summer days, while for winter days, at most of the buses, it remains lower, as shown in Figure 13a. Important to note that the pattern of variations in bus voltage of phases A and C are similar. For winter days, bus #10 connected through feeders to #27, 28, and 29, all having a single-phase PV installation and experiencing the maximum voltage violation limit. This can also be found for bus #11, connected through feeders to #30, 31, 32, and 33. Similarly, for phase B, bus #7, connected through feeders to #17 and 18, reaches a maximum voltage close to that of a summer day. Note that bus #17 involves both single- and three-phase PV installation, while #18 is a feeder end bus. Figure 13c presents the bus voltage variation for a high solar radiation profile obtained at an additional 40% load connected. In this case, the bus voltage variation for winter days remains above the summer days for most of the buses in the network. The voltage of the above-identified buses corresponding to summer days crosses the limit of winter days. Additionally, in phase B, bus #29, a feeder end bus, also reaches the limit of the winter day.
In summary, with the discussion given in the above paragraph, it can be said that the pattern of voltage profile throughout the network remains the same with changes in connected load for a given solar radiation profile. There is only a seasonal shift in terms of voltage magnitude. However, for the same connected load, on different solar radiation profiles, seasonal shifts accompanied by a pattern of voltage distribution can be observed. At low solar radiation profile for winter days, buses #12, 13, 14, 15, 16, 17, 18, 19, 21, and 22 (region 1) located nearer to the utility grid have more voltage magnitude sensitivity against reactive power as compared to the ones located in the middle and downstream (region 2) of the network. The complete network remains voltage magnitude sensitive to active power injection for summer days, thus resulting in constant voltage magnitude (with upper limit) throughout the network. On the other hand, voltage distribution is also almost constant throughout the network for winter days, suggesting high sensitivity to active power at a high solar radiation profile. This means the voltage magnitude remains sensitive to either active or reactive power injection according to the seasons and prevailing solar radiation profile. At noon, the inverter capability of reactive power support is at a minimum.
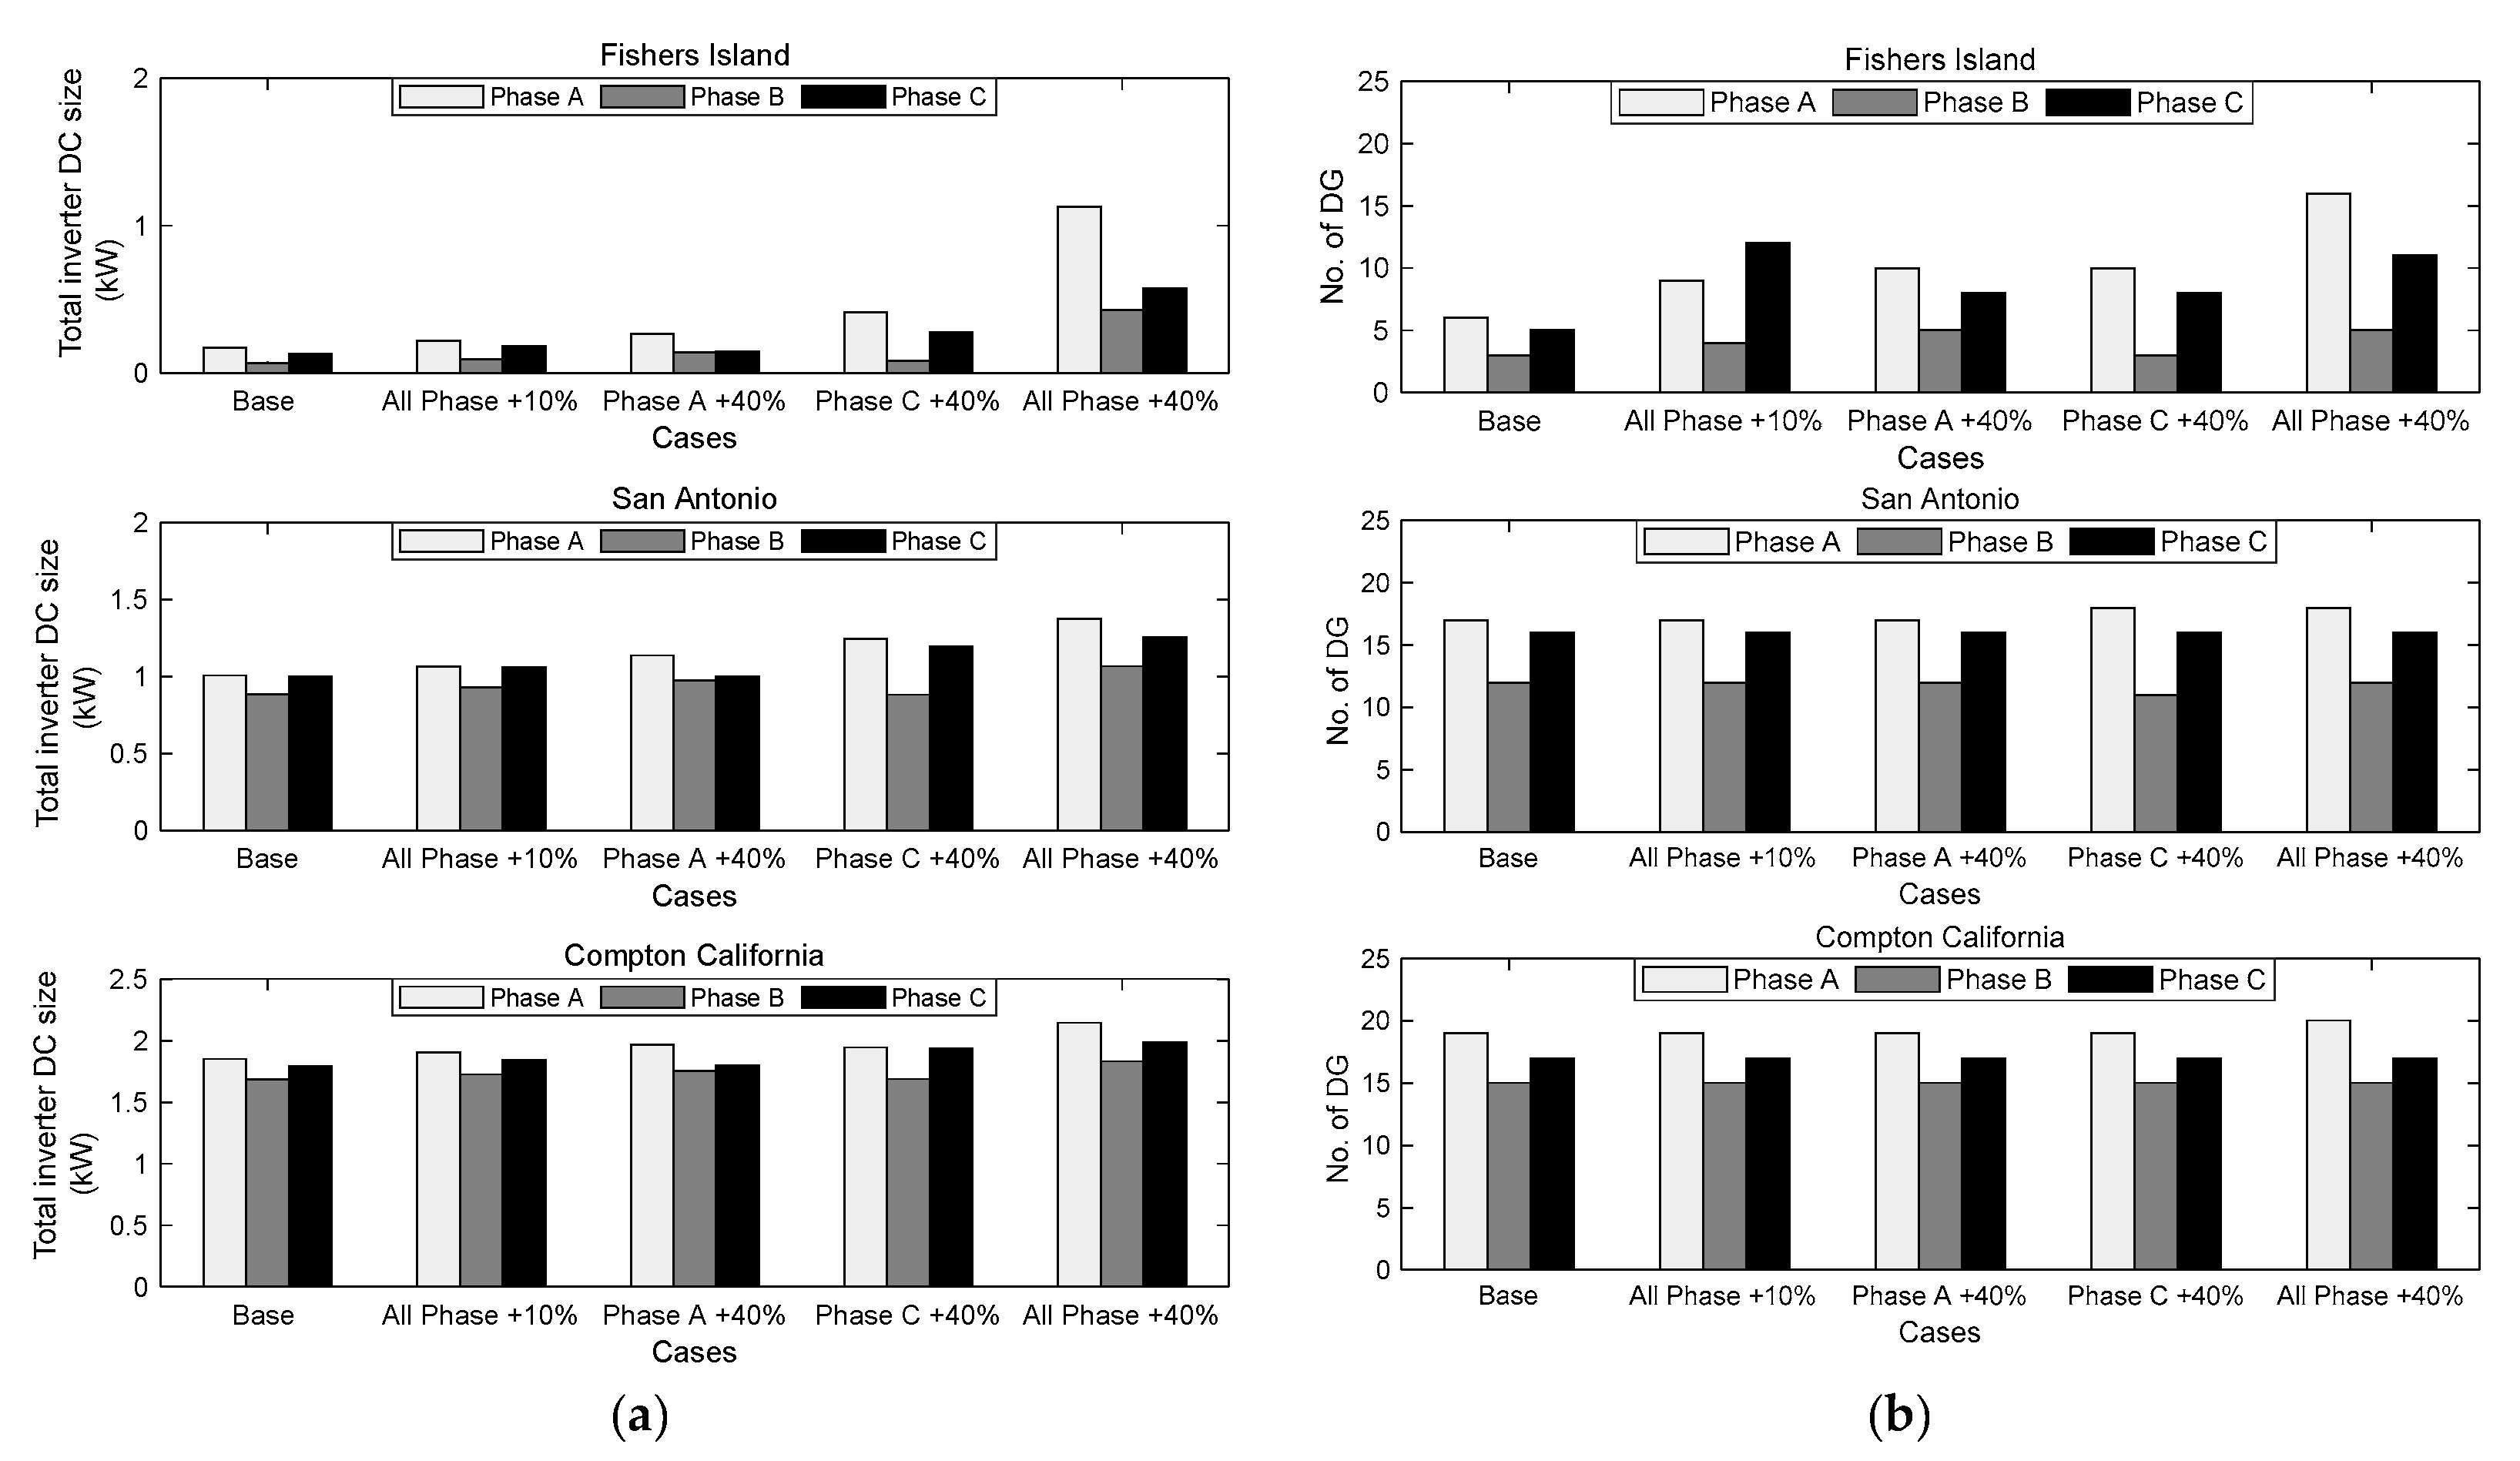
Next, the results are discussed for changes in voltage index, calculated for different connected loads and solar radiation against PV installation in the network. At a low solar radiation profile, with the addition of a connected load above the base case, a larger size of DC inverters is installed, mostly in phase A, as suggested in Figure 14a (upper subplot). Three-phase DC inverter installation if any, has not been shown in said figure. The least size of the inverter is installed in phase B. An unbalance in the DC inverter (PV installation) among the three phases is revealed for the low solar radiation profile, mainly with a +40% load in all phases. Improved solar radiation leads to having a larger size, indicated in the middle and lower subplots in said figure. It is obvious that with good solar radiation, PV installation size will increase. However, with an increase in connected load (different cases), the addition of PVs (single phase) is marginal and remains uniform among the three phases. This can be noted not only for the base load but also for additional load cases in the network, as shown in Figure 14a.
In accordance with the DC inverter’s size, as discussed in the above paragraph, Figure 14b indicates the total number of buses with a PV installation. At base load conditions, the smallest size of the DC inverter is found, and so is the number of PVs installed with a low solar radiation profile. With a 10% increased connected load in all phases, a higher number of PVs are installed in phase C, while its inverter size is at par with that of phase A (Figure 14a upper subplot)). This suggests that a smaller size of the inverter but a large number of PVs are installed in phase C with a low solar radiation profile. On the other hand, with medium and high solar radiation profiles (middle and lower subplot), the number of PVs installed is in accordance with the size of the inverter placed among the three phases (Figure 14a).
Similarly, at 40% increased load in phase A, for all three solar radiation profiles, the size of the inverter located in phases B and C is the same (Figure 14a). Still, their respective number (nodes) is different (more in Phase C), as indicated in Figure 14b. Furthermore, for the remaining connected load: the base case, +10% increase in all phases, +40% increase in both phase C and all phases, at different solar profile conditions, the number of PVs installed coincides with the size of the inverter placed in three phases.
As discussed above, with the addition of a connected load, the size of the PVs installed has also increased, influencing the voltage index. With a low solar radiation profile, at the base load condition, the smallest size and number of PV is placed in the network. However, the voltage index is not significantly affected with respect to additional load conditions, as observed in Figure 14c (upper subplot). With a 10% increased connected load in all phases (low solar radiation profile), the voltage index of phase C is close enough to phase B, having both the smallest size and number of PVs installed. This means a higher number and size (at par with phase A) does not influence the reduction of the voltage index. Observing medium and high solar radiation profiles, the voltage index of the three phases lies in the same range. In other words, improved solar radiation leads to increased size and number of PVs across the network, but the voltage index is not significantly affected.
The voltage index of phase C is the largest, though its inverter size is equal to phase B (Figure 14a), with a 40% increased load in phase A for all three solar radiation profiles. In other words, a greater number of PVs but a small size in phase C does not bring down the value of the voltage index, the same as phase B.
On the other hand, a 40% additional load in phase C only, with an optimal PV size so obtained (least placed in phase B), a comparatively higher voltage index in phase B is noted. However, for the 40% load change in phase C, with a low solar profile, close observation indicates phases A and C share an additional increase of 43.14% and 26.31% of the total PV installed in the network. Consequently, the voltage index of phase A is the least, followed by phase C.
On the other hand, for a 40% additional load in all phases, increased PV size leads to a reduced value of the three-phase voltage index (upper subplot). Similarly, with medium and high solar radiation profiles, the placement of PVs is uniform throughout the network, and the difference in PV size among the three phases remains marginal. Thus, as expected, their voltage index is comparatively lowest with respect to other load conditions.
For the different load conditions, with these solar radiation profiles, medium and high, the increase in inverter (PV) size among the three phases remains uniform. In contrast, changes in voltage index do not follow accordingly. In other words, the voltage distribution characteristics throughout the network among the three phases are not similar under these solar radiation profiles.

4.3. Electricity and Curtailment Cost

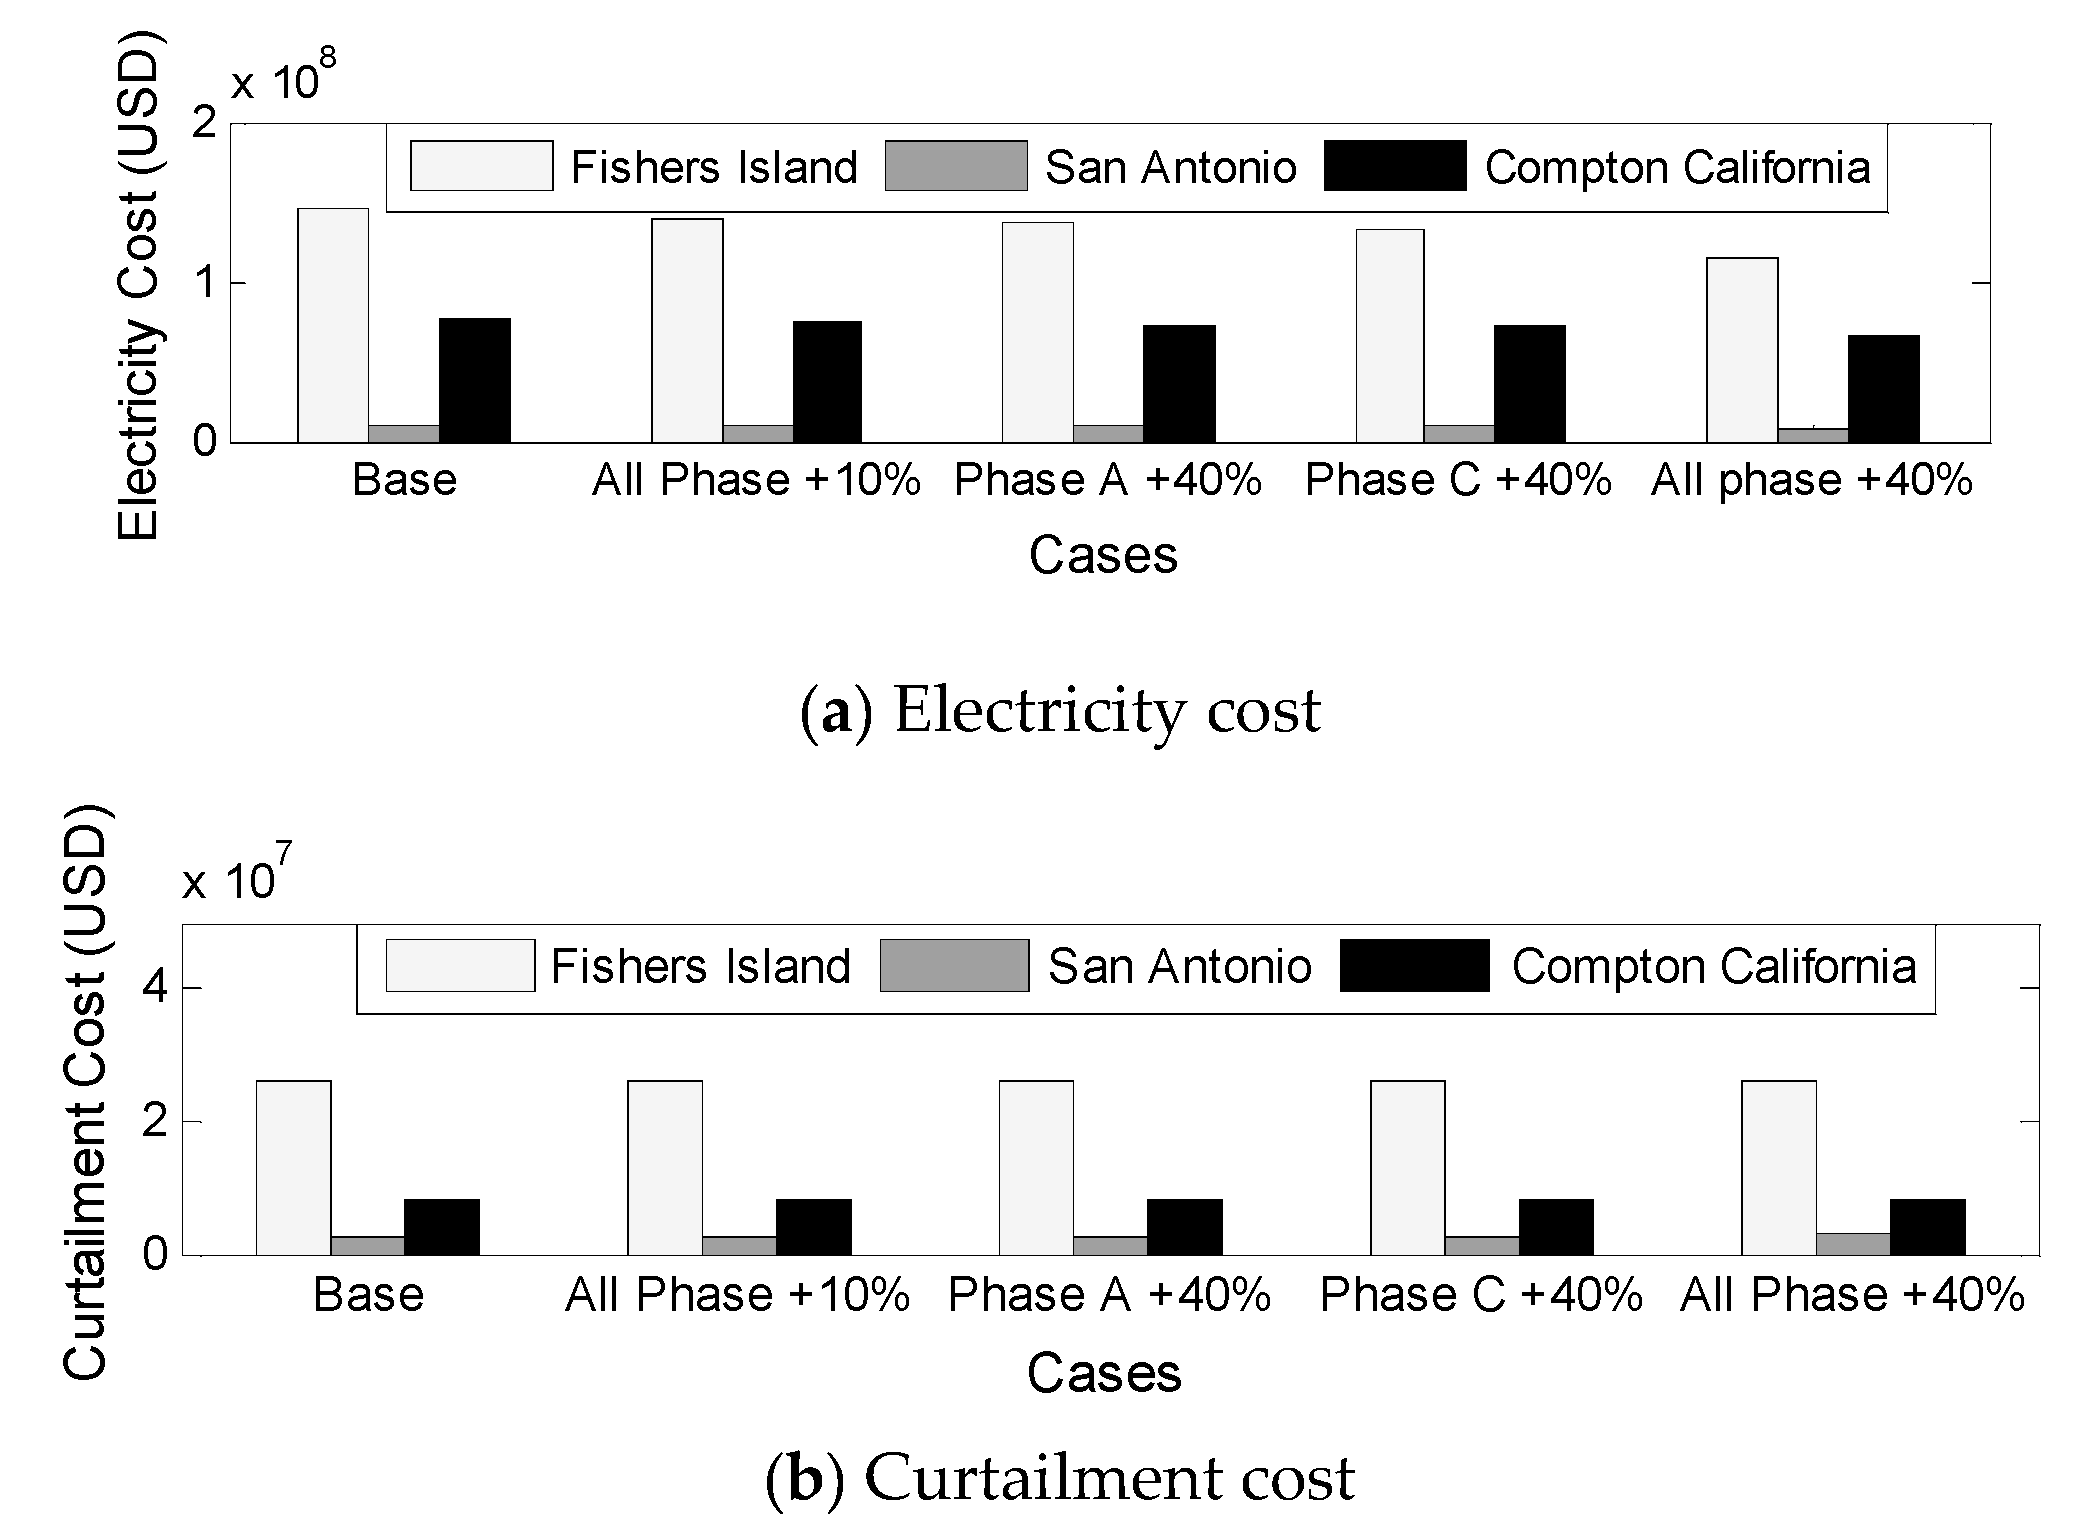
In this study, the electricity price corresponding to the solar radiation value for low (5.263 MWh·year−1), medium (5.976 MWh·year−1), and high (6.634 MWh·year−1) is $0.29/kWh, $0.08/kWh and $0.19/kWh [42] respectively. The electricity price is lowest for San Antonio and remains dominant for Fisher Island, as indicated in Figure 15a. Moreover, the price is consistent for different cases of connected loads, except for a +40% increase in all phases. The PV resources are to be optimally placed and sized to mitigate against over-voltage (Figure 11a) with the least amount of cost of PV-curtailed energy. The discussion in the above section suggested a maximum number of voltage violations in phase A, having the largest size of inverter placed. It can be observed in Figure 15b for all three solar radiation profiles, the curtailment cost for PV energy remains highest for low, followed by high and medium solar radiation profiles. This trend remains consistent for all the connected load cases. In other words, voltage violations are restricted, with the burden of curtailment relative to the size of the PV installed.

5. Conclusions

The voltage magnitude sensitivity to an active or reactive power (negative) injection was suggested to be dependent on seasonal and available solar radiation profiles. This calls for more proper voltage regulation management according to the inverter size, active power produced according to available solar radiation, and connected load, including their daily and seasonal variations.
Clearly, bus voltage violations depend on the placement and size of PVs and changes in connected load among the three phases and the solar radiation profiles. There appears to be a strong relationship between the placement, size, and solar radiation profile. Hence a more generalized approach, possibly involving a reformulation of the objective function, along with a new level of defining constraints, may be an attractive option.
In future work, a more generalized methodology needs to be examined and formulated through a detailed analysis of renewable integration and its distribution throughout the network. An objective function formulation in terms of minimizing the voltage index/voltage improvement, minimizing loss (active power/reactive power), improvement in the sensitivity factor, economic criteria (profit-maximizing, system cost minimizing), taking into account uncertainty in variations, not only in yearly but also monthly and daily solar radiation data could help decrease the disparity. Furthermore, appropriate control strategies can be applied to achieve a fair level of dispatch so as to prevent a large number of over-voltage violations while distributing the burden of curtailment relative to the size of the PV inverter.

Author Contributions

Conceptualization, N.K. and R.N.; Methodology, N.K.; Software, A.Y.; Formal analysis, A.Y. and N.K.; Investigation, R.N.; Data curation, A.Y.; Writing—original draft, N.K.; Writing—review & editing, R.N.; Visualization, A.Y. and R.N.; Supervision, R.N. All authors have read and agreed to the published version of the manuscript.

Funding

The APC was funded by Institutional Open Access Program (IOAP): Østfold University College.

Conflicts of Interest

The authors declare no conflict of interest.

References

  1. Keane, A.; Ochoa, L.F.; Borges, C.L.T.; Ault, G.W.; Alarcon-Rodriguez, A.D.; Currie, R.A.F.; Pilo, F.; Dent, C.; Harrison, G.P. State-of-the-Art Techniques and Challenges Ahead for Distributed Generation Planning and Optimization. IEEE Trans. Power Syst. 2013, 28, 1493–1502. [Google Scholar] [CrossRef] [Green Version]
  2. Georgilakis, P.S.; Hatziargyriou, N.D. Optimal distributed generation placement in power distribution networks: Mod-els, methods, and future research. IEEE Trans. Power Syst. 2013, 28, 3420–3428. [Google Scholar] [CrossRef]
  3. Valdberg, A.J.; Dwyer, M. Distribution Resources Plan Rulemaking (R.14-08-013) Locational Net Benefit Analysis Work-ing Group Final Report. Available online: http://drpwg.org/wp-content/uploads/2016/07/R1408013-et-al-SCE-LNBA-Working-Group-Final-Report.pdf (accessed on 8 March 2021).
  4. Picciariello, A.; Alvehag, K.; Soder, L. Impact of network regulation on the incentive for dg integration for the dso: Op-portunities for a transition toward a smart grid. IEEE Trans. Smart Grid 2015, 6, 1730–1739. [Google Scholar] [CrossRef]
  5. Cohen, M.A.; Callaway, D.S. Effects of distributed pv generation on California’s distribution system, part 1: Engineer-ing simulations. Sol. Energy 2016, 128, 126–138. [Google Scholar] [CrossRef]
  6. Agah, S.M.M.; Abyaneh, H.A. Quantification of the Distribution Transformer Life Extension Value of Distributed Generation. IEEE Trans. Power Deliv. 2011, 26, 1820–1828. [Google Scholar] [CrossRef]
  7. Agah, S.M.; Abyaneh, H.A. Distribution transformer loss-of-life reduction by increasing penetration of distributed gen-eration. IEEE Trans. Power Deliv. 2016, 26, 1128–1136. [Google Scholar] [CrossRef]
  8. Iweh, C.D.; Gyamfi, S.; Tanyi, E.; Effah-Donyina, E. Distributed Generation and Renewable Energy Integration into the Grid: Prerequisites, Push Factors, Practical Options, Issues and Merits. Energies 2021, 14, 5375. [Google Scholar] [CrossRef]
  9. Othman, M.M.; El-Khattam, W.; Hegazy, Y.G.; Abdelaziz, A.Y. Optimal Placement and Sizing of Distributed Generators in Unbalanced Distribution Systems Using Supervised Big Bang-Big Crunch Method. IEEE Trans. Power Syst. 2014, 30, 911–919. [Google Scholar] [CrossRef]
  10. Sheng, W.; Liu, K.; Liu, Y.; Meng, X.; Li, Y. Optimal placement and sizing of distributed generation via an improved non-dominated sorting genetic algorithm II. IEEE Trans. Power Deliv. 2015, 30, 569–578. [Google Scholar] [CrossRef]
  11. Pereira, B.R.; da Costa, G.R.M.M.; Contreras, J.; Mantovani, J.R.S. Optimal distributed generation and reactive power allocation in electrical distribution systems. IEEE Trans. Sustain. Energy 2016, 7, 975–984. [Google Scholar] [CrossRef]
  12. Masaud, T.M.; Nannapaneni, G.; Challoo, R. Optimal placement and sizing of distributed generation-based wind energy considering optimal self VAR control. IET Renew. Power Gener. 2016, 11, 281–288. [Google Scholar] [CrossRef]
  13. Wang, Y.; Tsinghua University; Zhang, N.; Li, H.; Yang, J.; Kang, C. Linear three-phase power flow for unbalanced active distribution networks with PV nodes. CSEE J. Power Energy Syst. 2017, 3, 321–324. [Google Scholar] [CrossRef]
  14. Wang, H.; Yan, Z.; Shahidehpour, M.; Zhou, Q.; Xu, X. Optimal Energy Storage Allocation for Mitigating the Unbalance in Active Distribution Network via Uncertainty Quantification. IEEE Trans. Sustain. Energy 2020, 12, 303–313. [Google Scholar] [CrossRef]
  15. Bazrafshan, M.; Gatsis, N.; Dall’Anese, E. Placement and sizing of inverter-based renewable systems in multi-phase distribution networks. IEEE Trans. Power Syst. 2019, 34, 918–930. [Google Scholar] [CrossRef]
  16. Gruosso, G.; Netto, R.S.; Daniel, L.; Maffezzoni, P. Joined Probabilistic Load Flow and Sensitivity Analysis of Distribution Networks Based on Polynomial Chaos Method. IEEE Trans. Power Syst. 2019, 35, 618–627. [Google Scholar] [CrossRef]
  17. Lee, Y.D.; Lin, W.C.; Jiang, J.L.; Cai, J.H.; Huang, W.T.; Yao, K.C. Optimal individual phase voltage regulation strategies in active distribution networks with high PV penetration using the sparrow search algorithm. Energies 2021, 14, 8370. [Google Scholar] [CrossRef]
  18. Dissanayake, R.; Wijethunge, A.; Wijayakulasooriya, J.; Ekanayake, J. Optimizing PV-Hosting Capacity with the Integrated Employment of Dynamic Line Rating and Voltage Regulation. Energies 2022, 15, 8537. [Google Scholar] [CrossRef]
  19. Li, C.; Disfani, V.R.; Pecenak, Z.K.; Mohajeryami, S.; Kleissl, J. Optimal OLTC voltage control scheme to enable high solar penetrations. Electr. Power Syst. Res. 2018, 160, 318–326. [Google Scholar] [CrossRef] [Green Version]
  20. Mehmood, K.K.; Khan, S.U.; Lee, S.-J.; Haider, Z.M.; Rafique, M.K.; Kim, C.-H. A real-time optimal coordination scheme for the voltage regulation of a distribution network including an OLTC, capacitor banks, and multiple distributed energy resources. Int. J. Electr. Power Energy Syst. 2018, 94, 1–14. [Google Scholar] [CrossRef]
  21. Iqbal, F.; Khan, M.T.; Siddiqui, A.S. Optimal placement of DG and DSTATCOM for loss reduction and voltage profile improvement. Alex. Eng. J. 2017, 57, 755–765. [Google Scholar] [CrossRef]
  22. Montoya-Bueno, S.; Munoz, J.I.; Contreras, J. A Stochastic Investment Model for Renewable Generation in Distribution Systems. IEEE Trans. Sustain. Energy 2015, 6, 1466–1474. [Google Scholar] [CrossRef]
  23. Lee, D.; Han, C.; Jang, G. Stochastic Analysis-Based Volt–Var Curve of Smart Inverters for Combined Voltage Regulation in Distribution Networks. Energies 2021, 14, 2785. [Google Scholar] [CrossRef]
  24. Bucciarelli, M.; Paoletti, S.; Vicino, A. Optimal sizing of energy storage systems under uncertain demand and generation. Appl. Energy 2018, 225, 611–621. [Google Scholar] [CrossRef]
  25. El-Ela, A.A.A.; El-Seheimy, R.A.; Shaheen, A.M.; Wahbi, W.A.; Mouwafi, M.T. PV and battery energy storage integration in distribution networks using equilibrium algorithm. J. Energy Storage 2021, 42, 103041. [Google Scholar] [CrossRef]
  26. Prado, J.C.D.; Qiao, W.; Qu, L.; Agüero, J.R. The Next-Generation Retail Electricity Market in the Context of Distributed Energy Resources: Vision and Integrating Framework. Energies 2019, 12, 491. [Google Scholar] [CrossRef] [Green Version]
  27. Saboori, H.; Hemmati, R.; Jirdehi, M.A. Reliability improvement in radial electrical distribution network by optimal planning of energy storage systems. Energy 2015, 93, 2299–2312. [Google Scholar] [CrossRef]
  28. Chowdhury, N.; Pilo, F.; Pisano, G. Optimal Energy Storage System Positioning and Sizing with Robust Optimization. Energies 2020, 13, 512. [Google Scholar] [CrossRef] [Green Version]
  29. Mohamad, F.; Teh, J.; Lai, C.-M. Optimum allocation of battery energy storage systems for power grid enhanced with solar energy. Energy 2021, 223, 120105. [Google Scholar] [CrossRef]
  30. Bawazir, R.O.; Cetin, N.S. Comprehensive overview of optimizing PV-DG allocation in power system and solar energy resource potential assessments. Energy Rep. 2020, 6, 173–208. [Google Scholar] [CrossRef]
  31. Arasteh, A.; Alemi, P.; Beiraghi, M. Optimal allocation of photovoltaic/wind energy system in distribution network using meta-heuristic algorithm. Appl. Soft Comput. 2021, 109, 107594. [Google Scholar] [CrossRef]
  32. Farzin, H.; Fotuhi-Firuzabad, M.; Moeini-Aghtaie, M. Enhancing Power System Resilience Through Hierarchical Outage Management in Multi-Microgrids. IEEE Trans. Smart Grid 2016, 7, 2869–2879. [Google Scholar] [CrossRef]
  33. Wang, Y.; Xu, Y.; He, J.; Liu, C.C.; Schneider, K.P.; Hong, M.; Ton, D.T. Coordinating multiple sources for service restoration to enhance resilience of distribution systems. IEEE Trans. Smart Grid 2019, 10, 5781–5793. [Google Scholar] [CrossRef] [Green Version]
  34. Luo, C.; Wu, H.; Zhou, Y.; Qiao, Y.; Cai, M. Network partition-based hierarchical decentralised voltage control for distribution networks with distributed PV systems. Int. J. Electr. Power Energy Syst. 2021, 130, 106929. [Google Scholar] [CrossRef]
  35. Bazrafshan, M.; Yalamanchili, L.; Gatsis, N.; Gomez, J. Stochastic Planning of Distributed PV Generation. Energies 2019, 12, 459. [Google Scholar] [CrossRef] [Green Version]
  36. Saad, S.N.M.; van der Weijde, A.H. Evaluating the potential of hosting capacity enhancement using integrated grid planning modeling methods. Energies 2019, 12, 3610. [Google Scholar] [CrossRef] [Green Version]
  37. Fatima, S.; Püvi, V.; Lehtonen, M. Review on the PV Hosting Capacity in Distribution Networks. Energies 2020, 13, 4756. [Google Scholar] [CrossRef]
  38. Ali, A.; Mahmoud, K.; Lehtonen, M. Maximizing hosting capacity of uncertain photovoltaics by coordinated manage-ment of OLTC, VAr sources and stochastic EVs. Int. J. Electr. Power Energy Syst. 2021, 127, 106627. [Google Scholar] [CrossRef]
  39. Suppioni, V.P.; Grilo, A.P. Unbalance compensation control in microgrids based on the unbalance profile. Electr. Power Syst. Res. 2021, 196, 107199. [Google Scholar] [CrossRef]
  40. Fernández, G.; Galan, N.; Marquina, D.; Martínez, D.; Sanchez, A.; López, P.; Bludszuweit, H.; Rueda, J. Photovoltaic genera-tion impact analysis in low voltage distribution grids. Energies 2020, 13, 4347. [Google Scholar] [CrossRef]
  41. Saranchimeg, S.; Nair, N.K. A novel framework for integration analysis of large-scale photovoltaic plants into weak grids. Appl. Energy 2020, 282, 116141. [Google Scholar] [CrossRef]
  42. PVWatts Documentation. National Renewable Energy Lab. Available online: https://pvwatts.nrel.gov (accessed on 16 November 2020).
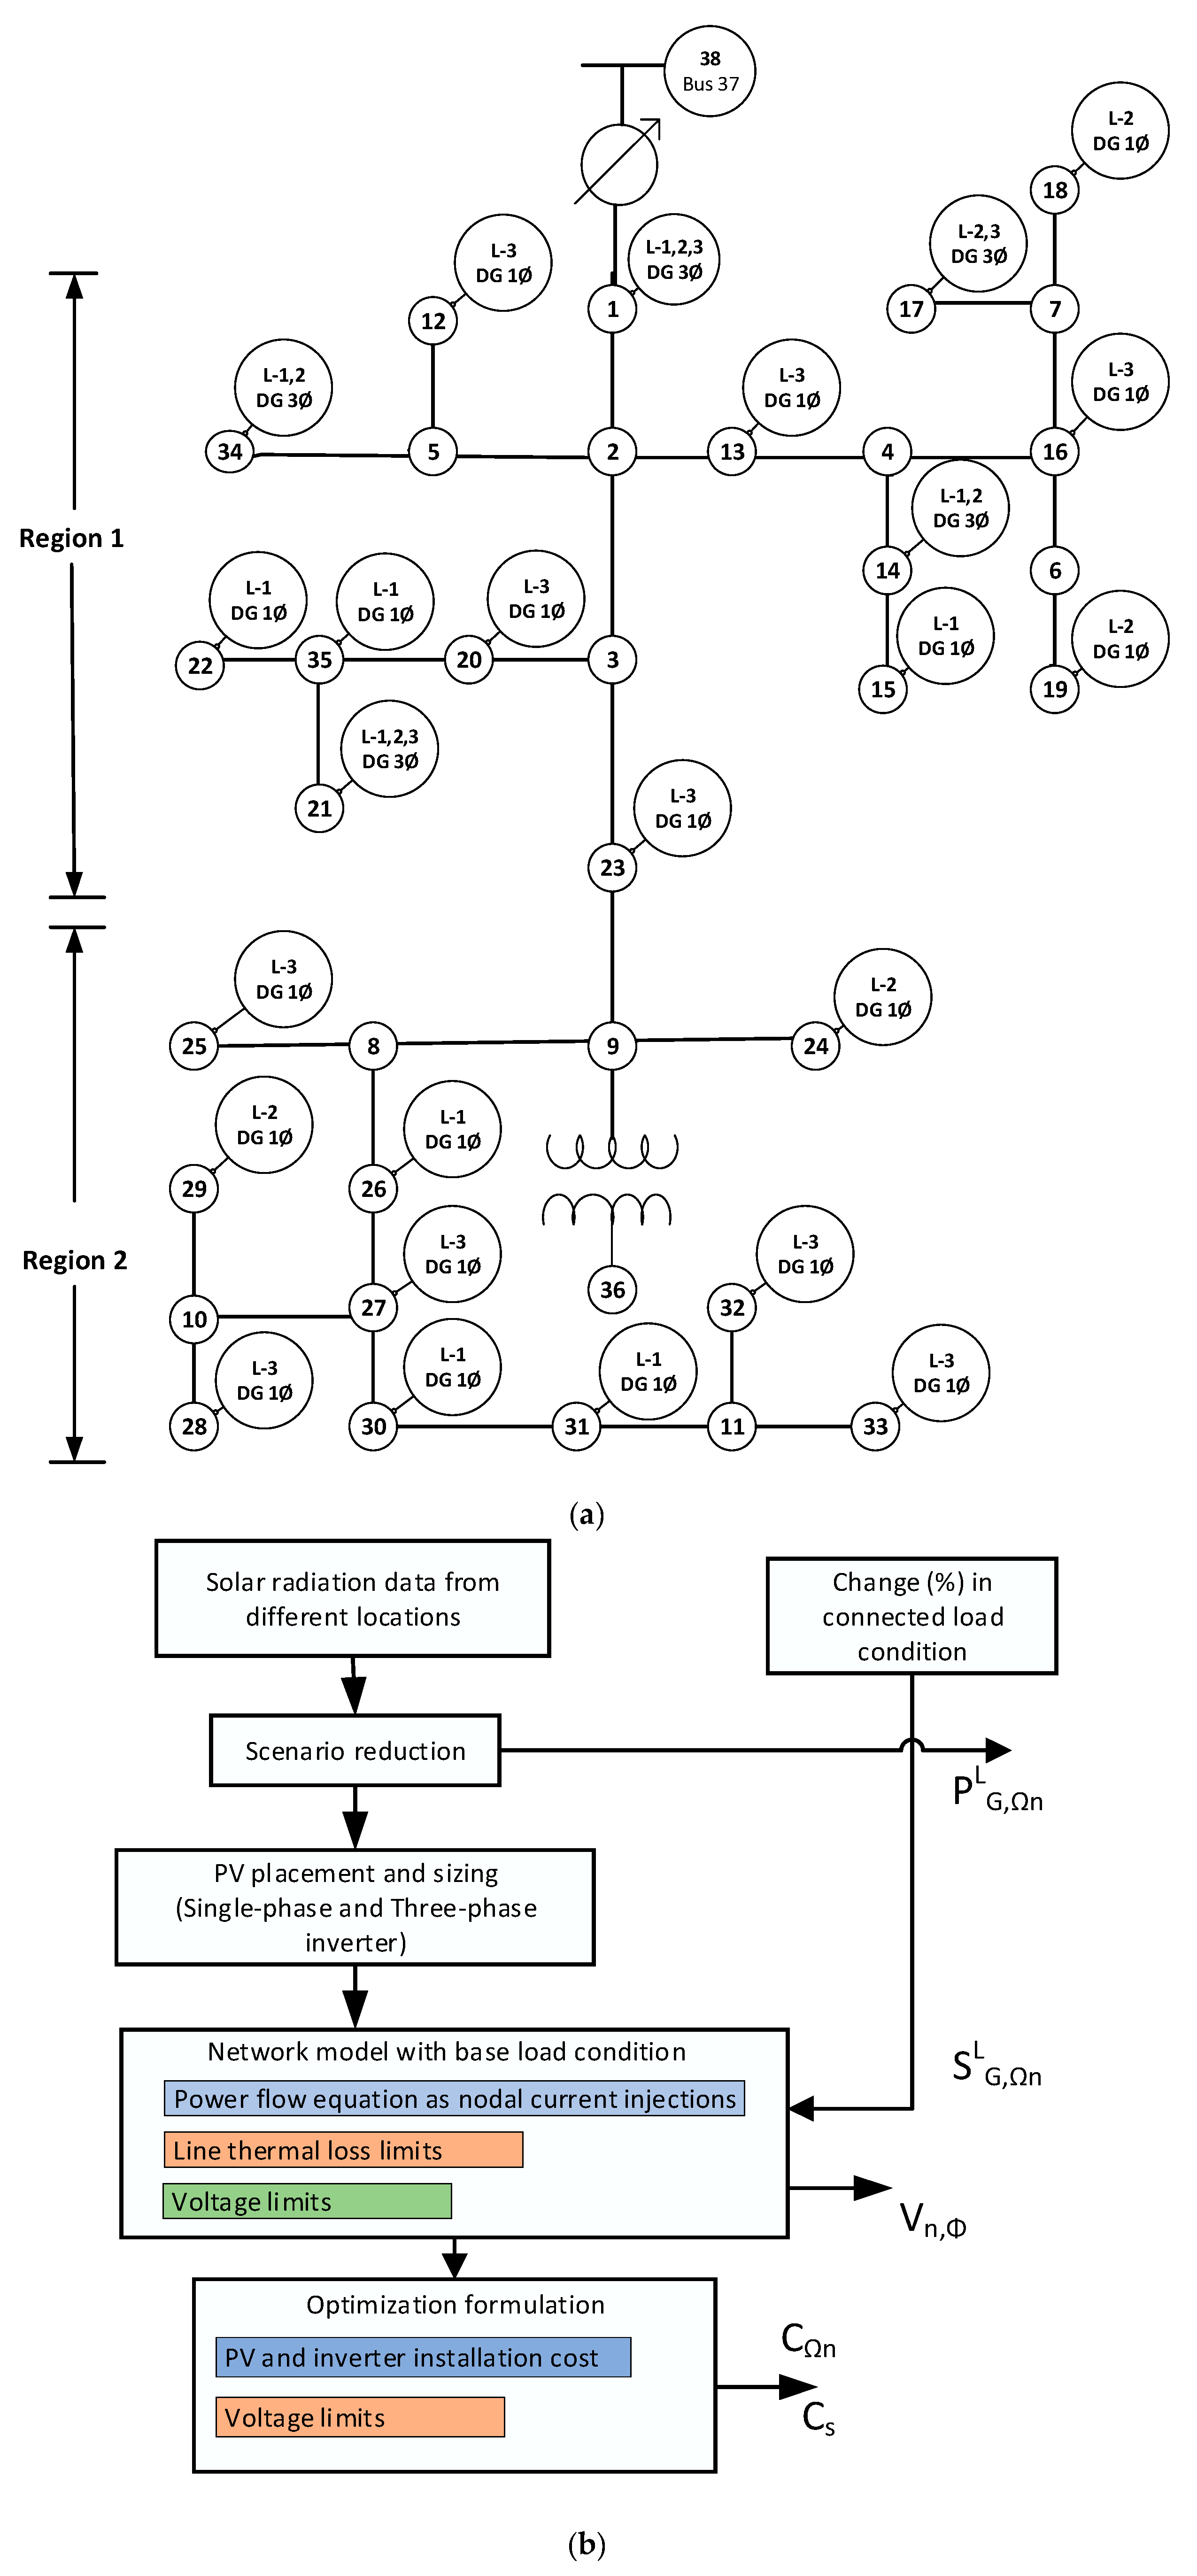
Figure 1. Overview of framework for the presented study on optimally placed and sized PVs in the distribution network. (a) IEEE 37 bus network showing the connected load and feasibility of PV installation. (b) Framework of the presented study.
Energies 16 00653 g001
Figure 2. Monthly solar radiation for different locations.
Energies 16 00653 g002
Figure 3. PV inverter placement and size at the base load condition.
Energies 16 00653 g003aEnergies 16 00653 g003b
Figure 4. PV inverter placement and size with a load change of +10% in all phases.
Energies 16 00653 g004
Figure 5. PV inverter placement and size with load change by +40% in all phases.
Energies 16 00653 g005
Figure 6. PV inverter placement and size with load change in one of the phases.
Energies 16 00653 g006
Figure 7. PV inverter placement and size with load change of +10% in region 1 and +40% in region 2.
Energies 16 00653 g007
Figure 8. PV inverter placement and size with a load change of +40% in region 1 and +10% in region 2.
Energies 16 00653 g008
Figure 9. Computed voltage index at base load condition with low solar radiation profile.
Energies 16 00653 g009
Figure 10. Maximum and minimum voltage index at the base load condition with a low solar radiation profile.
Energies 16 00653 g010
Figure 11. Bus voltage assessment on violation of limits. (a) Maximum and minimum voltage of the network at base load condition with low solar radiation profile. (b) Violation of bus voltage.
Energies 16 00653 g011aEnergies 16 00653 g011b
Figure 12. Variation of feeder end bus voltage at base load conditions with low solar radiation profile. (a) Summer day—4 July. (b) Winter day—31 December.
Energies 16 00653 g012
Figure 13. Voltage at 12 h for summer and winter days. (a) Low solar profile at the base load condition. (b) Low solar profile at an additional 40% load in all phases. (c) High solar profile at an additional 40% load in all phases.
Energies 16 00653 g013
Figure 14. Optimal solution for the inverter size and its corresponding voltage index. (a) Inverter size. (b) Total number of PVs installed at nodes. (c) Voltage index.
Energies 16 00653 g014aEnergies 16 00653 g014b
Figure 15. Economics of optimized PV installation.
Energies 16 00653 g015
Disclaimer/Publisher’s Note: The statements, opinions and data contained in all publications are solely those of the individual author(s) and contributor(s) and not of MDPI and/or the editor(s). MDPI and/or the editor(s) disclaim responsibility for any injury to people or property resulting from any ideas, methods, instructions or products referred to in the content.