Abstract
The cable plays a vital role in roadway support. As the last barrier to prevent roof collapse and impact disaster accidents, it is of great significance to study stress characteristics of cables under impact dynamic load to guide the rock burst roadway support. With high-strength cables of Φ21.6 and Φ21.8 mm and low-resistance high-extension cables of Φ21.5 mm as examples, this paper studied the instantaneous mechanical state and energy dissipation characteristics of different types of cables under impact loads by using impact testing machines and high-frequency data acquisition system. The results show that the impact process can strengthen the strength of the cable. The strength and elongation of anchor cables are a pair of characteristic indexes with an inverse relationship. Simply increasing one index cannot improve the overall impact resistance of the cable. To quantitatively characterize the impact resistance and energy absorption effect of cables, the impact resistance index k was introduced. The smaller the index, the better the energy absorption effect of cables. In the process of dynamic load impact of high-strength cable, about 43.7% of the total energy is dissipated disordered in the form of mechanical energy. The dynamic load impact process of low-resistance and high-extension cables is similar to the viscoelastic impact. In the collision compaction stage, the force of the cable is basically constant. Most of the impact energy is absorbed or transformed by the cable, about 17.7% of which is mostly dissipated in the form of mechanical energy. The disordered dissipated mechanical energy is less, so the impact resistance and energy absorption effect of this cable are better. The cable plays an important role in the process of bearing the dynamic load of surrounding rock. The anti-impact performance index of cables should be considered in dynamic load impact roadway support design.
1. Introduction
With the deep mining of coal resources, the roadway pressure in the surrounding rock increases gradually and plastic deformation can also occur under large confining pressures. Rock is a brittle material, which is prone to the accumulation of stress under the action of support such as cable. When the accumulated elastic energy is suddenly released, it is easy to cause the instability of surrounding rock in a large range and trigger a rock burst. Rock bursts are one of the main dynamic hazards of deep underground roadways [1,2,3]. As the main support means of coal mining roadway, the bolt or cable plays a pivotal role in resisting formation pressure, controlling roof collapse, and preventing rock bursts. The cable support system becomes the last line of defense against rock burst disaster [4,5], and its dynamic characteristics under impact load will determine the stability of the surrounding rock. Due to the limitation of its own length, the bolt has a limited control range on the roof strata in the support system [6,7]. The maximum failure height of roadways was 2.6 m in the “10·20” rock burst accident in Long Yun coal. The coal and gas outburst accident of “3·25” in Shi Gang Coal resulted in a maximum roof collapse height of 4.2 m; The “2·22” rock burst accident in Xin Julong Coal Mine resulted in serious roadway deformation, and the maximum roof subsidence of 1.3 m was caused by the breaking of cable beam, and the roadway sides moved closer to 1.5–2.3 m. The above typical dynamic disasters show that most of the injury accidents are caused by roof collapse and flaking caused by roadway instability [8,9].
In the event of a dynamic disaster, the cable becomes the main material to prevent roof collapse, flaking, and resisting the impact load. Experts and scholars at home and abroad have conducted in-depth research on the properties of cable materials. Lv [10] developed SKP22-1/1860 cable with a 1 × 19S-21.8 structure, which has the characteristics of high bearing capacity, strong deformation control ability, maximum static force ≥ 582 kN, and total elongation ≥ 5%. He et al. [11] conducted an in-depth study on the mechanical behavior of surface-protecting components of cable support systems under impact load, showing that surface-protecting components present three stages under impact force: rapid loading, stable loading, and rapid unloading. Under the same impact energy, the peak of the impact force by cable-supporting plates is larger than that of the bolt, and the action time is shorter. Kong et al. [12] carried out a dynamic load impact simulation experiment on Φ15.24 mm pre-stressed cable. The research showed that under the impact loading, the cable had three failure forms: pulling, breaking, and pull-breaking. The proportion of the three failure forms was, respectively, 14%, 37%, and 49%. The failure limit of this cable under impact loading is 260 kN, and the impact loading is easier to pull off the cable than constant loading. Xu et al. [13,14] studied the deformation and failure law of deep surrounding rock driving roadways under dynamic load disturbance. Because of the limited condition of bolt length, the cable cannot effectively prevent the roof collapse and the roadway will be extremely prone to dynamic load accidents.
Charlie et al. [15,16] studied a new energy-absorbing D-Bolts and carried out a large number of hammer impact tests. The study showed that the bolt could effectively resist the dynamic load impact and had a good application in high-in-situ stress roadway support. More than 90% of coal mining roadway in China adopts combined support of bolt and cable [17,18]. Since the range of the bolt is mostly 2–2.6 m, the bolt has limited impact resistance ability when the impact occurs. The cable bears most of the impact energy. The stability of the support system is directly determined by the strength of the cable’s impact resistance ability.
In conclusion, in deep-buried underground engineering, the cable is the final barrier to prevent accidents and plays an important role in controlling roof collapse and impact disasters of the surrounding rock. It is of great significance to study the mechanical behavior of cable under impact dynamic load for maintaining the stability of surrounding rock.
2. Dynamic Load Impact Mechanical Model of Cable
The roadway space is the only channel for the release of surrounding rock stress, and the impact load releases energy through the deformation of roadways surrounding rock. To quantitatively describe the dynamic characteristics of different cables under the impact load, a heavy hammer was used to simulate the impact load, that is, the hammer in free fall moved for a certain distance to obtain kinetic energy, and the plate transferred the impact load to the cable at the moment of impact. The model of the dynamic load impact process of the cable is shown in Figure 1. As shown in this model, the impact energy borne by the cable was directly proportional to the height of the lifting of the hammer. The whole motion process was the conversion of gravitational potential energy into impact kinetic energy acting on the cable, during which the internal energy dissipation and mechanical energy loss were generated.

Figure 1.
Dynamic load impact mechanical model of roadway support system.
3. Dynamic Load Test Sample of Cable
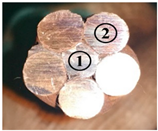
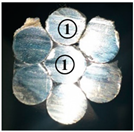
To study the mechanical characteristics of different types of cables under dynamic load, we took Φ21.6–1770, Φ21.8–1860 and Φ21.5–1030 mm as test samples. The structure and parameters of the samples are shown in Table 1.

Table 1.
The cable type and structure characteristics.
4. Hammer Impact Test System
As shown in Figure 2, the hammer impact test device consisted of two parts: the hammer control system and the data acquisition system. The hammer size was 1170, 650, and 450 mm in length, width, and height, respectively. The weight of the hammer was 2300 kg. When the hammer impact control system was running, the hammer was driven to a certain height by an external motor, and then the clamping device suddenly released the hammer. The hammer converted its own gravitational potential energy into kinetic energy in the way of free fall, and transmitted huge instantaneous destructive power to the cable at the moment of impact with the plate. The occurrence time of the rock burst was roughly in the order of milliseconds [19]. A high-frequency data acquisition system was developed to record the pressure changes during the hammer impact progress. The recording cycle of high-frequency data acquisition system was set at 1 ms. The maximum impact energy of the hammer testing machine was 5 × 10⁴ J. It was not enough to break the cable of Φ21.5, Φ21.6, and Φ 21.8 mm. Therefore, the fixed impact energy of 2 × 10⁴ J was used to impact the cable several times to study the dynamic characteristics of the cable under the impact load. The pressure during the hammer impact course represented the cable impact characteristics. During the hammer impact progress, there was a compaction stage when the hammer contacts the pallet, at which point the force of the cable increased rapidly. For the extensibility of the cable, the force was basically in a stable stage after the compaction of the hammer and the pallet, and the force at this point was the impact pressure in the stable stage.

Figure 2.
Hammer impact test system.
5. Theoretical Analysis Process of Hammer Impact Test
5.1. Calculation of Total Energy Storage in Impact Process
The external motor lifts the hammer to a certain height H, and this process converted the electric energy into the gravitational potential energy of the hammer. As shown in Figure 3, we took the central position of the collision moment as zero and downward as the positive direction, and then the gravitational potential energy of the weight was Eg.
where m represents the weight of the hammer, which is fixed at 2300 kg; g is the acceleration of gravity, which is 9.8 m/s2; H represents the height of hammer lifted, and the unit is m.

Figure 3.
The energy storage stage of hammer lifted.
5.2. Calculation of Average Impact Force of Cable during Hammer Impact
The clamping device releases the hammer, which falls in free and converts gravitational potential energy into kinetic energy. The velocity of the hammer is v and reaches its maximum value at the moment of impact. It can be seen from the law of free fall:
As shown in Figure 4, the plate was taken as the analysis object. The force F exerted by the hammer on the plate was a force that gradually accumulated and changed during the impact process. The impact load borne by the cable and F were a pair of mutual forces. The force F was recorded in real-time by the data acquisition system. This process satisfies the momentum theorem, then the average force during impact was:

Figure 4.
Instantaneous stress during impact.
As shown in Figure 5, the gravity potential energy of the hammer was transformed into impact kinetic energy. After the hammer impacted the plate, the cable was extended for a certain distance for h and the motion speed of the hammer became zero. During this process, part of the gravitational potential energy was absorbed by the cable and the other part was converted into the internal energy and mechanical energy dissipation. The work done by the average impact force of the cable in the collision process was Qc.
where ΔL represents extension length of cable and the unit is m.
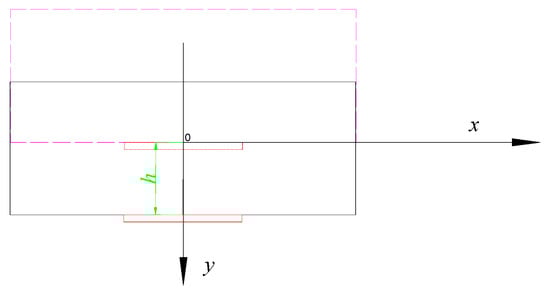
Figure 5.
Extension deformation of cable after impact.
5.3. Calculation of Internal Energy during Hammer Impact Progress
After the end of the hammer impact process, the internal energy of the cable changed due to the work done by the cable extension. The calculation formula for the internal energy in thermodynamics is as follows:
where Qn represents change of internal energy of cable and the unit is J; m represents cable mass and the unit is kg; ΔT is the change in temperature and the unit is degree centigrade °C; and c represents specific heat capacity and the unit is J/(kg·°C).
According to relevant studies, the specific heat capacity of cable changes with the change in ambient temperature [20]. The calculation of specific heat capacity is shown in Equation (6).
6. Impact Process Test Process and Data Analysis
As shown in Figure 6, Figure 7, Figure 8 and Figure 9, each picture only represents an impact process of the hammer. However, since the impact energy was not enough to break the cable, the hammer was bounced in the impact process, so there were several peaks in these pictures, and the total gravitational potential energy of the system was dissipated in the form of mechanical energy in the vibration process. The force “Pressure” in the figure refers to the tension generated by the cable during the impact process by the hammer, which represents the cable impact characteristics. During the hammer impact progress, there was a compaction stage when the hammer contacts the pallet, at which time the force of the cable increased rapidly. For the extensibility of the cable, the force was basically in a stable stage after the compaction of the hammer and the pallet, and the force at this time was “the impact pressure in the stable stage”.
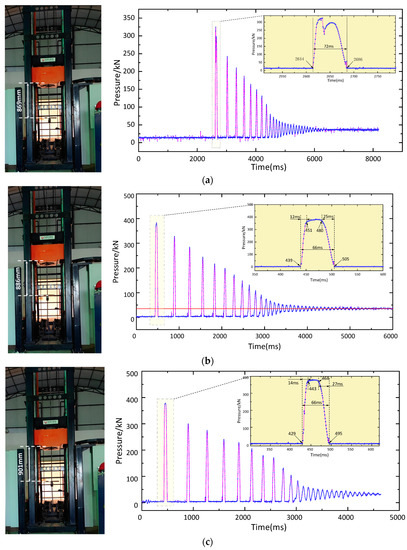
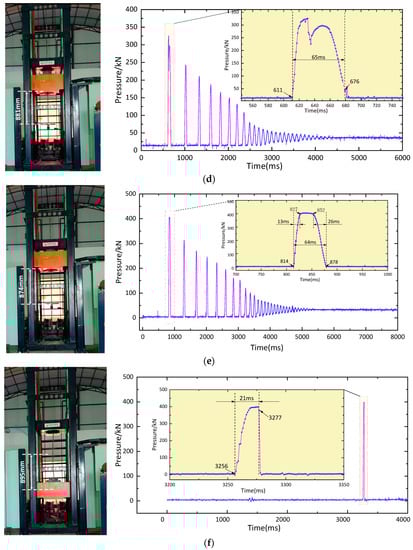
Figure 6.
Impact test process of Φ21.5 mm cable: (a) Φ21.5 mm first impact process; (b) Φ21.5 mm second impact process; (c) Φ21.5 mm third impact process; (d) Φ21.5 mm fourth impact process; (e) Φ21.5 mm fifth impact process; (f) Φ21.5 mm sixth impact process.
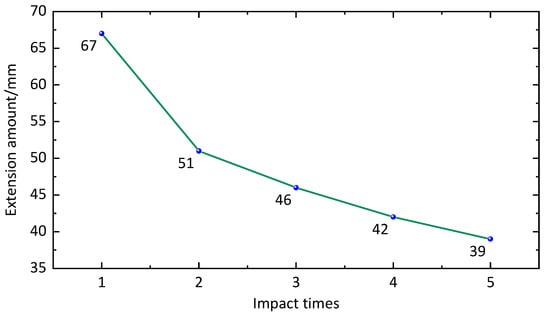
Figure 7.
Relationship between impact times and extension amount of 21.5 mm cable.


Figure 8.
Impact process of Φ21.6 mm cable: (a) Φ21.6 mm first impact process; (b) Φ21.6 mm second impact process; (c) Φ21.6 mm third impact process; (d) Φ21.6 mm fourth impact process.
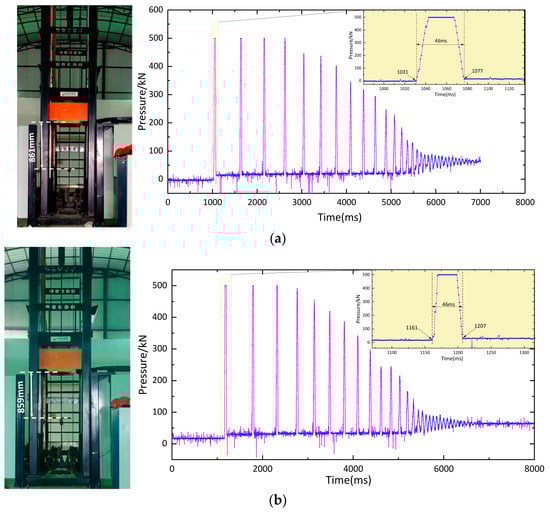
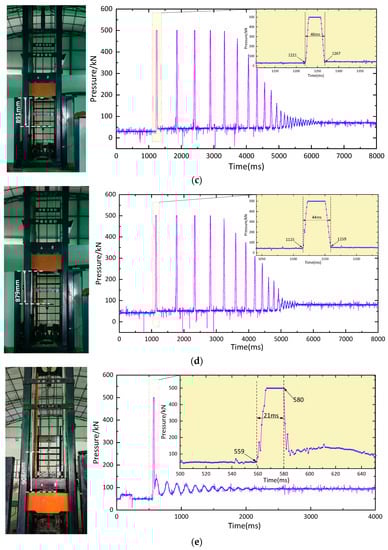
Figure 9.
Impact process of Φ21.8 mm cable: (a) Φ21.8 mm first impact process; (b) Φ21.8 mm second impact process; (c) Φ21.8 mm third impact process; (d) Φ21.8 mm fourth impact process; (e) Φ21.8 mm fifth impact process.
A large number of impact experiments on three kinds of cables were made. However, due to the article length limitation, for each of the three groups of cables, only the results for a representative sample are presented, which shows a typical behavior of a given cable under shock impact and the influence of micro-fracture or micro-cracks on the cable impact test was eliminated.
6.1. Impact Test Process of Low Resistance and High Elongation Cable
The cable of Φ21.5 mm had a tensile strength of 1030 MPa, withstood six shocks, and had a total impact resistance energy of about 12 × 104 J, which was the total extension of 245 mm when broken. The hammer impact process is shown in Figure 6a–f. The average duration of the first five impact processes before the cable was broken was 66.6 ms, and the duration of each impact was roughly the same. The average impact energy was 19,884.79 J, the average force was 167.7 kN, and the force in the stable stage of the impact process was between 320–375 kN.
The relationship between impact times and extension amount was plotted, as shown in Figure 7. Although the energy and force of each impact were roughly the same, the extension amount of the cable gradually decreased with the increase of impact times. The strength of the cable was strengthened under the impact force. The impact process of the cable could be roughly divided into three stages: the stage of the impact load rapid increase (about 13 ms), the stage of the stable force (about 25 ms), and the stage of the force rapid decrease (about 26 ms). The low-resistance and high-extension cable was similar to a viscoelastic body. The whole impact process was similar to the collision between a viscoelastic and steel body. The impact force in the compaction stage of the collision process was an approximately constant force [21,22].
6.2. Impact Test of High-Strength Cable
The cable of Φ21.6 mm had a tensile strength of 1770 MPa, withstood four shocks, had a total impact resistance energy of about 8 × 10⁴ J, and a total extension of 71 mm. The hammer impact process is shown in Figure 8a–d. The average duration of the first three impact processes of the cable without breaking was 51.7 ms. The duration of each impact was roughly the same. The average impact energy is 20,225.89 J, the average force was 209.3 kN, the force in the stable stage of the impact process was between 452–497 kN. This cable had a strength strengthening effect under the impact force. Compared with the cable of Φ21.5 mm, the impact process duration was shorter, and the impact process of the cable beared a higher impact force.
The cable of Φ21.8 mm had a tensile strength of 1860 MPa, and withstood five shocks. The total impact resistance energy was about 9.9 × 10⁴ J and the total extension was 68 mm. The hammer impact process is shown in Figure 9a–e. The average duration of the first four impact processes was 45.5 ms and each impact duration was roughly the same. The average impact energy was 19,666.15 J and the average force was 231.7 kN. The impact pressure in the stable stage was about 500 kN. The cable still had the strength strengthening effect under the impact force.
6.3. Data of Impact Test
The data of the impact test process are shown in Table 2. The height of the hammer was an important index affecting the test impact energy. The impact process compared the impact resistance characteristics of different cables under the same gravitational potential energy. The lifting process of the test machine focused on gravitational potential energy. The standard design impact energy was 2 × 10⁴ J. For each total impact energy in Table 2, the average impact energy of 19,885.3 J, and the standard deviation was 391.8 J. The ratio of the average energy of each impact to the design impact energy was 99.4%, and the standard deviation to the design impact energy was 1.95%. These data indicate that the change in the lifting height of the hammer had little influence on the designed standard impact energy, and it can be considered that every impact process was a standard impact process.
Table 2.
Test data of impact resistance of different types of cables.
6.4. Dynamic Load Characteristics Analysis of Different Cables
As shown in Figure 10, the higher the strength of the cable with the same diameter, the greater the average impact pressure it bore during the impact process. The higher the strength of the cable, the shorter the duration of the impact process and the lower the elongation. The relationship between indicators is shown in Formula (7).
where Δt represents the duration time of the impact pressure and the unit is ms; l represents elongation of the cable, and the unit is %; p represents the cable strength, and the unit is MPa; s represents the diameter, and the unit is mm.

Figure 10.
Comparison of dynamic characteristics of different cables.
There was no obvious positive correlation between the total impact energy (impact times) and the diameter and strength of the cable. To obtain the total impact resistance energy of the cable, it can only be obtained through actual measurement. When internal energy and mechanical energy loss were not considered, the relationship between the energy released by the extension and the characteristic of the cable was shown in Formula (8).
To characterize the impact resistance of different cables, the impact resistance index k was introduced.
where Q represents the total impact energy given by the hammer and the unit is J.
According to Formula (9), with the same energy provided by the hammer, the larger the energy Qc absorbed by the cable, the smaller the impact resistance index and the better the impact resistance of the cable. The impact resistance coefficient k of different cables can be calculated by the data in Table 2. The results are shown in Table 3.
Table 3.
Impact resistance coefficient of different cables.
Three types of cables were ranked by the impact resistance coefficient k: Φ21.5–1030 < Φ21.8–1860 < Φ21.6–1770. The cable of Φ21.5 mm had the best impact resistance. The cables of Φ21.8 and Φ21.6 had similar impact performance. Comparing the cable with Φ21.8 and Φ21.6 mm, the strength of cable was increased from 1770 to 1860 MPa. The strength was increased by about 5%, the elongation was reduced by 5.8%, and the impact resistance was increased by 23.8%. Comparing the cable with Φ21.5 and Φ21.8 mm, the strength decreased by about 44.6%, the elongation increased by 265.5%, and impact resistance increased by 20.6%. The strength and elongation of the cable are a pair of characteristic indicators with an inverse relationship. Improving the strength of cable inevitably leads to a reduction in elongation, and vice versa. However, simply improving a certain indicator cannot improve the overall impact resistance of the cable.
6.5. Analysis of Energy Loss during Impact Test
6.5.1. Internal Energy Loss
To study the internal energy loss of cable in the process of hammer impact, a temperature measurement was added in the process of impact. The weight per meter of the two cables is shown in Table 1. In the process of the impact test, the ambient temperature of the cable is 19.8 °C. The specific heat capacity of the cable is 439.7 J/ (kg·°C) calculated by Equation (7). The temperature measurement process is shown in Figure 11. The temperature variation test data of cables is shown in Table 4.

Figure 11.
Temperature measurement process before and after impact.
Table 4.
The temperature variation data of cables.
The data showed that the cable temperature change value of each impact was not fixed, and the proportion of increased internal energy was also not fixed. The impact times and the proportion of increased internal energy were plotted, as shown in Figure 12. The cable could be broken by the smaller impact energy during the last impact test progress, so the proportion of internal energy was also smaller. As a whole, the proportion of internal energy gradually increased and the conversion of kinetic energy into internal energy increased efficiency with the increase in the number of impacts. In the complete test process, the ratio of the internal energy to the total impact energy was 32.3% on average, and the internal energy loss accounted for about one-third of the total energy. With the increase in cable strength, the proportion of internal energy increase decreased gradually.

Figure 12.
The relationship between the ratio of internal energy to the total impact energy and impact times.
6.5.2. Gravitational Potential Energy Loss
During the dynamic load impact process of the cable, the extension of the cable will cause the reduction of gravitational potential energy, as shown in Table 5. According to calculation, the reduction in the gravity potential energy for the high strength cable of Φ21.6 21.6 and Φ21.8 mm was about 2.3% on average, and the reduction of the gravity potential energy for the low resistance and high extension cable of Φ21.5 mm was about 5.6%. The higher the elongation of the cable, the greater the reduction of gravity’s potential energy. On the whole, the reduced gravitational potential energy in each hammer impact process accounted for a small proportion of the total impact energy.
Table 5.
Loss ratio of gravitational potential energy.
6.5.3. Calculation of impact energy
With the final impact, the cable was snapped. Therefore, the extension of the cable after the impact could not be measured. Only the work done by the impact force during the test was calculated when the cable was not burst. According to Formula (4) and the data in Table 2, the impact energy was calculated, as shown in Table 6.
Table 6.
The proportion of impact energy to total impact energy.
The impact times and the proportion of impact energy were plotted, as shown in Figure 13. With the increase in the impact times, the proportion of impact energy in the total impact energy gradually decreased and finally tended to be stable. The impact energy of the two high-strength cables accounted for about 22% of the total energy during the impact process, while the low-resistance and high-extension cable accounted for 40.7% of the total energy on average. It indicated that the higher the elongation of the cable, the better the performance of absorbing impact energy.

Figure 13.
Impact times and impact energy ratio of cables.
7. Conclusions
(1) The repeated impact process can strengthen the cable. To quantitatively analyze the dynamic load characteristics of the cable, the impact resistance index k wsa introduced. The smaller the index, the better the energy absorption effect of the cable. The cable of Φ21.5 mm had the best impact resistance and the cable of Φ21.8 and Φ21.6 mm had similar impact performance.
(2) In the dynamic load impact process of high-strength cable, about 32% of the total hammer energy was converted into internal energy, about 2.3% into gravitational potential energy, and about 22% into impact work, and 43.7% of the total energy was mostly dissipated in the form of mechanical energy. In the dynamic load impact process of low-resistance and high-extension cables, 36% of the total hammer potential energy was converted into internal energy, 5.6% into gravitational potential energy, and 40.7% into impact work. Most of the 17.7% of the total energy was dissipated in the form of mechanical energy. The dynamic load impact process of the low-resistance and high-extension cables was similar to the viscoelastic impact. In the stage of collision compaction, the force was basically constant. Most of the impact energy was absorbed and transformed by the low-resistance and high-extension cables, and the disorderly dissipation of mechanical energy was less, so the impact resistance and energy absorption effect of this cable was better.
(3) The strength and elongation of the cable were a pair of characteristic indexes with an inverse relationship, and simply improving one index could not improve the overall impact resistance. The cable played an important role in the process of bearing the dynamic load of surrounding rock, and the anti-impact performance of cable should be considered in the dynamic load roadway support design.
Author Contributions
Conceptualization, X.L. and H.J. methodology, J.L.; software, X.L. and H.J.; validation, P.D.; formal analysis, X.L. and P.D.; investigation, X.L.; resources, P.D.; data curation, J.L. and H.J.; writing—original draft preparation, X.L. and J.L.; writing—review and editing X.L.; visualization, H.J.; supervision, P.D. and H.J.; project administration, X.L.; funding acquisition, H.J. All authors have read and agreed to the published version of the manuscript.
Funding
This research was funded by National Natural Science Foundation of China, grant Number 52004289 and U22A20165.
Data Availability Statement
The data presented in this study are available upon request from the corresponding author.
Conflicts of Interest
The authors declare no conflict of interest. The funders had no role in the design of the study; in the collection, analyses, or interpretation of data; in the writing of the manuscript; or in the decision to publish the results.
References
- Guo, X.; Guo, L.; Li, C.; Ma, N.; Zhao, Z.; Huo, T. A quantitative assessment method of roadway rockburst risk based on the plastic zone shape coefficient. J. China Univ. Min. Technol. 2021, 50, 39–49, 78. [Google Scholar]
- Liu, H.; Hao, Z.; Wu, X.; Zhao, X.; Guo, L.; Ma, Z. Mechanism of blast disaster induced by instantaneous malignant expansion of plastic zone. J. China Coal Soc. 2017, 42, 1392–1399. [Google Scholar]
- Liu, X.; Fan, D.; Tan, Y.; Ning, J.; Song, S.; Wang, H.; Li, X. New Detecting Method on the Connecting Fractured Zone Above the Coal Face and a Case Study. Rock Mech. Rock Eng. 2021, 54, 4379–4391. [Google Scholar] [CrossRef]
- Jiao, J.; Ju, W. Burst failure mechanism of roadway anchorage bearing structure under dynamic load disturbance. J. China Coal Soc. 2021, 46, 94–105. [Google Scholar]
- Kong, D.; Li, Q.; Wu, G.; Song, G. Characteristics and control technology of face-end roof leaks subjected to repeated mining in close-distance coal seams. Bull. Eng. Geol. Environ. 2021, 80, 8363–8383. [Google Scholar] [CrossRef]
- Wang, Z.; Jiang, P.; Meng, X.; Zhang, Z. Numerical study of support effectiveness and mechanism of pre-stressed bolts. J. Min. Strat. Control. Eng. 2022, 4, 56–66. [Google Scholar]
- Kong, D.; Pu, S.; Cheng, Z.; Wu, G.; Liu, Y. Coordinated Deformation Mechanism of the Top Coal and Filling Body of Gob-Side Entry Retaining in a Fully Mechanized Caving Face. Int. J. Géoméch. 2021, 21, 04021030. [Google Scholar] [CrossRef]
- Du, X.; Yao, W.; Li, Y. Analysis of 4 Typical Rock Burst Accidents from 2011 to 2013 in China. Saf. Coal Mines 2015, 46, 183–185, 189. [Google Scholar]
- Fan, D.; Liu, X.; Tan, Y.; Li, X.; Lkhamsuren, P. Instability energy mechanism of super-large section crossing chambers in deep coal mines. Int. J. Min. Sci. Technol. 2022, 32, 1075–1086. [Google Scholar] [CrossRef]
- Lv, F. Research and development of SKP22-1/1860 mining cable anchor. Met. Prod. 2014, 40, 10–14. [Google Scholar]
- He, J.; Wu, Y.; Fu, Y. Mechanics response law of surface protecting components for rock bolting under impact load. J. Min. Saf. Eng. 2021, 38, 556–564. [Google Scholar]
- Kong, X.; Zhang, B. Simulation experimental study on failure of anchor cable under impact load. Energy Technol. Manag. 2009, 6, 1–3. [Google Scholar]
- Xu, X.; Feng, H.; Jiang, L.; Guo, T.; Wu, X.; Sun, Z. Research on Deformation and Failure Evolution of Deep Rock Burst Drivage Roadway Surrounding Rock under Dynamic Disturbance. Shock Vib. 2021, 2021, 7956421. [Google Scholar] [CrossRef]
- Guo, T.; Feng, H.; Sun, Z.; Zhao, Y.; Wu, X.; Xu, X.; Jiang, L. Numerical Analysis of the Effect of Heterogeneity on Underground Roadway Stability under Dynamic Loads. Shock Vib. 2021, 2021, 2738627. [Google Scholar] [CrossRef]
- Li, C.C.; Doucet, C. Performance of D-Bolts Under Dynamic Loading. Rock Mech. Rock Eng. 2011, 45, 193–204. [Google Scholar] [CrossRef]
- Li, C.C. A new energy-absorbing bolt for rock support in high stress rock masses. Int. J. Rock Mech. Min. Sci. 2010, 47, 396–404. [Google Scholar] [CrossRef]
- Kang, H. Seventy years development and prospects of strata control technologies for coal mine roadways in China. Chin. J. Rock Mech. Eng. 2021, 40, 1–30. [Google Scholar]
- Liu, X.; Song, S.; Tan, Y.; Fan, D.; Ning, J.; Li, X.; Yin, Y. Similar simulation study on the deformation and failure of sur-rounding rock of a large section chamber group under dynamic loading. Int. J. Min. Sci. Technol. 2021, 31, 495–505. [Google Scholar] [CrossRef]
- Zhang, W.; Lian, X.; Wu, Z. A multi-channel verification index to improve distinguish accuracy of target signals in rock burst monitoring of heading face. Measurement 2022, 189, 110483. [Google Scholar] [CrossRef]
- Gao, W. Experimental Study and Numerical Analysis on Fatigue Performance of Prestressed Concrete Beam and Slab after Fire; Shandong Jiaotong University: Jinan, China, 2019. [Google Scholar]
- Zhang, R.; He, Y.; Wang, X. Analysis of Impact Mechanics Model between Viscoelastic Material and Steel. J. Hunan Inst. Eng. (Nat. Sci. Ed.) 2017, 27, 81–85, 94. [Google Scholar]
- Zheng, H. Mpact is a Constant Force. J. Xichang Teach. Coll. 2002, 4, 87–92. [Google Scholar]
Disclaimer/Publisher’s Note: The statements, opinions and data contained in all publications are solely those of the individual author(s) and contributor(s) and not of MDPI and/or the editor(s). MDPI and/or the editor(s) disclaim responsibility for any injury to people or property resulting from any ideas, methods, instructions or products referred to in the content. |
© 2023 by the authors. Licensee MDPI, Basel, Switzerland. This article is an open access article distributed under the terms and conditions of the Creative Commons Attribution (CC BY) license (https://creativecommons.org/licenses/by/4.0/).