Review

Models for Battery Health Assessment: A Comparative Evaluation

1
Department of Electrical, Electronics Engineering and Computer Science (DIEEI), University of Catania, Viale Andrea Doria, 95125 Catania, Italy
2
Enel Global Digital Solution, Viale Regina Margherita, 00198 Rome, Italy
3
Enel X, Contrada Passo Martino, 95121 Catania, Italy
4
Enel X–Enel Foundation Fellow, Contrada Passo Martino, 95121 Catania, Italy
5
Enel X–Enel Foundation Fellow, Via Flaminia, 00189 Rome, Italy
6
Department of Engineering, University of Messina, Contrada di Dio, S. Agata, 98166 Messina, Italy
*
Author to whom correspondence should be addressed.
Energies 2023, 16(2), 632; https://doi.org/10.3390/en16020632
Submission received: 29 November 2022 / Revised: 21 December 2022 / Accepted: 22 December 2022 / Published: 5 January 2023

Abstract

:
Considering the importance of lithium-ion (Li-ion) batteries and the attention that the study of their degradation deserves, this work provides a review of the most important battery state of health (SOH) estimation methods. The different approaches proposed in the literature were analyzed, highlighting theoretical aspects, strengths, weaknesses and performance indices. In particular, three main categories were identified: experimental methods that include electrochemical impedance spectroscopy (EIS) and incremental capacity analysis (ICA), model-based methods that exploit equivalent electric circuit models (ECMs) and aging models (AMs) and, finally, data-driven approaches ranging from neural networks (NNs) to support vector regression (SVR). This work aims to depict a complete picture of the available techniques for SOH estimation, comparing the results obtained for different engineering applications.

1. Introduction

Batteries, namely those devices able to store chemical energy and convert it to electrical energy, play an important role in achieving the target of universal access to clean, reliable and affordable electricity services. The Nobel Prize in Chemistry 2019 was awarded for the development of lithium-ion (Li-ion) batteries [1]. Nowadays, although lead-acid batteries are still widely used, Li-ion ones are recognized as the most used technology both for mobility and stationary storage applications of today and the near future. At the same time, advanced research on solid-state batteries is also taking place.
By 2040, 150 to 900 million electric vehicles (EVs) are expected to be on the road worldwide, which is two to three orders of magnitude higher than today. Over the same period, stationary storage may reach up to 1300 GWh, compared with about 3–4 GWh installed front-of-the-meter today [2]. Countries around the world are in the middle of an accelerated energy transition whose core elements are energy efficiency and renewable energy technologies, as well as their synergies. Such a transition appears to promote electricity as the preferred final energy carrier and plans to account for wind and solar energy for almost 50% of global electricity by 2050 [3,4].
Energy storage systems, and in particular batteries, are frequently addressed as the enabling technology that may push the transition towards a decarbonized and clean energy system, due to its potentially wise application in power systems and transport. As such, within the European Union (EU) batteries are specifically mentioned in several policy initiatives that address transport, raw materials and energy economic sectors, EU industrial policy and EU research and innovation. The strategic importance of batteries for the EU is further demonstrated by the promotion of the European Battery Alliance and the adoption of the Strategic Action Plan for batteries as an integral part of the third “Europe on the Move” package [2]. Furthermore, batteries are linked to the targets set out in the seventh Sustainable Development Goal (SDG) of the United Nations’ 2030 Agenda for Sustainable Development, which refers to energy and is titled “Ensure access to affordable, reliable, sustainable and modern energy for all” [5].
In this context, Enel X participates in the Important Project of Common European Interest (IPCEI) on batteries [6], with their initiative related to the development of a battery anomaly detection system based on an enhanced battery digital twin capable of modeling and predicting battery degradation. The Enel X project is focused on improving battery modeling, simulating the capacity derating and detecting anomalies. It aims to provide a tool that improves the lithium battery safety and reliability while decreasing undesired interruptions during operations and increasing their efficiency.
As part of this project, an in-depth study of the parameters linked to the degradation and to the amount of the charge of batteries is essential. It is being driven forward with research that is, by nature, interdisciplinary, involving engineers, chemists, physicists and materials scientists.
There are several other reviews in the area of battery health assessment estimation methods, some of which are presented below. All existing reviews aim to serve as a useful support for researchers and practitioners by systematically reviewing the available literature on SOH estimation methods. Nevertheless, given the large number of methods presented, the discussion is superficial and schematic. In [7], SOH prediction methods are divided into four categories: model-based methods, data-driven methods, hybrid methods, and other methods. For each reference provided, experimental errors are reported, but the difference between each structure is not well detailed. The same happens in [8], wherein classification follows direct assessment, adaptive, data-driven and other approaches. Additionally, part of the paper is helpfully addressed to discussing internal and external issues causing battery performance declines and challenges. Values identified in [8] are also reported in [9] by adding further comparisons. In [10], methods are divided into three categories: differential analysis (DA) methods, model-based methods and data-driven methods. Furthermore, the co-estimation of SOC and SOH based on model-based, data-driven and advanced sensing-based methods is reviewed. Although this paper represents a remarkable point, it remains generic. Paper [11], despite performing our classification, provides research achievements in terms of real-time battery SOH estimation for automotive applications, especially hybrid electric ones, leaving out the stationary field. Furthermore, in [12] the review of SOH estimation methods is inserted in a broader context related to prognostics and health management (PHM) for the automotive sector. On the other side, [13] has a focus just on the application of photovoltaic systems. Existing methods are categorized and discussed according to the signals used to extract health indicators, namely terminal voltage, temperature, ultrasound and force. Paper [14] distinguishes SOH estimation methods just in experimental and model-based estimation methods dealing marginally with increasingly widespread data-driven methods (counted among model-based estimation methods). On the other side, [15,16,17] only review methods related to machine learning (ML), and [17] is by far the most detailed one, giving a timely and systematic review of five non-probability-based algorithms for SOH estimation based on ML. Refs. [15,16] also considered other battery states. In [18], two different approaches are considered in terms of the way the method is carried out: experimental and adaptive methods. The first approach considers in turn direct measurements and a model based on measurements. Another singular subdivision can be found in [19], which distinguishes between spectroscopy and electrochemical techniques, methods based on models (semi-empirical models for capacity loss and equivalent circuit-based models), analytical models and statistical methods, providing only brief hints. In [20], SOH estimation approaches can be divided into measurement and analysis approaches, a Bayesian-based estimation approach, an empirical fitting approach, and an ML-based approach. Nevertheless, the dedicated space is even shorter than previous ones, since the paper includes almost all relevant states such as state of function (SOF). In [21], battery SOH at the cell-level and pack-level (a battery pack consists of the series and parallel connection of elementary cells, usually assembled into modules) are interestingly treated separately. The characterization parameters of individual cell SOH estimation methods can be divided into capacity, impedance and aging-mechanism-based parameters, whereas the estimation methods of battery pack SOH can be divided into model-based methods and data-driven methods. Much attention is paid in detail to the individual parameters but not to the methods as a whole. Likewise, in [22] the existence of a substantial number of approaches for the estimation of different battery states and parameters, including SOH, is generically discussed. In particular, SOH related to the battery power capability is distinct from SOH related to the battery energy capability. Naturally, less recent reviews such as [23] were also considered, although they are sparse about SOH, which is a current parameter. By the way, all mentioned documents contribute, each in their own way, to progress in the research on the topic. Nevertheless, different from previous works, this work does not claim to cover the whole multitude of battery models for state of health estimation or give a broad overview over the landscape of existing models, but it is focused only on a handful of selected methods, investigating their strengths and weaknesses as well as their applicability to different situations. For each method analyzed, a comprehensive sketch of every single aspect relevant to its implementation and optimization is presented, offering readers a single document with an understanding of different structural solutions found in the literature, making a comparative analysis when necessary. Therefore, it is not a simple comparison between methods since the different processes followed by various authors for each method are deepened, dissecting their peculiarities.

2. Degradation and State Parameters

Li-ion batteries are complex electrochemical, time-varying and nonlinear systems, whose internal mechanisms are not yet fully understood. Battery degradation is a process involving many electrochemical reactions at anode, separator, cathode and electrolyte/electrode interfaces. The battery aging process depends on internal factors concerning the loss of active material (LAM), the loss of conductivity (CL) and the loss of lithium inventory (LLI). In particular, LAM includes the decomposition of anode and the cathode material and electrolyte, respectively. CL refers to the battery’s current collector breaking and decomposition, as well as to the battery adhesive detachment and degradation. Finally, LLI includes the constitution of lithium dendrites, the generation of a solid electrolyte interphase (SEI) layer and the self-discharge of the battery [7]. At the same time, operating conditions like temperature, the number of cycles and power magnitude also influence the battery aging process.
The different Li-ion battery chemistries on the market feature different open circuit voltage (OCV) and different degradation behavior. While some materials are quite robust and typically have a long-life cycle, others degrade faster but present other benefits; this means that the optimal battery chemistry depends on the application.
The Li-ion battery is one of the most investigated research topics today. Many organizations are providing datasets to accelerate research on a wide set of battery models useful in predicting degradation and failures. In general, for any given system, an ideal solution could be collecting all the data available and processing them using efficient techniques to assess its state parameters. A comprehensive review of datasets related to Li-ion batteries available in the public domain is presented in [24]. We also have designed a battery testing system with a software/hardware interface to collect data (voltage, current, temperature, cell charge capacity and cell energy capacity) over time when cycling batteries at room temperature and at controlled temperature inside an environmental test chamber [25]. The creation of such a dataset, being able to vary charge and discharge conditions following the specific needs of various estimation methods, is proving to carry out a robust study on battery life prediction.
In this regard, several battery parameters must be known for effective battery management. Generally, they change in real-time due to fast-changing microscopic electrochemical parameters. Predominant indicators are the state of charge (SOC) and the state of health (SOH) [10]. SOC is an indicator of the amount of energy available in the battery in comparison with its maximum capacity: conceptually, it is quite similar to the fuel gauge. SOH is an indicator of the battery aging condition in comparison to its native condition. SOH is usually calculated in terms of battery capacity fade. To describe the loss in power, the state of power (SOP), intended as the ratio of peak power to nominal power, has been introduced. Moreover, SOF focuses on the battery-specific continuous or instantaneous power output capability in a period and relates SOC and SOH with the degradation of output power [26]. Remaining useful life (RUL) is also associated with SOH: if we assume that the SOH of a new battery with no degradation, i.e., at the beginning of life (BOL), is 100% and that, when the SOH value reaches 80%, the battery has reached its end of life (EOL) and must be replaced, then the RUL represents the remaining lifetime until the EOL [27]. There are also many other acronyms including the state of energy (SOE) determining the battery’s remaining energy and the state of temperature (SOT) precisely concerning temperature and state of safety (SOS) which considers events that changed the safety behavior of the battery [28]. The latter qualifies as a fundamental parameter to schedule timely maintenance, ensuring the efficiency and optimal performance of battery systems. Because of the high value of Li-ion batteries in sustaining the energy needs of humanity, they need to be used safely and reliably, avoiding catastrophic accidents with fire hazards [29].
Battery states are connected and interact with one another, often resulting in multi-state joint estimation. Despite the plethora of existing parameters, this review will only deal with the calculation of SOH with references to SOC.

3. Battery State of Health Determination

According to the definition, the SOH represents the maximum discharge capacity in comparison to the rated capacity of batteries as analytically described in (1):
SOH ( t ) = C max ( t ) C max ( 0 ) · 100 .
Strictly following the definition above, SOH can be calculated as the inverse ratio between the charge available by discharging a fresh battery under the maximum voltage range of the datasheet according to regulated operating conditions (i.e., the nominal capacity C max ( 0 ) ) and the charge extracted from the fully charged battery that is then discharged considering the same voltage range and same conditions ( C max ( t ) ) . The condition just described is difficult to reproduce in an environment other than an equipped laboratory. Moreover, the battery may not be able to be fully discharged or fully charged.
Various methods have been reported in the literature for SOH estimation. However, an unambiguous procedure has not been established yet. In this review, SOH estimation methods can be roughly distinguished between experimental methods, model-based methods, and data-driven methods. However, the demarcation between the three categories is extremely blurry, as many hybrid methods exist in the literature.
Experimental methods rely on specific experimental techniques that acquire measurements of phenomena and physical quantities mostly reflecting the global response of the battery cell. Acquired experimental data are then used to develop and validate the cell performance [30].
Model-based methods describe batteries through electrochemical, equivalent electric circuit models (ECMs) and/or empirical models according to the interpretation of certain battery processes [31].
Finally, data-driven methods headed by neural networks (NNs) are based on data handling and ML, which is a specific application of artificial intelligence (AI). These methods estimate battery degradation by mapping external characteristics to battery capacity loss [32].
It is anticipated that each method has its complexity, mode of operation and scope of application and that better results can be achieved under certain circumstances. On the other hand, in the literature, there is no univocal evaluation index: for example, in [7] wherein a detailed synopsis of the evaluation results for different SOH estimation methods is reported, definitions such as accuracy, best-fit values, maximum estimated difference, performance and other similar expressions are addressed. Otherwise, there are more detailed performance indices, such as percentage mean squared error (MSE), percentage root-mean-square error (RMSE), mean percent absolute error (MAPE) and mean absolute error (MAE) as expressed in (2)–(5) respectively, where N is the total number of training samples, SOH k is the estimated SOH by the selected method at timestep k, and SOH k * is the ground truth SOH value at timestep k:
MSE = 1 N k = 1 N ( SOH k *     SOH k SOH k * ) 2 × 100 ,
RMSE = 1 N k = 1 N ( SOH k *     SOH k SOH k * ) 2 × 100 ,
MAPE = 1 N k = 1 N SOH k   *   SOH k SOH k *   ×   100 ,
MAE = 1 N k = 1 N SOH k *     SOH k   ×   100 .

4. Experimental Methods

Experimental methods are conducted in a laboratory environment to analyze battery aging processes and provide theoretical support for model-based and data-driven methods.
As depicted in [14], experimental methods encompass direct measurement methods and indirect analysis methods. Direct measurement methods use capacity tests, impedance measurements and other tests to measure SOH directly. On the contrary, indirect analysis methods require data analysis and processing to find the SOH-related parameters. That is, according to a multi-step derivation method, after obtaining the relationship between the health indicators and capacity or resistance, SOH can be obtained.
Among the various methodologies, electrochemical impedance spectroscopy (EIS) and incremental capacity analysis (ICA), belonging respectively to the first and second groups, are dealt with below.

4.1. Electrochemical Impedance Spectroscopy

EIS allows investigating physical and chemical phenomena over a suitable frequency range [33]. Nevertheless, according to a literature survey in [34], EIS is not frequently used in lithium-based battery studies due to the difficulty of being calculated online, and, where it is used, it is primarily a supporting technique in offline measurements.
An electrochemical system is excited at different frequencies through a small-amplitude potential or current periodic perturbation to ensure a steady state. According to the harmonic response, the impedance of such a system represents the transfer function, which can then be calculated by measuring the current or the potential of the system. An improved version is the dynamic EIS, wherein the small alternating current perturbation signal is superimposed on the direct current bias that mimics the charge or discharge conditions of a cell. In [35], a multi-sine EIS technique was applied, using a specifically crafted excitation signal with superposed sine waves of different frequencies from 1–6 kHz down to 1 Hz, such that an impedance spectrum can be acquired every second.
The most used power converters for EIS are non-isolated DC–DC converters, since they are simple and have minimal requirements. In [36], challenges and opportunities for utilizing power converters as an EIS perturbation source are outlined. Especially for online EIS, accuracy might be impacted, and the power converter design and control become complex. In electric vehicles (EVs), where the pack voltage can exceed 800 V, high voltage converters are needful. By imposing an AC signal with a DC offset, the peak current level in the switches and batteries increases so that the used semiconductors could be overrated. Dealing with a battery pack where cells are connected to each other, online EIS is influenced by the connected circuits. Hence, measured results need to be compensated or extra circuitry is required for isolating each cell during EIS. Since the degradation of cells could be different, the most promising way is to apply EIS to single cells or modules at the expense of a higher final cost of the product.
The usual form of plotting impedance data is a Nyquist plot where the resistance is displayed along the (real) x-axis and reactive components are displayed along the (imaginary) y-axis [37], as depicted in Figure 1.
The effect of the DC offset during dynamic EIS, the rest time, impacts of the SOC, temperature and aging on the EIS Nyquist plot of a lithium nickel manganese cobalt oxide (NMC) cell are shown in [36]. Depending on the state of the cell operation (charging/discharging), the EIS spectra can be slightly higher/lower than that of stationary EIS. An impedance shift to the right due to the duration of the rest time occurs at lower frequencies around 1 Hz, while, at high frequencies near 1 kHz, the impedance behaves independently of the rest time. Likewise, there is a shift toward the right side and up as the SOC increases with more irregularities in the impedance spectra per SOC equal to 0 and 100%. Especially at low temperature, the shape of the graph deforms so that battery temperature should be considered in SOC estimation. Finally, aging not only shifts the spectra toward the upper right side of the complex plain but also deforms the shape of the Nyquist plot at particularly low frequencies.
In the ideal case, the impedance spectrum contains a separate feature for each elementary process that constitutes the overall electrochemical mechanism. The main strength of EIS is just its ability to effectively deconvolute complex electrochemical processes into a series of basic processes based on the different relaxation times. However, in practice, processes are extremely difficult to deconvolute from a single measured spectrum. In [34], a comparison between the theoretical impedance response for an ideal case and a practical EIS measurement where many of the predicted features are not seen due to the overlap of time constants, very small impedance values for certain steps or other measurement artefacts are well illustrated. Consequently, it is appropriate to consider specific cell configurations and geometries. Examples are a symmetric cell configuration that consists of two identical electrodes or a three-electrode cells configuration, which additionally includes a separate reference electrode probing the processes only on the selected electrode. However, there are several experimental approaches to effectively decoupling the merged parts of the impedance spectrum into individual features. Among them, there is the systematic variation of the cell components and analysis of the corresponding changes in measured EIS spectra, such as a change in the electrolyte concentration or a modification of the electrode thickness. It is also possible to combine EIS data with data obtained from complementary techniques, such as the visual inspection of the specimen or a range of microscopic techniques combined with local chemical analysis.
The analysis of measured impedance data can be carried out using the equivalent circuit analysis. A process such as the migration of a charge through a phase exhibits the same response as ordinary macroscopic electric resistors, and the accumulation of a charge at a phase boundary exhibits the same response as capacitors. In [37], a schematic idealized impedance complex plane plot for a multicomponent system and its ideal ECM are well represented. In [38], a particular ECM based on the physics of the system is proposed, concluding that the kinetic parameters associated with the anode, charge transfer resistance and diffusion resistance are the most adequate for following the SOH.
Alternatively, SOH by EIS can be estimated based on data-driven methods. In this regard, a complete review can be found in [39]. Among the various described methods, authors in [39] presented an approach wherein EIS data are processed using a convolution neural network (CNN). In addition, a bidirectional long short-term memory (BiLSTM) model is used for serial regression prediction and the improved particle swarm optimization (IPSO) algorithm is proposed to optimize the model. The so-called IPSO–CNN–BiLSTM model shows satisfactory SOH prediction results with RMSE on average equal to 1.83% as opposed to that of ECM, equal to 5.86%. In general, methods based on ECM, need accurate EIS data for model fitting: once there is an error in the EIS data, error propagation will occur in ECM fitting and SOH prediction, leading to greater RMSE.
To prove that the impedance is strongly influenced by the geometry and cables of the system, a calibration workflow is employed in [40] for Ni-Cd batteries. The proposed solution uses a two-term impedance calibration process. Resistance and reactance are simulated using an electromagnetic finite element model (FEM) to analyze the effect of the cable fixturing, including the self-inductance of the wire conductors due to alternating currents. It is proved that, at high frequencies above 200 Hz, an average variation of about 8% on the real part and 6% on the imaginary part of the impedance value is obtained.
Basically, cell connections, signal-to-noise ratio (SNR) and the nonlinear behavior of the battery cell demand special attention. In [36], it was learned that a four-terminal connection or Kelvin connection results in minimum external impedance at the cell level. An optimum current excitation should result in 10 mV voltage amplitude, provided that the required excitation current amplitude increases linearly proportionally to the battery cell capacity (experimental tests on NMC chemistry).
Moreover, results in [35] show that impedance spectroscopy is very sensible to safety-critical degradation effects that happen during exposure to high temperatures. Even at moderate temperatures of about 65 °C, initial degradation effects can already be observed.
To gain useful insights into Li-ion cell degradation and to validate the interpretation of EIS measurements, several physic-chemical analysis methods of battery materials obtained from aged cells as part of a postmortem analysis can be employed as discussed in [41,42].
For the sake of completeness, it should be noted that, in [43], a DC impedance spectroscopy (DCIS) method is proposed. While AC impedance spectroscopy (i.e., the traditional EIS) must rely on Fourier, Laplace, or other operators to obtain the impedance spectrum from the response signal, DCIS does not rely on frequency domain impedance to obtain battery parameters. In fact, it is a time-domain method that measures internal resistance through a time function. In particular, the internal structure of the battery can be simplified into multiple resistance–capacitance (RC) networks whose value can be obtained by changing the current pulse width according to the different time constant characteristics of the RC network. Thanks to the low-cost and high-speed requirements for real-time battery diagnosis, by avoiding the data cross-domain conversion of the time-domain EIS technology, the DCIS method reduces the difficulty of data analysis and potentially accelerates diagnostic processing.

4.2. Incremental Capacity Analysis

The ICA technique fits with methods that have low computational demands and are suitable for battery management system (BMS) implementation since only two parameters need to be monitored (voltage and charge/discharge capacity), sometimes with some detriment to the accuracy [44]. It has proven to be suitable for estimating the capacity fade and, subsequently, the SOH of batteries.
The ICA technique consists of differentiating the battery charging capacity q [Ah] against the battery voltage v [V] as in (6):
IC = dq dv Δ q Δ v .
Therefore, it falls into the category of DA methods. As shown in Figure 2, this results in an incremental capacity (IC) curve where the following IC metric points can be defined: peaks, valleys and voltage values.
Each peak has a unique shape, intensity and position, and it exhibits an electrochemical process taking place in the cell [45]. In particular, peaks represent phase equilibria in both the anode and cathode (while the reciprocal of the curve indicates phase transitions in the electrodes) [46]. That is, the height describes the charge transfer rate at the examined voltage value, while the area under the peak describes the amount of charge transferred within a certain voltage range [47]. Several researchers have demonstrated that the characteristic peaks and valleys that appear when applying the ICA method can be used to estimate the actual capacity of the battery [48].
The choice of the ∆v amplitude is a compromise between the prominence of the peaks and valleys and the capability to suppress spikes or dips caused by random current changes due to the charger. In [48], ∆v was kept fixed at a value of 40 mV, and the corresponding change in capacity ∆q was then calculated.
The capacity is simply defined as the integration of the current i [A] during charging, as in (7), considering the time at the kth sampling point and N as the difference window:
q = t k N t k i   dt .
If a constant-current and constant-voltage (CC–CV) protocol [25] is employed during the charging process and just data acquired during the CC charging phase are used to calculate the IC curve, keeping the sampling frequency fixed, (6) can be rewritten as in (8):
dq dv     I ·   Δ t · N v k v k N ,
where I is the current during the CC phase and Δt the sampling period. Hence, in this case, the shape of the IC curve is only related to the reciprocal of the slope of the charging voltage curve. In particular, a slow change in voltage is reflected on the IC curve as a peak, while a rapid rise in voltage is reflected on the IC curve as a valley [49].
In [45], the IC curve construction is depicted with extreme clarity, showing how peaks on the IC curve correspond to voltage plateaus on the initial cell voltage versus the charged capacity curve. After discharging and charging lithium iron phosphate (LFP) cells at a C/3 current rate in a climatic chamber at 50 °C, a decrease in the last peak and capacity reduction can be noted, which highlights a capacity loss due to LLI. Moreover, a slight right shift of the curves corresponding to an equivalent series resistance rise is also observed.
Lower charging/discharge current rates such as C/20 or even less, which are typically used to study ageing, have more pronounced peaks in the differential voltage spectrum and lower polarization influence on IC curves [50].
In [47], the applicability of the methods for higher C-rates was examined, proving that when the charging rate is increased, peaks tend to merge. In particular, the decrease in the accuracy is more evident in the case of LFP cells rather than NMC and lithium titanate (LTO) cells, since LFP cells have significantly narrower characteristic peaks. The RMSE of the fitted model for LTO is 0.85% for C/3 charging, 1.58% for 1C charging and 1.57% for 2C charging. The RMSE of the fitted model for NMC is 1.37% for C/3 charging, 1.60% for 1C charging and 4.72% for 2C charging. The RMSE of the fitted model for LFP is 2.12% for C/3 charging and 2.33% for 1C charging while being so big that it is not reported for 2C charging.
In [51], the influence of sampling frequency on IC curves is evaluated by testing NMC cells with a C/2 current rate. As result, a sampling frequency of 0.1 Hz is suggested, as it can provide enough useful data points for deriving IC curves, decreasing the computational effort of curve smoothing. There are no substantial differences at 1 Hz or 10 Hz, while curves become problematic to manage for values below 0.1 Hz.
IC-based health monitoring is available even during partial cycling. In fact, even if, in real-life applications, batteries are charged from different levels of SOC, at a low charging rate, it does not involve large changes in the IC curve, since it is plotted with respect to the voltage, which has a more defined position as opposed to the capacity [50]. Conversely, for higher current rates, the depth of discharge (DOD) could have a significant impact on the IC curve shape and thus on the peak area. As emerges in [45], wherein LFP batteries were tested, peaks could be related to the cohabitation of two graphite phases, and, since at a relatively high charging current, the graphite electrode never reached the thermodynamic stability, the graphite phases were not well-defined. Hence, a solution was to add a pause during the charge, just before the IC peak B at a SOC close to 50%, opening the battery circuit for 30 min. This allowed the graphite electrode to reach thermodynamic stability before the charge continued and before the ICA is computed, making it able to estimate the remaining cell capacity within a 4% error. In the same study, it was shown that the peak area was bigger with increasing temperature because graphite lithiation was activated by temperature, while the equivalent series resistance declined.
Similar findings concerning the sensitivity of IC curves to current rates and temperature changes can be found in [44]. When testing cells with graphite anode and LMO/NMC cathode, a change from C/5 to C/2 in the charging current can result in a 15% change in the amplitude of the IC peak. At the same time, a shift in the measurement temperature from 15 to 30 °C can result in an approximately 20% deviation in the amplitude of the IC peak.
In the spirit of considering real applications, in [48], tests were applied on both the cell and vehicle levels. Only calendar ageing is considered at the cell level, while the battery pack at the vehicle level is considered as a black box with no access point to measure or control temperature and the real terminal current fed into the vehicle. However, it was shown that peak and valley locations at the cell level match with those at the vehicle level. The NMC battery type (used in the BMWi3 EV) provided better results than the LMO type (Nissan Leaf EV), having an RMSE of 1.33% and 2.92% and a MAE of 4.25% and 8.54% respectively.
ICA is particularly relevant to LFP, wherein a direct voltage analysis is inaccurate to determine any state of the battery, since the cell voltage only varies by 150 mV, while the charging state may vary from 10% to 90%; it is, therefore, preferable to analyze the voltage curve shape (slopes and plateaus) instead of the absolute value [45]. Specifically, for batteries with flat voltage vs. SOC regions, data processing via a two-point numerical differentiation is problematic once the derivative of the voltage approximates zero, yielding results of infinite slopes. In general, differential curves are very sensitive to amplitude resolution, cell performance change and measurement noise. For these reasons, the first step when performing SOH analysis is smoothing. Widespread filtering techniques are, for example, moving average, Gaussian filter and Savitzky–Golay filter [50]. In [52], a robust cubic smoothing spline method was presented, proving its superiority over typical filters that require tuning window size usually by trial and error; in this case, smoothing parameters could be determined by cross validation with a resulting RMSE for LFP batteries of 0.49% or 1.55%, depending on whether low or high noise is introduced.
The IC curve is correlated with SOH by constructing an offline analytical function between the battery capacity and some so-called features of interest (FOI) as a function of every possible degradation path [50]. Typical features used in the published literature are peak height [53], peak height ratio [52], peak and valley position [51] or peak area [54]. Regarding the last feature, there is no exact definition, as the voltage range can be defined based on a constant distance from the peak maximum or based on the shape of the peak [47]. However, one of the most popular methods to identify the peak area is that explained in [45]. Apart from the aforementioned FOI, other studies have proposed their own, such as regional capacity (capacity change over a predefined time interval linked to the concept of regional voltage) in [55].
Several numerical procedures have been developed and evaluated for extracting FOIs and associating them with capacity fading. In [53], support vector regression (SVR) was used to achieve this goal (considering peak heights), and the model could predict the capacity fading of LFP cells with less than 1% MAPE except for a few outliers. In [51], after identifying monotonic trends in the positions of peaks and valleys as the battery ages, a linear regression function was established by using the Matlab curve fitting toolbox with less than 2.5% MAPE. In [52], a robust linear regression with the bisquare method was used, with a resulting RMSE for the worst cell of 2.69%, 4.44% and 8.69% considering the peak height ratio, peak height value and peak area, respectively. It was characterized by differently weighted observations based on their tendency of being an outlier, and the prediction interval was obtained with a bootstrap method by predicting error resampling based on 1000 replications. In [54], three other types of regression methods are proposed and compared: ordinary least squares (OLS) method (which picks the regression coefficient to minimize the residual sum of squares), ridge regression (which shrinks the regression coefficients by imposing a penalty on their size and uses them to minimize the penalized residual sum of squares) and linear regression with Pearson’s product–moment correlation-based peak area selection method. After adopting cross validation to verify the accuracy, the resulting RMSE for the worst of the six LFP batteries under test is equal to 1.41%, 1.08% and 2.78%, respectively.
For ease of reading, the multitude of data presented is summarized in Table 1.

5. Model-Based Methods

According to the classification into three main categories, electrochemical models use physical laws, such as concentrated solution theory and porous electrodes, to describe the electrochemistry inside batteries, offering a better understanding of the underlying physics mechanisms, such as diffusion, migration and reaction kinetics [56]. Examples are the pseudo-two-dimensional model (P2D), the single-particle model (SP) and other simplified pseudo-two-dimensional models (SP2D) [57]. On the other hand, ECMs want to form a circuit network to simulate the dynamic characteristics of the battery using a combination of a voltage source, resistors, capacitors and sometimes non-linear elements. Of all the models, Thevenin is the most popular. Adaptive filtering, observers and the OCV method are just a few techniques for identifying circuit parameters [58]. Finally, empirical models focus on the battery as a black box, testing the battery at different combinations of temperatures T, SOCs and different charging/discharging C-rates [31].
To follow, ECMs and empirical models will be explored.

5.1. Equivalent Electric Circuit Models
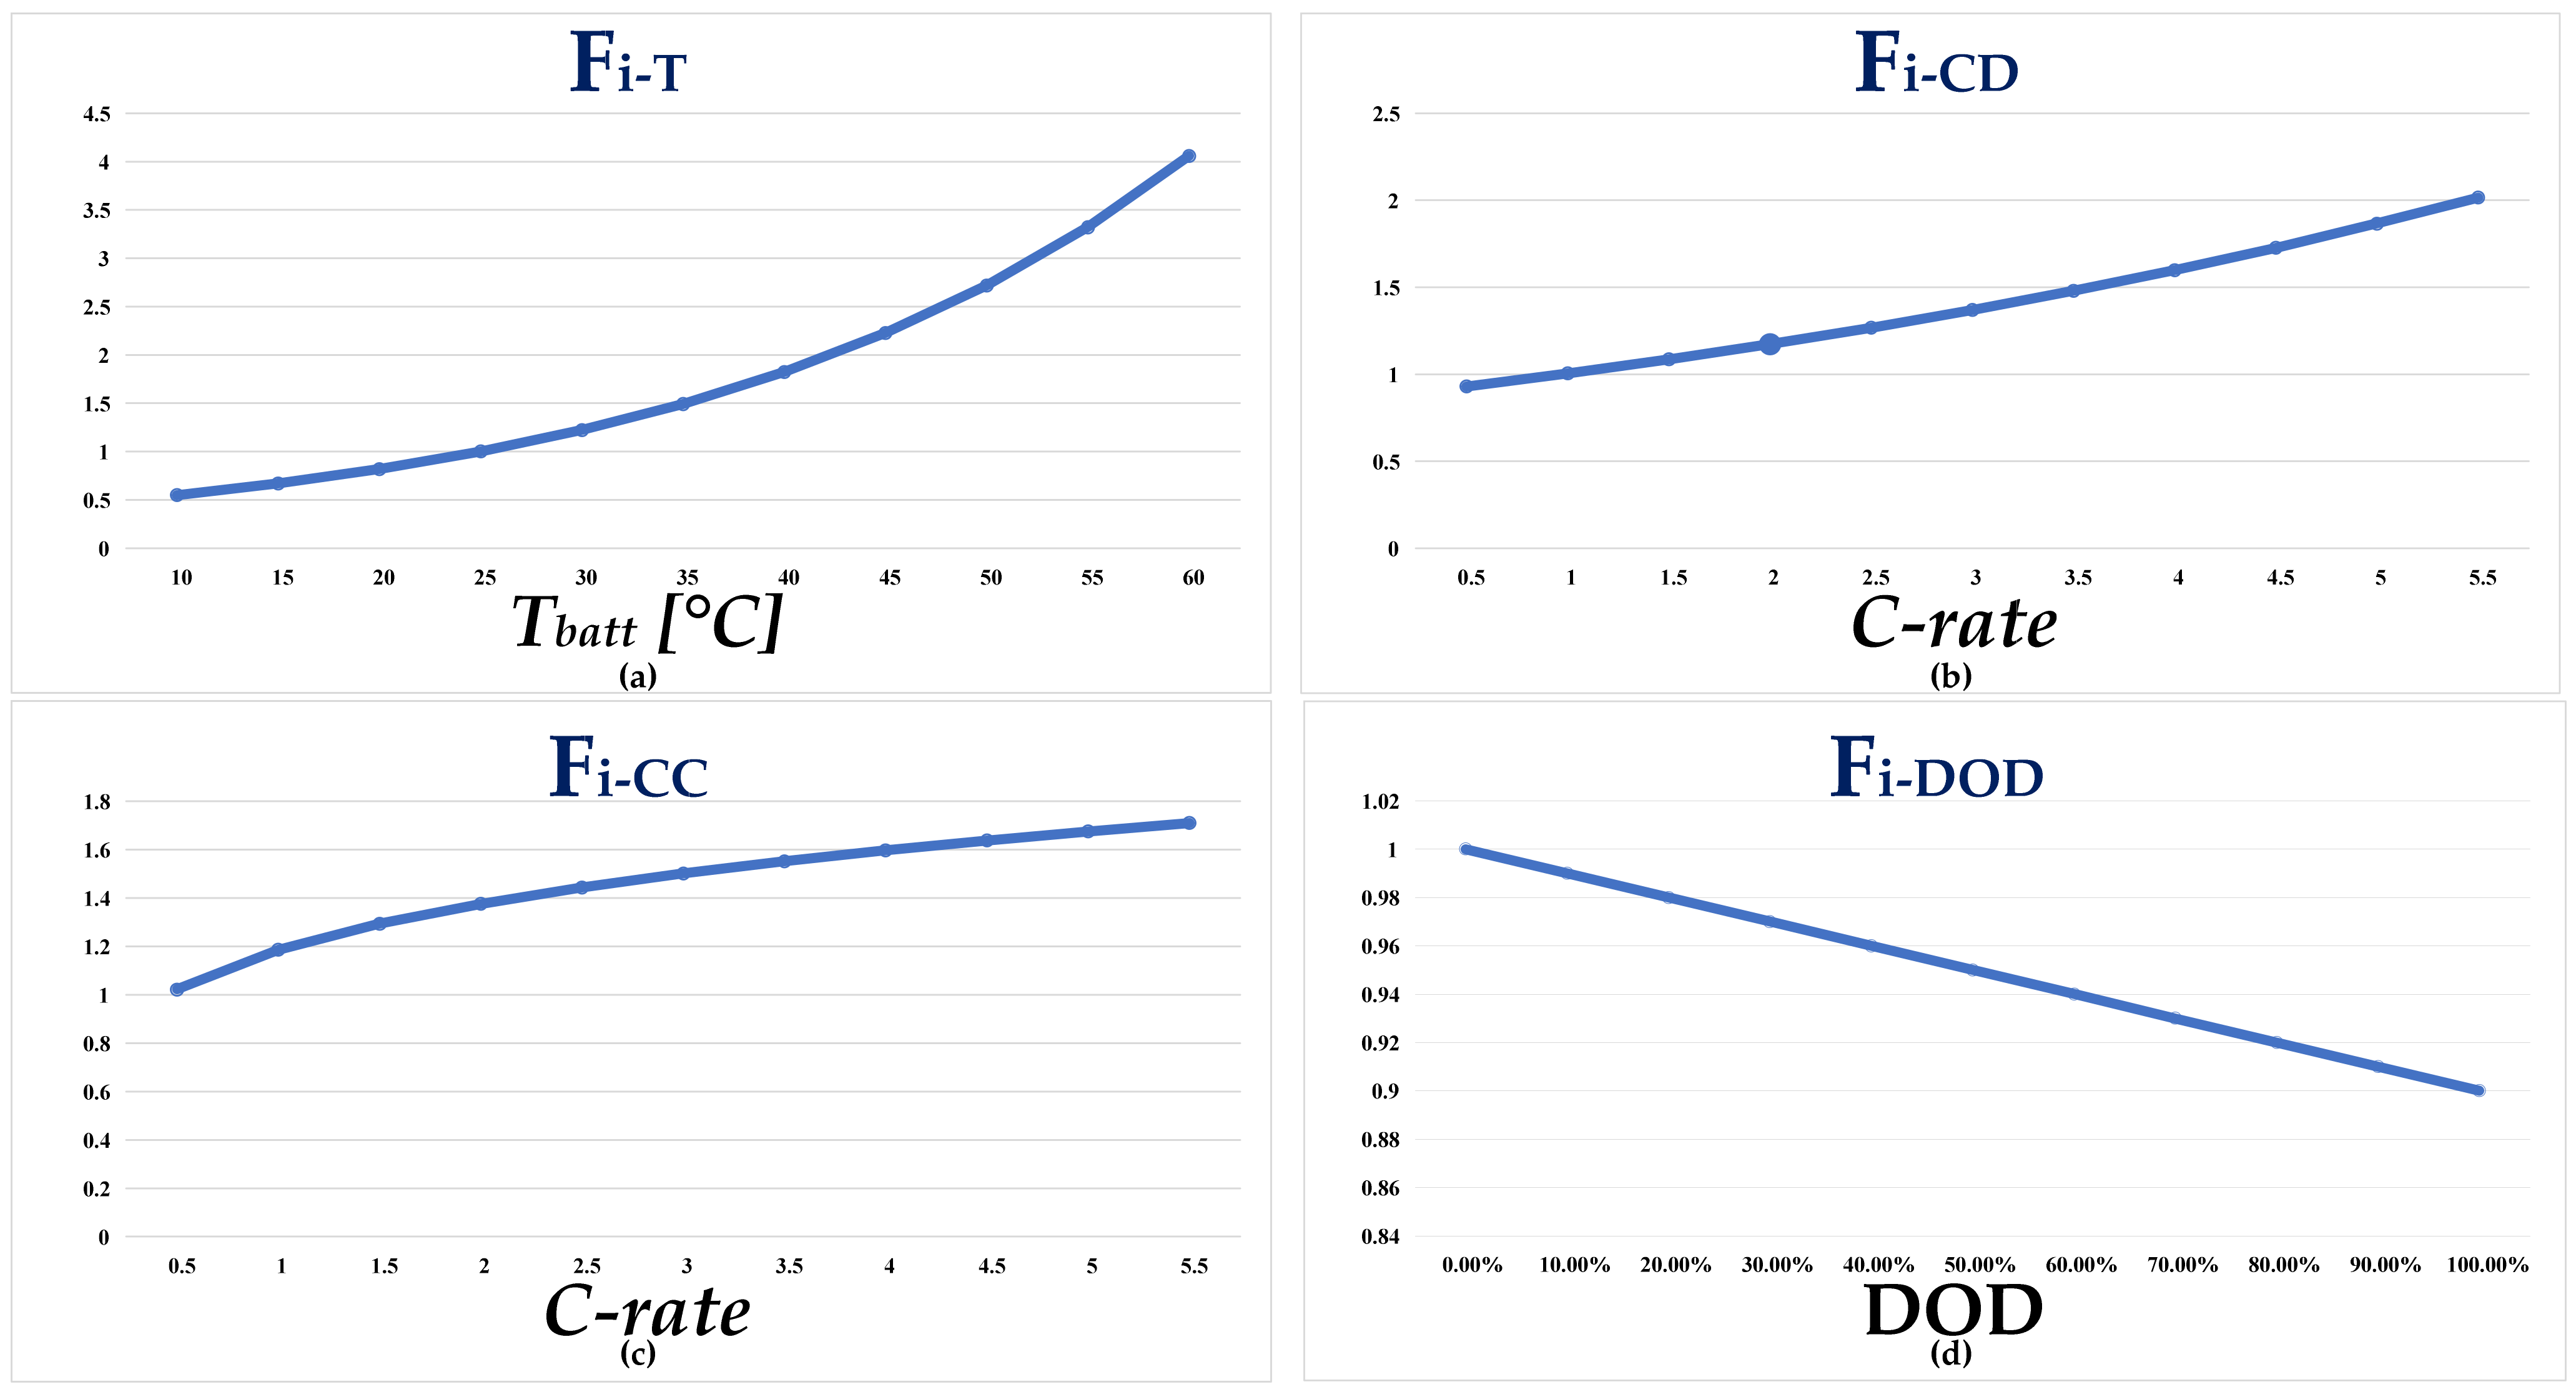
Circuit models for battery energy storage systems (BESSs) can be grouped into a few main categories, as listed in the following. Part of the information comes from previous works by the authors of this review.
Basic models: The simplest circuit is obtained as the series connection of a constant voltage generator E0 and a resistor Ri [59,60,61,62]. The constant generator E0 represents the no-load voltage, usually referred to as the full-charge state. The resistor Ri models the voltage drop at the internal resistance, as well as at the terminals in the presence of current flow [61]. In most cases, it is necessary to consider the variation of Ri with SOC, which is observed for most battery technologies [60,61]; this allows for better accuracy.
Sheperd, Unnewehr and Nernst models: These models derive from stoichiometric electrochemical formulations. The different models belonging to this category are the ones proposed by Sheperd [63], Unnewehr [64] and Nernst [65].
The original Sheperd formulation is in stoichiometric form, and the transition to a simpler ECM is carried out by accepting some approximations. A popular simplified version is:
v model t = E 0   R i   ·   i t μ s SOC ,
where μ s is a constant term that links the variation of the voltage v model to the actual SOC, and i t is the battery current, positive during discharge.
The Unnewehr formulation is similar to the Sheperd version:
v model t = E 0   R i   ·   i t   μ u ·   SOC .
Thanks to its polynomial expression, this kind of model shows good accuracy when applied to restricted areas of discharge operation [64].
Both Sheperd and Unnewehr mathematical models are represented in the form of ECM placing a V add voltage generator in series with voltage generator E 0 and resistor R i . The amplitude of V add depends on the actual SOC value.
Another model deals with Nernst stoichiometric formulation [65]. Once again, a simplified ECM is obtained by using two V add controlled voltage generators related to SOC and proportional to μ 1 and μ 2 , the latter being constant terms:
v model t = E 0   R i   ·   i t + μ 1   · ln SOC + μ 2   · ln 1 SOC .
RC linear models: A basic RC linear model integrates an RC network R d C d that models the transient behavior of BESS during current steps [60,64,66,67,68,69]. In some applications, the behavior of BESS complies with several dynamics; therefore, the introduction of extra RC networks is useful to increase accuracy in voltage estimation [66,67,69,70].
A modified version of the previous model is the Thevenin model [60,65,68,70,71,72]. In this case, higher accuracy is obtained by introducing a functional relation between the no-load voltage E 0 and the actual SOC. An additional resistor R sd is sometimes placed in parallel with the E 0 generator to model the self-discharge phenomena, [70,72].
Runtime models: In runtime models, the ECM is divided into two or more sections linked to each other [60,61,73]. Typically, a first section is related to the voltage response depending on the forced current, similar to the models cited above. A secondary section provides the SOC estimation, evaluated by considering the voltage on a capacitor C capacity , whose capacitance value depends on actual BESS capacity, i.e., on SOH. Examples of runtime models are in [60,74,75].
In recent years, some authors have proposed some advanced runtime models capable of predicting runtime and current–voltage (IV) performance while reducing the inherent complexity: the model in [76] allows for predicting the runtime operation, steady state and transient response of the battery. However, in [61], the authors stated that this latter model shows some limitations occurring for transient response in the case of fast changing loads (e.g., dynamics about 1 s or less) at a high current rate. For the purpose of avoiding these disadvantages, in [77], some additional parameters were introduced linking their value to a specific rate factor f(i(t)), which accounts for the decrease in capacity caused by unwanted side reactions as the current increases. A more detailed analysis is also presented in [78].
Tremblay and Jackey models: In recent years, the main software houses have developed some battery models and integrated them into simulation platforms in the field of electrical and electronics engineering. An overview of these models is presented in [60]. In [79,80], Tremblay et al. proposed an ECM derived from the Sheperd formulation. Another BESS model has been proposed by Jackey, focusing on its fast implementation in electronic circuit simulations using acceptable approximations that reduce the number of parameters to identify [81].
Randles models: The peculiarity of this category is that some of the circuit parameters are time-varying, since their value depends on the actual battery state (i.e., actual SOC and SOH), as well as on external conditions (such as imposed current rate and temperature). A wide number of papers in the literature refer to the implementation of the Randles model in combination with a Kalman filter (KF), the latter used for parameter tuning. Some examples are in [61,68,82].
Other circuit models: Many other circuit models are reported in the literature. In this section, a brief description is reported for some of them.
Some significant examples are discussed in [62,83,84]. In these works, the terminal voltage is approximated by using simple polynomial expressions.
In [85], an impedance model for intermediate-size lead acid batteries is presented by Salkind et al. EIS is combined with fuzzy logic data analysis to characterize both small and large lead-acid batteries [23,60,86].
Another fairly widespread circuit is described in [87,88]. This is usually named the “third-order model”. A parasitic branch is added to a basic Thevenin topology to model the nonreversible reactions that do not provide any contribution during charge operation [89].
Some authors proposed new approaches based on fractional impedance [57,90,91]. In [90], a simplified fractional impedance model based on the Grünwald–Letnikov definition is introduced, and the least squares (LS) genetic algorithm (GA) is utilized to identify the model parameters with a low voltage-tracing error rate. The circuit topology is similar to the Thevenin one, and two RC branches are included to model concentration polarization and activation polarization phenomena.
In [57], authors report a commonly used fractional-order model replacing the pure capacitive element in the Thevenin model with a constant phase electrochemical impedance element (CPE). In impedance spectrum fitting, the CPE is often used in parallel with pure resistance. CPE characteristics are difficult to process in the time domain, so it is usually necessary to apply the theory of fractional calculus. Commonly used fractional calculus exploits the theoretical background coming from the Grünwald–Letnikov definition, the Riemann–Liouville definition or the Caputo definition.
Guo and Shen provide an overview of fractional order circuit models including Warburg elements, which are often added to describe the battery diffusion phenomenon in the low-frequency region [91]. This work also compares the available approaches in terms of accuracy and complexity or, more generally, in terms of benefits and drawbacks.
A comprehensive comparison between circuit models considering all their features and performance is very difficult due to a large number of criteria to take into account.
In general terms, four final remarks can be stated. First of all, the more complicated models lead to satisfactory accuracy in most cases. However, their complexity can sometimes be an obstacle to their practical implementation; secondly, due to the large dynamic range in BESS operation, the accurate tracking of transient phenomena requires at least the presence of one series RC branch in the circuit model; thirdly, for each model, the uncertainty on the no-load voltage value E0 implies a large sensitivity in final accuracy; finally, in most cases, Thevenin, Runtime and Runtime IV models are the best compromises between performance and complexity.
The evaluation of SOC and SOH requires the implementation of an estimation algorithm having an ECM as the core of the estimation process.
A relevant category of estimation algorithms is the one exploiting observers [92,93,94]. For example, in [92], authors proposed a multi-gain switching observer in which different types of errors (sensor drifts, modelling mismatches and so on) are treated differently by switching the internal gains of the observer. To do this, a geometry classifier is designed to categorize these errors into different groups using the information of the voltage error between the model and measurements.
In [93], authors proposed an adaptive observer based on the sliding mode method with the purpose of avoiding the chattering effects while improving the estimation performance. In [94], another adaptive observer was proposed according to a specific online parameter estimation algorithm. The derivative of OCV estimated online led to the SOH value considering that the estimated battery capacity could converge on the actual value while the error of the battery OCV converged on zero.
Another example of an estimation algorithm based on observers is described in Figure 3 [95].
The proportional-integral (PI) controller is used for an observer, making the method suitable for many battery technologies. Its exploitation for a certain application simply requires the tuning of proportional and integral terms of the PI. The system also integrates a relaxation voltage OCVrelax prediction function.
Parameters of the ECM are tuned in real-time by the observer itself. Practically, the error coming from the comparison between the real and model voltage is used to appropriately tune the OCV voltage during the charging and discharging processes, so that the estimation error caused by parameter and state variations are automatically compensated. This process allows for compensating inaccuracies due to measurement errors and changeable environmental conditions, such as temperature or load variations.
As for the resistance, a polynomial approximation of the Ri (SOC) curve is created from an extensive series of experimental measurements on different types of batteries.
Regarding the relaxation voltage prediction, the main issue is that the battery voltage matches the static OCV when the battery is under open circuit conditions (no current) for a long time while the voltage has been relaxed to its equilibrium [73]. Under this condition, the measured voltage can be considered the OCV value corresponding to a particular SOC. However, because of the need for a long rest time for full relaxation, the application of the OCV for SOC estimation is usually difficult, so the OCV method is not generally applied for real-time application [96].
Among observers, KF and its variants are also often used to estimate SOC and SOH. Some descriptions and relevant examples are in [57,91,97,98].
In [97], a step-by-step guide for the implementation and tuning of an extended KF (EKF) was presented. An analytical approach described in the paper reduced the efforts of the common empirical filter tuning and could be adapted to various battery models, systems and cell types.
In [98], a Thevenin model has been established to model BESS. Appropriate battery charge-and-discharge experiments were performed to identify the parameters of this model. Finally, EKF applied to the model experiments exhibits high precision.
In most cases, the estimation of SOH is obtained from the actual value of SOC or together with its evaluation in the form of a co-estimation process [99,100,101,102].
In [99], authors proposed a comprehensive co-estimation scheme of battery SOC/SOH for the second use of Li-ion power batteries in EVs under different cycles using an adaptive EKF (AEKF). First, according to the collected battery test data at different aging cycle levels, the external battery characteristics are analyzed and then a cycle-dependent ECM is built up. Next, the parameter estimation of this battery model was performed via a recursive least square (RLS) algorithm. Meanwhile, the variations in internal battery parameters of the cycle numbers were fitted and synthesized. Moreover, the validation of the estimated parameters was further carried out. Based on this enhanced battery model, the AEKF algorithm was utilized to fulfil battery SOC/SOH estimation simultaneously.
In [100], a fuzzy unscented KF (UKF) filtering algorithm of a new type was proposed, with an improved second-order RC circuit model established and an online parameter identification method. Ohmic resistance was treated as a battery SOH index, and the UKF algorithm was used for the joint estimation of SOC and SOH.
In [101], the proposed algorithm estimated SOC from the battery model. Capacity estimation was decoupled from the SOC estimator; this approach reduced the strong interaction existing in conventional co-estimation methods. Additionally, all state variables could be solved together by one estimator, which is straightforward and avoids the complicated observer network. Owing to the decoupling design, the stability of the proposed method became more intuitive and could be always guaranteed, according to the convexity analysis, without using other stabilizing approaches. In consequence, a weak-interaction and robust co-estimation algorithm of SOC and SOH could be realized by the proposed technique.
Figure 4 refers to the estimation algorithm described in [102].
The Coulomb-counting method (CCM) and ECM are merged into a mixed algorithm to benefit from their advantages while compensating for their drawbacks. In particular, the ECM approach improves the accuracy of CCM, while CCM reduces the computational effort related to ECM. Voltage and current measured during each charge or discharge cycle contribute to tune parameters and to achieving the assessment of SOH. The tuning of the efficiency index η is executed from time to time by reversing the following equation belonging to CCM but using data provided by ECM:
SOC = SOC 0 1 C n   η ( t ) i ( t )   dt ,
where SOC 0 represents the initial value, C n denotes the nominal capacity, t is the duration of battery charging and discharging, and η denotes the coulombic efficiency.
Performing simple calculations and considering a given time interval [t0, t1], the actual capacity C act can be calculated as a function of SOC variation and total charge Q flowing during a charge or a discharge process:
C act = η ( t ) t 0 t 1 i t dt SOC t 0 SOC ( t 1 ) = Q t 0 : t 1 Δ SOC t 0 : t 1   η ( t ) .
It is now clear that, under this approach, SOH is directly evaluated from SOC, the latter estimated using ECM. It can be stated that the identification of ECM and the estimation of SOC and SOH are strongly linked to each other. The most common topology used in estimation algorithms for SOC and SOH is the Thevenin one or a variant of the same. Although it is a very simple topology, it can give satisfactory accuracy only if inserted into a suitable algorithm, so long the latter can tune circuit parameters from time to time, especially in the case of fast variations in working conditions.

5.2. Aging Models

Aging models (AMs) are widely used in literature, and their efficacy is supported by many publications. The main advantage of AMs is the relatively low computation effort. Once the model parameters of a specific battery have been estimated, the estimation of capacity loss can be performed very easily and is perfectly suited to online applications both in vehicles and in stationary applications. The main disadvantage is that the specific battery may not respond perfectly to the characteristics defined in the testing phase. In fact, at the base of the AMs, there is always a large dataset from which the main degradation mechanisms can be estimated as a function of the operating conditions [103,104]. To identify the parameters relating to the model, a wide range of data is first necessary to obtain the formulation of the mathematical model. Therefore, the datasets are often built from a large number of samples recorded in long period measurements and are used to obtain a formulation that allows covering the greatest possible cases of real applications on actual cycles of the formulated model. Mainly the datasets differ in operating temperatures, DOD and charge/discharge rate.
The formulation terms used for estimating lost capacity are mainly based on calendar aging and cycle AMs. The first one includes all the chemical/physical phenomena that lead to the degradation of the battery regardless of the charge and discharge cycles and operating conditions. The contribution of calendar aging is particularly significant in all those applications in which the battery idle states are more frequent, or the operating conditions require low charge/discharge rates at low DODs. The idle state is an operating condition that cannot be neglected. In fact, in all applications, a large part of the useful life of a battery is in its idle state. At the same time, few authors have yet addressed the issue of apparent capacity loss that occurs after long idle periods. The models present in the literature mainly make use of two formulations for the estimation of calendar aging. Many authors start from the Arrhenius formulation to estimate the contribution of capacity lost due to temperature [105]. The model finds application in many fields as it is linked to mechanical fatigue. Other authors use polynomial models to estimate the capacity lost in the idle stages of the battery instead.
In [106], the authors examined a large dataset to find the mathematical model that estimates the lost capacity. The tests were performed at different DODs, rates and temperatures. The estimate of the battery capacity was evaluated based on four different tests (capacity test, relaxation test, EIS and hybrid pulse power characterization (HPPC)), and the value obtained was then used to build the model. The basic formulation used is the following:
Q loss = B   ·   exp E a RT Ah z .
Herein, Q loss is the normalized capacity loss, B a fitting factor, E a is the activation energy, R is the gas constant, T is the absolute temperature, Ah is the total capacity provided by the battery, and z is the exponential factor.
Authors suggest that, at low C-rates (lower than C/2), the effect of DOD on the estimation of lost capacity has a negligible impact compared to time and temperature. The model obtained, however, is not suitable for application at high temperatures and rates larger than C/2. In this case, the final formulation is always obtained through the exponential term (Arrhenius) but considering values of B, E a and z that minimize the error between the estimated lost capacity of the model and the measured one. The result, although semi-empirical, can estimate the lost capacity component of the battery in a wide range of operating conditions. However, it does not seem to be able to make online estimates, as it is not possible to adapt the model to the temporal variation of operating conditions, like for example, a varying rate of charge.
In [107], an interesting model that allows the evaluation of the terms of capacity fading is proposed. In this case, the battery capacity loss was estimated as in (15) to evaluate the reliability margins and the residual capacity in terms of remaining life. The cumulative stress approach was used to estimate the lost capacity. Under these hypotheses, the Arrhenius model was used to estimate the contribution of capacity lost due to calendar aging.
C c t = h 1   e h 2 T batt + h 3 ,
where h 1 , h 2 and h 3 are constants to be determined, and T batt is the battery temperature. All contributions related to the effect of cycle aging are instead derived from the definition of capacity lost in a standard cycle, with appropriate corrective factors that take into account the different operating conditions. Operating conditions are defined based on DOD, temperature and charge and discharge rates. Examples of fading factor contributions are displayed in Figure 5.
The final formulation of the total capacity lost in a second is expressed as in (16):
C p = C t   F i CD   F i CC   F i T   F i DOD n t t l ,
where C p represent the total capacity lost, and C t is the capacity lost in n t standard cycles of t l seconds, and F i CD , F i CC , F i T and F i DOD represent the fading terms relating to discharge current, charge current, temperature and DOD, respectively.
The method is purely based on the model and therefore does not include experimental validations but provides a very easy-to-implement approach for estimating the useful life of a battery.
In [108], authors proposed single models for the estimation of the equivalent life cycles of the battery as a function of the temperature of the cycles at constant current (charge and discharge) and of the DOD. In this case, the dataset was very large and allowed the identification of all the information regarding the fading mechanisms. The contribution of calendar aging in this case was not considered. All mathematical models were of exponential type except the dependent model from the temperature, which was of polynomial type. The number of equivalent cycles was in turn linked to the loss of capacity by the relationship:
CL eq = C dis , act C ref ,
where C dis , act is the total net discharge capacity during the life of the battery, and C ref is the initial capacity. The coefficient values are estimated using the LS fitting method. The model is then compared with experimental data that shows a MAPE in the estimation of battery cycles of 5.4%. The authors emphasize that the main fading mechanism is the one linked to the increase in internal resistance. The increase of the internal resistance at high charge rates increases the losses due to the Joule effect with the consequence that the battery temperature increases, bringing the operating point outside the optimal operating conditions (>45 °C).
Although many AMs provide very promising results in terms of predicting battery life, the parameters used for estimating mathematical models are often limited by the characterizations performed in the construction of the datasets. For this reason, it would be more useful to combine AMs with strategies for updating the constants of the online mathematical model.

6. Data-Driven Methods

AI refers to computer programs with the ability to mimic the cognitive function of humans, such as reasoning and learning, thus representing the effort to automate intellectual tasks normally performed by humans.
While AI expresses the general concept, ML is an application or subset of AI intended as a revolutionary programming approach whereby a computer algorithm can automatically learn how to perform a specified task by looking at data, i.e., it is trained rather than explicitly programmed to perform a given task.
ML algorithms can be broadly divided into two main branches, supervised and unsupervised learning algorithms, depending on their functionality and the approach used to learn from experience.
Supervised ML techniques take as input a known set of data and the corresponding responses and learn to generate reasonable predictions as a response to new data. Unsupervised ML techniques consider just data without labelled responses to draw inferences from datasets. To better address the issue of batteries, this study will focus on supervised techniques, such as SVR and NNs, as they are suitable for modeling highly nonlinear systems [109].

6.1. Neural Networks

Basically, an artificial neural network (ANN), usually simply called a NN, is a statistical model that is designed to mimic the biological structures of the human brain. In the same vein, an NN consists of highly interconnected processing elements, called neurons, which communicate together to perform a learning task based on a set of observations. Even though ANN have been popular for decades, since the single perceptron was introduced in 1958, the understanding of the processes underlying them is usually based solely on anecdotal evidence in a particular application domain or task [110].
A deep neural network (DNN) is an augmented version of the conventional ANN whose capability has been greatly expanded by increasing the number of computational layers, overcoming hardware and software limitations. Practically, the DNN is an ANN with deeper computational layers able to handle, in principle, any type of non-linear function as a powerful function approximator. That is why, in addition to being the current record holder in domains such as computer vision, speech recognition and natural language processing, in recent years it has also been proposed for battery state estimation [111]. In short, as schematized in Figure 6, a DNN consists of at least three computational layers: the input layer, the hidden layer (so-called since its computation results are not directly visible to someone interacting with the network) and the output layer. According to the Universal Approximation Theorem, a three-layer structure can approximate, with an arbitrary level of precision, any measurable function, given that a sufficient number of processing neurons are available at the hidden layer. However, hidden layers can range from one to thousands.
The main difference between the various possible architectures of a DNN lies in the interconnections between neurons: in the feedforward neural network (FNN), architecture neurons form acyclic connections, with no internal loops, while in the recurrent neural network (RNN) architecture neurons form cyclic connections. Therefore, in the first case, the information flows only in one (input to output) direction, while, in the second case, it also flows in the opposite direction. This addition makes RNNs powerful models in the treatment of time-dependent data. RNNs are useful in the state forecasting of dynamic systems and thus in the long-term prediction of battery degradation.
Below, a DNN with the task of SOH estimation is described. In this setting, the DNN is used to map the battery parameters such as voltage, current and temperature to the battery SOH. Mathematically, inputs and outputs vectors are defined respectively as in (18) and (19):
X = [ V k ,   I k ,   T k ] ,
Y = [ SOH k ] ,
where V k represents the instantaneous voltage of the battery, I k represents the instantaneous current of the battery, T k represents the instantaneous temperature of the battery, and SOH k represents the instantaneous estimated SOH value.
Hence, the vector of inputs is fed to the input layer of the DNN going through a series of matrix multiplication to yield the vector of outputs at the output layer.
To transfer an input data point to the next layer, a number called weight is associated with each link. In particular, w fg   L denote the weight of the connection from the g th neuron in the ( L 1 ) th layer to the f th neuron in the L th layer. It is possible to use a similar notation for the network’s biases and activations. Explicitly, b f L and a f L are, respectively, the bias and the activation of the f th neuron in L th layer. With these notations, the activation a f L of the f th neuron in the L th layer is related to the activations in the ( L 1 ) th layer by (20) [112]:
a f L = σ g w fg   L a g L 1 + b f L   ,
where σ is a generic activation function. The bias has the effect of increasing or decreasing the input of the activation function by a constant value, thus increasing network flexibility. A different activation function can be specified for each hidden layer. In the context of non-linear functions [113], among the most recurring functions, there are the sigmoid function and the hyperbolic tangent (Tanh) function. One of the new milestones in the deep learning revolution, practically used as a default function, is, however, represented by the ReLU function, which stands for the rectified liner unit [114]. Improvement variations are the leaky ReLU (LReLU), parametric ReLU (PReLU) and exponential linear unit (ELU) [115]. The saturation of the activation function causes the degrading of network performance since the gradient in the saturation regions is almost zero and no signal is transmitted through the node. Since, with basic ReLU function, gradients during negative input are always 0, the other ReLU variations act on the negative part to remedy this problem known as vanishing gradient. Conversely, the exploding gradients problem can occur when, in some cases, the gradients keep getting larger and larger as the backpropagation algorithm progresses. This, in turn, causes very large weight updates and causes the gradient descent to diverge, requiring the application of the gradient clipping technique.
Moreover, to directly control the behavior of the learning process, having a significant effect on the performance of the model, specific parameters called hyperparameters are used; the batch size that identifies the number of training samples is just an example.
Before the data is fed into the network, it must be normalized or standardized [116,117,118,119]. However, in more complex NNs, after the original data are measured and recorded using offline experiments, a set of health features are extracted from them. The more relevant and practical the features, the more accurate the predictions. In [120], different feature variables were summarized with advantages and disadvantages, deepening from four perspectives: incremental calculation, time, envelope area and model parameter. By the way, in [121], it was proven that preprocessing based on time-domain features, in which data are collected by constant time intervals, is insufficient to indicate a battery’s SOH. Considering the dataset from the NASA Prognostics Center, the voltage of aged batteries simply reaches the maximum cut-off voltage faster than newer ones, but, after 4000 s, all batteries maintain the same maximum cut-off voltage until the end of the charge (a little less than 10,000 s), which means that almost 65% of voltage data have the same values. Similarly, a significant difference is not found in the current value in less than 4000 s or over 6000 s, as well as the temperature is slightly different after 6000 s. Hence, a SOC-based data sampling method by which data (relative SOC, voltage, current, temperature difference, and cycles) are collected by constant relative SOC interval, considering the battery’s energy, is proposed with a resulting difference in the battery voltage 40% higher than time-based preprocessing.
According to a common approach, the available data is randomly separated into three subsets: one each for training, validation and testing. Various networks with different levels of complexity are estimated using the training set. Hence, their performance is evaluated on the validation set. Subsequently, to provide an unbiased evaluation, the network that has the best performance for the validation set is further evaluated on the testing set [122]. In [123], a GA-based fuzzy C-means clustering technique was used to partition the training data sampled. In [124], an improved extreme learning machine (ELM) algorithm consisting of three layers was implemented. About 70% of data were employed for model training and the remaining unseen 30% of data were used for data testing. The ELM training process was combined with a gravitational search algorithm (GSA) based on the law of Newtonian gravity and laws of motion in order to find the appropriate number of hidden-layer neurons. The ELM-based GSA model delivered more accurate SOC estimation results both for two other NNs and other methods, having an RMSE of 1.1% in a dynamic stress test (DST) and of 1.4% in the federal urban driving schedule (FUDS).
Another family of DNN is represented by CNNs. A CNN derives its name from the type of hidden layers adopted. In fact, typically it is composed of convolution, pooling and fully connected layers. The first two types of layers are used to perform feature extraction, whereas the fully connected layer is used to map the extracted features into the final output, such as classification. Compared with traditional DNNs with the same number of layers, a CNN requires fewer weights to maintain accuracy, due to the sparse connectivity, shared weights and pooling architectures. In [125], a CNN-based method only requiring a partial charging segment (with a fixed length of 225 consecutive points and a flexible starting point) of voltage, current and temperature curves was presented, making it possible to achieve fast online health monitoring. Comparing the results of networks with four, five and six convolutional layers and considering the total number of parameters involved in each configuration, a CNN with four convolutional layers proved to be the best trade-off, achieving satisfactory estimation results with relatively fewer parameters. CNN was tested on two different datasets of Li-ion batteries (the first provided by the Toyota Research Institute and the Oxford Battery Degradation Dataset one) and resulting RMSEs, considering various combinations in the structure, are less than 2.54% and 2.93%, respectively, on the two datasets. Moreover, a CNN with the configuration corresponding to the minor RMSE was compared with an ANN and DNNs with a different number of hidden layers having a resulting RMSE of 0.95%, 1.72% and 1.23–1.34%, respectively.
Equations (18) and (19) describe a simple NN for calculating SOH. There are more complex NNs able to calculate SOH. By the way, confirming the possible integration with other methods, in [126], a three-layer NN was proposed to estimate SOH, whose inputs are the parameters of the first-order ECM (ohmic resistance, polarization resistance and polarization capacity) and the SOC. The aforementioned parameters were identified using an HPPC test exploiting the dropout voltage and dropout current when the current was changed suddenly, in addition to the continuous voltage change after the voltage leaps and the LS fitting method. The value of SOH was computed based on the definition, considering the ratio of the current maximum available capacity, obtained as the average capacity of three static capacity tests, and the nominal capacity. Ten LFP batteries with different aging degrees ere experimented on (five for training and five for testing) using a Sigmoid activation function. Resulting errors as differences between estimated and measured values were almost all less than 5%.
For ease of reading, the data presented have been summarized in Table 2.

6.2. Support Vector Regression

The techniques based on support vector machines (SVMs) find many applications in the pattern recognition fields and are used by several authors to investigate various aspects related to the estimation of the SOH of batteries [127,128]. The idea behind SVR methods starts from the same assumptions but is not limited to simple classification. The technique can be applied at different levels for solving non-linear problems, both for what concerns pure data-driven analysis and for predictive investigations. In the literature, many papers use the SVR technique, both for the Q-V curve and thus applied to the predictive analysis (experimental based) and for the identification of the parameters of the battery circuit models (model-based). Let us consider a set of input data with x 1 ,   y 1 , x l ,   y l     X   ×   R , where X indicates the space of the input variables. As expressed in (21), the basis of the technique is to estimate the function f(x) that best approximates y based on the input dataset:
f x = w ,   x + b ,
with w     R n ,   b     R . The trend line to be determined is what is commonly referred to as a hyperplane. The ε insensitivity function is constructed in such a way as to consider as null the terms with an error y f x < ε as reported in Figure 7. The remaining values are instead considered as inputs of the objective function. In its basic formulation represented by (22), only the data within this condition are considered reliable:
minimize 1 2 w 2 subject   to y i w ,   x i b ε w ,   x i + b y i ε
where the term . represents the product in space X. However [129], in this formulation the optimization problem may have no solution because the function f(x) may not exist. For this reason, slack variables are considered. The final formulation of f(x) is therefore represented by (23):
minimize 1 2 w 2 + C i = 1 l ξ i ξ i * subject   to y i w ,   x i b     ε + ξ i w ,   x i + b y i   ε + ξ i   * ξ i , ξ i   *   0
where the constant C represents a compromise between the flatness of the function f(x) and the quantity for which a deviation greater than ε is tolerated.
The choice of this parameter is of fundamental importance because it can often reduce the accuracy of the method. For this reason, the choice of this parameter is mostly dictated by the experience of the user. From the base just exposed, numerous variants have been proposed related to the Kernel function used and Lagrangians implemented in the optimization. Since these are often non-linear problems, it is easier to solve the dual formulation in these cases by using Lagrangian multipliers. The dual optimization problem is obtained by minimizing the Lagrangian function. The latter presents its basic formulation in (24):
L   ·   1 2 w 2 + C i = 1 l ξ i ξ i * i = 1 l η i ξ i + η i * ξ i * i = 1 i α i ε + ξ i y i w ,   x i + b i = 1 i α i ε + ξ i * + y i w ,   x i b
where the parameters α and η are the Lagrangian multipliers. Using the Lagrangian multiplier theorem, the minimization point is the saddle point of the Lagrangian function. Therefore, by setting all partial derivatives to zero for the initial variables, (25) can be obtained:
f x = i = 1 l α i α i * w ,   x + b .
This expression represents the so-called support vector expansion.
The SVR method is heavily affected by the initial estimate of the C parameter and the kernel function. Furthermore, the choice of samples on which to train the SVs is of fundamental importance to reduce computational efforts to a minimum. Not only to obtain accurate estimates with low processing times and low computational requirements, the combination of several methods is certainly more advantageous. For this reason, in recent years, many authors have combined experimental or model-based techniques with ML techniques.
In [130], Weng et al. proposed the use of SVR for experimental-based applications wherein the measurement errors and low accuracy introduced by BMS can lead to problems in the reconstruction of QV and IC curves. In particular, the latter, being linked to the derivative, can easily lead to incorrect assessments due to the excessive sensitivity of the measurement and the presence of noise. Even with accurate filtering techniques, these curves may show variations in the peaks and valleys and the relative voltage value typically used for estimating battery aging [131,132]. For this reason, the technique is applied to the QV curve, and the optimization algorithm was first applied to the identification of the parameters for the identification of the IC curve. In this article, SVR is addressed through linear programming [130,133]. The latter was solved through Monte Carlo simulations. The authors proposed an interesting examination on the invariance of the SVs starting from the assumption that the drift with varying aging conditions is not a parametric drift, by mean of a variation of intrinsic parameters, but an offset. Under these conditions, the elements found in the system characterization stage can be used with low computational effort for online estimation.
Among circuital models used to describe the behavior of a battery in real operating conditions, the Thevenin model is certainly the most suitable. In the literature, the number of elements used for circuit analysis varies according to the degree of complexity. In [134], the authors, starting from a second-order RC circuit model, proposed the implementation of an EKF algorithm to estimate SOC. The empirical formulation used to estimate the OCV–SOC relationship was a fifth-order polynomial relationship. RLS was used to estimate the parameters of the RC model and the polynomial. The joint estimation of SOC and RC parameters was used as an SVR for estimating the actual capacity. The authors also proposed, to reduce the computational effort, an algorithm that updated the three models (SOC, RC and OCV–SOC) on three different time bases. The result was a faster procedure that nevertheless required an initial dataset to estimate the relationship between the RC parameters at different SOCs and the relative SOH. To reduce the execution time of the algorithm, only part of the results obtained from the process of identifying the RC parameters was considered. The authors used the subset of data that shows the best correlation with the Spearman method.
In [135], a RC model was used to estimate the SOC starting from an empirical relationship between OCV and SOC [136]. The estimation of SOC and in this case, like the previous one, the identification of the circuital parameters was performed through the EKF RLS; however, the algorithm used for the optimization problem was based on particle swarm optimization (PSO). Precisely, a PSO–LSSVR approach was proposed testing ten 10 Ah LiFePO4 batteries. The algorithm was used in such a way that the error due to the initial condition of C in minimization problems (23) and, in this way, the computational effort are both strongly reduced. Estimation results are compared with the LSSVR method without being optimized by PSO and a NN. RMSE is 0.93–1.60% with PSO–LSSVR, 1.02–4.32% with LSSVR and 1.18–6% with NN. Moreover, also in dynamics tests, the SOH estimation error is always less than 3%.
In [137], a method based on GAs and SVR was proposed. In this case, GAs were used to extrapolate the characteristics starting from the temperature, current and voltage data, solving a multi-objective optimization problem. The proposed function was the combination of an RMSE found starting from an estimate based on an AM with the features obtained from the optimization process and used by the SVR model. In all cases, one of the main problems was that of the initial choice of the data used for the training of the SVR, which was a topic of considerable interest in allowing the method to be more flexible and faster. Validation was taken on the experimental data from three LFP batteries, indicating that the proposed approach could estimate the SOH with less than 0.5% MAE and that it was effective in about 95% of the actual charging operations.
In [138], the authors used the amplitude of the second peak of the IC curve for the estimation of SOH through an SVR that implemented the PSO at the same time. The PSO–SVR was used for the estimation of the parameters of (ε, C, σ) since the latter was related to the kernel function considered for the SVR. Although the choice of the values of the search ranges of the optimal values could already be an estimate based on experience, the method shows good accuracy when compared with other techniques. In fact, MAEs of the PSO–SVR estimation algorithm for two Li-ion batteries (dataset NASA) were 1.45% and 0.41%, respectively while RMSEs were 1.59% and 0.56%, respectively. SVR used for comparison had higher errors both in terms of MAE (2.29% and 1.98%, respectively) and RMSE (2.87% and 2.40%, respectively).
For ease of reading, the data presented are summarized in Table 3.

7. Discussion

Despite the various methods existing in the literature, the estimation of SOH remains a very complex task. The methods reported in this survey differ in the basic approach and the used techniques strongly depend on the amount of available data and how they can be processed. While extensive initial investigations under different charge and discharge rate conditions, DODs and temperature can provide a basis for modeling, as in the data-driven case, these alone cannot guarantee an accurate estimate over the life of the battery. Large amounts of operational data, on the other hand, lead to an increase in the complexity of the system and the computational effort required, especially if applied to online estimates, as for example in data optimization problems [18].
On a theoretical level, experimental methods allow obtaining detailed information on degradation and accurate SOH estimation results. A consistent comparison between EIS and ICA, relatively to the lithium nickel cobalt aluminum-carbon (NCA-C) cell type, was conducted in [139]. Both techniques were suitable for the identification and quantification of the effects of the degradation modes (DMs). The growth of the effects of the DMs increased linearly when EIS is applied, while, in the ICA approach, DMs increased linearly from 0 cycles to 400 cycles but then reached a plateau until 500 cycles. This is because each technique used a different parameter (capacity or resistance) to quantify ageing and because, whereas resistance increased linearly (EIS case) with age, capacity decreased more like an exponential trend (ICA case). Moreover, EIS required a quick test duration (25 min/cell), while ICA uses a long test duration (10 h/cell). Unlike ICA, EIS enables measurements at particular frequencies and SOC. However, calculations are certainly simpler in the ICA case with the advantage of accuracy as well, since it depends mostly on the measurement (C-rate used) and not on the model.
For applications wherein an online estimation is preferable, capacity, resistance and other parameters can be estimated considering a model with adaptive filtering or data-driven algorithms and then be used to quantify the degradation of batteries. The difference between these two categories lies mainly in the computation procedure [14]. In [140], a structured NN (SNN) and an EKF were developed and applied on an ECM of a Li-ion battery pack. The resulting values were compared with data from an electrical model of the battery, based on parameterization using EIS. In both cases, levels as well as trends were very similar, and successful detection was proven by matching the EIS reference data. However, with regard to the training process, EKF reached satisfactory values already after just half of the time taken by the SNN to train the given functions. However, the training in a SNN could be executed easily offline before implementation on the BMS. The opposite happens instead in applications wherein a correctly trained SNN immediately supplies adequate results with respect to the EKF, which always requires a certain adaptation time. By simulating a drive profile of 8700 s on a commercial computer and measuring the required computation time, it is shown that SNN takes 4.7 s while EKF requires 13.5 s. Moreover, noticeable is the noisier output in case of the SNN in comparison to the smooth EKF. In summary, the statement of the authors is that the SNN indicates its advantages compared to an EKF in terms of computation speed and memory and should be preferred as long as a high number of vehicle data is achievable and can be used for offline training. Conversely, since the EKF requires high computational efforts like matrix inversion, it is not purposive for an online estimation, except in the case of a small number of training data in consequence of the fast adaption of the filter.
However, since with ML, regular adjustments of the estimator algorithms are required, EIS has been proven to be an effective and comprehensive measurement technique to supply the required data for adjusting the estimator’s parameters. About that, new possibilities to obtain online EIS by power electronic converters are described in [36].
In [141], the results of an LSTM and an SVR model were compared, making use of three NASA datasets. The SVR model performed better, having an average MSE of 1.1% compared to that of the LSTM of 3.8%. In particular, LSTM suffered from overfitting towards the end of the dataset, despite several dropout layers that set input elements to zero with a given probability and fine control of the batch size during training. Moreover, a noticeable delay, especially at points when the model was trying to predict the sharp and sudden capacity upward trends, occurred at random intervals. However, it confirmed that there were no absolute truths when comparing multiple methods, as each situation was different based on the type and history of the battery and the variants involving the algorithm construction. In [142], FNNs provided the smallest errors. Namely, in testing an NMC battery, the resulting RMSE was 0.51%, 0.16%, 0.23% and 0.22%, respectively, for SVR, FNN, LSTM and CNN; in addition, the resulting MSE was 0.28%, 0.10%, 0.15% and 0.15%. In [135], the effect of SVR was compared to a backpropagation NN (BPNN) with the first layer hidden. Specifically, at the beginning, a parameter-identified EKF-RLS-based algorithm was proposed, achieving good accuracy under both static and dynamic conditions (MAPE remains within 0.6% both under the DST and FUDS cycles). In short, SOC was estimated by applying the EKF algorithm, parameters of the ECM were identified using the RLS algorithm, and then, based on the RLS results, the OCV–SOC relationship was corrected. Thus, the relationship model between SOH and critical model parameters was established via the SVR algorithm and the latter was compared with that of the BPNN trained with the above parameters of the ECM. Using a commercially available 2 Ah, 18650 Li-ion battery and depending on the type of battery samples under different cyclic rates, RMSE was between 1.10–2.66% with SVR and 1.65–5.02% with BPNN. Considering different temperatures, RMSE was between 1.09–2.03% with SVR and 2.43–6.94% with BPNN. Hence, from the perspective of robustness verification both at different cycle rates and under different temperature conditions, the SVR-based SOH estimation algorithm achieves better performances than the BPNN. This makes it suitable for effective judgments on the SOH of a battery, with a focus on the reliability and safety of battery management. SVR could provide timely battery failure warnings, as soon as the battery is close to its decommissioning criteria.
In [50], ML and DA methods were compared. ML can be used in a dynamic situation, such as a driving cycle of an EV, while DA relies on the data measured during a static situation, which limits its usability. Moreover, ML can use temperature variations as the input features for model training and correlate it with ageing, while DA is significantly affected by temperature, which can cause large bias. On the other hand, while DA is easily implemented in a BMS by monitoring several cell parameters, the high computational effort required for ML methods is a major hurdle for their online application. Consequently, when cells operate in moderate environmental conditions and in predictable patterns, such as in stationary applications, it is believed that DA can offer sufficient performance, as the aging trend can be captured with simple mathematical functions; whereas in case of more complex operating conditions, such as in EVs, ML is a better solution thanks to its ability to approximate non-linear function surfaces.
A list of advantages and disadvantages of each method is provided in Table 4.

8. Conclusions

Energy storage is gaining a surge of interest worldwide as continents grapple with a worsening energy crisis. Moreover, an efficient use of batteries will be key to the clean energy transition as carbon dioxide emissions associated with the energy sector need to be reduced to limit climate change effects. Humanity is facing a gloomy scenario that can be successfully overcome through the generation of energy from renewable sources and the diffusion of electric mobility, making batteries a true key enabling technology for net zero. However, the efficiency of batteries must be increased, and consequently, a correct characterization of the state of health of batteries must be pursued. Nevertheless, Li-ion batteries are complex systems and the quantification of their aging processes is a difficult task. In this review, three different categories, each represented by two different approaches, are shown and compared in an innovative way. The first category is that of experimental methods, such as electrochemical impedance spectroscopy and incremental capacity analysis. The second category is that of model-based methods, such as equivalent electric circuit models and aging models. Finally, data-driven methods belong to the third category, including neural networks and support vector regression. For these methods, a review of the existing literature is offered to understand their applicability to different use cases. To this end, countless sources, including the scientific and technical literature, have been studied. The result shows that each method presents strengths and weaknesses. It means that there is not, in general, a method more appropriate than another one but that it depends on the specific application. To promote performance in wider engineering applications, it is useful to analyze these methods by summarizing their advantages and disadvantages, starting from the general basic principles up to the specific proposals of the most recent works with relative results. Clearly, a comparison also based on one’s own experimental data would be even better. After all, an experimental comparison of such different methods, presented with well-defined and replicable structures, using only one type of battery and, therefore, the same dataset, is missing in the literature. For this reason, future works will aim at filling this gap with an experimental application of the aforementioned methods, according to the peculiarities found in the literature and meticulously reconstructed in this study.

Author Contributions

Conceptualization, E.V., T.S., O.E., D.D., M.C., P.A., L.P., G.S. and M.M.D.B.; methodology, E.V., T.S., O.E. and D.D.; formal analysis, E.V., T.S. and G.N.; investigation, E.V., T.S. and G.N.; resources, E.V., T.S., L.P., M.C. and P.A.; data curation, E.V., T.S. and G.N.; writing—original draft preparation, E.V., T.S. and G.N.; writing—review and editing, E.V., T.S., G.N., O.E., L.P., P.A., M.C. and M.M.D.B.; visualization, E.V.; supervision, M.C., P.A., L.P., G.S., L.L. and M.M.D.B.; project administration, M.C., P.A., L.L. and M.M.D.B.; funding acquisition, M.C., M.M.D.B. and L.L. All authors have read and agreed to the published version of the manuscript.

Funding

This research was partially funded University of Catania under the interdepartmental project PIA.no di in.CE.ntivi per la RI.cerca PIA.CE.RI. 2020–2022 Line 2 cod. 61722102139 -TMESPEMES.

Institutional Review Board Statement

Not applicable.

Informed Consent Statement

Not applicable.

Data Availability Statement

Not applicable.

Acknowledgments

This research activity has been developed in the framework of the Enel Foundation Fellowship Program and Enel X project development activities related to the Important Projects of Common European Interest (IPCEI) initiative for the Energy Storage Systems. The research has been also supported by “Piano di incentivi per la ricerca di Ateneo 2020/2022 (Pia.ce.ri.) Linea 2D-University of Catania”.

Conflicts of Interest

The authors declare no conflict of interest.

References

  1. The Nobel Prize. The Nobel Prize in Chemistry 2019. Available online: https://www.nobelprize.org/prizes/chemistry/2019/summary/ (accessed on 1 September 2022).
  2. Tsiropoulos, I.; Tarvydas, D.; Lebedeva, N. Li-ion Batteries for Mobility and Stationary Storage Applications; EUR 29440 EN; Publications Office of the European Union: Luxembourg, 2018. [Google Scholar]
  3. Gielen, D.; Boshell, F.; Saygin, D.; Bazilian, M.D.; Wagner, N.; Gorini, R. The role of renewable energy in the global energy transformation. Energy Strategy Rev. 2019, 24, 38–50. [Google Scholar] [CrossRef]
  4. Bloomberg, N.E.F. New Energy Outlook 2021. Available online: https://about.bnef.com/new-energy-outlook/ (accessed on 29 September 2022).
  5. United Nations. Resolution Adopted by the General Assembly on 25 September 2015. In Transforming Our World: The 2030 Agenda for Sustainable Development; United Nations: New York, NY, USA, 2015. [Google Scholar]
  6. IPCEI Batteries. Available online: https://www.ipcei-batteries.eu (accessed on 29 September 2022).
  7. Tian, H.; Qin, P.; Li, K.; Zhao, Z. A review of the state of health for lithium-ion batteries: Research status and suggestions. J. Clean. Prod. 2020, 261, 120813. [Google Scholar] [CrossRef]
  8. Hossain Lipu, M.S.; Hannan, M.A.; Hussain, A.; Hoque, M.M.; Ker, P.J.; Saad, M.H.M.; Ayob, A. A review of state of health and remaining useful life estimation methods for lithium-ion battery in electric vehicles: Challenges and recommendations. J. Clean. Prod. 2018, 205, 115–133. [Google Scholar] [CrossRef]
  9. Sarmah, S.B.; Kalita, P.; Garg, A.; Niu, X.; Zhang, X.; Peng, X.; Bhattacharjee, D. A Review of State of Health Estimation of Energy Storage Systems: Challenges and Possible Solutions for Futuristic Applications of Li-Ion Battery Packs in Electric Vehicles. J. Electrochem. Energy Convers. Storage 2019, 16, 040801. [Google Scholar] [CrossRef] [Green Version]
  10. Wang, Z.; Feng, G.; Zhen, D.; Gu, F.; Ball, A. A review on online state of charge and state of health estimation for lithium-ion batteries in electric vehicles. Energy Rep. 2021, 7, 5141–5161. [Google Scholar] [CrossRef]
  11. Noura, N.; Boulon, L.; Jemeï, S. A Review of Battery State of Health Estimation Methods: Hybrid Electric Vehicle Challenges. World Electr. Veh. J. 2020, 11, 66. [Google Scholar] [CrossRef]
  12. Rezvanizaniani, S.M.; Liu, Z.; Chen, Y.; Lee, J. Review and recent advances in battery health monitoring and prognostics technologies for electric vehicle (EV) safety and mobility. J. Power Sources 2014, 256, 110–124. [Google Scholar] [CrossRef]
  13. Tian, J.; Xiong, R.; Shen, W. A review on state of health estimation for lithium ion batteries in photovoltaic systems. eTransportation 2019, 2, 100028. [Google Scholar] [CrossRef]
  14. Xiong, R.; Li, L.; Tian, J. Towards a smarter battery management system: A critical review on battery state of health monitoring methods. J. Power Sources 2018, 405, 18–29. [Google Scholar] [CrossRef]
  15. Manoharan, A.; Begam, K.M.; Aparow, V.R.; Sooriamoorthy, D. Artificial Neural Networks, Gradient Boosting and Support Vector Machines for electric vehicle battery state estimation: A review. J. Energy Storage 2022, 55, 105384. [Google Scholar] [CrossRef]
  16. Rauf, H.; Khalid, M.; Arshad, N. Machine learning in state of health and remaining useful life estimation: Theoretical and technological development in battery degradation modelling. Renew. Sustain. Energy Rev. 2022, 156, 111903. [Google Scholar] [CrossRef]
  17. Sui, X.; He, S.; Vilsen, S.B.; Meng, J.; Teodorescu, R.; Stroe, D.J. A review of non-probabilistic machine learning-based state of health estimation techniques for Lithium-ion battery. Appl. Energy 2021, 300, 117346. [Google Scholar] [CrossRef]
  18. Berecibar, M.; Gandiaga, I.; Villarreal, I.; Omar, N.; Van Mierlo, J.; Van den Bossche, P. Critical review of state of health estimation methods of Li-ion batteries for real applications. Renew. Sustain. Energy Rev. 2016, 56, 572–587. [Google Scholar] [CrossRef]
  19. Lin, C.; Tang, A.; Wang, W. A Review of SOH Estimation Methods in Lithium-ion Batteries for Electric Vehicle Applications. Energy Procedia 2015, 75, 1920–1925. [Google Scholar] [CrossRef] [Green Version]
  20. Wang, Y.; Tian, J.; Sun, Z.; Wang, L.; Xu, R.; Li, M.; Chen, Z. A comprehensive review of battery modeling and state estimation approaches for advanced battery management systems. Renew. Sustain. Energy Rev. 2020, 131, 110015. [Google Scholar] [CrossRef]
  21. Yang, S.; Zhang, C.; Jiang, J.; Zhang, W.; Zhang, L.; Wang, Y. Review on state-of-health of lithium-ion batteries: Characterizations, estimations and applications. J. Clean. Prod. 2021, 314, 128015. [Google Scholar] [CrossRef]
  22. Waag, W.; Fleischer, C.; Sauer, D.U. Critical review of the methods for monitoring of lithium-ion batteries in electric and hybrid vehicles. J. Power Sources 2014, 258, 321–339. [Google Scholar] [CrossRef]
  23. Cuma, M.I.; Koroglu, T. A comprehensive review on estimation strategies used in hybrid and battery electric vehicles. Renew. Sustain. Energy Rev. 2015, 42, 517–531. [Google Scholar] [CrossRef]
  24. Dos Reis, G.; Strange, C.; Yadav, M.; Li, S. Lithium-ion battery data and where to find it. Energy AI 2021, 5, 100081. [Google Scholar] [CrossRef]
  25. Vasta, E.; Greco, D.; Scelba, G.; Cacciato, M.; De Benedetti, M.M.; Lanuzza, L.; Eberhardt, O.; Dugo, D.; Seminara, G. Design of a battery testing system with software/hardware interface. In Proceedings of the 2022 ELEKTRO Conference, Krakow, Poland, 23–26 May 2022; pp. 1–6. [Google Scholar]
  26. Gan, L.; Yang, F.; Shi, Y.F.; He, H.L. Lithium-ion battery state of function estimation based on fuzzy logic algorithm with associated variables. IOP Conf. Ser. Earth Environ. Sci. 2017, 94, 012133. [Google Scholar] [CrossRef]
  27. Bak, T.; Lee, S. Accurate Estimation of Battery SOH and RUL Based on a Progressive LSTM with a Time Compensated Entropy Index. In Proceedings of the 2019 Annual Conference of the PHM Society, Scottsdale, AR, USA, 23–26 September 2019; Volume 11. [Google Scholar]
  28. Cabrera-Castillo, E.; Niedermeier, F.; Jossen, A. Calculation of the state of safety (SOS) for lithium ion batteries. J. Power Sources 2016, 324, 509–520. [Google Scholar] [CrossRef] [Green Version]
  29. Nagulapati, V.M.; Lee, H.; Jung, D.W.; Paramanantham, S.S.S.; Brigljevic, B.; Choi, Y.; Lim, H. A novel combined multi-battery dataset based approach for enhanced prediction accuracy of data driven prognostic models in capacity estimation of lithium ion batteries. Energy AI 2021, 5, 100089. [Google Scholar] [CrossRef]
  30. Pannala, S.; Turner, J.A.; Allu, S.; Elwasif, W.R.; Kalnaus, S.; Simunovic, S.; Kumar, A.; Billings, J.J.; Wang, H.; Nada, J. Multiscale modeling and characterization for performance and safety of lithium-ion batteries. J. Appl. Phys. 2015, 118, 072017. [Google Scholar] [CrossRef]
  31. Carmeli, M.S.; Toscani, N.; Mauri, M. Electrothermal Aging Model of Li-Ion Batteries for Vehicle-to-Grid Services Evaluation. Electronics 2022, 11, 1042. [Google Scholar] [CrossRef]
  32. Li, X.; Wang, Z. State of health estimation for lithium-ion battery by combining incremental capacity analysis with gaussian process regression. arXiv 2019, arXiv:1903.07672. [Google Scholar]
  33. Caponetto, R.; Guarnera, N.; Matera, F.; Privitera, E.; Xibilia, M.G. Application of Electrochemical Impedance Spectroscopy for prediction of Fuel Cell degradation by LSTM neural networks. In Proceedings of the 2021 29th Mediterranean Conference on Control and Automation (MED), Bari, Italy, 22–25 June 2021; pp. 1064–1069. [Google Scholar]
  34. Gaberšček, M. Understanding Li-based battery materials via electrochemical impedance spectroscopy. Nat. Commun. 2021, 12, 6513. [Google Scholar] [CrossRef]
  35. Zappen, H.; Fuchs, G.; Gitis, A.; Sauer, D. In-Operando Impedance Spectroscopy and Ultrasonic Measurements during High-Temperature Abuse Experiments on Lithium-Ion Batteries. Batteries 2020, 6, 25. [Google Scholar] [CrossRef] [Green Version]
  36. Beiranvand, H.; Placzek, J.M.; Liserre, M.; Zampardi, G.; Brogioli, D.C.; La Mantia, F. Review of Power Converter Topologies for Electrochemical Impedance Spectroscopy of Lithium-Ion Batteries. In Proceedings of the 2022 24th European Conference on Power Electronics and Applications, Hannover, Germany, 5–9 September 2022; pp. 1–10. [Google Scholar]
  37. Middlemiss, L.A.; Rennie, A.J.R.; Sayers, R.; West, A.R. Characterisation of batteries by electrochemical impedance spectroscopy. Energy Rep. 2020, 6, 232–241. [Google Scholar] [CrossRef]
  38. Ezpeleta, I.; Freire, L.; Mateo-Mateo, C.; Nóvoa, X.R.; Pintos, A.; Valverde-Pérez, S. Characterisation of Commercial Li-Ion Batteries Using Electrochemical Impedance Spectroscopy. ChemistrySelect 2022, 7, e202104464. [Google Scholar] [CrossRef]
  39. Li, D.; Yang, D.; Li, L.; Wang, L.; Wang, K. Electrochemical Impedance Spectroscopy Based on the State of Health Estimation for Lithium-Ion Batteries. Energies 2022, 15, 6665. [Google Scholar] [CrossRef]
  40. Al-Zubaidi, R.; Smith, N.; Kasper, M.; Kumar, P.; Nilsson, D.; Mårlid, B.; Kienberger, F. Advanced Electrochemical Impedance Spectroscopy of Industrial Ni-Cd Batteries. Batteries 2022, 8, 50. [Google Scholar] [CrossRef]
  41. Meddings, N.; Heinrich, M.; Overney, F.; Lee, J.S.; Ruiz, V.; Napolitano, E.; Seitz, S.; Hinds, G.; Raccichini, R.; Gaberšček, M.; et al. Application of electrochemical impedance spectroscopy to commercial Li-ion cells: A review. J. Power Sources 2020, 480, 228742. [Google Scholar] [CrossRef]
  42. Waldmann, T.; Iturrondobeitia, A.; Kasper, M.; Ghanbari, N.; Aguesse, F.; Bekaert, E.; Daniel, L.; Genies, S.; Gordon, I.J.; Löble, M.W.; et al. Review—Post-mortem analysis of aged lithium-ion batteries: Disassembly methodology and physico-chemical analysis techniques. J. Electrochem. Soc. 2016, 163, A2149–A2164. [Google Scholar] [CrossRef]
  43. Bao, Y.; Chen, Y. Lithium-Ion Battery Real-Time Diagnosis with Direct Current Impedance Spectroscopy. Energies 2021, 14, 4396. [Google Scholar] [CrossRef]
  44. Stroe, D.I.; Schaltz, E. Lithium-Ion Battery State-of-Health Estimation Using the Incremental Capacity Analysis Technique. IEEE Trans. Ind. Appl. 2020, 56, 678–685. [Google Scholar] [CrossRef]
  45. Riviere, E.; Sari, A.; Venet, P.; Meniere, F.; Bultel, Y. Innovative Incremental Capacity Analysis Implementation for C/LiFePO4 Cell State-of-Health Estimation in Electrical Vehicles. Batteries 2019, 5, 37. [Google Scholar] [CrossRef] [Green Version]
  46. Bloom, I.; Jansen, A.N.; Abraham, D.P.; Knuth, J.; Jones, S.A.; Battaglia, V.S.; Henriksen, G.L. Differential voltage analyses of high-power, lithium-ion cells. J. Power Sources 2005, 139, 295–303. [Google Scholar] [CrossRef]
  47. Jenu, S.; Hentunen, A.; Haavisto, J.; Pihlatie, M. State of health estimation of cycle aged large format lithium-ion cells based on partial charging. J. Energy Storage 2022, 46, 103855. [Google Scholar] [CrossRef]
  48. Schaltz, E.; Stroe, D.I.; Nørregaard, K.; Ingvardsen, L.S.; Christensen, A. Incremental Capacity Analysis Applied on Electric Vehicles for Battery State-of-Health Estimation. IEEE Trans. Ind. Appl. 2021, 57, 1810–1817. [Google Scholar] [CrossRef]
  49. Lin, H.; Kang, L.; Xie, D.; Linghu, J.; Li, J. Online State-of-Health Estimation of Lithium-Ion Battery Based on Incremental Capacity Curve and BP Neural Network. Batteries 2022, 8, 29. [Google Scholar] [CrossRef]
  50. Li, Y.; Liu, K.; Foley, A.M.; Zülke, A.; Berecibar, M.; Nanini-Maury, E.; Van Mierlo, J.; Hoster, H.E. Data-driven health estimation and lifetime prediction of lithium-ion batteries: A review. Renew. Sustain. Energy Rev. 2019, 113, 109254. [Google Scholar] [CrossRef]
  51. Li, Y.; Abdel-Monem, M.; Gopalakrishnan, R.; Berecibar, M.; Nanini-Maury, E.; Omar, N.; van den Bossche, P.; Van Mierlo, J. A quick on-line state of health estimation method for Li-ion battery with incremental capacity curves processed by Gaussian filter. J. Power Sources 2018, 373, 40–53. [Google Scholar] [CrossRef]
  52. Lin, C.P.; Cabrera, J.; Yu, D.Y.W.; Yang, F.; Tsui, K.L. SOH Estimation and SOC Recalibration of Lithium-Ion Battery with Incremental Capacity Analysis & Cubic Smoothing Spline. J. Electrochem. Soc. 2020, 167, 090537. [Google Scholar]
  53. Weng, C.; Cui, Y.; Sun, J.; Peng, H. On-board state of health monitoring of lithium-ion batteries using incremental capacity analysis with support vector regression. J. Power Sources 2013, 235, 36–44. [Google Scholar] [CrossRef]
  54. Jiang, Y.; Jiang, J.; Zhang, C.; Zhang, W.; Gao, Y.; Li, N. State of health estimation of second-life LiFePO4 batteries for energy storage applications. J. Clean. Prod. 2018, 205, 754–762. [Google Scholar] [CrossRef]
  55. Tang, X.; Zou, C.; Yao, K.; Chen, G.; Liu, B.; He, Z.; Gao, F. A fast estimation algorithm for lithium-ion battery state of health. J. Power Sources 2018, 396, 453–458. [Google Scholar] [CrossRef]
  56. Chen, C.H.; Planella, F.B.; O’regan, K.; Gastol, D.; Widanage, W.D.; Kendrick, E. Development of Experimental Techniques for Parameterization of Multi-scale Lithium-ion Battery Models. J. Electrochem. Soc. 2020, 167, 080534. [Google Scholar] [CrossRef]
  57. Zhou, W.; Zheng, Y.; Pan, Z.; Lu, Q. Review on the Battery Model and SOC Estimation Method. Processes 2021, 9, 1685. [Google Scholar] [CrossRef]
  58. Chaoui, H.; Mandalapu, S. Comparative Study of Online Open Circuit Voltage Estimation Techniques for State of Charge Estimation of Lithium-Ion Batteries. Batteries 2017, 3, 12. [Google Scholar] [CrossRef] [Green Version]
  59. Coleman, M.; Hurley, W.G.; Lee, C.K. An Improved Battery Characterization Method Using a Two-Pulse Load Test. IEEE Trans. Energy Convers. 2008, 23, 708–713. [Google Scholar] [CrossRef]
  60. Mousavi, S.M.; Nikdel, M. Various battery models for various simulation studies and applications. Renew. Sustain. Energy Rev. 2014, 32, 477–485. [Google Scholar] [CrossRef]
  61. Kai, S.; Qifang, S. Overview of the types of battery models. In Proceedings of the 2011 IEEE 30th Chinese Control Conference, Yantai, China, 22–24 July 2011; pp. 3644–3648. [Google Scholar]
  62. Achaibou, N.; Haddadi, M.; Malek, A. Lead acid batteries simulation including experimental validation. J. Power Sources 2008, 185, 1484–1491. [Google Scholar] [CrossRef]
  63. Sheperd, C.M. Design of Primary and Secondary Cells—Part II. An Equation Describing Battery Discharge. J. Electrochem. Soc. 1965, 112, 657–664. [Google Scholar]
  64. Hussein, A.; Batarseh, I. An Overview of Generic Battery Models. In Proceedings of the 2011 IEEE Power and Energy Society General Meeting, Detroit, MI, USA, 24–29 July 2011; pp. 1–6. [Google Scholar]
  65. Treptow, R.S. The lead-acid battery: Its voltage in theory and practice. J. Chem. Educ. 2002, 79, 334. [Google Scholar] [CrossRef]
  66. Hu, X.; Li, S.; Peng, H. A comparative study of equivalent circuit models for Li-ion batteries. J. Power Sources 2012, 198, 359–367. [Google Scholar] [CrossRef]
  67. Einhorn, M.; Conte, F.V.; Kral, C.; Fleig, J. Comparison, Selection, and Parameterization of Electrical Battery Models for Automotive Applications. IEEE Trans. Power Electron. 2013, 28, 1429–1437. [Google Scholar] [CrossRef]
  68. Kularatna, N. Dynamics and Modeling of Rechargeable Batteries. IEEE Power Electron. Mag. 2014, 1, 23–33. [Google Scholar] [CrossRef]
  69. Schweighofer, B.; Raab, K.; Brasseur, G. Modeling of High Power Automotive Batteries by the Use of an Automated Test System. IEEE Trans. Instrum. Meas. 2003, 52, 1087–1091. [Google Scholar] [CrossRef]
  70. Li, J.; Mazzola, M. Accurate battery pack modeling for automotive applications. J. Power Sources 2013, 237, 215–228. [Google Scholar] [CrossRef]
  71. He, H.; Xiong, R.; Guo, H.; Li, S. Comparison study on the battery models used for the energy management of batteries in electric vehicles. Energy Convers. Manag. 2012, 64, 113–121. [Google Scholar] [CrossRef]
  72. Wang, W.; Chung, H.; Zhang, J. Near-Real-Time Parameter Estimation of an Electrical Battery Model with Multiple Time Constants and SOC-Dependent Capacitance. IEEE Trans. Power Electron. 2014, 29, 5905–5920. [Google Scholar] [CrossRef]
  73. Seaman, A.; Dao, T.; McPhee, J. A survey of mathematical-based equivalent-circuit and electrochemical battery models for hybrid and electric vehicle simulation. J. Power Sources 2014, 256, 410–423. [Google Scholar] [CrossRef] [Green Version]
  74. Benini, L.; Castelli, G.; Macii, A.; Macii, E.; Poncino, M.; Scarsi, R. Discrete-Time Battery Models for System-Level Low-Power Design. IEEE Trans. Very Large Scale Integr. Syst. 2001, 9, 630–640. [Google Scholar] [CrossRef]
  75. Gold, S. A PSPICE Macromodel for Lithium-Ion Batteries. In Proceedings of the 1997 IEEE Battery Applications and Advances Conference, Long Beach, CA, USA, 31 March 1997; pp. 215–222. [Google Scholar]
  76. Chen, M.; Rincon-Mora, A. Accurate Electrical Battery Model Capable of Predicting Runtime and I–V Performance. IEEE Trans. Energy Convers. 2006, 21, 504–511. [Google Scholar] [CrossRef]
  77. Kroeze, R.; Krein, P. Electrical Battery Model for Use in Dynamic Electric Vehicle Simulations. In Proceedings of the 2008 IEEE Power Electronics Specialists Conference, Rhodes, Greece, 15–19 June 2008; pp. 1336–1342. [Google Scholar]
  78. Gao, L.; Liu, S.; Dougal, R.A. Dynamic Lithium-Ion Battery Model for System Simulation. IEEE Trans. Compon. Packag. Manuf. Technol. 2002, 25, 495–505. [Google Scholar]
  79. Li, S.; Ke, B. Study of Battery Modeling using Mathematical and Circuit Oriented Approaches. In Proceedings of the 2011 IEEE Power and Energy Society General Meeting, Detroit, MI, USA, 24–29 July 2011; pp. 1–8. [Google Scholar]
  80. Tremblay, O.; Dessaint, L. Experimental Validation of a Battery Dynamic Model for EV Applications. World Electr. Veh. J. 2009, 3, 289–298. [Google Scholar] [CrossRef] [Green Version]
  81. Jackey, R.A. A Simple, Effective Lead-Acid Battery Modeling Process for Electrical System Component Selection. SAE Trans. 2007, 116, 219–227. [Google Scholar]
  82. Bhangu, B.S.; Bingham, C.M.; Stone, D.A.; Bentley, P. Nonlinear Observer techniques for Prediction State-of-Charge and State-of-Health of Lead-Acid Batteries for Hybrid-Electric Vehicles. IEEE Trans. Veh. Technol. 2005, 54, 783–794. [Google Scholar] [CrossRef] [Green Version]
  83. Copetti, J.B.; Lorenzo, E.; Chenlo, F. A general battery model for PV system simulation. Prog. Photovolt.: Res. Appl. 1993, 1, 283–292. [Google Scholar] [CrossRef]
  84. Macomber, H.L.; Ruzek, J.B.; Costello, F.A. Photovoltaic Stand-Alone Systems: Preliminary Engineering-Design Handbook; United States Department of Energy: Washington, DC, USA, 1981.
  85. Salkind, A.; Singh, P.; Cannone, A.; Atwater, T.; Wang, X.; Reisner, D. Impedance modeling of intermediate size lead-acid batteries. J. Power Sources 2003, 116, 174–184. [Google Scholar] [CrossRef]
  86. Stroe, D.I.; Swierczynski, M.; Stroe, A.I.; Knap, V.; Teodorescu, R.; Andreasen, S.J. Evaluation of Different Methods for Measuring the Impedance of Lithium-Ion Batteries during Ageing. In Proceedings of the 2005 IEEE Ecological Vehicles and Renewable Energies International Conference, Monte Carlo, Monaco, 31 March–2 April 2005; pp. 1–8. [Google Scholar]
  87. Moubayed, N.; Kouta, J.; El-Ali, A.; Demayka, H.; Outbib, R. Parameter Identification of the Lead-Acid Battery Model. In Proceedings of the 2008 IEEE Photovoltaic Specialists Conference, San Diego, CA, USA, 11–16 May 2008; pp. 1–6. [Google Scholar]
  88. Ceraolo, M. New dynamical models of lead-acid batteries. IEEE Trans. Power Syst. 2000, 15, 1184–1190. [Google Scholar] [CrossRef] [PubMed] [Green Version]
  89. Wang, H.; Li, G.; Li, M.; Jiang, Z.; Wang, X.; Zhao, Q. Third-order dynamic model of a lead acid battery for use in fuel cell vehicle simulation. In Proceedings of the 2011 IEEE Mechatronic Science, Electric Engineering and Computer Conference, Jilin, China, 19–22 August 2011; pp. 715–720. [Google Scholar]
  90. Yang, Q.; Xu, J.; Li, X.; Xu, D.; Cao, B. State-of-health estimation of lithium-ion battery based on fractional impedance model and interval capacity. Int. J. Electr. Power Energy Syst. 2020, 119, 105883. [Google Scholar] [CrossRef]
  91. Guo, R.; Shen, W. A Review of Equivalent Circuit Model Based Online State of Power Estimation for Lithium-Ion Batteries in Electric Vehicles. Vehicles 2021, 4, 1–29. [Google Scholar] [CrossRef]
  92. Tang, X.; Liu, B.; Lv, Z.; Gao, F. Observer based battery SOC estimation: Using multi-gain-switching approach. Appl. Energy 2017, 204, 1275–1283. [Google Scholar] [CrossRef]
  93. Du, J.; Liu, Z.; Wang, Y.; Wen, C. An adaptive sliding mode observer for lithium-ion battery state of charge and state of health estimation in electric vehicles. Control Eng. Pract. 2016, 54, 81–90. [Google Scholar] [CrossRef]
  94. Ning, B.; Cao, B.; Wang, B.; Zou, Z. Adaptive sliding mode observers for lithium-ion battery state estimation based on parameters identified online. Energy 2018, 153, 732–742. [Google Scholar] [CrossRef]
  95. Nobile, G.; Vasta, E.; Cacciato, M.; Scarcella, G.; Scelba, G.; Di Stefano, A.G.F.; Leotta, G.; Pugliatti, P.M.; Bizzarri, F. Integration of a relaxation voltage prediction function into a PI-based observer to improve the SOC estimation of battery packs in renewable energy applications. In Proceedings of the 2020 ELEKTRO Conference, Taormina, Italy, 11–15 May 2020; pp. 1–6. [Google Scholar]
  96. Amir, U.; Tao, L.; Zhang, X.; Saeed, M.; Hussain, M. A Novel SOC Estimation Method for Lithium Ion Battery Based On Improved Adaptive PI Observer. In Proceedings of the 2018 IEEE International Conference on Electrical Systems for Aircraft, Railway, Ship Propulsion and Road Vehicles & International Transportation Electrification Conference (ESARS-ITEC), Nottingham, UK, 7–9 November 2018; pp. 1–5. [Google Scholar]
  97. Rzepka, B.; Bischof, S.; Blank, T. Implementing an Extended Kalman Filter for SoC Estimation of a Li-Ion Battery with Hysteresis: A Step-by-Step Guide. Energies 2021, 14, 3733. [Google Scholar] [CrossRef]
  98. Zhi, L.; Peng, Z.; Zhifu, W.; Qiang, S.; Yinan, R. State of charge estimation for Li-ion battery based on extended Kalman filter. Energy Procedia 2017, 105, 3515–3520. [Google Scholar] [CrossRef]
  99. Jiang, N.; Pang, H. Study on Co-Estimation of SoC and SoH for Second-Use Lithium-Ion Power Batteries. Electronics 2022, 11, 1789. [Google Scholar] [CrossRef]
  100. Zeng, M.; Zhang, P.; Yang, Y.; Xie, C.; Shi, Y. SOC and SOH Joint Estimation of the Power Batteries Based on Fuzzy Unscented Kalman Filtering Algorithm. Energies 2019, 12, 3122. [Google Scholar] [CrossRef] [Green Version]
  101. Xiao, D.; Fang, G.; Liu, S.; Yuan, S.; Ahmed, R.; Habibi, S.; Emadi, A. Reduced-Coupling Coestimation of SOC and SOH for Lithium-Ion Batteries Based on Convex Optimization. IEEE Trans. Power Electron. 2020, 35, 12332–12346. [Google Scholar] [CrossRef]
  102. Nobile, G.; Vasta, E.; Cacciato, M.; Scarcella, G.; Scelba, G. Estimation of SOH for Battery Packs: A Real-Time Mixed Algorithm based on Coulomb Counting Method and Parameter-Varying Circuit Modeling. In Proceedings of the 2020 IEEE 11th International Symposium on Power Electronics for Distributed Generation Systems (PEDG), Dubrovnik, Croatia, 28 September–1 October 2020. [Google Scholar]
  103. Canals Casals, L.; Amante García, B.; González Benítez, M.M. Aging model for re-used electric vehicle batteries in second life stationary applications. In Project Management and Engineering Research AEPRO 2016; Springer: Berlin, Germany, 2017; pp. 139–151. [Google Scholar]
  104. Canals Casals, L.; Amante García, B.; Canal, C. Second life batteries lifespan: Rest of useful life and environmental analysis. J. Environ. Manag. 2019, 232, 354–363. [Google Scholar] [CrossRef]
  105. Vetter, J.; Novák, P.; Wagner, M.R.; Veit, C.; Möller, K.C.; Besenhard, J.O.; Winter, M.; Wohlfahrt-Mehrens, M.; Vogler, C.; Hammouche, A. Ageing mechanisms in lithium-ion batteries. J. Power Sources 2005, 147, 269–281. [Google Scholar] [CrossRef]
  106. Wang, J.; Liu, P.; Hicks-Garner, J.; Sherman, E.; Soukiazian, S.; Verbrugge, M.; Tataria, H.; Musser, J.; Finamore, P. Cycle-life model for graphite-LiFePO4 cells. J. Power Sources 2011, 196, 3942–3948. [Google Scholar] [CrossRef]
  107. Micari, S.; Foti, S.; Testa, A.; De Caro, S.; Sergi, F.; Andaloro, L.; Aloisio, D.; Napoli, G. Reliability assessment and lifetime prediction of Li-ion batteries for electric vehicles. Electr. Eng. 2022, 104, 165–177. [Google Scholar] [CrossRef]
  108. Omar, N.; Monem, M.A.; Firouz, Y.; Salminen, J.; Smekens, J.; Hegazy, O.; Gaulous, H.; Mulder, G.; Van den Bossche, P.; Coosemans, T.; et al. Lithium iron phosphate based battery—Assessment of the aging parameters and development of cycle life model. Appl. Energy 2014, 113, 1575–1585. [Google Scholar] [CrossRef]
  109. Capra, M.; Bussolino, B.; Marchisio, A.; Masera, G.; Martina, M.; Shafique, M. Hardware and Software Optimizations for Accelerating Deep Neural Networks: Survey of Current Trends, Challenges, and the Road Ahead. IEEE Access 2020, 8, 225134–225180. [Google Scholar] [CrossRef]
  110. Morgos, J.; Klčo, P.; Hrudkay, K. Artificial Neural Network Based MPPT Algorithm for Modern Household with Electric Vehicle. Communications. Sci. Lett. Univ. Zilina 2022, 24, C18–C26. [Google Scholar]
  111. How, D.N.T.; Hannan, M.A.; Lipu, M.S.H.; Sahari, K.S.M.; Ker, P.J.; Muttaqi, K.M. State-of-Charge Estimation of Li-ion Battery in Electric Vehicles: A Deep Neural Network Approach. In Proceedings of the 2019 IEEE Industry Applications Society Annual Meeting, Baltimore, MD, USA, 29 September–3 October 2019; pp. 1–8. [Google Scholar]
  112. Nielsen, M.A. Neural Networks and Deep Learning; Determination Press: Washington, DC, USA, 2015. [Google Scholar]
  113. Sharma, S.; Sharma, S.; Athaiya, A. Activation functions in neural networks. Int. J. Eng. Appl. Sci. Technol. 2020, 4, 310–316. [Google Scholar] [CrossRef]
  114. Szandała, T. Review and Comparison of Commonly Used Activation Functions for Deep Neural Networks. In Bio-Inspired Neurocomputing. Studies in Computational Intelligence; Bhoi, A., Mallick, P., Liu, C.M., Balas, V., Eds.; Springer: Singapore, 2021; Volume 903, pp. 203–224. [Google Scholar]
  115. Lau, M.M.; Lim, K.H. Investigation of activation functions in deep belief network. In Proceedings of the 2017 2nd International Conference on Control and Robotics Engineering (ICCRE), Bangkok, Thailand, 1–3 April 2017; pp. 201–206. [Google Scholar]
  116. Zhu, D.; Campbell, J.J.; Cho, G. Battery Voltage Prediction Using Neural Networks. In Proceedings of the 2021 IEEE Transportation Electrification Conference & Expo (ITEC), Chicago, IL, USA, 21–25 June 2021; pp. 807–812. [Google Scholar]
  117. Darbar, D.; Bhattacharya, I. Application of Machine Learning in Battery: State of Charge Estimation Using Feed Forward Neural Network for Sodium-Ion Battery. Electrochem 2022, 3, 42–57. [Google Scholar] [CrossRef]
  118. Liu, C.; Zhang, Y.; Sun, J.; Cui, Z.; Wang, K. Stacked bidirectional LSTM RNN to evaluate the remaining useful life of supercapacitor. Int. J. Energy Res. 2022, 46, 3034–3043. [Google Scholar] [CrossRef]
  119. Bhattacharya, S.; Maddikunta, P.K.R.; Meenakshisundaram, I.; Gadekallu, T.R.; Sharma, S.; Alkahtani, M.; Abidi, M.H. Deep neural networks based approach for battery life prediction. Cmc-Comput. Mater. Contin. 2021, 69, 2599–2615. [Google Scholar] [CrossRef]
  120. Shu, X.; Shen, S.; Shen, J.; Zhang, Y.; Li, G.; Chen, Z.; Liu, Y. State of health prediction of lithium-ion batteries based on machine learning: Advances and perspectives. iScience 2021, 24, 103265. [Google Scholar] [CrossRef]
  121. Jo, S.; Jung, S.; Roh, T. Battery State-of-Health Estimation Using Machine Learning and Preprocessing with Relative State-of-Charge. Energies 2021, 14, 7206. [Google Scholar] [CrossRef]
  122. Alwosheel, A.; van Cranenburgh, S.; Chorus, C.G. Is your dataset big enough? Sample size requirements when using artificial neural networks for discrete choice analysis. J. Choice Model. 2018, 28, 167–182. [Google Scholar] [CrossRef]
  123. Hu, X.; Li, S.E.; Yang, Y. Advanced machine learning approach for lithium-ion battery state estimation in electric vehicles. IEEE Trans. Transp. Electrific. 2016, 2, 140–149. [Google Scholar] [CrossRef]
  124. Hossain Lipu, M.S.; Hannan, M.A.; Hussain, A.; Saad, M.H.; Ayob, A.; Uddin, M.N. Extreme learning machine model for state-of-charge estimation of lithium-ion battery using gravitational search algorithm. IEEE Trans. Ind. Appl. 2019, 55, 4225–4234. [Google Scholar] [CrossRef]
  125. Li, Y.; Li, K.; Liu, X.; Zhang, L. Fast battery capacity estimation using convolutional neural networks. Trans. Inst. Meas. 2020. [Google Scholar] [CrossRef]
  126. Yang, D.; Wang, Y.; Pan, R.; Chen, R.; Chen, Z. A Neural Network Based State-of-Health Estimation of Lithium-ion Battery in Electric Vehicles. Energy Procedia 2017, 105, 2059–2064. [Google Scholar] [CrossRef]
  127. Qianglong, L.; Xiaowei, Z.; Kun, Z.; Jianrui, S.; Kai, W. State of Health Estimation of Lithium-ion Battery Based on Ant Lion Optimization and Support Vector Regression. In Proceedings of the 2021 IEEE International Conference on Electrical Engineering and Mechatronics Technology (ICEEMT), Qingdao, China, 2–4 July 2021; pp. 334–337. [Google Scholar]
  128. Zhang, Y.; Liu, Y.; Wang, J.; Zhang, T. State-of-health estimation for lithium-ion batteries by combining model-based incremental capacity analysis with support vector regression. Energy 2022, 239, 121986. [Google Scholar] [CrossRef]
  129. Smola, A.J.; Schölkopf, B. A tutorial on support vector regression. Stat. Comput. 2004, 14, 199–222. [Google Scholar] [CrossRef] [Green Version]
  130. Weng, C.; Sun, J.; Peng, H. Model Parametrization and Adaptation Based on the Invariance of Support Vectors with Applications to Battery State-of-Health Monitoring. IEEE Trans. Veh. Technol. 2015, 64, 9. [Google Scholar] [CrossRef]
  131. Dubarry, M.; Svoboda, V.; Hwu, R.; Liaw, B.Y. Incremental capacity analysis and close-to equibrilium OCV measurements to quantify capacity fade in commercial rechargable lithium batteries. Electrochem. Solid-State Lett. 2006, 9, A454–A457. [Google Scholar] [CrossRef]
  132. Anseán, D.; García, V.M.; González, M.; Blanco-Viejo, C.; Viera, J.C.; Pulido, Y.F.; Sánchez, L. Lithium-ion battery degradation indicators via incremental capacity analysis. IEEE Trans. Ind. Appl. 2019, 55, 2992–3002. [Google Scholar] [CrossRef]
  133. Smola, A.; Scholkopf, B.; Ratsch, G. Linear programs for automatic accuracy control in regression. In Proceedings of the 1999 Ninth International Conference on Artificial Neural Networks (ICANN), Edinburgh, UK, 7–10 September 1999; Volume 2, pp. 575–580. [Google Scholar]
  134. Tan, X.; Zhan, D.; Lyu, P.; Rao, J.; Fan, Y. Online state-of-health estimation of lithium-ion battery based on dynamic parameter identification at multi timescale and support vector regression. J. Power Sources 2021, 484, 229–233. [Google Scholar] [CrossRef]
  135. Yang, D.; Wang, Y.; Pan, R.; Chen, R.; Chen, Z. State-of-health estimation for the lithium-ion battery based on support vector regression. Appl. Energy 2018, 227, 273–283. [Google Scholar] [CrossRef]
  136. Wang, Y.; Zhang, C.; Chen, Z. On-line battery state-of-charge estimation based on an integrated estimator. Appl. Energy 2017, 185, 2026–2032. [Google Scholar] [CrossRef]
  137. Wu, J.; Fang, L.; Meng, J.; Lin, M.; Dong, G. Optimized Multi-Source Fusion Based State of Health Estimation for Lithium-Ion Battery in Fast Charge Applications. IEEE Trans. Energy Convers. 2022, 37, 1489–1498. [Google Scholar] [CrossRef]
  138. Yang, R.; Zhang, X.; Liu, G.; Hou, S. State of Health Estimation for Power Battery Based on Support Vector Regression and Particle Swarm Optimization Method. In Proceedings of the 2021 40th Chinese Control Conference (CCC), Shanghai, China, 26–28 July 2021; pp. 6281–6288. [Google Scholar]
  139. Pastor-Fernández, C.; Uddin, K.; Chouchelamane, G.H.; Widanage, W.D.; Marco, J. A Comparison between Electrochemical Impedance Spectroscopy and Incremental Capacity-Differential Voltage as Li-ion Diagnostic Techniques to Identify and Quantify the Effects of Degradation Modes within Battery Management Systems. J. Power Sources 2017, 360, 301–318. [Google Scholar] [CrossRef]
  140. Andre, D.; Nuhic, A.; Soczka-Guth, T.; Sauer, D.U. Comparative study of a structured neural network and an extended Kalman filter for state of health determination of lithium-ion batteries in hybrid electricvehicles. Eng. Appl. Artif. Intell. 2013, 26, 951–961. [Google Scholar] [CrossRef]
  141. Obisakin, I.; Ekeanyanwu, C. State of Health Estimation of Lithium-Ion Batteries Using Support Vector Regression and Long Short-Term Memory. Open J. Appl. Sci. 2022, 12, 1366–1382. [Google Scholar] [CrossRef]
  142. Heinrich, F.; Klapper, P.; Pruckner, M. A comprehensive study on battery electric modeling approaches based on machine learning. Energy Inform. 2021, 4, 17. [Google Scholar] [CrossRef]
Figure 1. Nyquist plot of impedance data.
Energies 16 00632 g001
Figure 2. IC curve.
Figure 2. IC curve.
Energies 16 00632 g002
Figure 3. A PI-based estimation algorithm, ECM is the internal core.
Energies 16 00632 g003
Figure 4. Flow chart of a mixed algorithm and the co-estimation of SOC and SOH.
Energies 16 00632 g004
Figure 5. Fading factor based on temperature (a), discharge rate (b), charge rate (c) and DOD (d).
Energies 16 00632 g005
Figure 6. Typical NN structure.
Energies 16 00632 g006
Figure 7. ε insensitivity with slack constrains.
Energies 16 00632 g007
Table 1. Few relevant studies on SOH evaluation by applying ICA.
Ref.ErrorRelevant FeaturesChemistry
[47]0.85% RMSEIC curve smoothed with moving average filter and Gaussian filter. Peak area as FOI. Second-degree polynomial curve fitted to the data to model the correlation.Rate C/3 LTO
1.58% RMSERate 1C
1.57% RMSERate 2C
1.37% RMSERate C/3NMC
1.60% RMSERate 1C
4.72% RMSERate 2C
2.12% RMSERate C/3LFP
2.33% RMSERate 1C
[48]1.33% RMSE
4.25% MAE
Comparison between cell and vehicle levels (battery pack). Rate C/2, position of peaks and valleys used as FOIs.NMC
2.92% RMSE
8.54% MAE
LMO
[51]<2.5% MAPERate C/2. Linear regression function, established by using the Matlab curve fitting toolbox, used for associating FOIs (monotonic trends in the positions of peaks and valleys) with capacity fading.NMC
[52]2.69% RMSEFiltering with a robust cubic smoothing spline method. Robust linear regression with bisquare method used for associating FOIs with capacity fading.Peak height ratio as FOI.
RMSE of peak height ratio is 0.49% if low noise is introduced and 1.55% if high noise is introduced.
LFP
4.44% RMSEPeak height value as FOI.
8.69% RMSEPeak area as FOI.
[53]<1% MAPE (except for a few outliers)SVR used for associating FOIs (peak heights) with capacity fading.LFP
[54]1.41% RMSEOLS method used for associating FOIs (peak height and peak area) with capacity fading.LFP
1.08% RMSERidge regression used for associating FOIs (peak height and peak area) with capacity fading.
2.78% RMSELinear regression with Pearson’s product–moment correlation-based peak area selection method used for associating FOIs with capacity fading.
Table 2. Few relevant studies on SOH evaluation by applying NNs.
Ref.ErrorRelevant FeaturesChemistry
[125]1.1% RMSEELM-based GSA model, DST.NMC
1.4% RMSEELM-based GSA model, FUDS.
[126]<2.93% RMSECNN (considering various combinations in the structure).Li-ion Oxford Battery Degradation Dataset
<2.54% RMSELFP (dataset provided by the Toyota Research Institute)
0.95% RMSECNN with four convolutional layers.
1.72% RMSEANN.
1.23–1.34% RMSEDNN (error variation due to different number of hidden layers).
[127]<5% MAEThree-layer NN using a sigmoid activation function.LFP
Table 3. Few relevant studies on SOH evaluation by applying SVR.
Ref.ErrorRelevant FeaturesChemistry
[136]0.93–1.60% RMSEPSO–LSSVRLFP
1.02–4.32% RMSELSSVR
1.18–6% RMSENN
[138]0.5% MAEGA–SVR LFP
[139]0.41–1.45% MAE
0.56–1.59% RMSE
PSO–SVRLi-ion (provided by NASA prognostic center of excellence)
1.98–2.29% MAE
2.40–2.87% RMSE
SVR
Table 4. Advantages and disadvantages comparison of analyzed methods.
AdvantagesDisadvantages
EXPERIMENTAL METHODS
EIS
Avoids complex calculation when using the standalone method.
Good generality and electrochemical basis.
Offline data processing even if studies for online data processing are ongoing.
Requires specific current patterns.
Vulnerable to temperature.
ICA
Easily implemented in a BMS.
Easy to monitor, only needs two parameters.
Low computational effort
Works for partial charging/discharging conditions.
Requires controlled charging/discharging processes.
Temperature variation disturbs the estimation accuracy.
Requires noise filtering.
Limited to low C-rates even if studies at high C-rates are ongoing.
MODEL-BASED METHODS
ECM
Basic models, up to the Thevenin one, are very easy to implement in simulation platforms of low-cost microcontrollers.
Intermediate models such as Runtime ensures better accuracy while integrating aging effects and thermal phenomena.
More advanced circuits can model the behavior of the battery with high accuracy also in the case of quickly varying load conditions.
Accuracy depends on complexity in terms of circuit topology and parameters identification process.
Basic models imply some limitations; for example, they cannot predict capacity fading due to thermal or aging effects because their parameters have constant values.
Intermediate models cannot work under quickly varying load conditions.
AM
Low computational effort.
Model equations based on real measurements.
Arrhenius cumulative stress models can be applied.
Too many parameters, some of which are confidential.
Extensive laboratory tests over the entire operating range are required, which are time consuming and economically costly.
Difficult to develop suitable laboratory ageing tests to analyze the interaction between different ageing processes and link them to lifetime expectancy on an experimental basis.
Poor generalizability: developed models are restricted to a specific battery type and operating conditions.
Open loop approach.
DATA-DRIVEN METHODS
NN
High prediction accuracy as far as sensitivity to the quantity and quality of training data.
Can filter high degree of noise.
Strong ability to consider nonlinearities, even when working with a large number of inputs.
Easy for exacting global features from raw data.
FNNs, being the simplest, are characterized by fast learning speed and less computational complexity.
RNNs own strong long-term prediction ability due to recurrent links.
DNNs work well with a large dataset.
Easy to design without electrochemical knowledge.
Potential to cause overfitting problem.
Poor uncertainty management ability.
Performance highly depends on the training process.
Gradient vanishing and gradient exploding problems (particularly for RNN).
FNN, compared to RNN, cannot capture the sequential information.
DNNs rely on a large training dataset and therefore on a considerable amount of storage space.
SVR
Easy to design without electrochemical knowledge.
High prediction accuracy.
Good efficiency in multidimensional tasks.
It is not suitable for a large dataset: long time and computational effort required.
Tuning of hyperparameters is not easy.
Highly depends on the quality of the training data.
The choice of the kernel function is not straightforward.
OTHER SUPPORTIVE METHODS
CC
Simplicity.
Low computational complexity.
Low power consumption.
Calibration is required after charge/discharge cycle.
Open loop approach.
Inaccurate results from unknown disruptions.
SOC starting value is difficult to determine.
Determination errors accumulate over time.
OCV
Easy to implement.
Low computational burdens.
Suit for dynamic profiles.
Good generality and electrochemical basis.
Joint estimation of states.
Cannot operate online.
Achieving equilibrium takes a long time.
KF
KF estimates accurately states impacted by external disturbances like noises with a Gaussian distribution; more advanced version such as EKF can filter a high degree of noise and accurately predicts the state of a nonlinear dynamic system.
High computational complexity.
If the system is significantly nonlinear, it may have limited robustness, and linearization errors may arise.
Disclaimer/Publisher’s Note: The statements, opinions and data contained in all publications are solely those of the individual author(s) and contributor(s) and not of MDPI and/or the editor(s). MDPI and/or the editor(s) disclaim responsibility for any injury to people or property resulting from any ideas, methods, instructions or products referred to in the content.

