Article

Modeling Unpredictable Behavior of Energy Facilities to Ensure Reliable Operation in a Cyber-Physical System

1
School of Power Engineering, Irkutsk National Research Technical University, 664074 Irkutsk, Russia
2
Corporate Training & Research Center “Eurosibenergo”, Irkutsk National Research Technical University, 664074 Irkutsk, Russia
3
Industrial Mathematics Laboratory, Baikal School of BRICS, Irkutsk National Research Technical University, 664074 Irkutsk, Russia
*
Authors to whom correspondence should be addressed.
Energies 2023, 16(19), 6960; https://doi.org/10.3390/en16196960
Submission received: 4 September 2023 / Revised: 20 September 2023 / Accepted: 3 October 2023 / Published: 5 October 2023
(This article belongs to the Special Issue Machine Learning for Cyber-Physical Energy Systems)

Abstract

:
This research focuses on exploring various techniques and models for simulating the random behavior of energy facilities or systems. These simulations are essential in identifying the likelihood of component failures within the studied facilities. By assessing the potential consequences of emergency scenarios, this analysis serves as a fundamental aspect of synthesizing and analyzing reliability in the cyber-physical system. Ultimately, the study aims to enhance the management and control of reliability and safety for these facilities. In this study, a unified heating source is considered as an energy facility (as part of district heating systems), for example, a combined heat and power plant. However, the developed methods and models have sufficient universality for their adaptation to other energy facilities without significant changes. The research methodology is based on the use of Markov random processes and laws of the probability theory. The basic model of the energy facilities is formulated for the conditions of the simplest events flow with appropriate assumptions and constraints, in particular, ordinary events and independence of events (failures and restorations). To take into account the non-ordinary events (failures) and dependences between some failures, corresponding modifications of the basic model are proposed. A computational experiment was carried out using the developed models, and graphical interpretations of the results are presented. The obtained results allow us to formulate some preliminary conclusions about the range of influence of the simulated factors on the reliability analysis of studied facilities and to outline conditions and areas of their admissible application.

1. Introduction

The energy facilities forming modern integrated energy systems are cyber-physical objects interacting with each other in a distributed area and functioning to ensure a reliable and efficient energy supply to consumers. Managing and operating such facilities at all stages of the life cycle becomes a complex multi-factorial problem with many uncertain parameters and rapidly changing processes [1,2,3,4]. One of the key targets for the functioning of cyber-physical energy facilities is the management and control of their reliability, which involves the solution of a number of methodological problems. To solve these problems of reliability and safety of the functioning of these facilities, it is necessary to create an appropriate cyber-physical system that includes the entire complex of stages of reliability management and operation: collection and processing of information on the accident rate and condition of facilities, statistics of repairs and maintenance, formation of a system of criteria and standards, the reliability assessment and analysis of the studied facilities, development of ways and methods to ensure reliability and optimization (synthesis), planning of repair programs and equipment maintenance, etc. Among these problems, one of the main ones is the development of methodological and scientific assurances for the reliability analysis of the studied facilities.
This study focuses on a specific energy facility, namely a unified heating source (HS) like a combined heat and power plant (CHPP). However, it is important to note that the developed methods and models for reliability analysis can be universally adapted for other energy facilities with minimal modifications. Considering the chosen facility, this paper provides a concise overview of the reliability analysis methods applicable to various types of HSs. Additionally, it should be acknowledged that these studied HSs primarily function within district heating systems (DHSs). As a result, many aspects of reliability issues in DHSs are relevant to HSs, therefore the literature review will also touch upon the reliability problems specific to DHSs.
Based on the review of the methods for the HS and DHS reliability analysis, we can distinguish two main methodological problems: (1) physical assessment of the consequences of the failures of components (emergency states); (2) stochastic or probabilistic assessment of the consequences of the failures of components. The first problem involves mainly thermal–hydraulic modeling of the heating processes in accordance with the given facility’s configuration diagram and conditions of modeling. The models of the theory of hydraulic circuits (THC) and other models describing technological processes should be used as a methodological basis for such calculations [5]. The second problem is aimed at determining the probabilities of the modeled emergency states, which, in combination with the results of its physical analysis of consequences, are used to determine the reliability indices (RIs). This study is carried out within the framework of methodological issues of solving the second problem (stochastic assessment).
The reliability analysis of HSs is carried out by various methods, which can be grouped into two large groups: (1) analytical and (2) statistical methods including contemporary machine learning methods [6]. The first group includes general methods based on the application of Markov and semi-Markov random processes [7,8,9,10,11]. For the correct application of the random processes for the reliability analysis of energy facilities, its calculation diagram with the given reliability parameters of components is required. The second group of methods usually involves the realization of imitation algorithms based on random variables. Among such algorithms, the Monte Carlo method or the method of statistical tests is widely used [7,12,13]. The use of this method requires a sufficiently large array of initial data to obtain accurate results.
Generally, the analysis and ensuring of HS reliability are inextricably connected with similar problems solved at a higher hierarchical level of the DHS, including the reliability of heat networks [7,14]. At the present stage of development, modern DHSs are being transformed into district-distributed heating systems (DDHSs), which integrate different energy technologies (incl. renewable ones) and ensure the high efficiency and reliability of heating supplied to consumers. This stage of technological transformation in heat supply corresponds to the so-called 4th generation DHS [15,16,17,18,19]. The sector of distributed generation of a DDHS is formed, first of all, at the level of prosumers [20,21,22,23,24]. The introduction of prosumers with their HSs brings about new functional properties when the structure and parameters of systems change, which requires adjustment of methodology [25,26,27]. Papers [28,29] have presented methods of the economic optimization for heat-prosumer-based district heating systems with thermal energy storage. Some methodological issues of ensuring these systems’ reliability, given the functions of the prosumers, are considered in [30,31]. The paper [30] proposes a method for determining an optimal time redundancy of a prosumer considering the restoration properties of the system. The study [31] presents a model for ensuring the system reliability based on the optimal combination of the reliability parameters for the components and the heat redundancy of the prosumer.
Thus, the methodology for probabilistic assessment of the states of HSs and their subsystems in the framework of reliability problems is based on various approaches. The reliability problems for energy facilities and systems with given block diagrams are mainly solved using analytical methods relying on the data on failures and restorations of components (reliability parameters). The widely used methods among these ones are the methods based on the theory of random processes, in particular, Markov and semi-Markov processes [7,32]. Some initial conditions corresponding to real-life facilities make it possible to use this mathematical framework to describe their functioning under the simplest events flow with the assumptions of stationarity, ordinariness and independence of events (failures and restorations of components) [7,32,33]. In this context, the initial basic model of the Markov random process of the evolution of states is formulated. However, when analyzing the reliability of complex real-life energy facilities (including CHPPs), the assumptions made become too rigid, which is due to the parallel operation of both the technical components of facility itself and its cyber-physical control system. In this regard, the probability of both simultaneous and dependent (mainly, failures of the components) events increases. In this study, to accounting these factors, the basic model of the random process of the studied CHPP is used to develop corresponding modifications with a view to factoring in the non-ordinary events flow and the dependences between them. The proposed models were used to carry out computational experiments whose results were analyzed with their graphical interpretations given. Conclusions and directions for further research are formulated.

2. Methodology

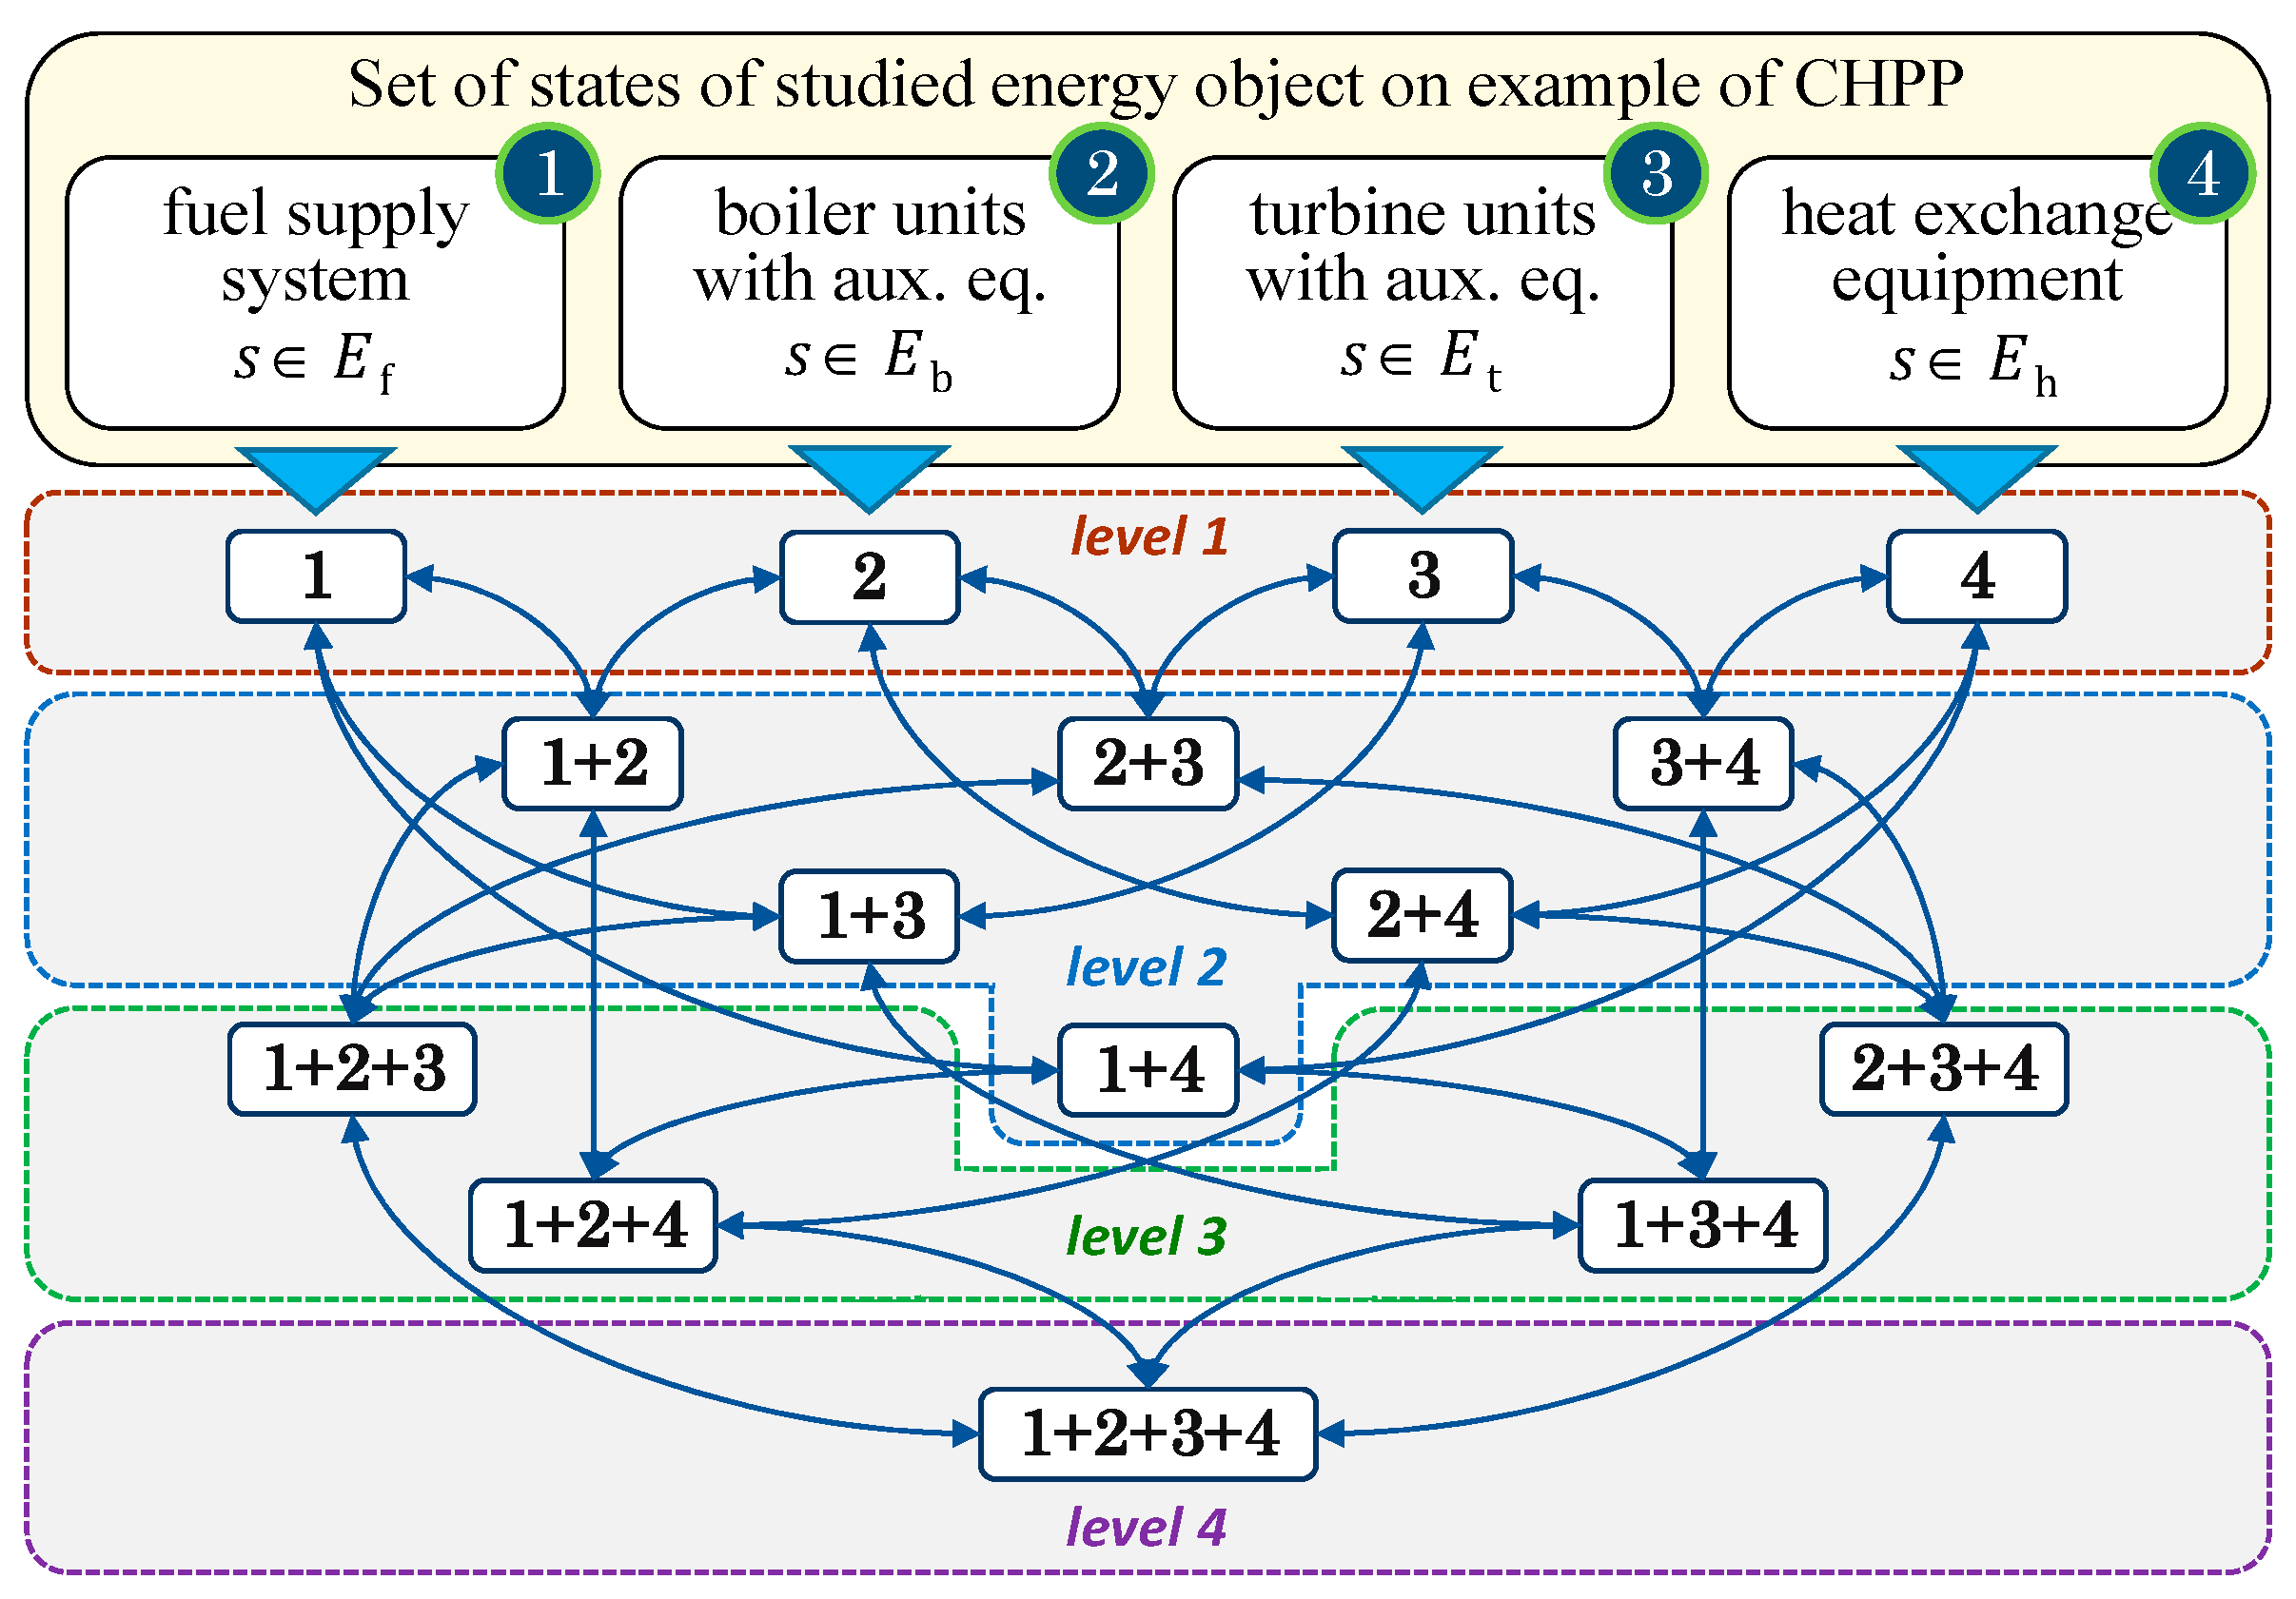
2.1. Initial Conditions and a Basic Model of a Random Process of Operation of a Heating Source (with the Example of CHPP)

The operation of a CHPP from the standpoint of a probabilistic description is characterized by a sequence of failure and restoration events that occur with a certain frequency at all stages of production and output of thermal energy. The basis for modeling a random process is the set of states modeled according to a given combination of failed and operable components. The principle of formation of this set and further methodological procedures will be considered for a CHPP (referred to as facilities) consisting of four main subsystems: (1) fuel supply system (FS); (2) boiler units (BUs) with auxiliary equipment; (3) turbine units (TUs) with auxiliary equipment; (4) heat exchange equipment (HE).
The complete set of states for the studied facilities consists of four levels: one of the simple states corresponding to the failure of one component of each subsystem and three levels of complex states corresponding to combinations of failures of 2, 3, and 4 components from different subsystems. Figure 1 shows a graph of states illustrating the generated set of states. The evolution of the states of facilities over time in the simplest case (with maximum constraints) is described by the simplest events flow with assumptions about the ordinariness and independence of events and by the stationarity of state probabilities [32]. These conditions correspond to the basic model of the Markov random process of facilities’ functioning, which is described by the system of linear equations [7,32]:
p s i I s ( λ i + μ i ) = z E s p z i I z ( λ i + μ i ) , s E ,
where p s ,   p z are probabilities of states of the studied energy facilities; λ i ,   μ i are transition probabilities of the random process: failure and restoration rates of some component i respectively, 1/h; E is a set of states; E s is a subset of states from which the direct transition (without intermediate states) to the state s is possible; I s is a subset of components whose failure or restoration corresponds to the direct transition from the state s to some other state z ; I z is a subset of components whose failure or restoration corresponds to the direct transition from the state z to some state s .
It should be noted that determining the initial modeling parameters (in particular, the failure and restoration rates of components) is the most important problem of information support for the reliability analysis of any technical systems. For distributed and complex systems, such as energy systems, this problem is especially acute due to the many random factors affecting the operating conditions of components and the insufficient identification and control of their states (the weakest state control corresponds to electrical and heating network components distributed over a large area). To obtain reliable estimates of the reliability parameters of components, in particular, failure rates, statistical methods are usually used for processing retrospective data on the functioning of these components in combination with the normative curve of the life cycle, which has three main stages (running-in, normal operation and aging). Determining reliable values of failure rates of components (as well as other reliability parameters) is the subject of a special study, which is of great importance in the calculation of real-life energy facilities and systems. These questions go beyond the scope of the presented study of the features of modeling the random process of functioning of studied objects, which is carried out under the assumption that these parameters are either specified or a range of their values is considered to identify some dependencies (as, for example, in Section 4). However, the authors conduct a statistical analysis of the failure rates of some facilities in parallel with purely methodological studies, as evidenced by some publications [33].
Increasing the accuracy of reliability assessments, in particular, determining the probabilities of simulated states, is achieved mainly in two directions. On the one hand, this is due to obtaining reliable initial data on the reliability parameters of components (failure and restoration rates) as stated above. On the other hand, the modeling results can be improved at the methodological level due to the formalized consideration of a number of factors, such as accounting the non-ordinariness and the dependence between failures of components (if any). Both are the subject of this study.

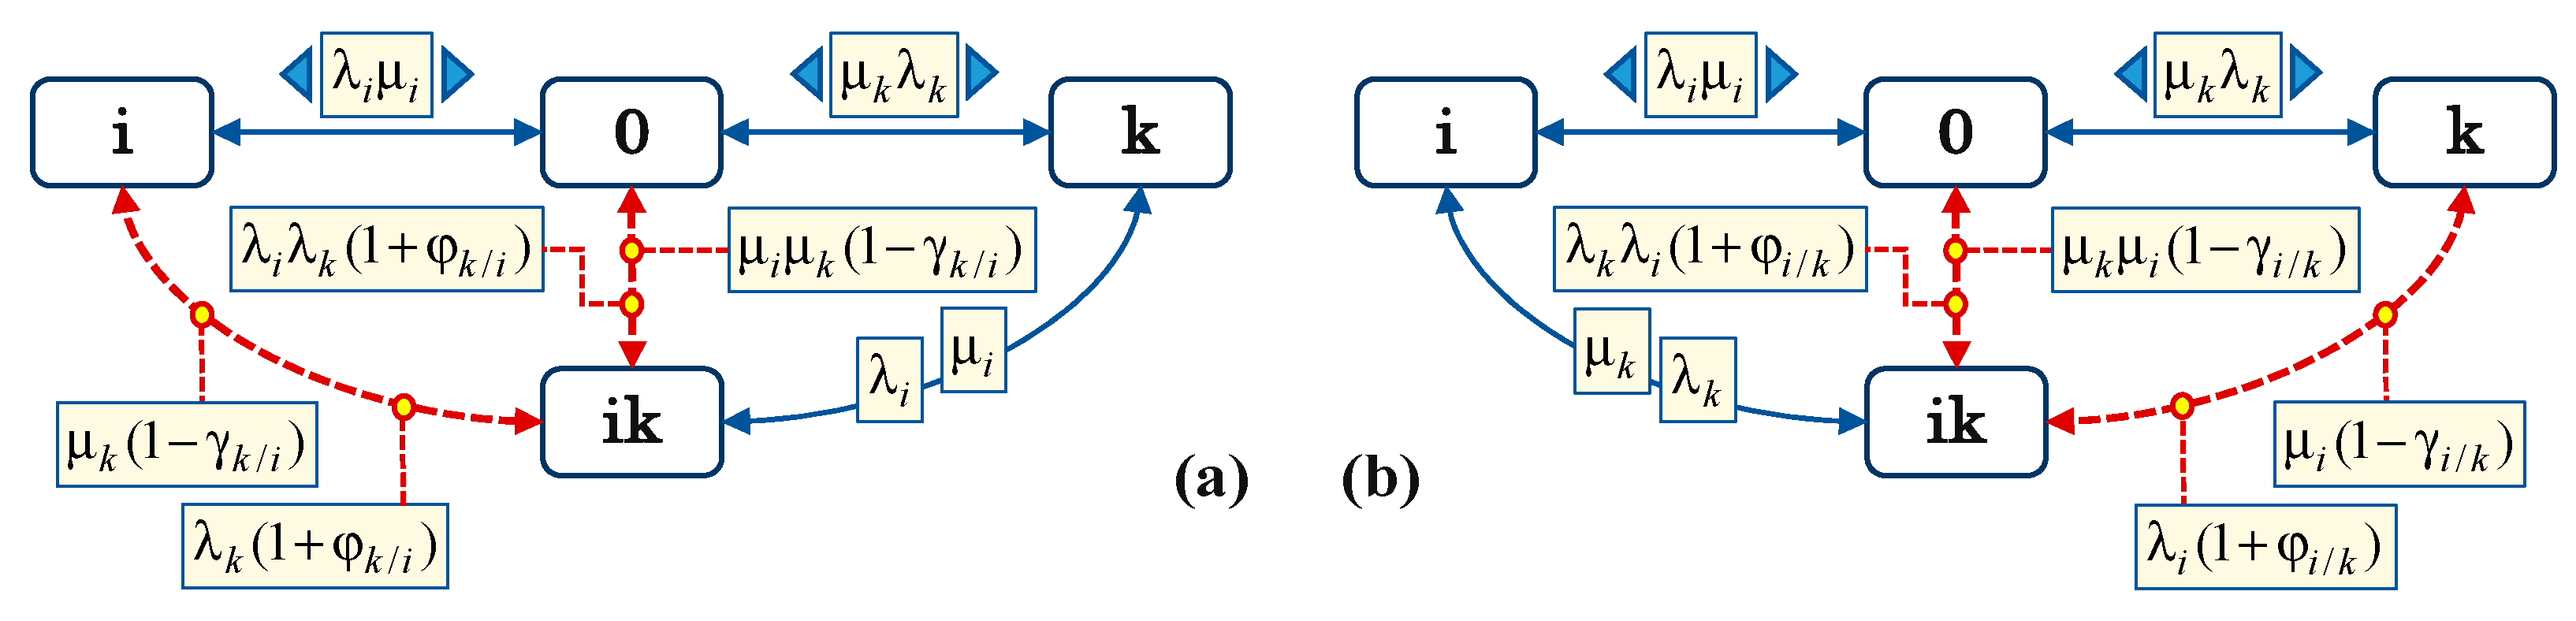
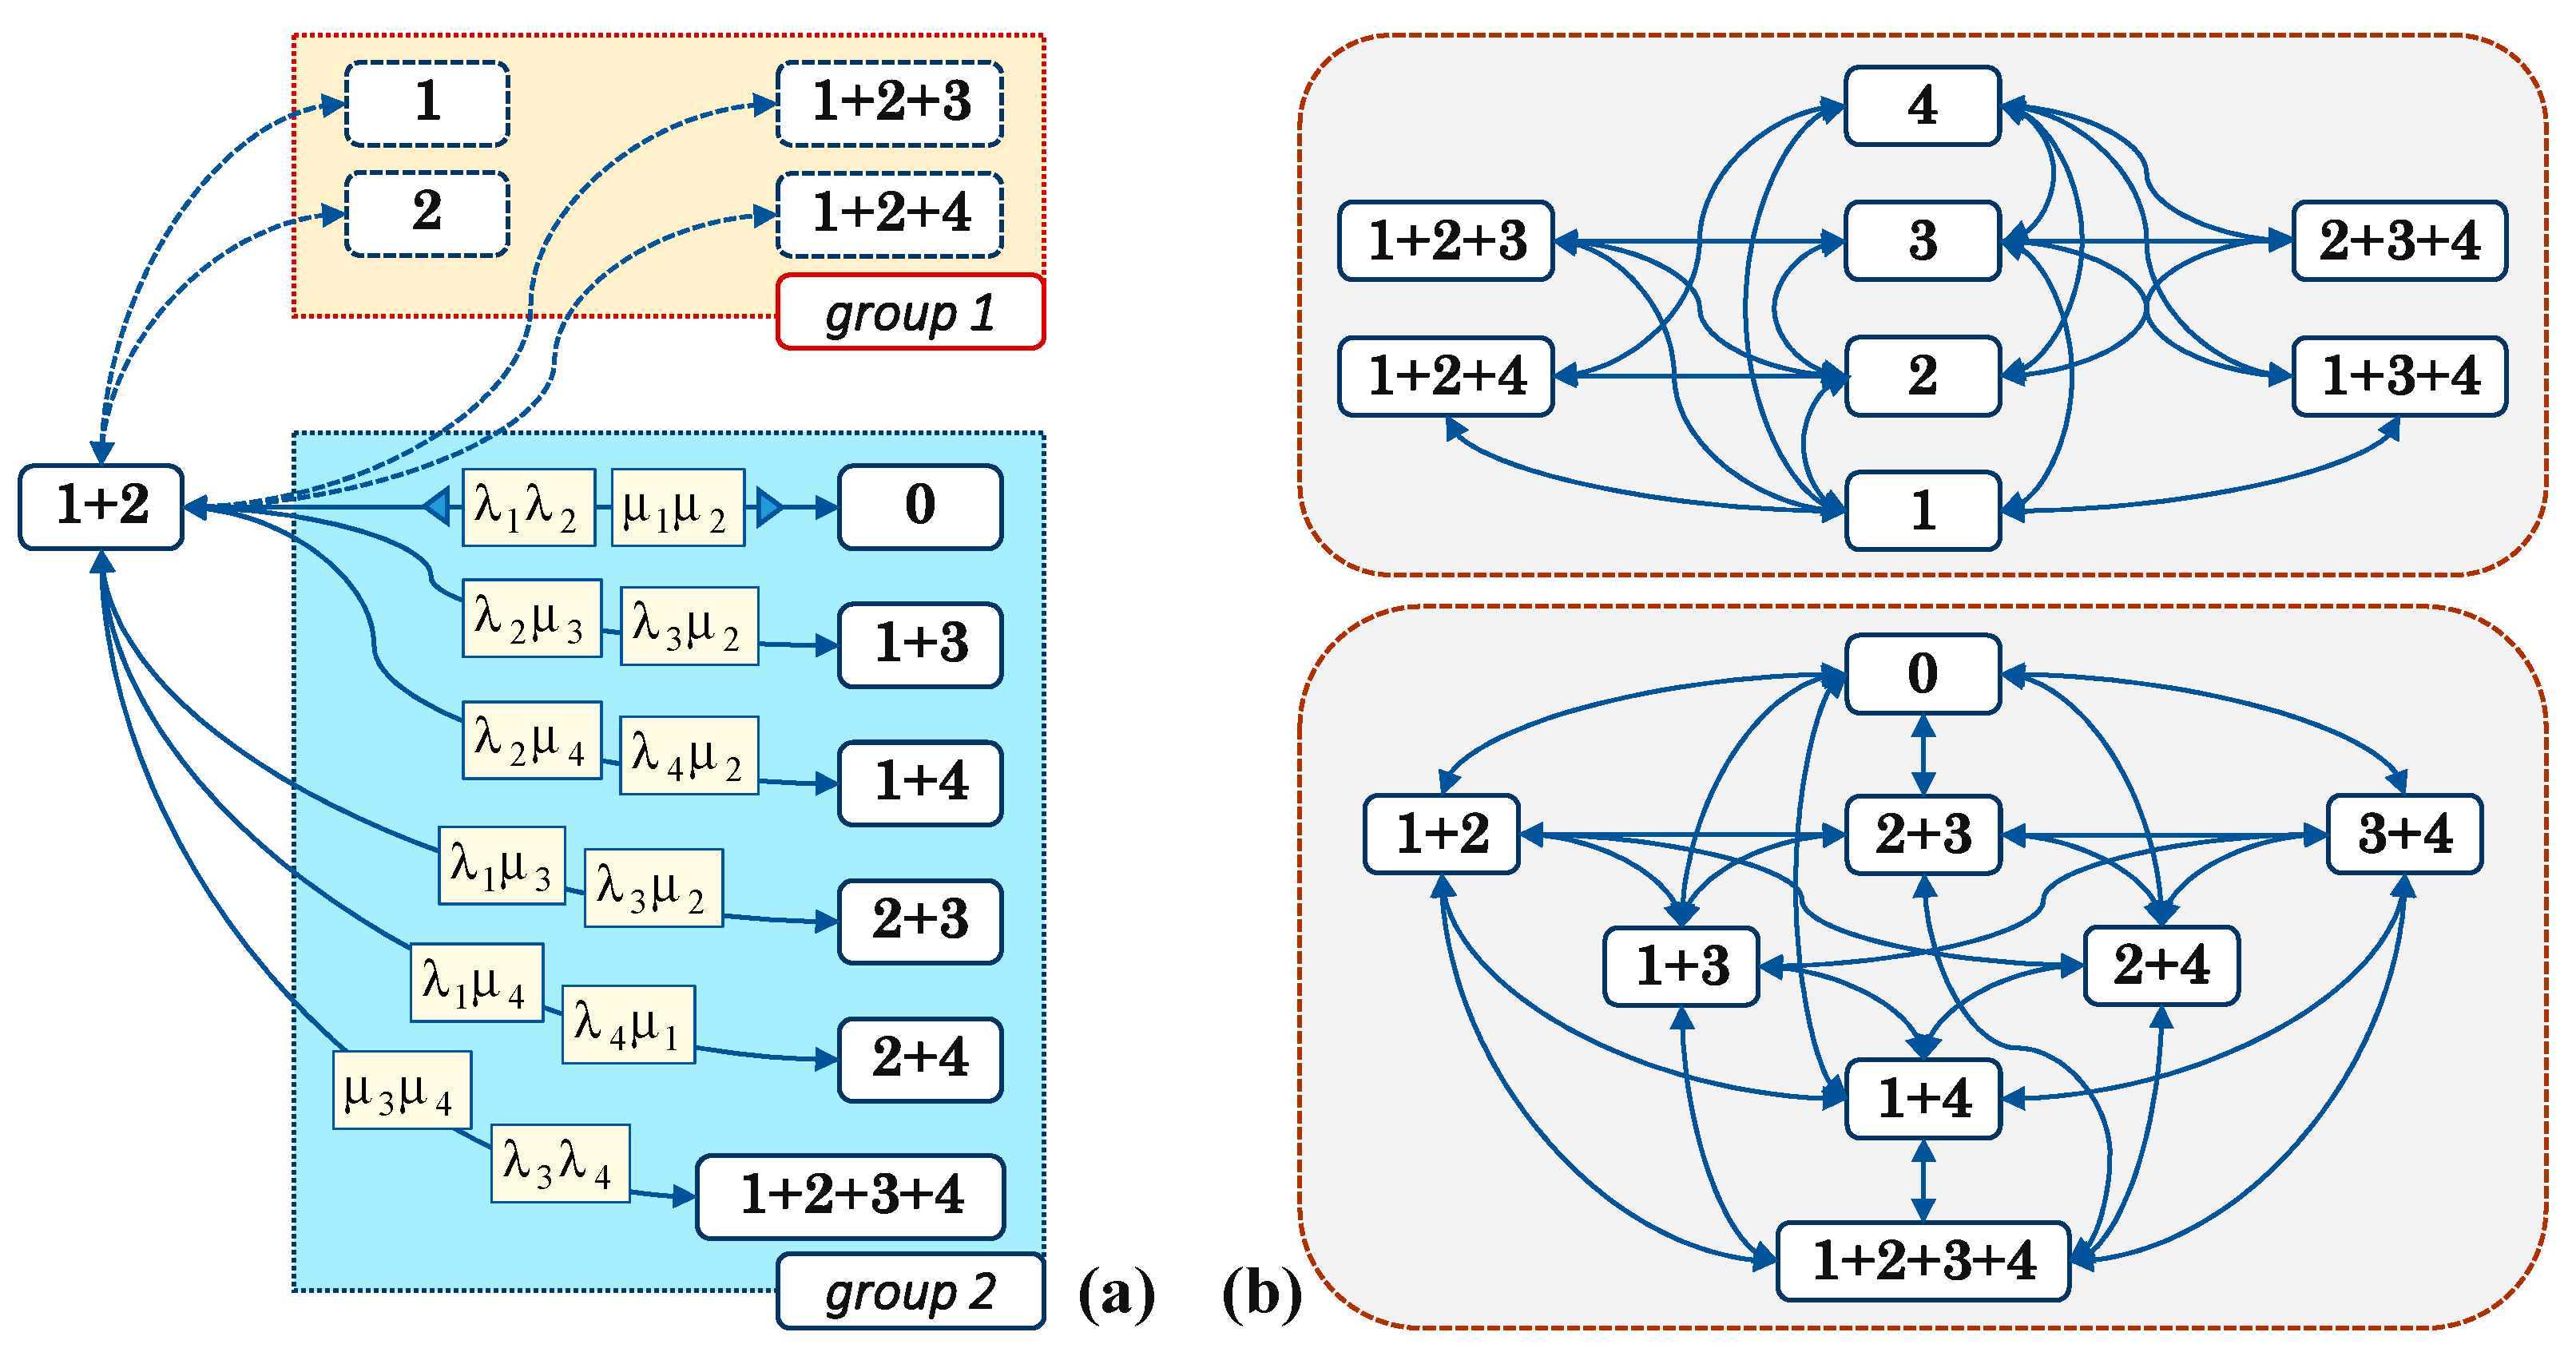
2.2. Modeling the Evolution of States Given Non-Ordinary Events

Operation of such complex facilities as CHPPs is related to many different technological processes that occur in parallel, and simultaneous failures of several components are quite possible. To take this factor into account, we apply the basic laws of probability theory. So, when events are mutually independent, the probability of their combination is the product of their probabilities [32].
Accordingly, the rate of non-ordinary transitions between states, interpreted in this case as a transition probability, is determined by the product of failure and/or restoration rates of components:
ν s w = i I w λ i i I s μ i , s E , w E 1 ,
where ν s w is the rate of the non-ordinary transition from state s to state w ; E 1 and w are a set of states into which the object can transition from state s due to several events that occur simultaneously; I w is a set of components that are in a state of failure in the event of state w ; I s is a set of components that are in a state of failure in the case of state s .
Depending on the number of simultaneous events taken into account, several levels of non-ordinary events can be considered. Set E 1 , describing a set of rates ν s w for all states s , is formed individually for each such level. Given these conditions, the model of the random process of facilities’ operation is represented by the following expression:
p s z E 1 ν s z + u U w E 1 * ν s w u = z E 2 p z ν z s + u U w E 2 * p w ν w s u ,   s E ,
where ν s w u and ν w s u are the rates of non-ordinary transitions from state s to state w and vice versa for the u -th level of non-ordinariness of events; U is the number of considered levels; p w and E 2 are the probability and a set of states from which facilities can transition to state s due to several simultaneous events. In fact, it is practically inexpedient to consider more than two simultaneous events, which will be shown below based on the results of numerical study.
The principle of formation graph of non-ordinary transitions is shown in Figure 2a for the state “1 + 2” where arcs indicate the rates of “double” transitions connecting this state with others. Figure 2b presents a graph showing the structure of non-ordinary (in this example, “double”) events for the considered facilities consisting of four subsystems (see Figure 1). Each arc corresponds to either two failures, or two restorations, or simultaneously one failure and one restoration. It should also be noted here that increasing the rank of non-ordinary failures (the number of simultaneous failures) can lead to a significant complication of the model and the calculations themselves, especially when studying diagrams of real-life facilities with a large number of components. Considering the decrease in the probability of failures as the rank of non-ordinariness increases, it is necessary to find a balance between increasing accuracy and complicating the model.

2.3. Modeling the Evolution of States Given the Dependent Events

Technological processes occurring during the operation of CHPPs are often accompanied by dependent equipment failures. Modeling of such failures can be carried out by introducing conditional probabilities into the random process describing the operation of the studied facilities. For example, consider component i with failure rate λ i . Let us assume that in the event of its failure, the conditional failure probability of component k equals ϕ k / i . Dependent failure of component k for the failed component i will have rate λ k / i determined by the conditional probability ϕ k / i [32]:
λ k / i = λ k ( 1 + ϕ k / i ) g i v e n 0 ϕ k / i < 1 , λ k / i = λ i g i v e n ϕ k / m = 1 .
The joint use of the model for non-ordinary events (3) with expressions for determining rates of dependent events (4) allows representing the model of a random process of the facilities’ operation in terms of both these factors:
p s z E 1 ν s z ( 1 ± ϕ z / s ) + u U w E 1 ν s w u ( 1 ± ϕ w / s ) = z E 2 p z ν z s ( 1 ± ϕ s / z ) + + u U w E 2 p w ν w s u ( 1 ± ϕ s / w ) , s E
subject to:
0 ϕ z / s < 1 , ν s z > ν s z / s ; 0 ϕ w / s < 1 , ν s w u > ν s w u / s ; 0 ϕ s / z < 1 , ν z s > ν z s / z ; 0 ϕ s / w < 1 ,   ν w s u > ν w s u / w ;
where ϕ z / s and ϕ s / z are the conditional probabilities of ordinary transitions of the complex from states z to s and vice versa, respectively; ϕ w / s and ϕ s / w are the conditional probabilities of non-ordinary transitions from states w to s and vice versa, respectively; ν s z / s and ν z s / z are the rates of dependent transitions from state s to state z and vice versa, respectively; ν s w u / s , ν w s u / w are similar indices for non-ordinary transitions. Each magnitude ϕ z / s corresponds to either failure, then ϕ z / s = ϕ k / i , or restoration, then ϕ z / s = γ k / i ( k , i are some components).
Figure 3 shows the part of the state graph that reflects the principle of building the structure of events in the presence of dependent failures and restorations for the previously considered components and Equation (4) and notation as an example. Figure 3a shows an example of a graph of the relationship between some states i and k, provided that the failure of component k occurs with some probability ϕ k / i after the failure of component i. Figure 3b shows a graph with an inverse relationship.
As in the case of non-ordinary events (Section 2.2), the modeling of dependent failures should be justified from the point of view of the significance of this factor for the specific studied facilities.
It should be noted that probabilities of joint failures could be assessed by the Bayes theorem [32]. In this case, not only should the conditional probability of failure of dependent component be established but also the inverse conditional probability of failure of influencing components. However, in practice the search for the inverse conditional probability of events is often a very difficult problem due to the lack of sufficient data on the equipment failure rate in studied systems.

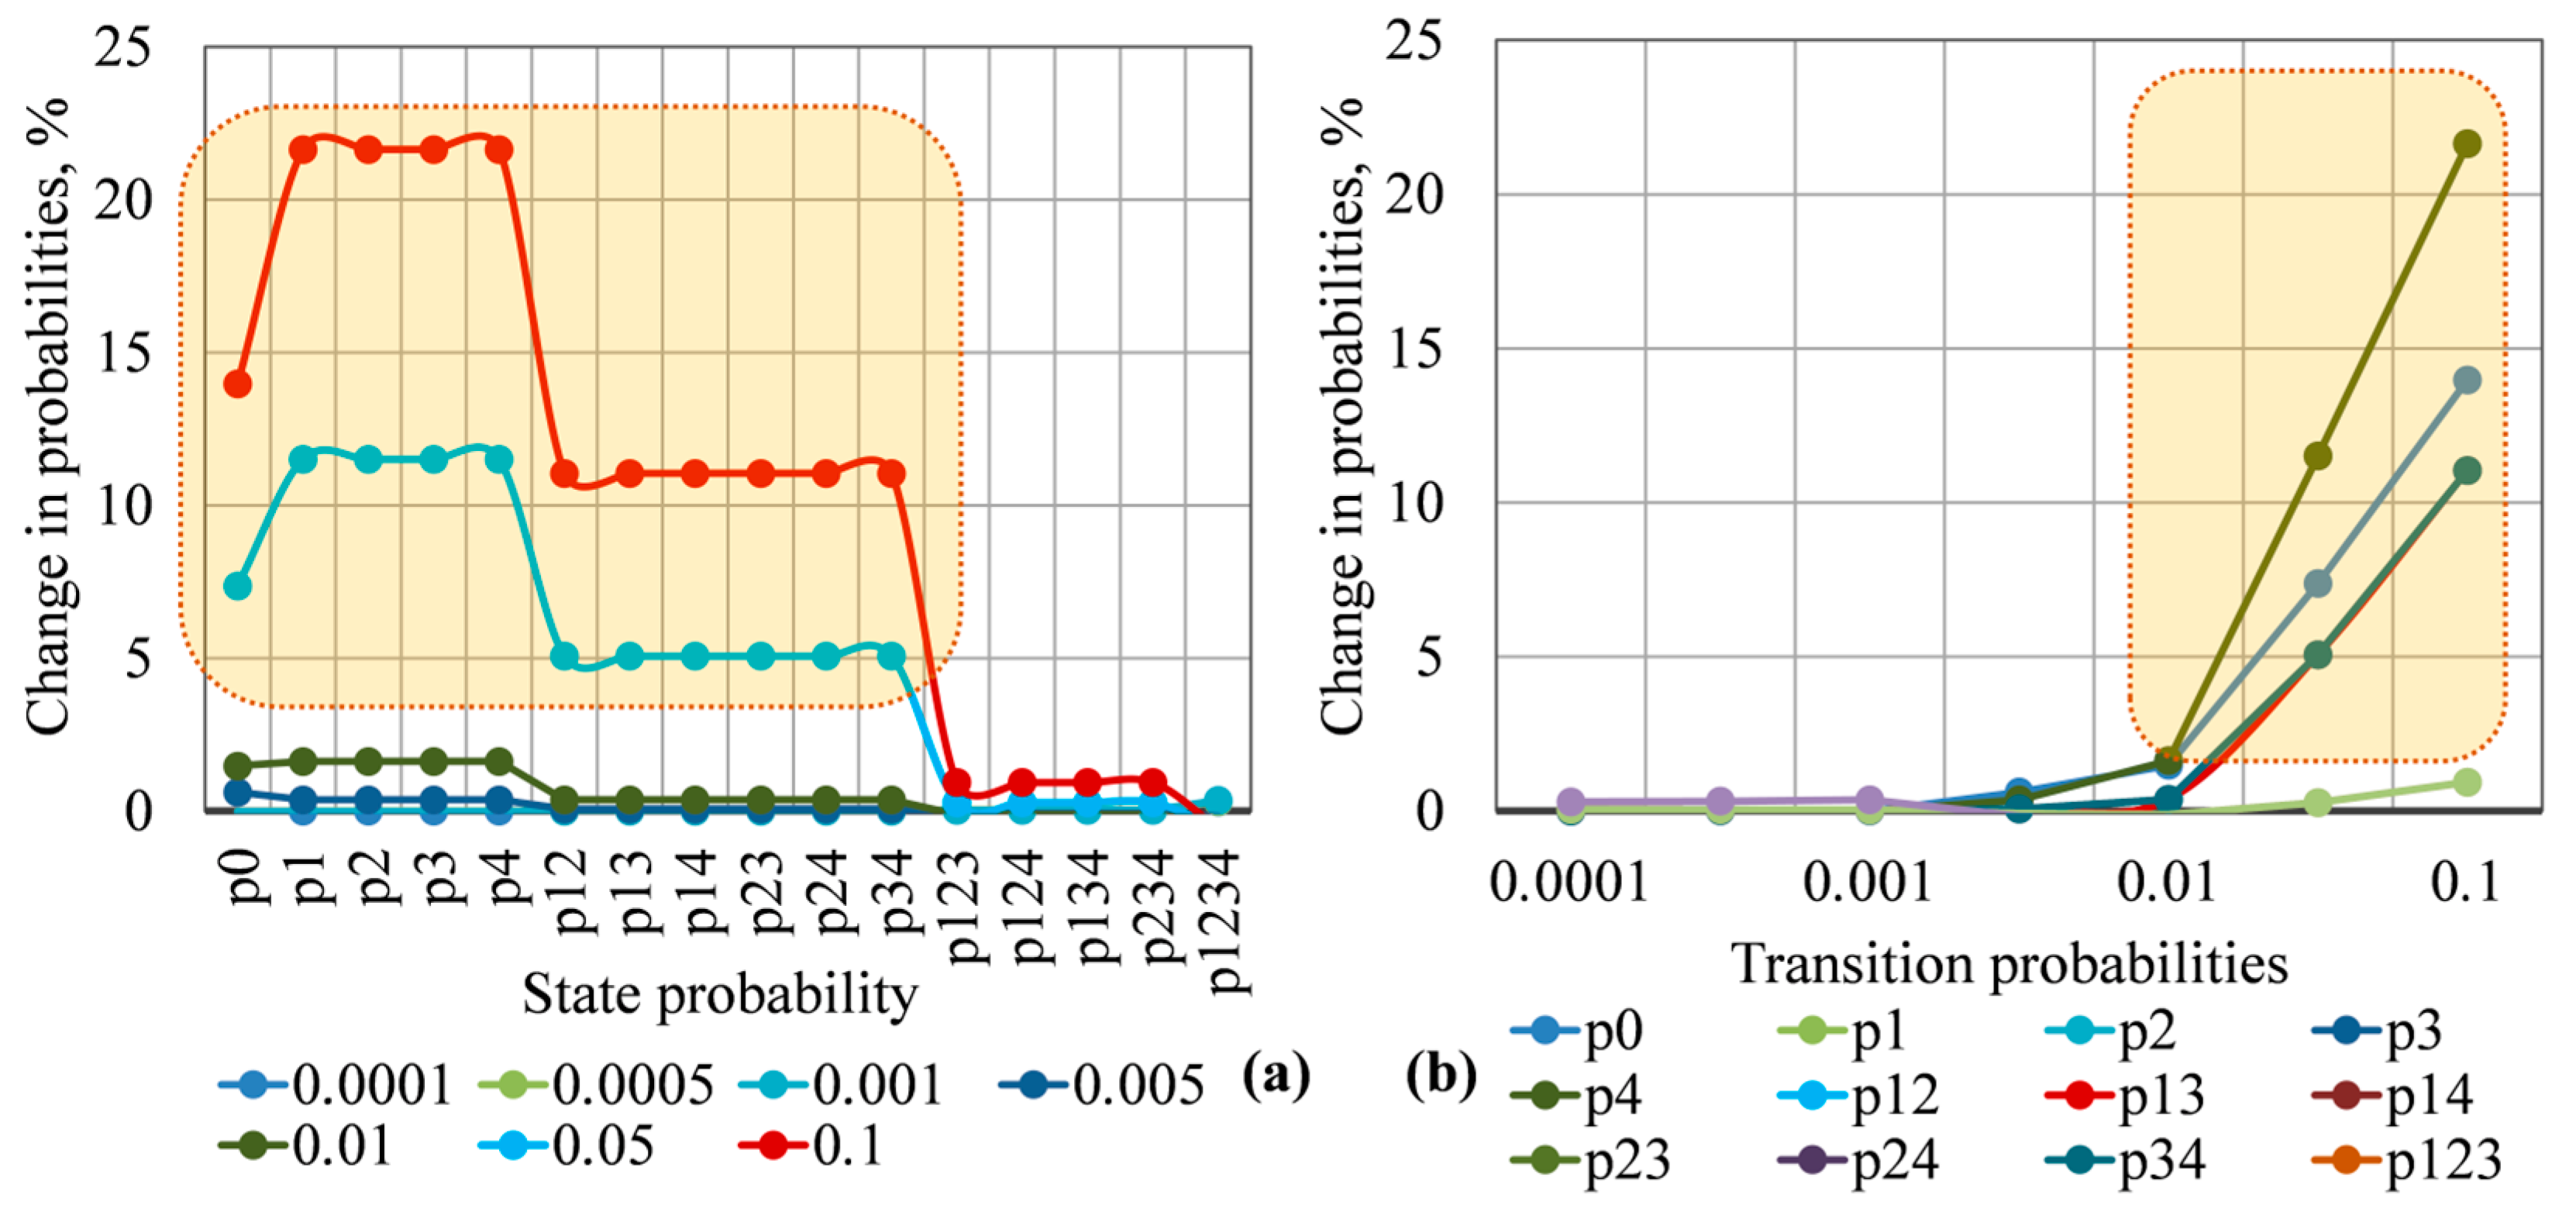
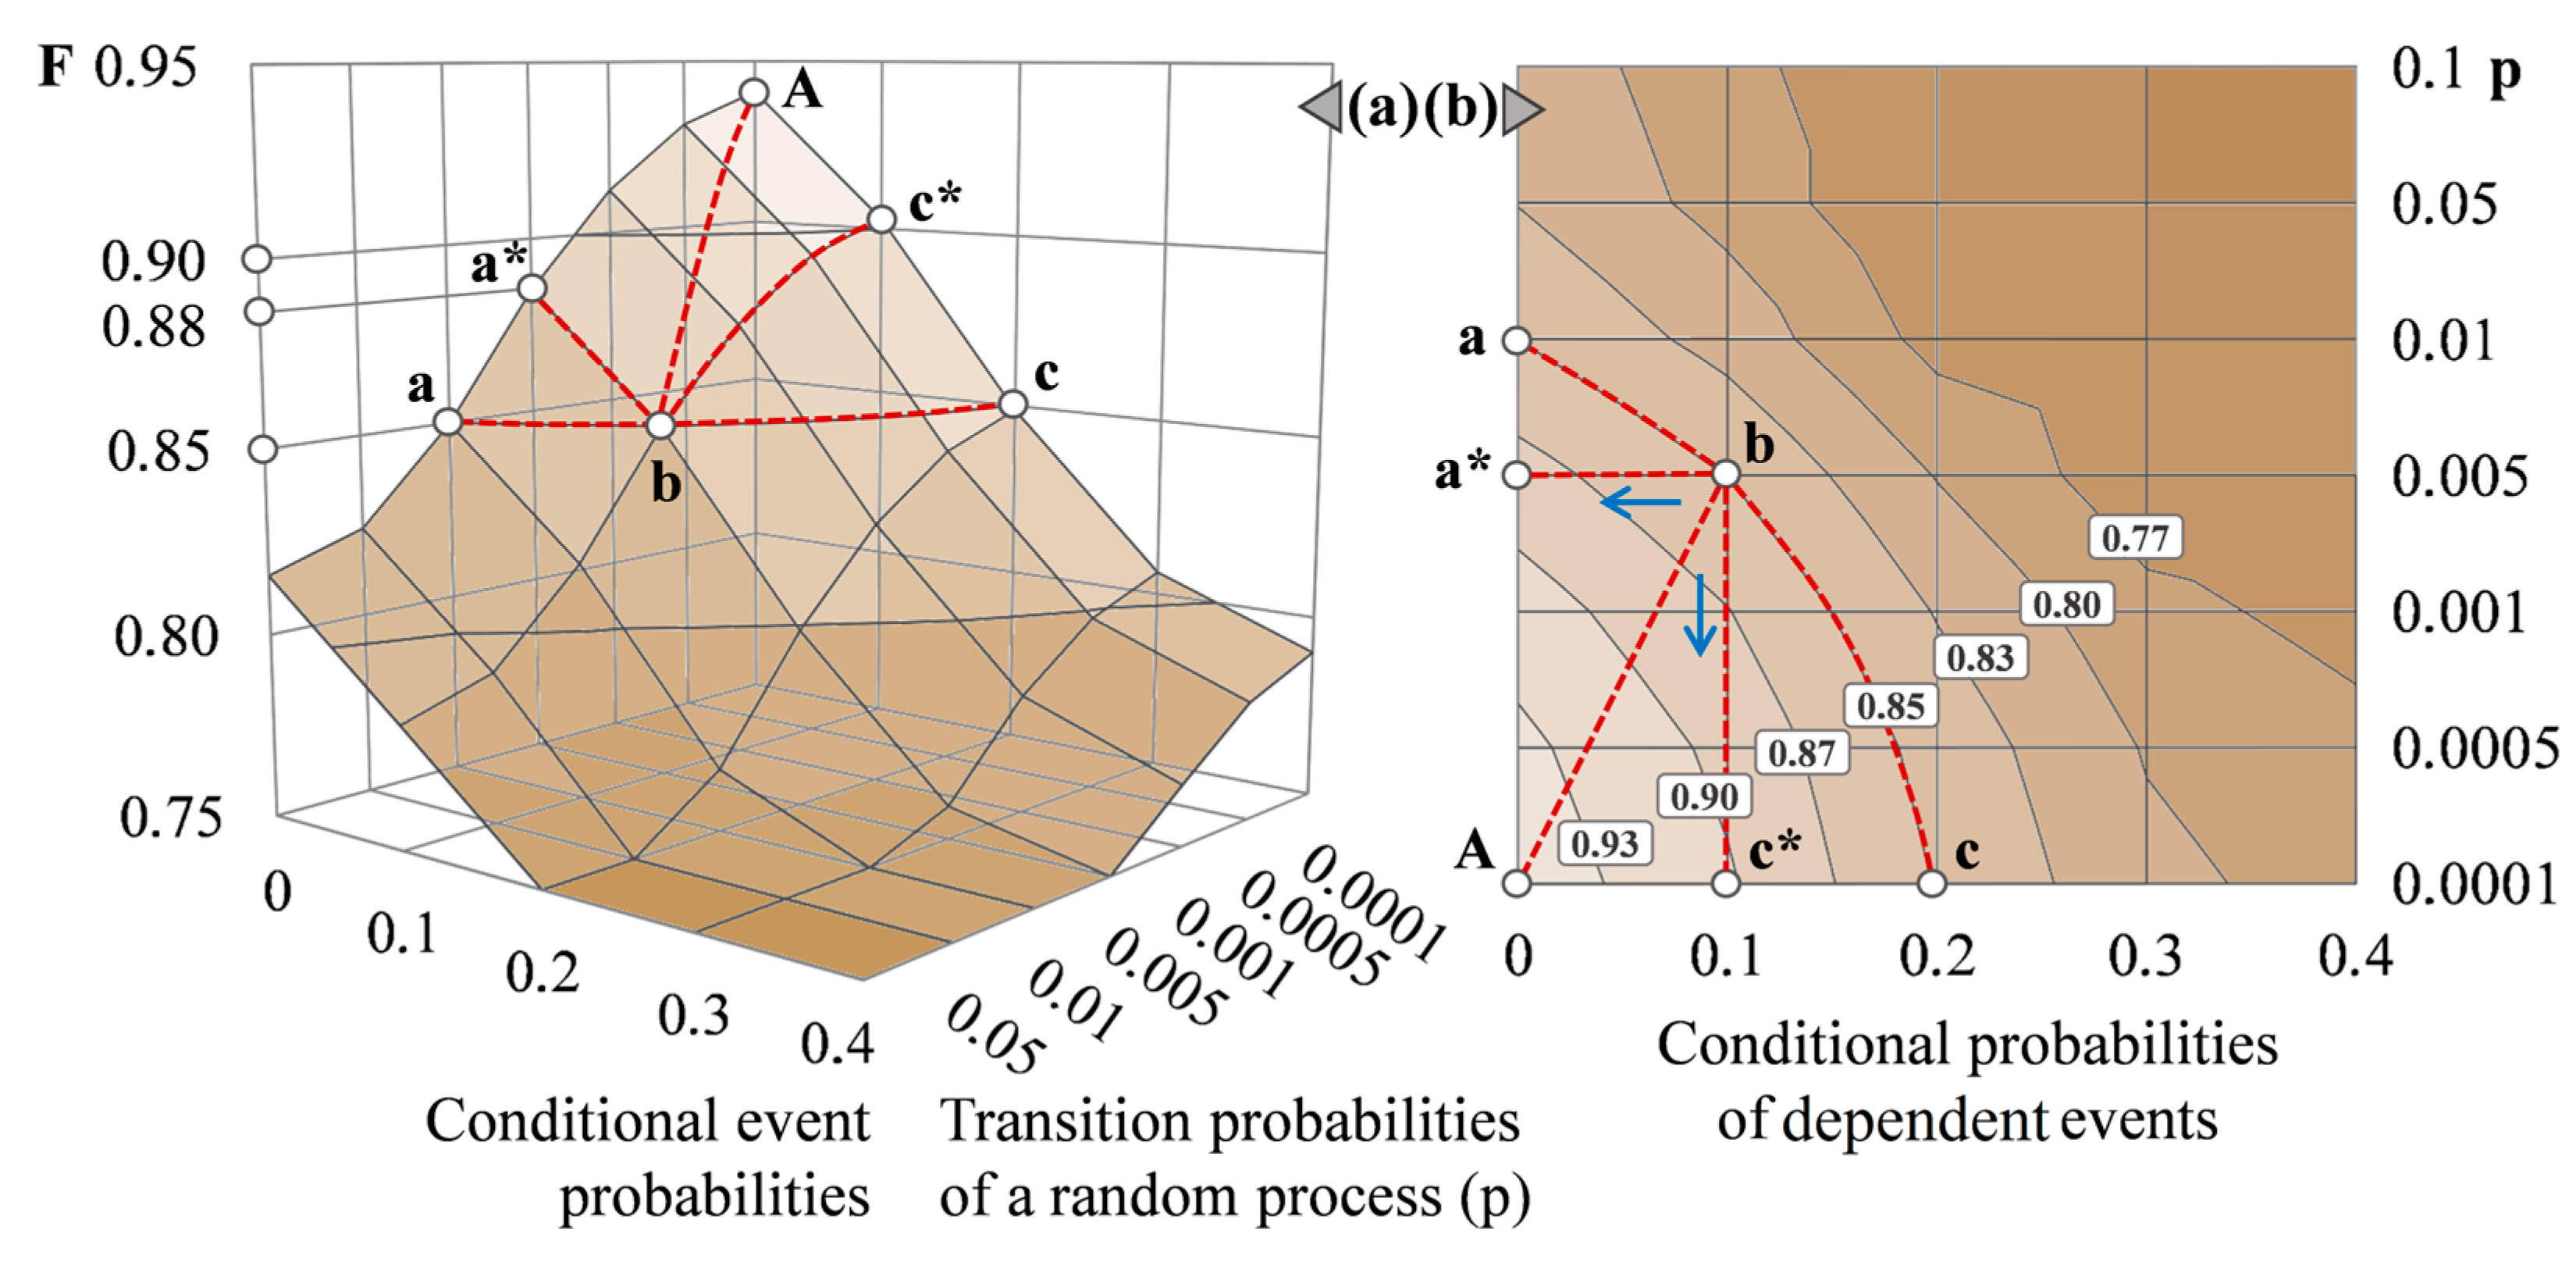
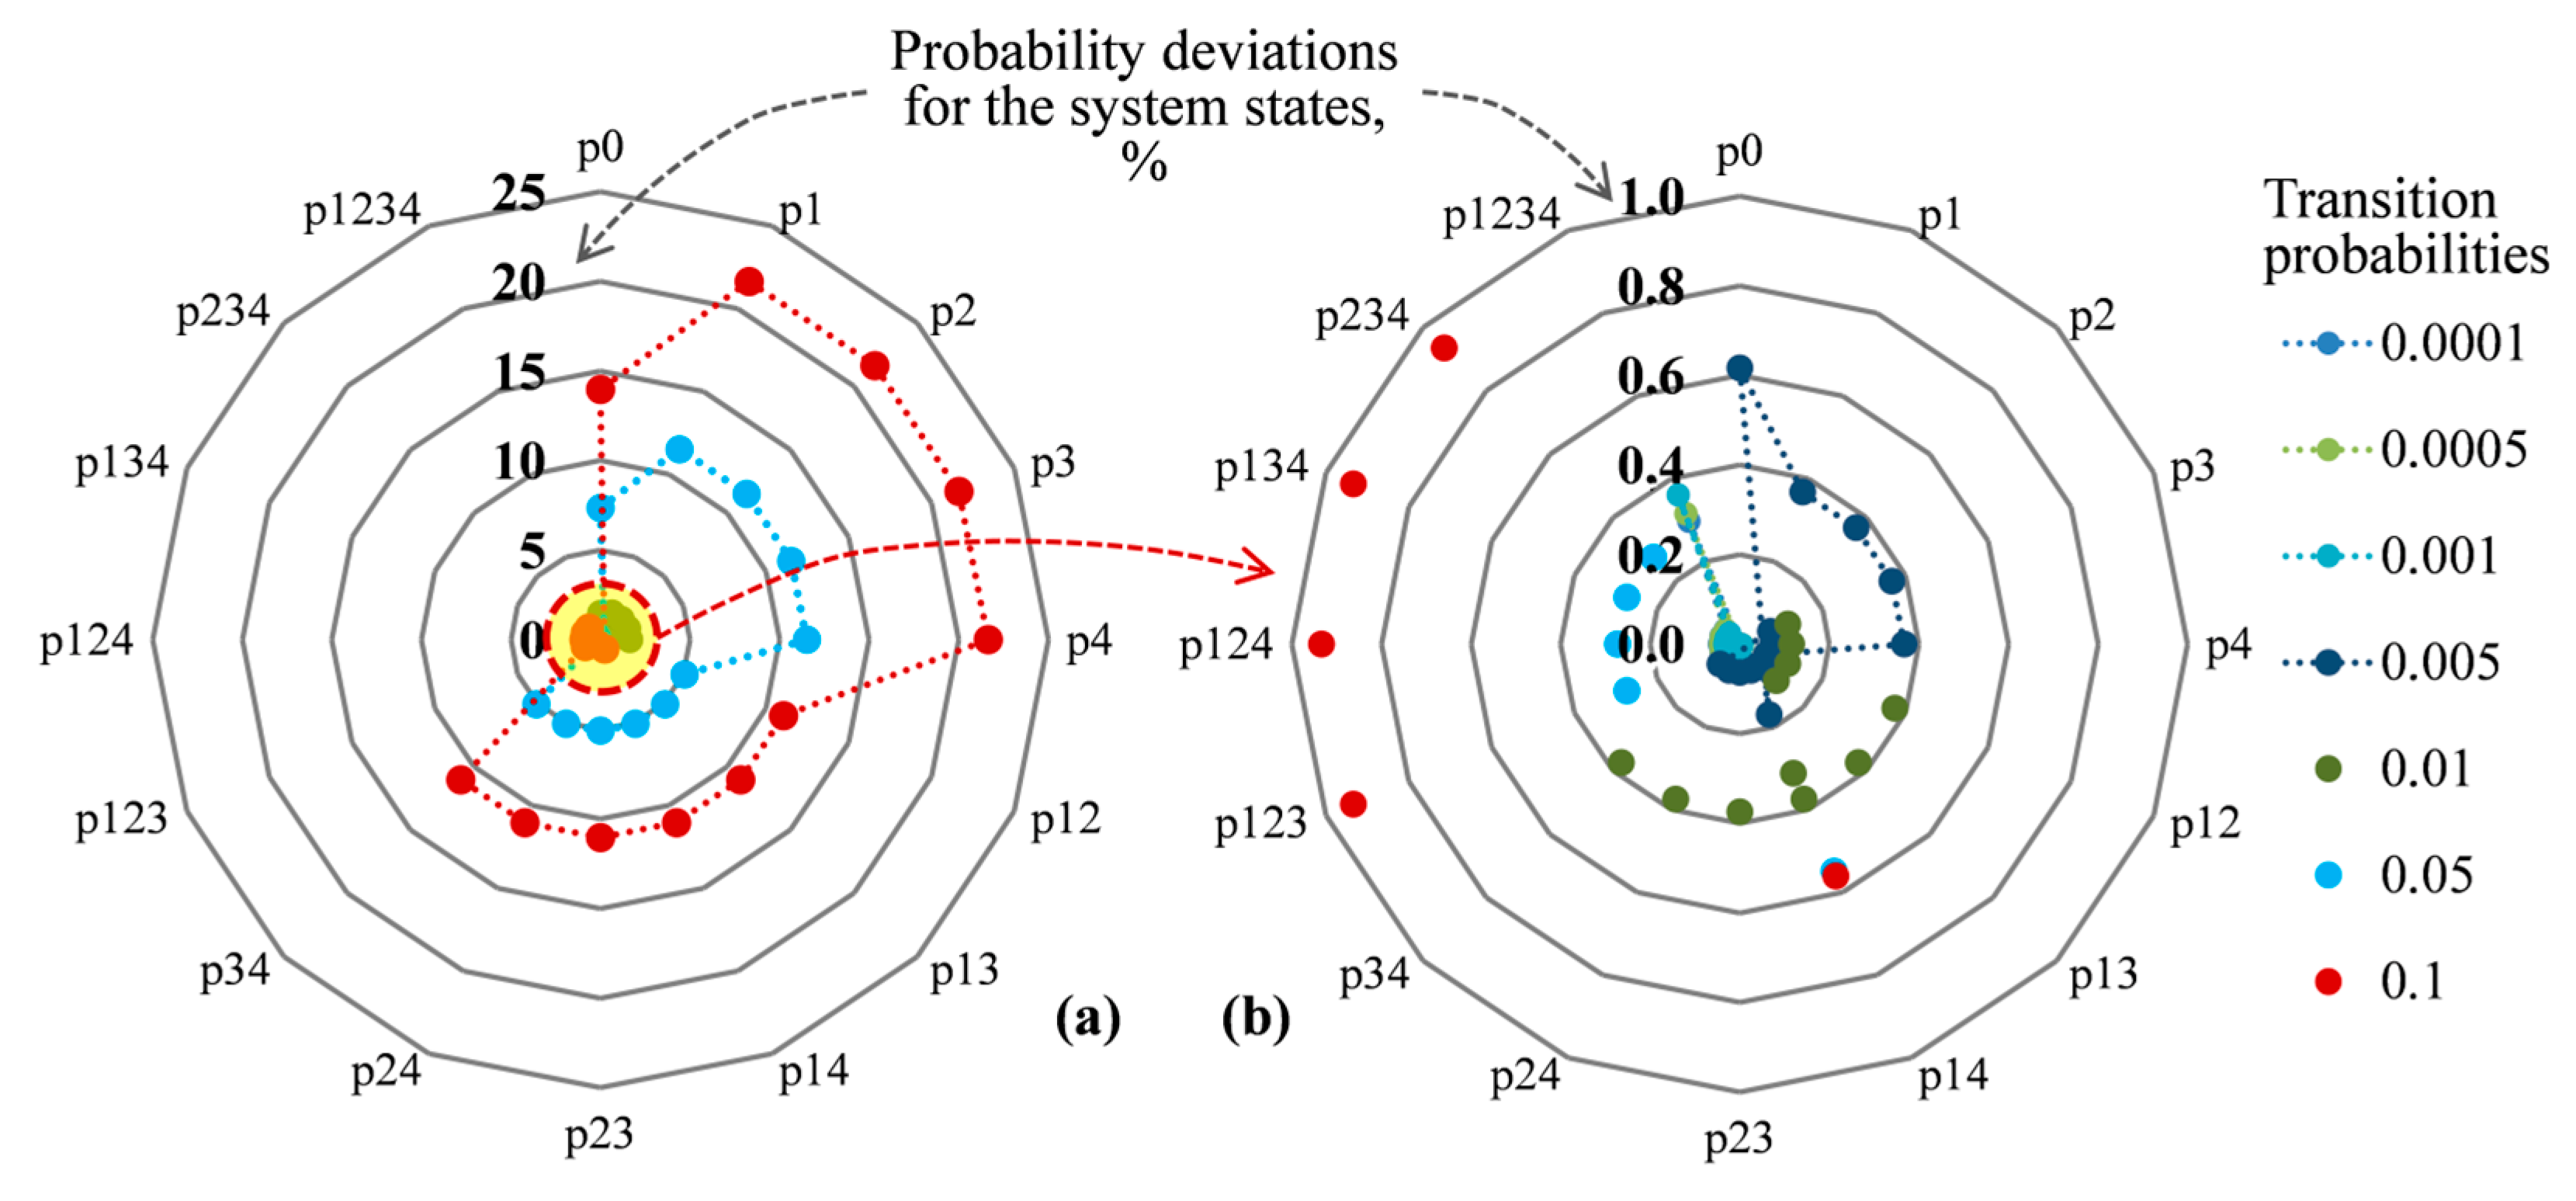
3. Results of Computational Experiments

This section presents a series of computational experiments that rely on probabilistic models to simulate the random operational processes of a test aggregate diagram for a combined heat and power plant (CHPP). The obtained characteristics allow for the identification of certain modeling conditions that consider the influence of non-ordinary and dependent events on the results of reliability analysis.
Figure 4 showcases diagrams illustrating the ratio between probability values for states within the studied diagram, calculated under ordinary event flows versus non-ordinary event flows (specifically focusing on “double” component failures in the given example). The calculation was carried out in the range of 0.0001 to 0.1 for the change in transition probabilities of the random process (transition probabilities are interpreted as failure rates of components). Figure 4a indicates that the largest deviations of the probability values from the initial ones (from 10 to 22%) correspond to a fully operational state (p0) and states with one and two failures (groups p1–p4 and p12–p34, respectively) at the maximum levels of transition probability of the given range, i.e., 0.1 and 0.05.
For the remaining states, which correspond to the simultaneous failure of a larger number of components, the probability deviations are much smaller, which is logical: the lower the probability of the state is, the less likely the events that correspond to the transition to this state are. Figure 4b shows part of the diagram with an enlarged scale, which shows that the probability deviations for the states with simultaneous failures of three and four components (p123–p1234) do not exceed 1%.
The distribution of probability changes for different groups of states is depicted in Figure 5a, with each curve representing a specific transition probability value. Figure 5b illustrates the relationship between the change in state probabilities and the transition probability values of the random process. These diagrams highlight the ranges of transition probability values that can significantly impact reliability assessment when considering non-ordinary events in state modeling. The selected areas correspond to the range of values of transition probabilities of 0.01–0.1 (Figure 5b). The failure rate of components for real-life HSs, as well as other energy systems, is normally much lower than these values (see [7,33]), therefore, there is no need to model non-ordinary events for most of the practical calculations. At the same time, the influence of non-ordinary events can increase with the complication of the structure of studied facilities during their implementation in the integrated district-distributed heating systems with a large number of HSs including prosumers. In this case, the probabilities of simultaneous failures of components belonging to different subsystems rise significantly, and modeling of such events in the analysis of system reliability becomes relevant even if the components are highly reliable.
The generalized results of numerical modeling with dependent events (failures) considered are shown in Figure 6. The diagram presented in Figure 6a represents the dependence of the reliability function (F) for the studied facilities on the values of conditional probabilities of transitions between dependent events for different values of transition probabilities of a random process describing the evolution of states (the example at issue used failure rates of components as transition probabilities). This diagram reflects the degree of a possible decrease in the reliability (function F) from a certain calculated initial level (point A) under the influence of the dependence factor between failures of components. On this basis, one can single out a range of F values, which is limited by some minimum allowable level, for example, F = 0.85 (line a–b–c in Figure 6a). The figure cut off by this curve projected onto the horizontal plane of the diagram contains the ratios of the initial values of the parameters under which the specified reliability requirements are met. The corresponding projection of the diagram shown in Figure 6b is the gradient of parameter F. This diagram can be used to determine the initial parameters necessary to ensure a particular level of reliability. For example, point c* lies within the acceptable range of reliability (F is no less than 0.85) with the values of the conditional probability of dependent events equal to 0.1 and the transition probability of the random process of operation (p) equal to 0.0001. Obviously, with an increase in p, which in this case is interpreted as an increase in the probability of component failures, function F (point b) also decreases. An increase in the conditional probability of dependent events (failures) also leads to a decline in the level of reliability (point c).
The use of characteristics similar to the one considered above for operating HSs (including CHPPs) involves: (1) determining a feasible range of values of conditional probabilities for dependent events within which variation in the reliability assessment results is negligible, i.e., neglecting dependent events; (2) evaluating the necessary reserves, which provides compensation for possible emergency conditions in case of dependent failures, including those taking into account forced downtime of components, in a wide range of initial conditions for modeling and calculation. The values of the initial modeling parameters should be determined relying on a statistical analysis of the failure rate of facilities.

4. Discussion and Conclusions

When solving reliability problems for any energy systems, the probabilities of their states in various operating conditions can be determined relying on various approaches, methods, and models. One of the effective and proven methodological approaches in theory and practice is based on the use of models of random processes, in particular, Markov ones. In most applications, these models are described by the simplest events flow, which is characterized by the ordinariness and independence of events (but not only these). However, these conditions may change during the operation of real-world systems. Therefore, the accuracy of reliability models of many energy facilities and systems can be increased by modeling non-ordinary and dependent events. The paper proposes an approach to the construction of probabilistic models of HSs (for example, CHPPs) with the simultaneous implementation of several events based on the use of the rule of their combination in the event of their mutual independence. The relationship of transitions between some events is taken into account by introducing conditional probabilities for the occurrence of one event at the occurrence of another.
According to the results of numerical modeling, we can preliminarily conclude that consideration of non-ordinary events slightly changes (redistributes) the values of probabilities of the object states, since it follows from the condition of multiplying the probabilities that the greater the number of simultaneous failures in an event, the less likely it is. As test calculations have shown, changes in the state probabilities when taking into account non-ordinary events increase with an increase in the failure rates of the system components and reach significant values (more than 5%) at failure rates of more than 0.01 1/h. The failure rate of components for real-life systems is as a rule much lower than this order; therefore, most calculations can ignore the non-ordinary events.
At the same time, unlikely situations, accompanied by numerous simultaneously occurring failures, lead to complete long-term thermal energy undersupply for the consumer. Given the correlation between the practical possibility of the occurrence and the consequences, their influence on the reliability of heat supply can be significant. A local assessment of such events is necessary both for the development of preventive measures (creation of a reserves) and for optimal planning of restoration work. In addition, the influence of such events can increase with the complexity of the object, for example, implementation of HSs in integrated district-distributed heating systems with a large number of sources and prosumers. In this case, the probabilities of simultaneous failures of components belonging to different subsystems increase significantly.
Following the results of probabilistic modeling of dependent events, we obtained characteristics to quantify the degree of a possible (expected) decrease in the reliability of HSs (CHPPs) under the influence of the dependence between events whose probability cannot be accurately determined (including external disturbances). Similar characteristics obtained for real-life CHPPs enable preliminary estimation of the necessary reserve to compensate for possible emergencies in the event of dependent failures (including forced downtime of components) in a given range of initial modeling conditions. Modeling the dependent failures can be useful when assessing the resilience (flexibility) of the object.
Thus, the use of models with non-ordinary and/or dependent events should be justified from the perspective of the influence of these factors on the compliance of the result of the reliability assessment with the conditions of the operation of the real-life facilities. It is important to note that a high degree of uncertainty of the factors of non-ordinariness and dependence of events that are poorly amenable to stochastic analysis can lead to a significant error in the reliability assessment. It is advisable to address some rare but significant events in terms of the consequences separately from the main stochastic model of facilities and compensate for their influence at the stage of ensuring the survivability, which is the subject of special and further studies.

Author Contributions

Conceptualization, I.P. and E.S.; methodology, I.P.; validation, A.P. and V.K.; formal analysis, I.P. and D.S.; data curation, I.P. and A.P.; writing—original draft preparation, I.P.; writing—review and editing, D.S.; visualization, I.P.; supervision, E.S.; funding acquisition, E.S. and V.K. All authors have read and agreed to the published version of the manuscript.

Funding

Ministry of Science and Higher Education of the Russian Federation within the framework of the program “Priority 2030”, project “Development of a cyber-physical system to control the reliability of energy equipment operation”.

Data Availability Statement

Not applicable.

Acknowledgments

The research was carried out with the financial support of the Ministry of Science and Higher Education of the Russian Federation within the framework of the program “Priority 2030”, project “Development of a cyber-physical system to control the reliability of energy equipment operation”.

Conflicts of Interest

The authors declare no conflict of interest.

Copyright

Figure 1, Figure 2, Figure 3 and Figure 6 are reprinted from “Hierarchical Modeling of Energy Systems. Chapter 6. Hierarchical modeling of analysis and control of operating conditions of pipeline energy systems”, V.A. Stennikov, N.N. Novitsky, A.V. Alexeev, et al., Pages No. 379–448, Copyright 2023, with permission from Elsevier (License Number 5636800375267, License date 26 September 2023).

References

  1. Hao, Z.; Di Maio, F.; Zio, E. A sequential decision problem formulation and deep reinforcement learning solution of the optimization of O&M of cyber-physical energy systems (CPESs) for reliable and safe power production and supply. Reliab. Eng. Syst. Saf. 2023, 235, 109231. [Google Scholar]
  2. Konstantopoulos, G.; Alexandridis, A.; Papageorgiou, P. Towards the Integration of Modern Power Systems into a Cyber–Physical Framework. Energies 2020, 13, 2169. [Google Scholar] [CrossRef]
  3. Haack, J.; Narayan, A.; Patil, A.D.; Klaes, M.; Braun, M.; Lehnhoff, S.; de Meer, H.; Rehtanz, C. A Hybrid Model for Analysing Disturbance Propagation in Cyber–Physical Energy Systems. Electr. Power Syst. Res. 2022, 212, 108356. [Google Scholar] [CrossRef]
  4. Ribas Monteiro, L.F.; Rodrigues, Y.; Zambroni de Souza, A. Cybersecurity in Cyber–Physical Power Systems. Energies 2023, 16, 4556. [Google Scholar] [CrossRef]
  5. Merenkov, A.; Khasilev, V. Theory of Hydraulic Circuits; Nauka: Moscow, Russia, 1985. (In Russian) [Google Scholar]
  6. Kim, I.; Kim, B.; Sidorov, D. Machine Learning for Energy Systems Optimization. Energies 2022, 15, 4116. [Google Scholar] [CrossRef]
  7. Sennova, E.; Smirnov, A.; Ionin, A. Reliability of Heat Supply Systems; Nauka: Novosibirsk, Russia, 2000. (In Russian) [Google Scholar]
  8. Wang, J.-J.; Fu, C.; Yang, K.; Zhang, X.-T.; Shi, G.-H.; Zhai, J. Reliability and availability analysis of redundant BCHP (building cooling, heating and power) system. Energy 2013, 61, 531–540. [Google Scholar] [CrossRef]
  9. Lisnianski, A.; Elmakias, D.; Hanoch, B. A multi-state Markov model for a short-term reliability analysis of a power generating unit. Reliab. Eng. Syst. Saf. 2012, 98, 1–6. [Google Scholar] [CrossRef]
  10. Haghifam, M.; Manbachi, M. Reliability and availability modelling of combined heat and power (CHP) systems. Int. J. Electr. Power Energy Syst. 2011, 33, 385–393. [Google Scholar] [CrossRef]
  11. Sabouhi, H.; Abbaspour, A.; Fotuhi-Firuzabad, M.; Dehghanian, P. Reliability modeling and availability analysis of combined cycle power plants. Int. J. Electr. Power Energy Syst. 2016, 79, 108–119. [Google Scholar] [CrossRef]
  12. Shua, L.; Chena, L.; Jina, J.; Yu, J.; Sun, F.; Wu, C. Functional reliability simulation for a power-station’s steam-turbine. Appl. Energy 2005, 80, 61–66. [Google Scholar] [CrossRef]
  13. Abud, T.; Augusto, A.; Fortes, M.; Maciel, R.S.; Borba, B.S.M.C. State of the Art Monte Carlo Method Applied to Power System Analysis with Distributed Generation. Energies 2023, 16, 394. [Google Scholar] [CrossRef]
  14. Sennova, E.; Sidler, V. Mathematical Modeling and Optimization of Developing Heat Supply Systems; Nauka: Novosibirsk, Russia, 1987. (In Russian) [Google Scholar]
  15. Lund, H.; Østergaard, P.; Chang, M.; Werner, S.; Svendsen, S.; Sorknæs, P.; Thorsen, J.E.; Hvelplund, F.; Mortensen, B.O.G.; Mathiesen, B.V.; et al. The status of 4th generation district heating: Research and results. Energy 2018, 164, 147–159. [Google Scholar] [CrossRef]
  16. Revesz, A.; Jones, P.; Dunham, C.; Davies, G.; Marques, C.; Matabuena, R.; Scott, J.; Maidment, G. Developing novel 5th generation district energy networks. Energy 2020, 201, 117389. [Google Scholar] [CrossRef]
  17. Kallert, A.; Egelkamp, R.; Bader, U.; Münnich, D.; Staudacher, L.; Doderer, H. A multivalent supply concept: 4th Generation District Heating in Moosburg an der Isar. Energy Rep. 2021, 7, 110–118. [Google Scholar] [CrossRef]
  18. Buffa, S.; Soppelsa, A.; Pipiciello, M.; Henze, G.; Fedrizzi, R. Fifth-Generation District Heating and Cooling Substations: Demand Response with Artificial Neural Network-Based Model Predictive Control. Energies 2020, 13, 4339. [Google Scholar] [CrossRef]
  19. Huber, D.; Illyés, V.; Turewicz, V.; Götzl, G.; Hammer, A.; Ponweiser, K. Novel District Heating Systems: Methods and Simulation Results. Energies 2021, 14, 4450. [Google Scholar] [CrossRef]
  20. Brange, L.; Englund, J.; Lauenburg, P. Prosumers in district heating networks—A Swedish case study. Appl. Energy 2016, 164, 492–500. [Google Scholar] [CrossRef]
  21. Zinsmeister, D.; Licklederer, T.; Christange, F.; Tzscheutschler, P.; Perić, V.S. A comparison of prosumer system configurations in district heating networks. Energy Rep. 2021, 7, 430–439. [Google Scholar] [CrossRef]
  22. Gross, M.; Karbasi, B.; Reiners, T.; Altieri, L.; Wagner, H.-J.; Bertsch, V. Implementing prosumers into heating networks. Energy 2021, 230, 120844. [Google Scholar] [CrossRef]
  23. Mednikov, A.; Maksimov, A.; Tyurina, E. The Modular Plant Based on Biomass for Energy Supply of an Isolated Consumer: Mathematical Modeling. In Proceedings of the 2020 International Multi-Conference on Industrial Engineering and Modern Technologies (FarEastCon 2020), Vladivostok, Russia, 6–9 October 2020; pp. 1–5. [Google Scholar]
  24. Wang, D.; Carmeliet, J.; Orehounig, K. Design and Assessment of District Heating Systems with Solar Thermal Prosumers and Thermal Storage. Energies 2021, 14, 1184. [Google Scholar] [CrossRef]
  25. Postnikov, I.; Stennikov, V.; Penkovskii, A. Prosumer in the district heating systems: Operating and reliability modeling. Energy Procedia 2018, 10, 2530–2535. [Google Scholar] [CrossRef]
  26. Penkovskii, A.; Stennikov, V.; Kravets, A. Bi-level modeling of district heating systems with prosumers. Energy Rep. 2020, 6, 89–95. [Google Scholar] [CrossRef]
  27. Stanica, D.-I.; Bachmann, M.; Kriegel, M. Design and performance of a multi-level cascading district heating network with multiple prosumers and energy storage. Energy Rep. 2021, 7, 128–139. [Google Scholar] [CrossRef]
  28. Li, H.; Hou, J.; Tian, Z.; Hong, T.; Nord, N.; Rohde, D. Optimize heat prosumers’ economic performance under current heating price models by using water tank thermal energy storage. Energy 2022, 239, 122103. [Google Scholar] [CrossRef]
  29. Li, H.; Hou, J.; Hong, T.; Nord, N. Distinguish between the economic optimal and lowest distribution temperatures for heat-prosumer-based district heating systems with short-term thermal energy storage. Energy 2022, 248, 123601. [Google Scholar] [CrossRef]
  30. Postnikov, I. Methods for optimization of time redundancy of prosumer in district heating systems. Energy Rep. 2020, 6, 214–220. [Google Scholar] [CrossRef]
  31. Postnikov, I. Methods for the reliability optimization of district-distributed heating systems with prosumers. Energy Rep. 2023, 9, 584–593. [Google Scholar] [CrossRef]
  32. Ross, S.M. Introduction to Probability Models, 12th ed.; University of Southern California: Los Angeles, CA, USA, 2019. [Google Scholar]
  33. Stennikov, V.; Novitsky, N.; Alexeev, A.; Grebneva, O.; Lutsenko, A.; Penkovsky, A.; Postnikov, I.; Tokarev, V.; Shalaginova, Z.; Mednikova, E.; et al. Chapter 6—Hierarchical modeling of analysis control of operating conditions of pipeline energy systems. In Hierarchical Modeling of Energy Systems; Voropai, N.I., Stennikov, V.A., Eds.; Elsevier: Amsterdam, The Netherlands, 2023; pp. 379–455. [Google Scholar]
Figure 1. Graph of states and transitions for CHPP represented as four subsystems.
Energies 16 06960 g001
Figure 2. Random process of operation of the studied facilities, given the non-ordinariness of events: (a) non-ordinary transitions graph of the example of 1 and 2 states (group 1—single transitions, group 2—“double” transitions); (b) graph of states for the object with “double” transitions.
Energies 16 06960 g002
Figure 3. Scheme of formation of a state graph with dependent events of the example of two components i and k: (a) failure of component k depends on failure of component i; (b) failure of component i depends on failure of component k.
Energies 16 06960 g003
Figure 4. Change (deviation) in the probabilities of states of a test diagram of facilities (CHPP) when modeling non-ordinary (in this example, “double”) events for different values of the transition probabilities of the model of random process of operation: (a) general diagram (values up to 25%); (b) enlarged diagram (values up to 1%).
Energies 16 06960 g004
Figure 5. Dependences of changes in the state probabilities for the test diagram of the facilities (CHPP) given the non-ordinary (for this example, “double”) events: (a) distribution of changes in probabilities by state; (b) dependence of the probability change on values of transition probabilities of random process.
Energies 16 06960 g005
Figure 6. Results of the computational experiment for test scheme of facilities (CHPP): (a) reliability function (F) depending on the values of conditional probabilities (failure rates); (b) gradient of the reliability function F (projection of the diagram shown in (a)).
Energies 16 06960 g006
Disclaimer/Publisher’s Note: The statements, opinions and data contained in all publications are solely those of the individual author(s) and contributor(s) and not of MDPI and/or the editor(s). MDPI and/or the editor(s) disclaim responsibility for any injury to people or property resulting from any ideas, methods, instructions or products referred to in the content.

