1. Introduction
Monitoring physical phenomena arising from the occurrence of partial discharges (PDs), such as ozone generation, electromagnetic fields, and acoustic signals, in an electrical machine is of paramount importance to assess its electrical condition and, thus, to better schedule maintenance actions, minimize downtime, and increase the equipment’s lifespan [
1]. Identifying the types of PDs, their locations, and degrees of severity is crucial for defining monitoring procedures of PDs. Their PD location, associated with the PD class identification, provides essential information for planning specific details of the corrective interventions. The continuous monitoring of the severity level, conducted during routine observation phases, enhances the quality and precision of maintenance scheduling decisions [
1,
2].
Electrical discharges occur in the air gap between high-voltage electrodes when the applied voltage is sufficient to generate electric field intensities greater than the air dielectric strength, ionizing the air (the molecules of air mainly lose electrons). This air ionization begins an avalanche of electrons. When the number of electrons in the avalanche exceeds 10
8, the electric field originated by the external source exhibits a sharp deformation in the space between the conductors, giving rise to the formation of a low-conductivity plasma channel, called streamer channel [
3,
4,
5,
6]. At the beginning of the formation of the streamer channel, an exponential increase of its electric conductivity and current takes place. Then, the streamer channel electrically connects the electrodes, the streamer’s electric conductivity (and, thus, the current) increases over-exponentially [
4,
5,
7], and a large release of free electrons in the channel is observed. After a certain time, there is a redistribution of the electric field in the ionized gap space. The electronic repulsive forces intensify because of the massive increase in the number of electrons in the channel, in such a way that the reassociations of electrons with ionized atoms are favored. This effect results in the electric current undergoing exponential decay, primarily due to the recombination process which consists of the bonding of electrons to the molecules of gaseous species present in air, reducing the plasma conductivity [
4] until the disruption of the channel and the cessation of the discharge current.
The partial discharge phenomena also lead to the occurrence of chemical reactions, which generate ozone among their products. Experimental procedures based on the theoretical background that describes ozone production and elimination are treated in the scientific literature [
8,
9,
10,
11]. Over the years, research centers specialized in power systems have explored techniques for harnessing PD ozone production as a resource [
12,
13,
14,
15,
16]. These endeavors aim to not only assess partial discharges but also to proactively anticipate the need for maintenance interventions in generators. Reaction chambers have been proposed to allow the experimental investigation of the ozone production process from partial discharges [
10,
11]. The ozone-generating chambers typically consist of an acrylic, glass, or ceramic container that houses metal electrodes and dielectric barriers. The reaction chamber is usually designed to maximize the amount of ozone generated by using a careful choice of materials, dimensions, and features regarding geometrical, electrical, and fluid dynamics aspects. The design of the reaction chamber affects not only its construction cost and energy consumption, but also the production and quality of the generated ozone.
In engineering, to design and optimize systems and structures [
17,
18,
19], numerical methods are used. These methods allow the study of the behavior of complex systems under different conditions, the development of new technologies, and the enhancement in the reliability of predictive techniques. Examples of such methods include finite difference methods, finite element methods, and numerical optimization techniques [
7,
20,
21,
22]. In [
7], a finite element (FEM) model of streamer channel formation was developed. In [
20], the phenomenon of air ionization by corona discharges was modeled using the recursive least squares (RLS) method. In [
21], transient electromagnetic fields produced by streamer discharges were computed by developing a streamer finite-difference time-domain (FDTD) model.
With its foundation in fluid mechanics, computational fluid dynamics (CFD) is a discipline that uses numerical methods and algorithms, such as FEM, to simulate and analyze the complex behavior of fluids [
22]. It is instrumental for understanding and predicting both the production and the transport of ozone molecules in complex systems.
In this work, experimental measurements of ozone production are carried out with a high-voltage dielectric-barrier reaction chamber designed and built by our research group. Furthermore, we developed electromagnetic and CFD models of the reaction chamber using COMSOL Multiphysics [
23]. The principal aim of our study is to investigate, for the first time, the relationship existing between the reaction rate governing ozone production and the cumulative power associated with the partial discharges occurring between the high-voltage electrodes that are separated by a glass dielectric barrier. This investigative pursuit is undertaken through a strategy integrating laboratorial experimentation and advanced computational modeling. The remainder of this paper is structured as follows. In
Section 2, we describe the methodologies employed for performing the experiments and simulations. Our results are presented in
Section 3 and discussed in
Section 4. Final remarks are provided in
Section 5.
2. Materials and Methods
This section is divided into two parts: the first one describes the experimental setup established for performing the experiments with the reaction chamber, which was conducted in the high-voltage laboratory of the Brazilian electric power company Eletronorte, located in the city of Belém. The second part offers a condensed overview of the theoretical foundation, and outlines the key elements encompassing the conceived CFD model designed to perform the FEM simulations.
2.1. The Reaction Chamber and Our Experimental Setup
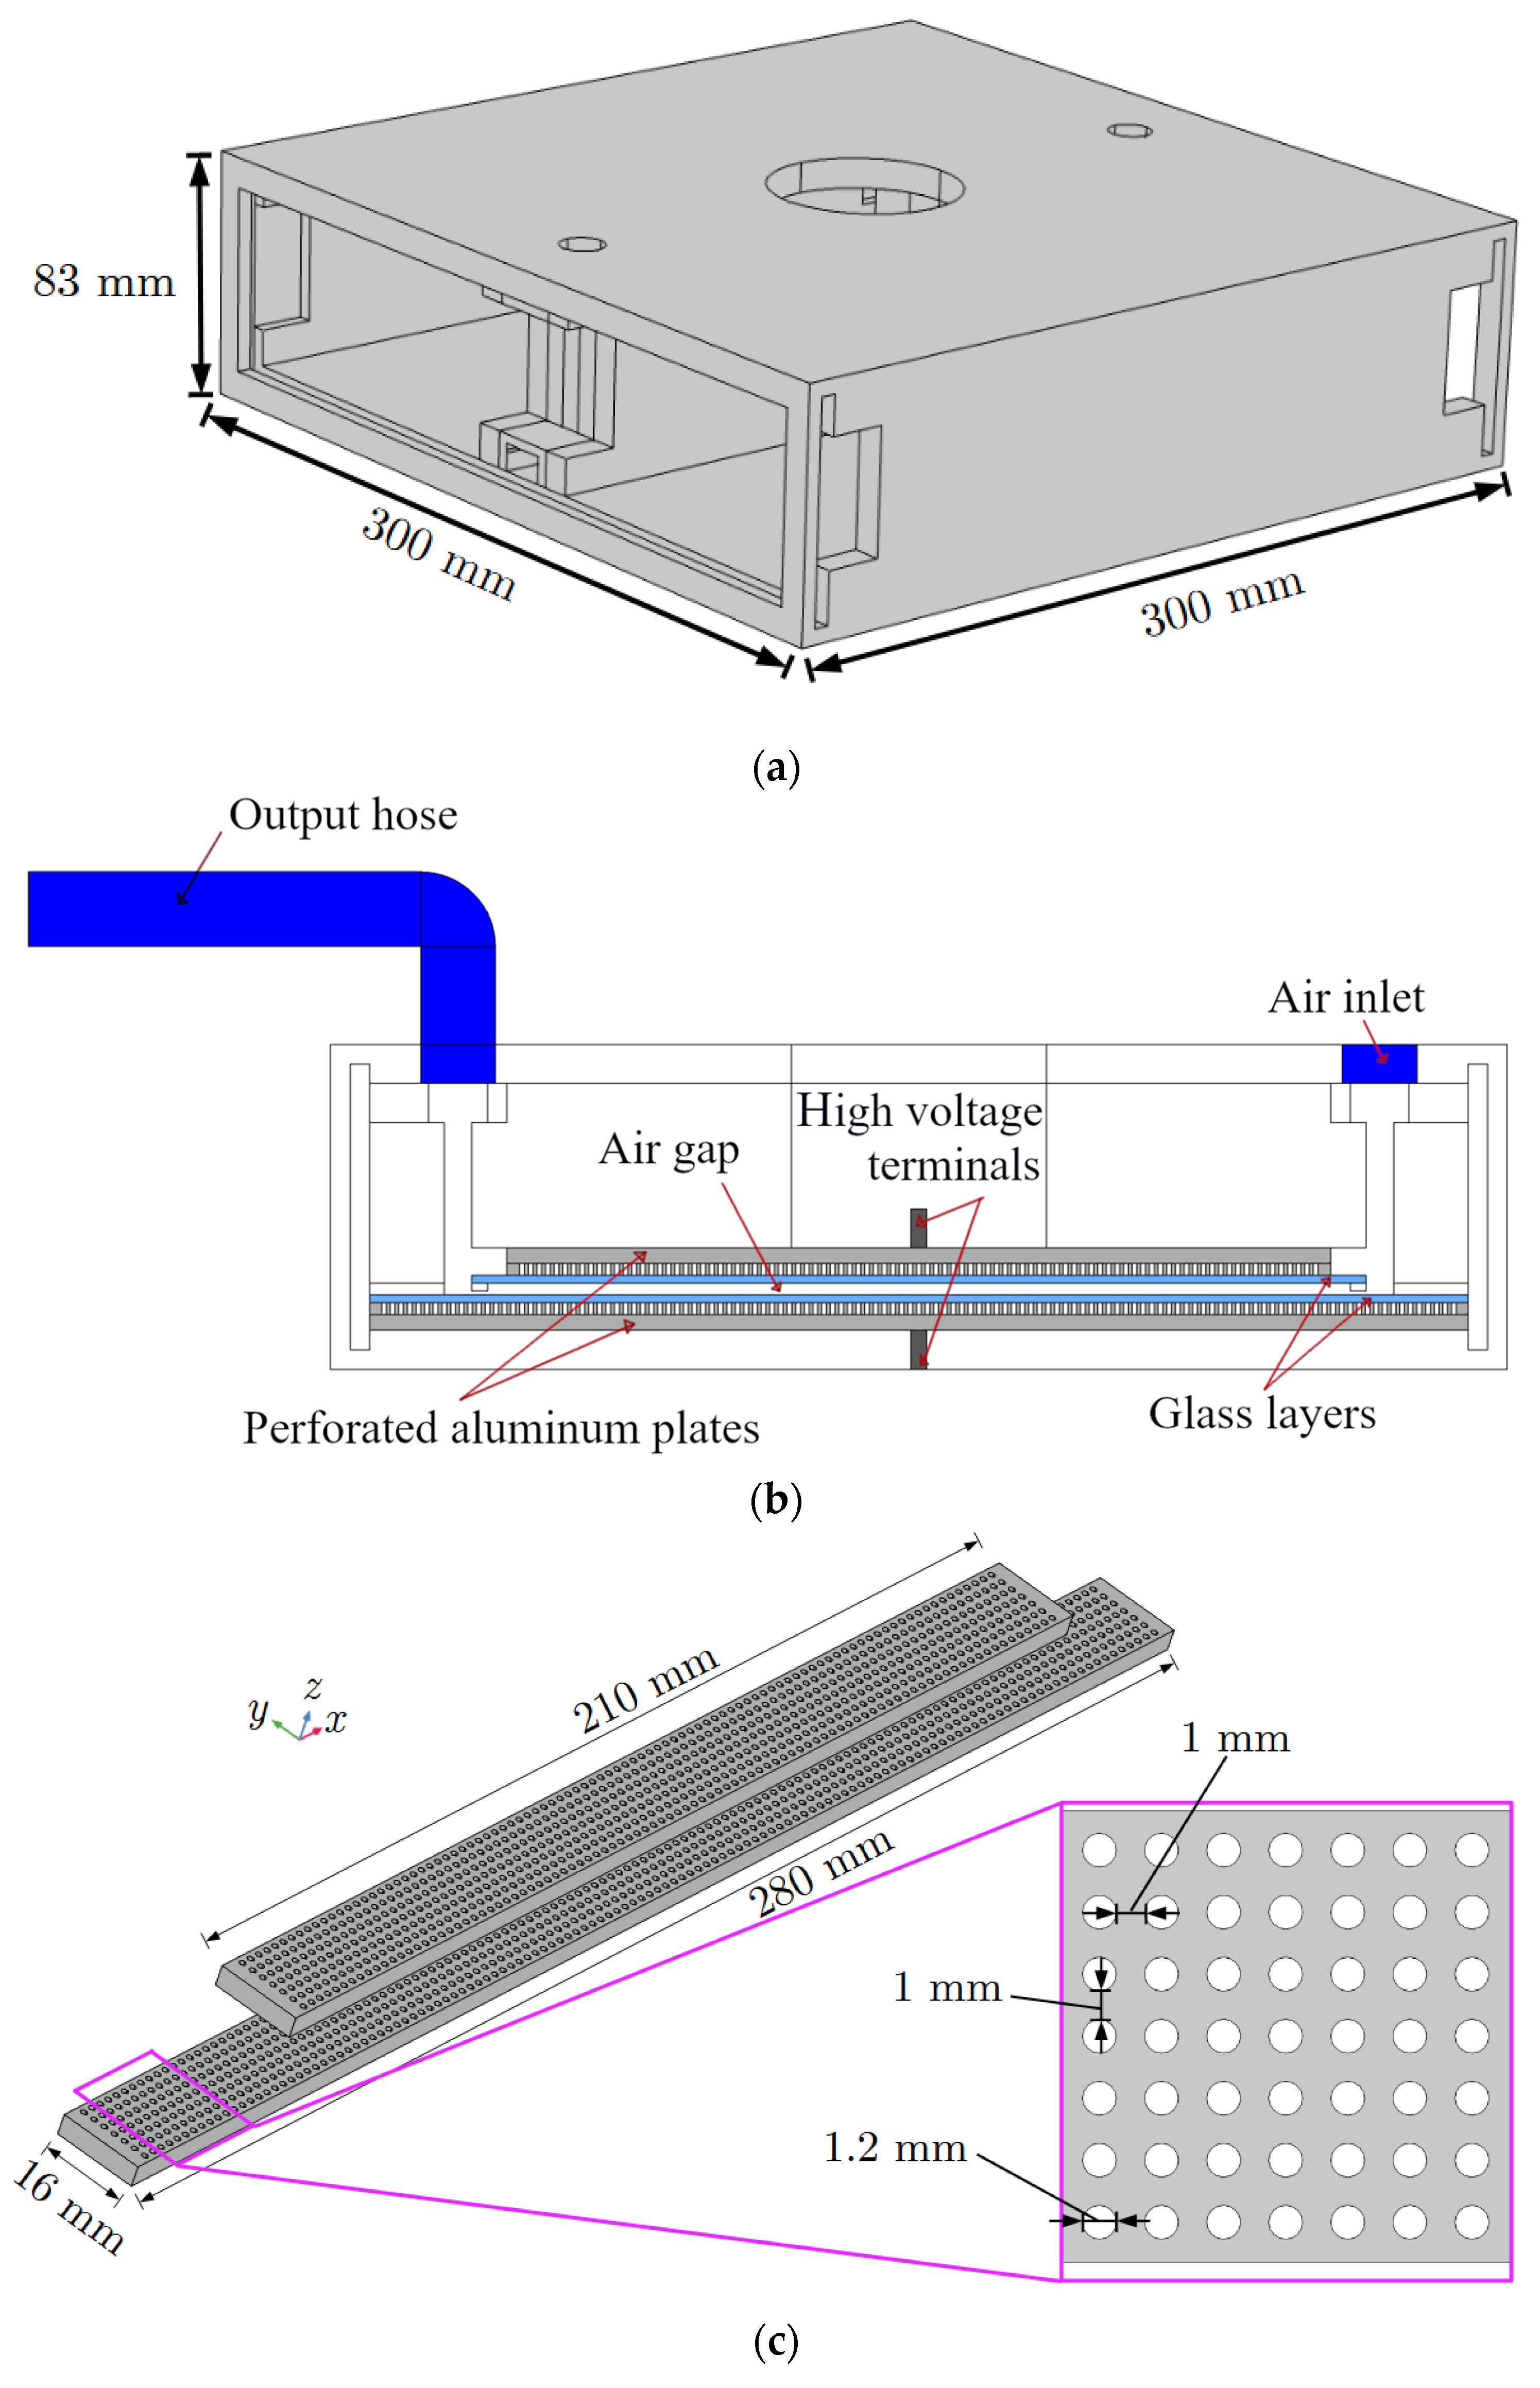
The ozone production reaction chamber, depicted in
Figure 1 and
Figure 2, has dimensions of 300 mm in length, 83 mm in height, and 300 mm in width. It is constructed using 10 mm thick acrylic sheets. The chamber’s base features a centrally positioned hole with a diameter of 4 mm, serving as an aperture for the ground connector to traverse. On the upper surface of the chamber, three holes are situated with collinear centers. Among these, the central aperture has a larger diameter of 65 mm and functions as a conduit for the connection of the upper metallic plates to the voltage source. Additionally, two smaller apertures with diameters of 15 mm are symmetrically positioned 25 mm away from the longitudinal extremities of the structure. Using those apertures, the air inlet and outlet valves are coupled to the air corridor. The air corridor walls are made of acrylic and are 280 mm long, 10 mm wide, and 63 mm high. These walls are 28 mm apart from each other.
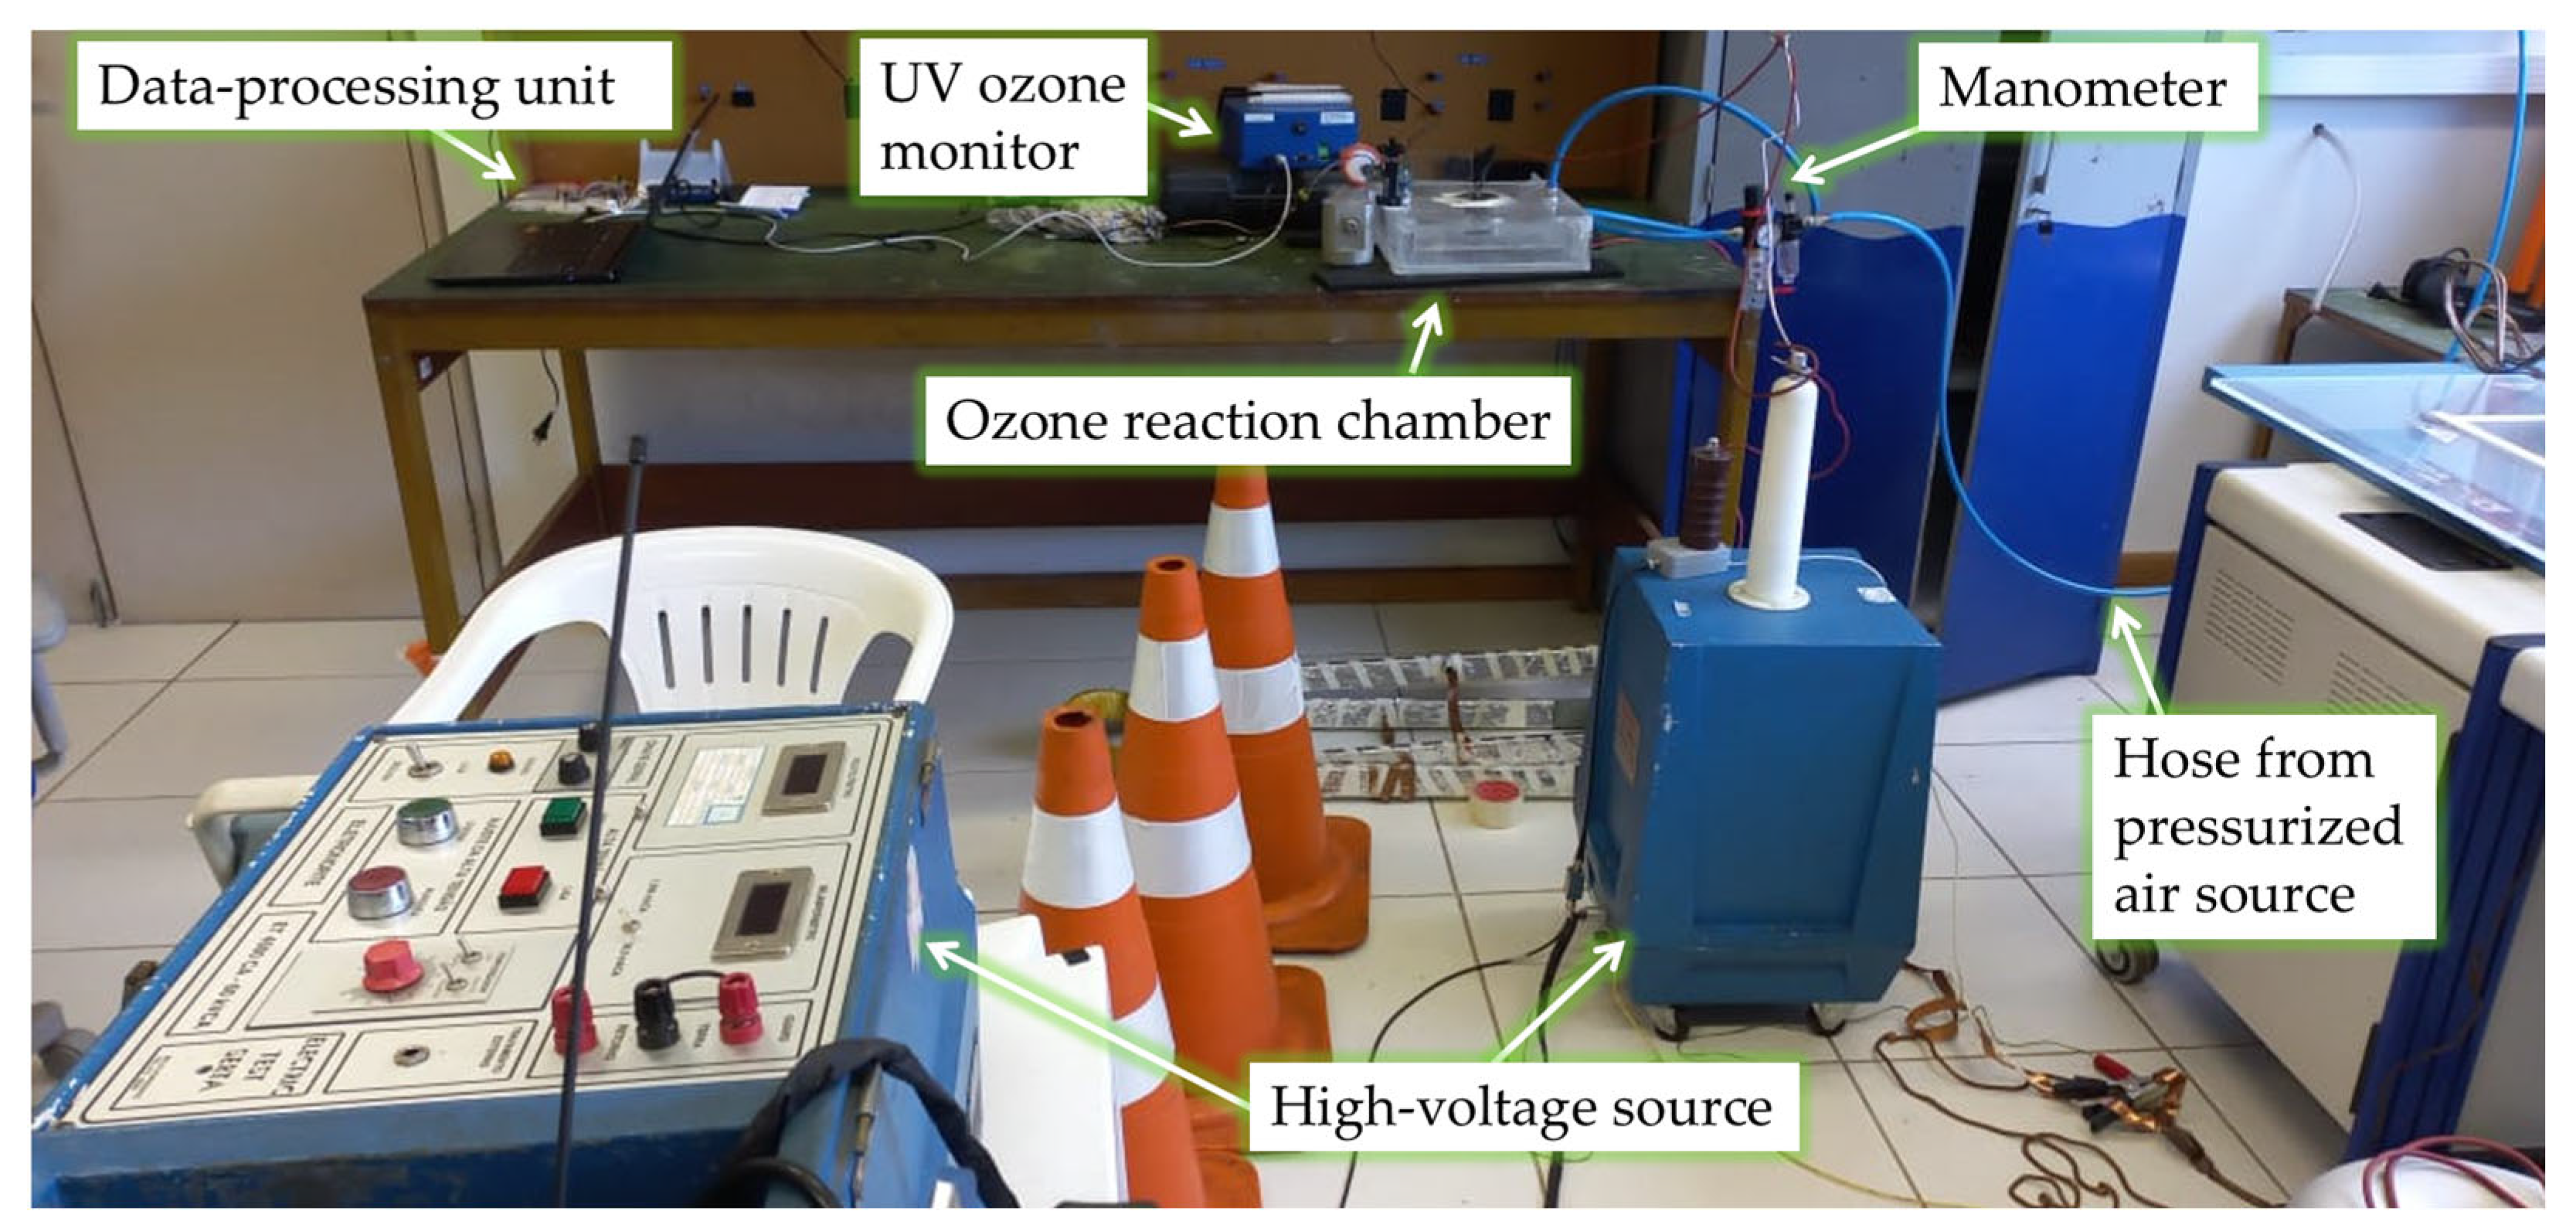
The air is supplied by a compressed dry-air cylinder, which is connected to the chamber using a hose. The pressure is adjusted with a manual pressure regulator (manometer). As the input flow rate is the same as the output’s, the input air flow rate is estimated indirectly by multiplying the velocity of air measured at the outlet by the total cross-section area of the chamber’s outlet. The CFD simulations’ results for the airflow along the reaction chamber confirm the estimation of the air flow rate at the inlet.
In the interior of the chamber, both the high-voltage and the ground terminals are connected to perforated aluminum parallel plates. Between the chamber electrodes, there are dielectric barriers consisting of a pair of two-millimeters-thick glass layers separated by three millimeters, which delimitate the air gap where partial discharges occur (see
Figure 1b). The aluminum electrode plates are perforated with a series of circular holes to cause an intensification of the electric field in the air gap during the operation of the reaction chamber. This electric field intensification occurs in the air-gap regions that are not aligned with the holes of the aluminum electrodes. In those regions, the high-energy electrons will detach from the air atoms due to the intense electric field [
18]. The glass layers improve the stability of the electrical discharges and avoid arc formation, ensuring the emergence of PDs [
24]. Thus, according to [
25], the glass layers have a dual role: they limit the amount of charge that can flow through each single micro-discharge channel (thus producing PDs), and they promote a uniform distribution of PDs across the air gap.
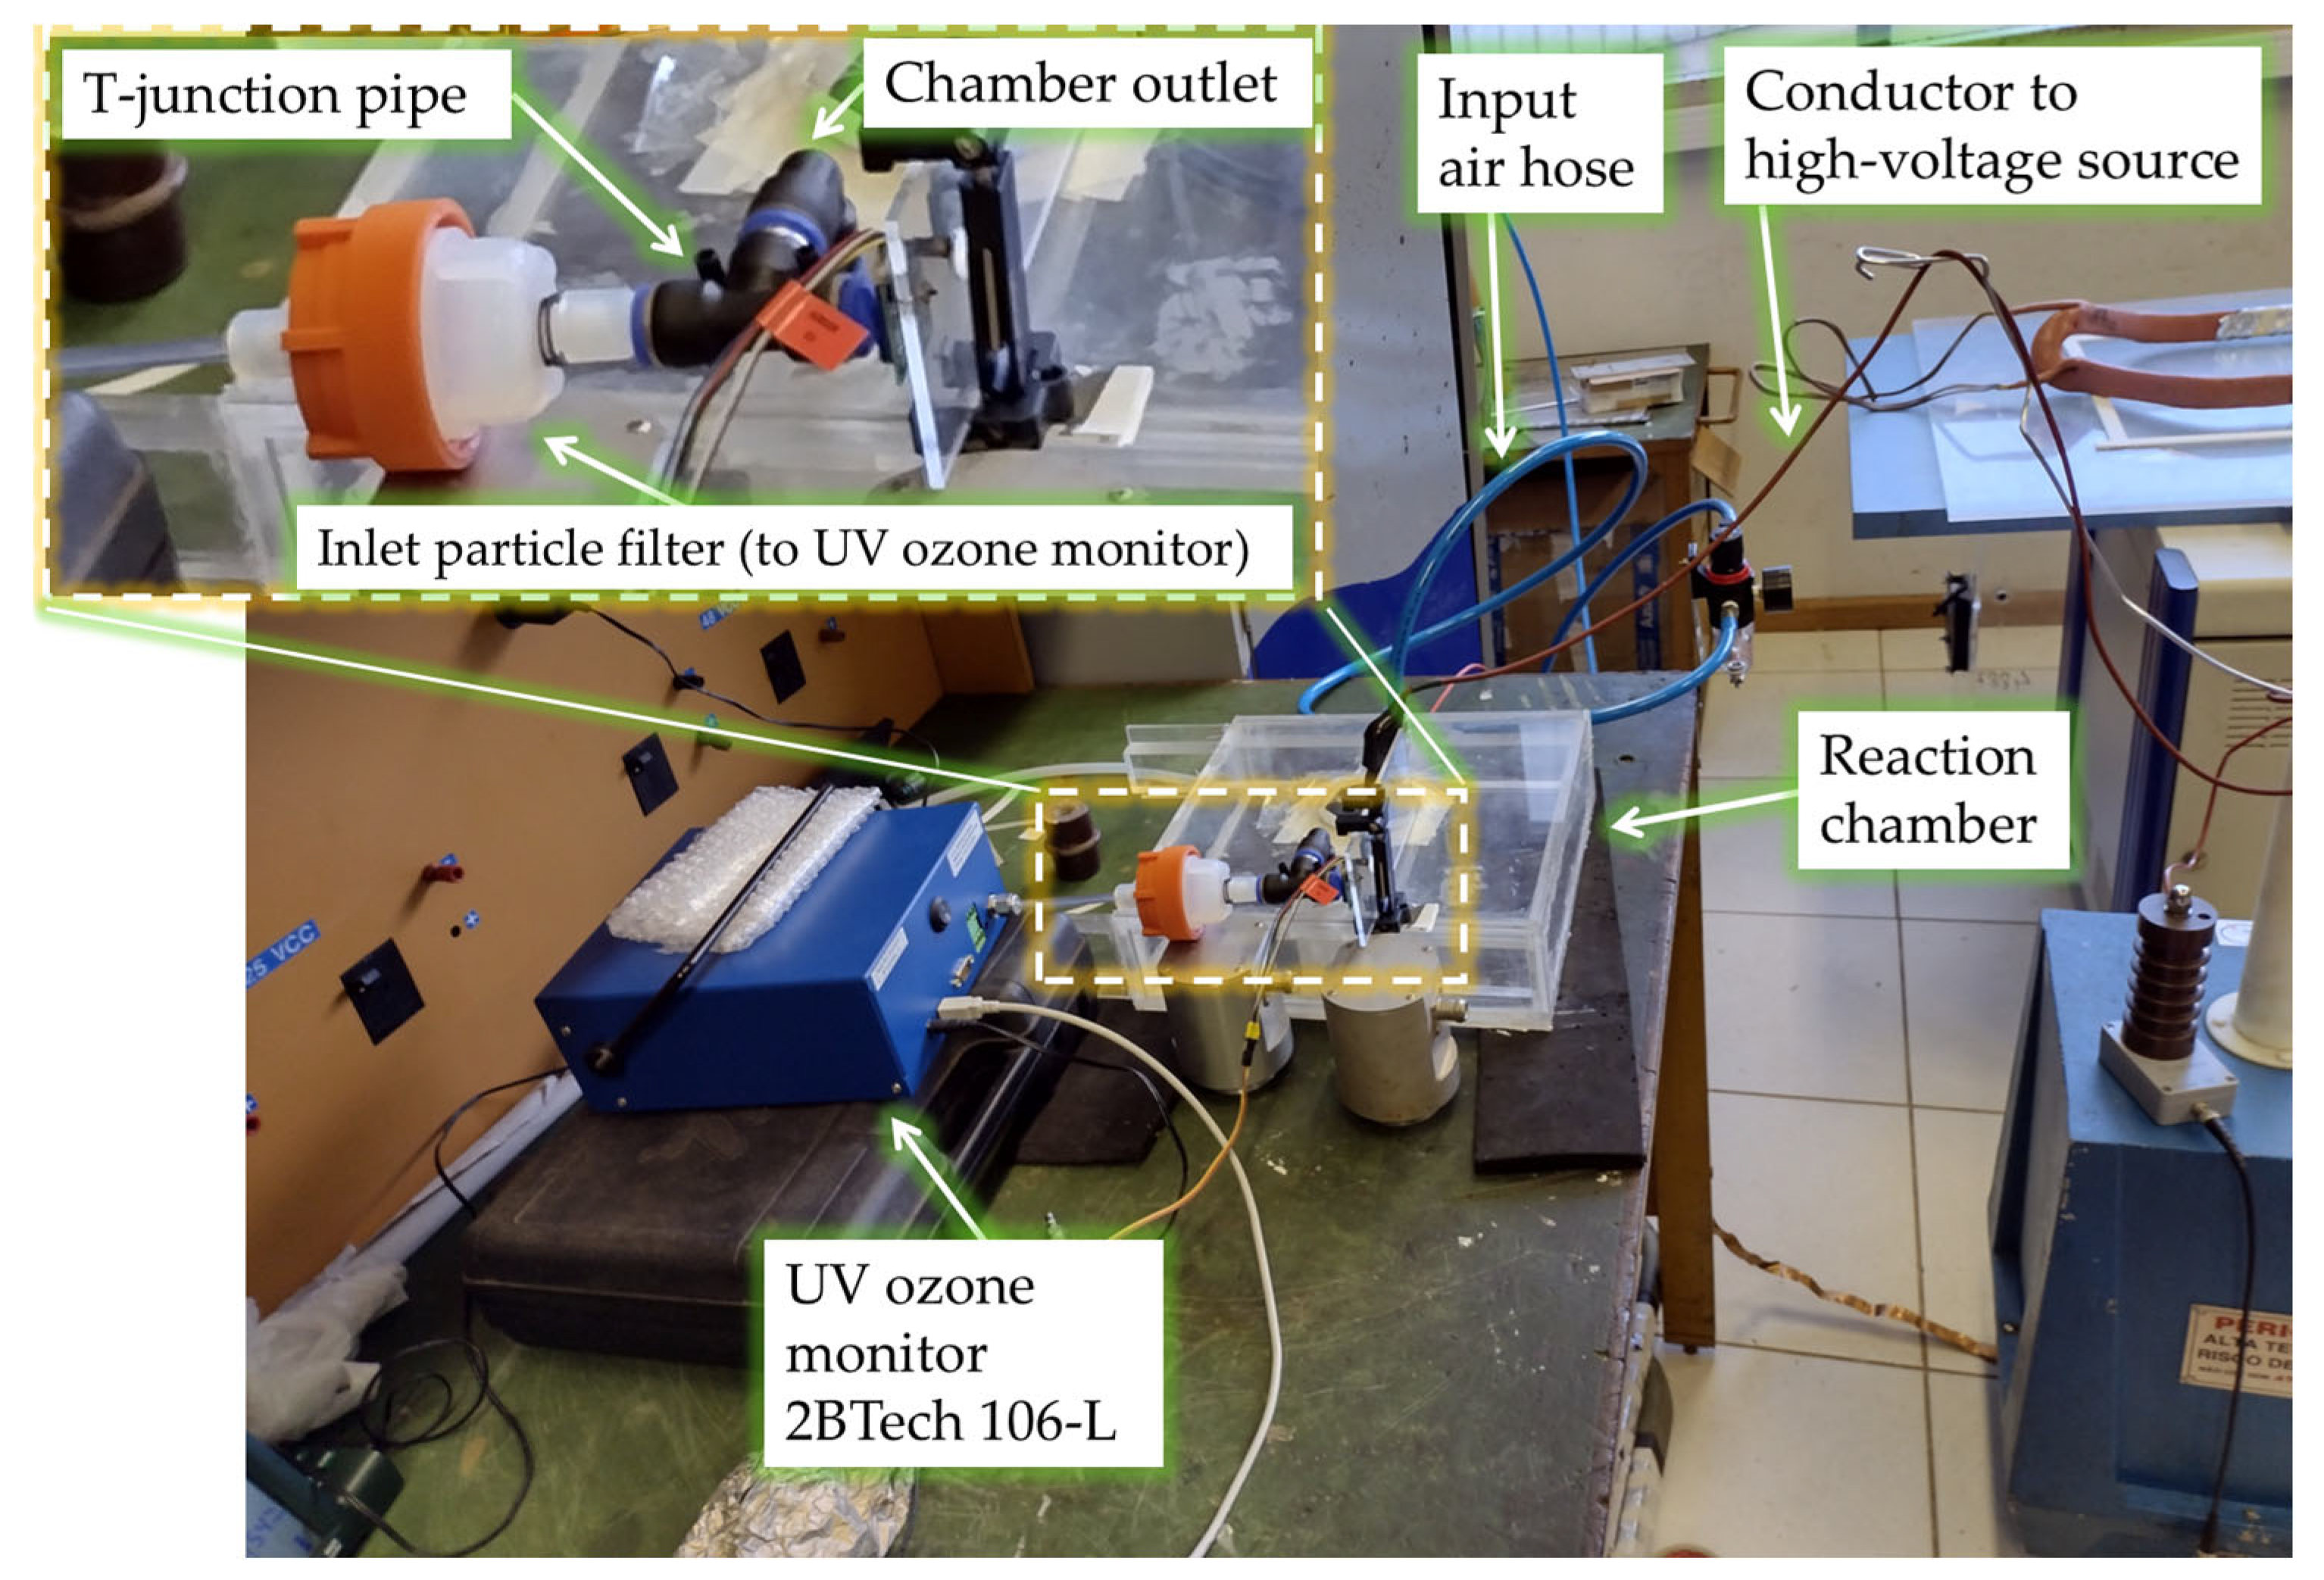
Figure 3 shows the devices and equipment used for powering the reaction chamber and adjusting the voltage level of the applied 60 Hz voltage over time, as well as for monitoring the input gas pressure and the output ozone concentration. In view of the requisite warm-up procedure, the ultraviolet ozone monitor is activated prior to the actual experiment, a process which demands approximately 20 min for completion [
26].
The ozone monitor 2BTech 106-L measures ozone concentration by evaluating the absorption of ultraviolet (UV) light by the ozone. This technique has been used for accurate and precise measurements of atmospheric ozone for many years. Ozone molecules have a maximum absorption at a wavelength of 254 nm, which is the same wavelength emitted by a low-pressure mercury lamp. Fortunately, few other molecules in the atmosphere absorb at this wavelength in significant concentrations. However, in highly polluted air, influences can occur from organic compounds containing certain aromatic rings [
26]. To minimize undesirable particle influences, the device has an inlet particle filter, which is also shown in
Figure 2.
Experimental Procedures
The primary objective of the experiment is to monitor the resulting ozone concentrations and to acquire phase-resolved partial discharge (PRPD) diagrams [
27] for the discharges occurring in the chamber. The goal is to estimate the reaction rate for the ozone. The PRPD diagrams were registered using the IMA-DP system [
28]. The Instrumentation for Monitoring and Analysis of Partial Discharges (IMA-PD) is a partial discharges measurement system based on virtual instrumentation that was developed by the Brazilian company Cepel using LabVIEW, adhering to international technical standards such as the IEC 60034-27-1, IEC 60034-27-2, and IIE 1434-2014. Furthermore, its validation was conducted through a comprehensive comparison with other products on the market. The IMA-DP is being used in various Brazilian hydropower plants, such as Tucuruí and Itaipu [
29,
30].
Our investigation also examines the hysteresis effects concerning ozone generation and the power of micro-discharges, particularly as the input voltages undergo a systematic escalation and a subsequent decrement. The experimental procedure unfolds in the following sequence: Initially, we meticulously calibrate the flow of dry air injected into the reaction chamber. The gauge pressure, precisely adjusted via a manometer integrated into the air injection system, is set to 0.1 bar above the atmospheric pressure. Concurrently, the air velocity, previously and accurately assessed using an anemometer positioned in the outlet side at the UV-based ozone sensor’s location, was registered as 1.5 m/s at the T-junction output.
Figure 2 and
Figure 3 show the setup.
At the beginning of the experiment, the temperature and humidity of the environment were measured using the sensor of a thermo-hygrometer positioned close to the ozone concentration sensor. Throughout the experiment, the temperature remained in the range of 20.6 °C to 21.7 °C, while the relative humidity was approximately 54%. Then, with a 60 Hz high-voltage source connected to the terminals of the reaction chamber, we manually varied the excitation through predefined levels. The voltage remained at each level for 3 min before we adjusted the voltage to the next predefined value. Throughout the experiment, we measured the ozone concentration and obtained partial discharge data. The mentioned excitation voltage levels were set to the following root mean square (RMS) values: 4 kV, 5 kV, 6 kV, 7 kV, 8 kV, 9 kV, and 10 kV. We started at 4 kV, moved up to 10 kV (level-by-level), and then the voltage was progressively reduced back to 4 kV. The total duration of the experiment comprised 39 min. The real-world chamber geometry and physical parameters were then used for developing our computational model of the problem.
2.2. Fluid Mechanics Theoretical Background and Computational Modeling
In a steady state, the mass conservation law [
17] for ozone is given by
where
In (1) and (2), J is the diffusion flux field (mol/(m2s)), c is the species (ozone) concentration (mol/m3), D is the diffusion coefficient (m2/s), R is the reaction rate for ozone, given in mol/(m3·s), and um is the average mass velocity field (m/s).
We derived a formula to calculate
R based on the following reasoning. Firstly, it can be considered as the time derivative of the ozone mass generated in the reaction chamber (in g/s) divided by the volume where the ozone generation occurs. It is also divided by the ozone’s molar mass
M to yield a unity of mol/(m
3.s) for
R. Therefore, we have
where
m′ is the rate of the produced ozone mass in g/s,
M = 47.997 g/mol is the ozone’s molar mass constant, and V
O3 is the volume of the air region where the ozone is generated, which is, for the designed reaction chamber, V
O3 = 1.07 × 10
−5 m
3, as detailed in
Section 3.
In the steady state regime,
m′ becomes constant and is assumed as
m′ =
η·
P, where
η (g/(kW.s)) is the ozone production yield and
P (kW
) is the power of discharges. Therefore, the reaction rate
R is set to represent ozone generation in ionized gas zones in the CFD model as
According to [
20,
21],
η =
CO3·
Gfr/
P, where
CO3 is the output ozone concentration given in ppmv and
Gfr is the gas flow rate in m
3/s, which can be computed as
Gfr =
vin.
Ah, where
vin is the input air velocity and
Ah is the cross-section area of the input hose. Therefore, (4) can also be written as
The discharge power can be approximately estimated using the following expression [
24]:
where
Vmin is the minimum external voltage at which ignition occurs [
24], given by
In these equations,
f is the power frequency (60 Hz, in our case),
CD is the dielectric capacitance,
Cg is the gap capacitance, Δ
Vp is the peak input voltage, and Δ
Vd is the discharge voltage, which is the minimum gap voltage in the active phase of the time-varying input voltage [
24], i.e., it is the minimum voltage at which the PDs emerge.
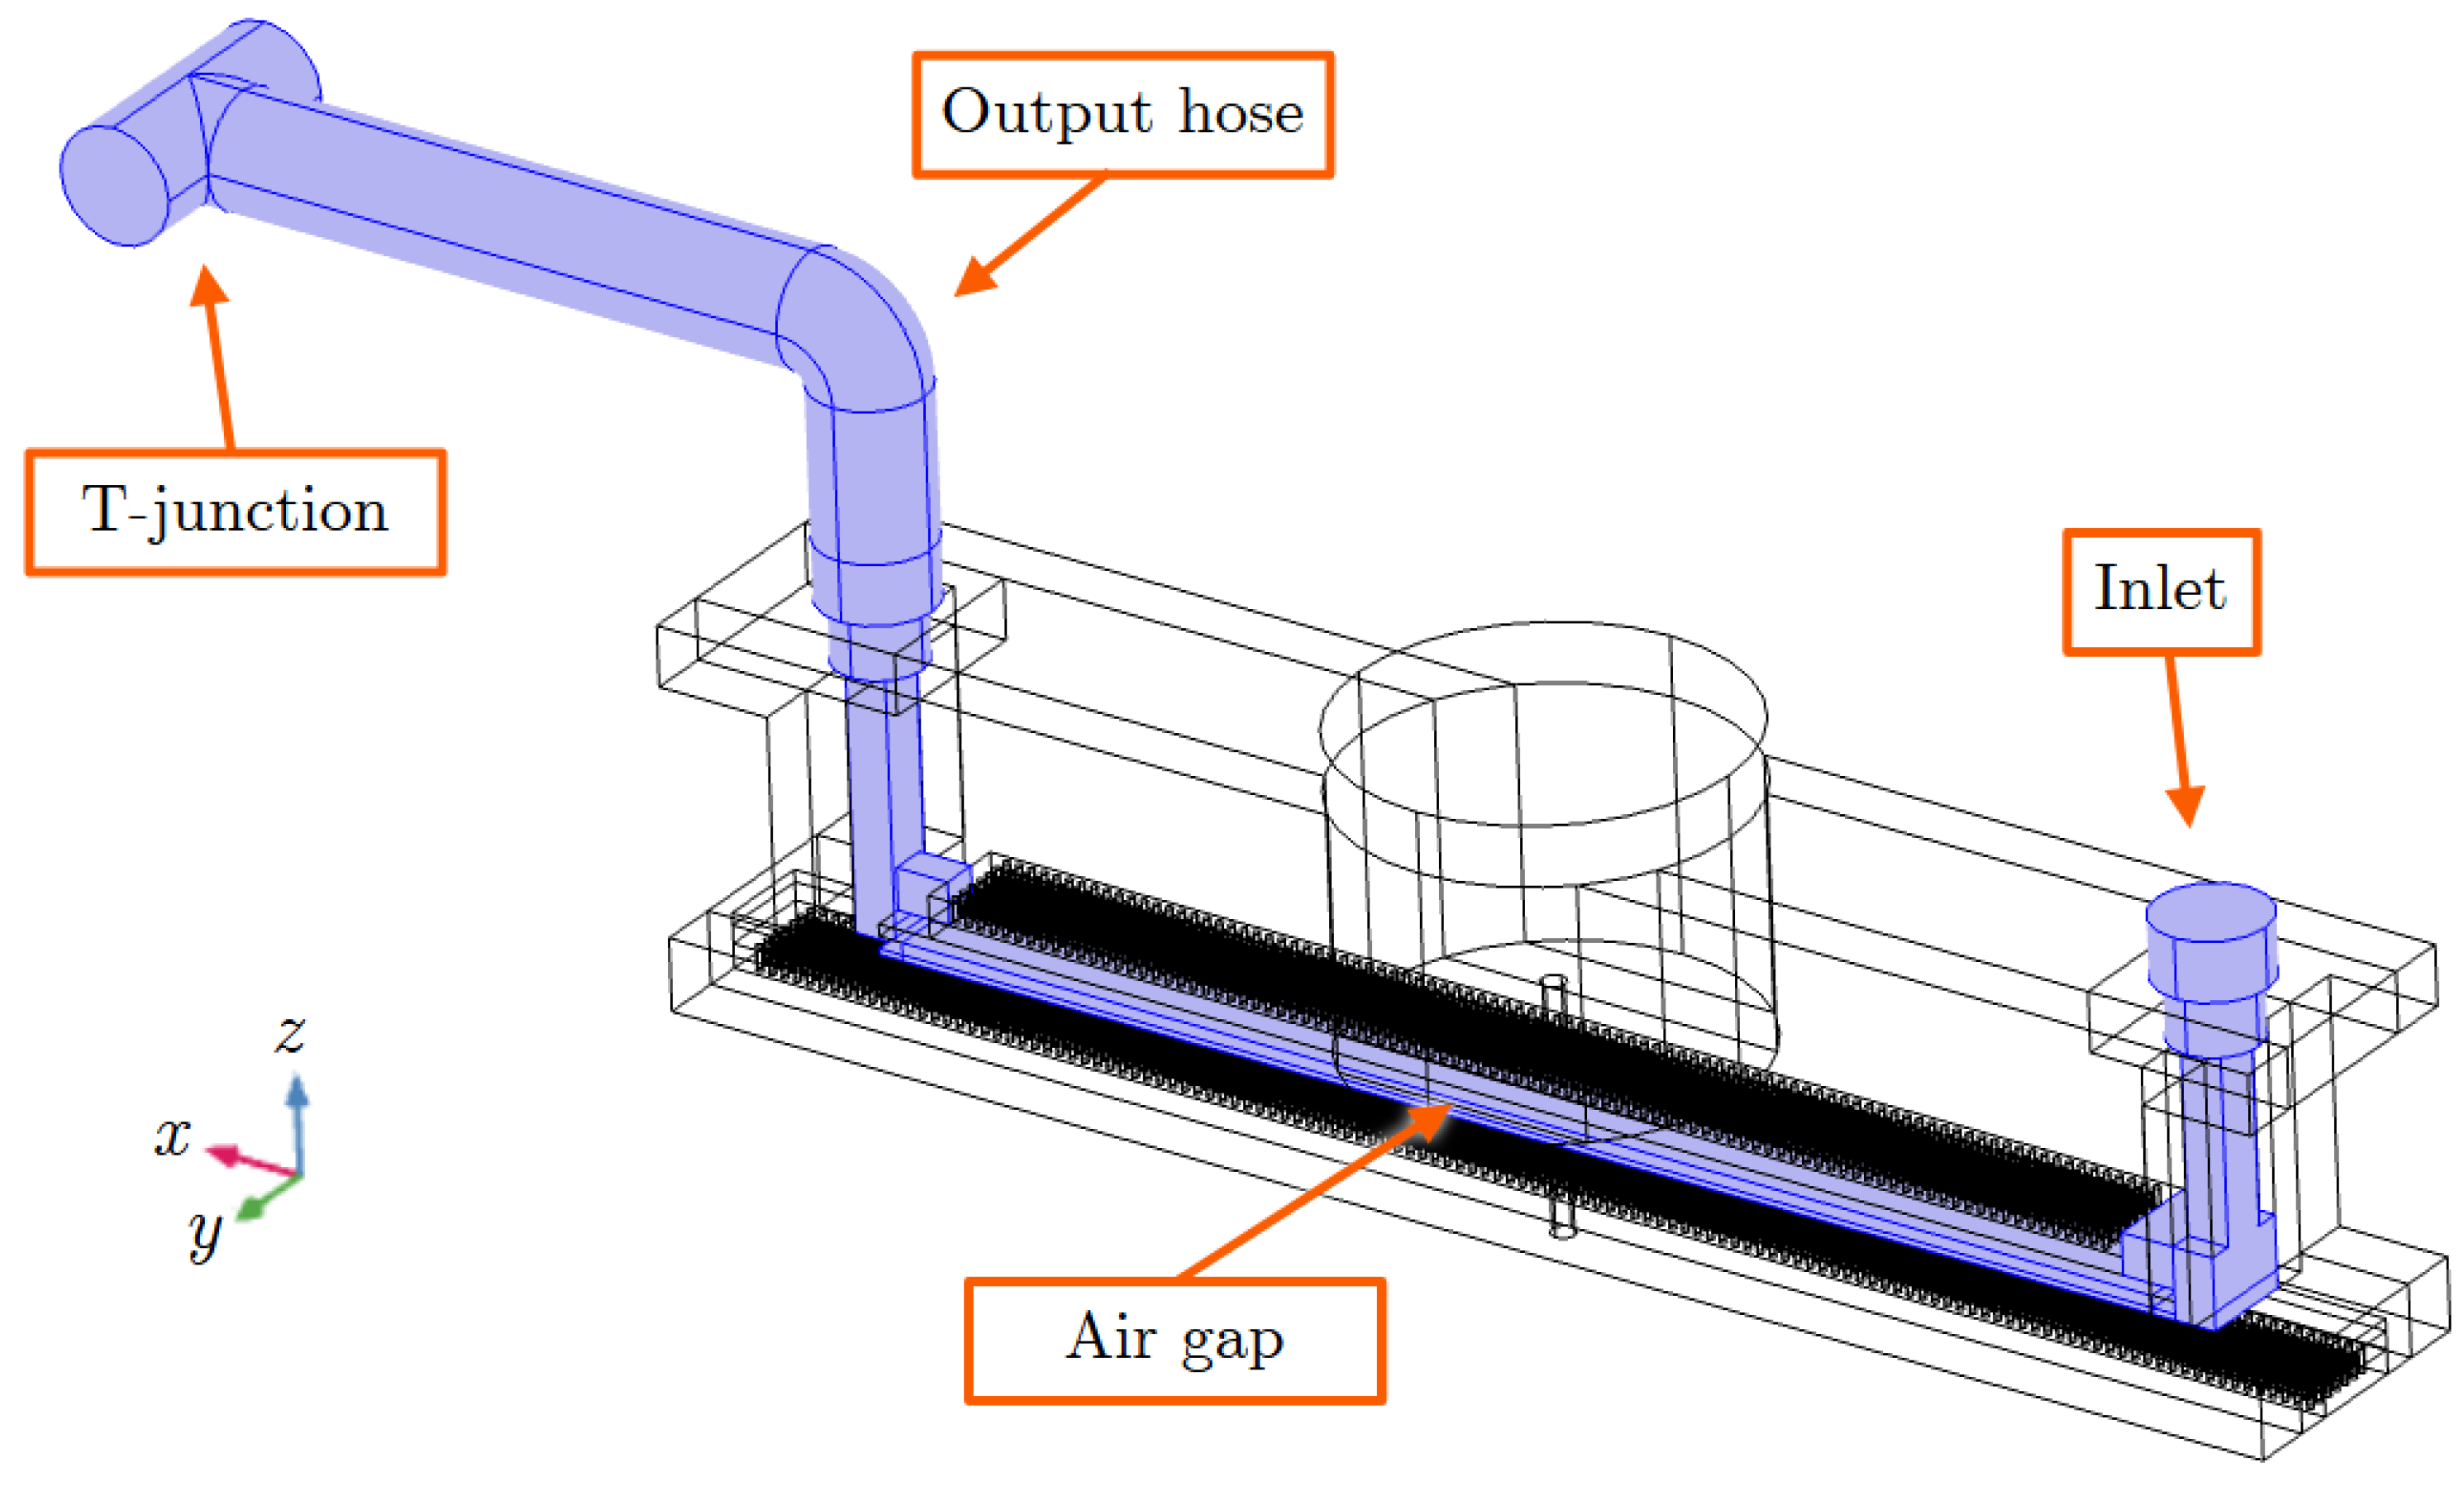
A computational fluid dynamics FEM model was developed using the COMSOL Multiphysics software (version 5.5), to also obtain information about the parameter R and compare its results with (5). The parameter R in the CFD model is calculated based on the experimentally obtained ozone concentration values. To achieve this goal, an initial fluid dynamics simulation is carried out with the normalized value R = 1 and then, in the next simulation, R is set to CExp/CR=1 (experimental concentration/numerical concentration obtained with R = 1) so that the average surface ozone concentration at the outlet is the same as the concentration obtained in the experiment for each applied voltage. This is only possible due to the linearity of (1).
The physics modules’ turbulent flow and transport of diluted species of the COMSOL software were used along with a computational representation of the chamber geometry and material parameters. The numerical model is based on the discretization of (1) and (2) by applying the finite element method (FEM) on a discretized representation (mesh) of the internal air region of the chamber and duct walls. A graphical representation of our model is shown in
Figure 4. The input velocity at the inlet of the chamber was set to 2.46 m/s to achieve an output velocity of 1.5 m/s, in agreement with the laboratorial experiment. The blue-highlighted region is the finite element mesh representing the internal gas region where computational fluid dynamics calculations are applied to by considering the ozone production due to the partial discharges. The computational mesh is made up of 4,206,418 pyramidal elements with a maximum and minimum edge size of 2.69 mm and 0.04 mm, respectively. Each simulation requires approximately 34 GB of RAM and a processing time of 2 h and 14 min with an error tolerance criterion of less than 5% to terminate the Newton iterations [
23]. The used computational system is equipped with 16 cores of an AMD Ryzen 9 processor and 128 GB of RAM, which is running the 64-bit Slackware Linux 15.0 operating system.
3. Results
In the course of the experiments, the temporal evolution of the output ozone concentration was tracked through the employment of the UV-based ozone monitor. Concurrently, the amplitude of the input AC voltage was varied, initially ascending and subsequently descending, while maintaining a fixed input gauge pressure of 0.1 bar.
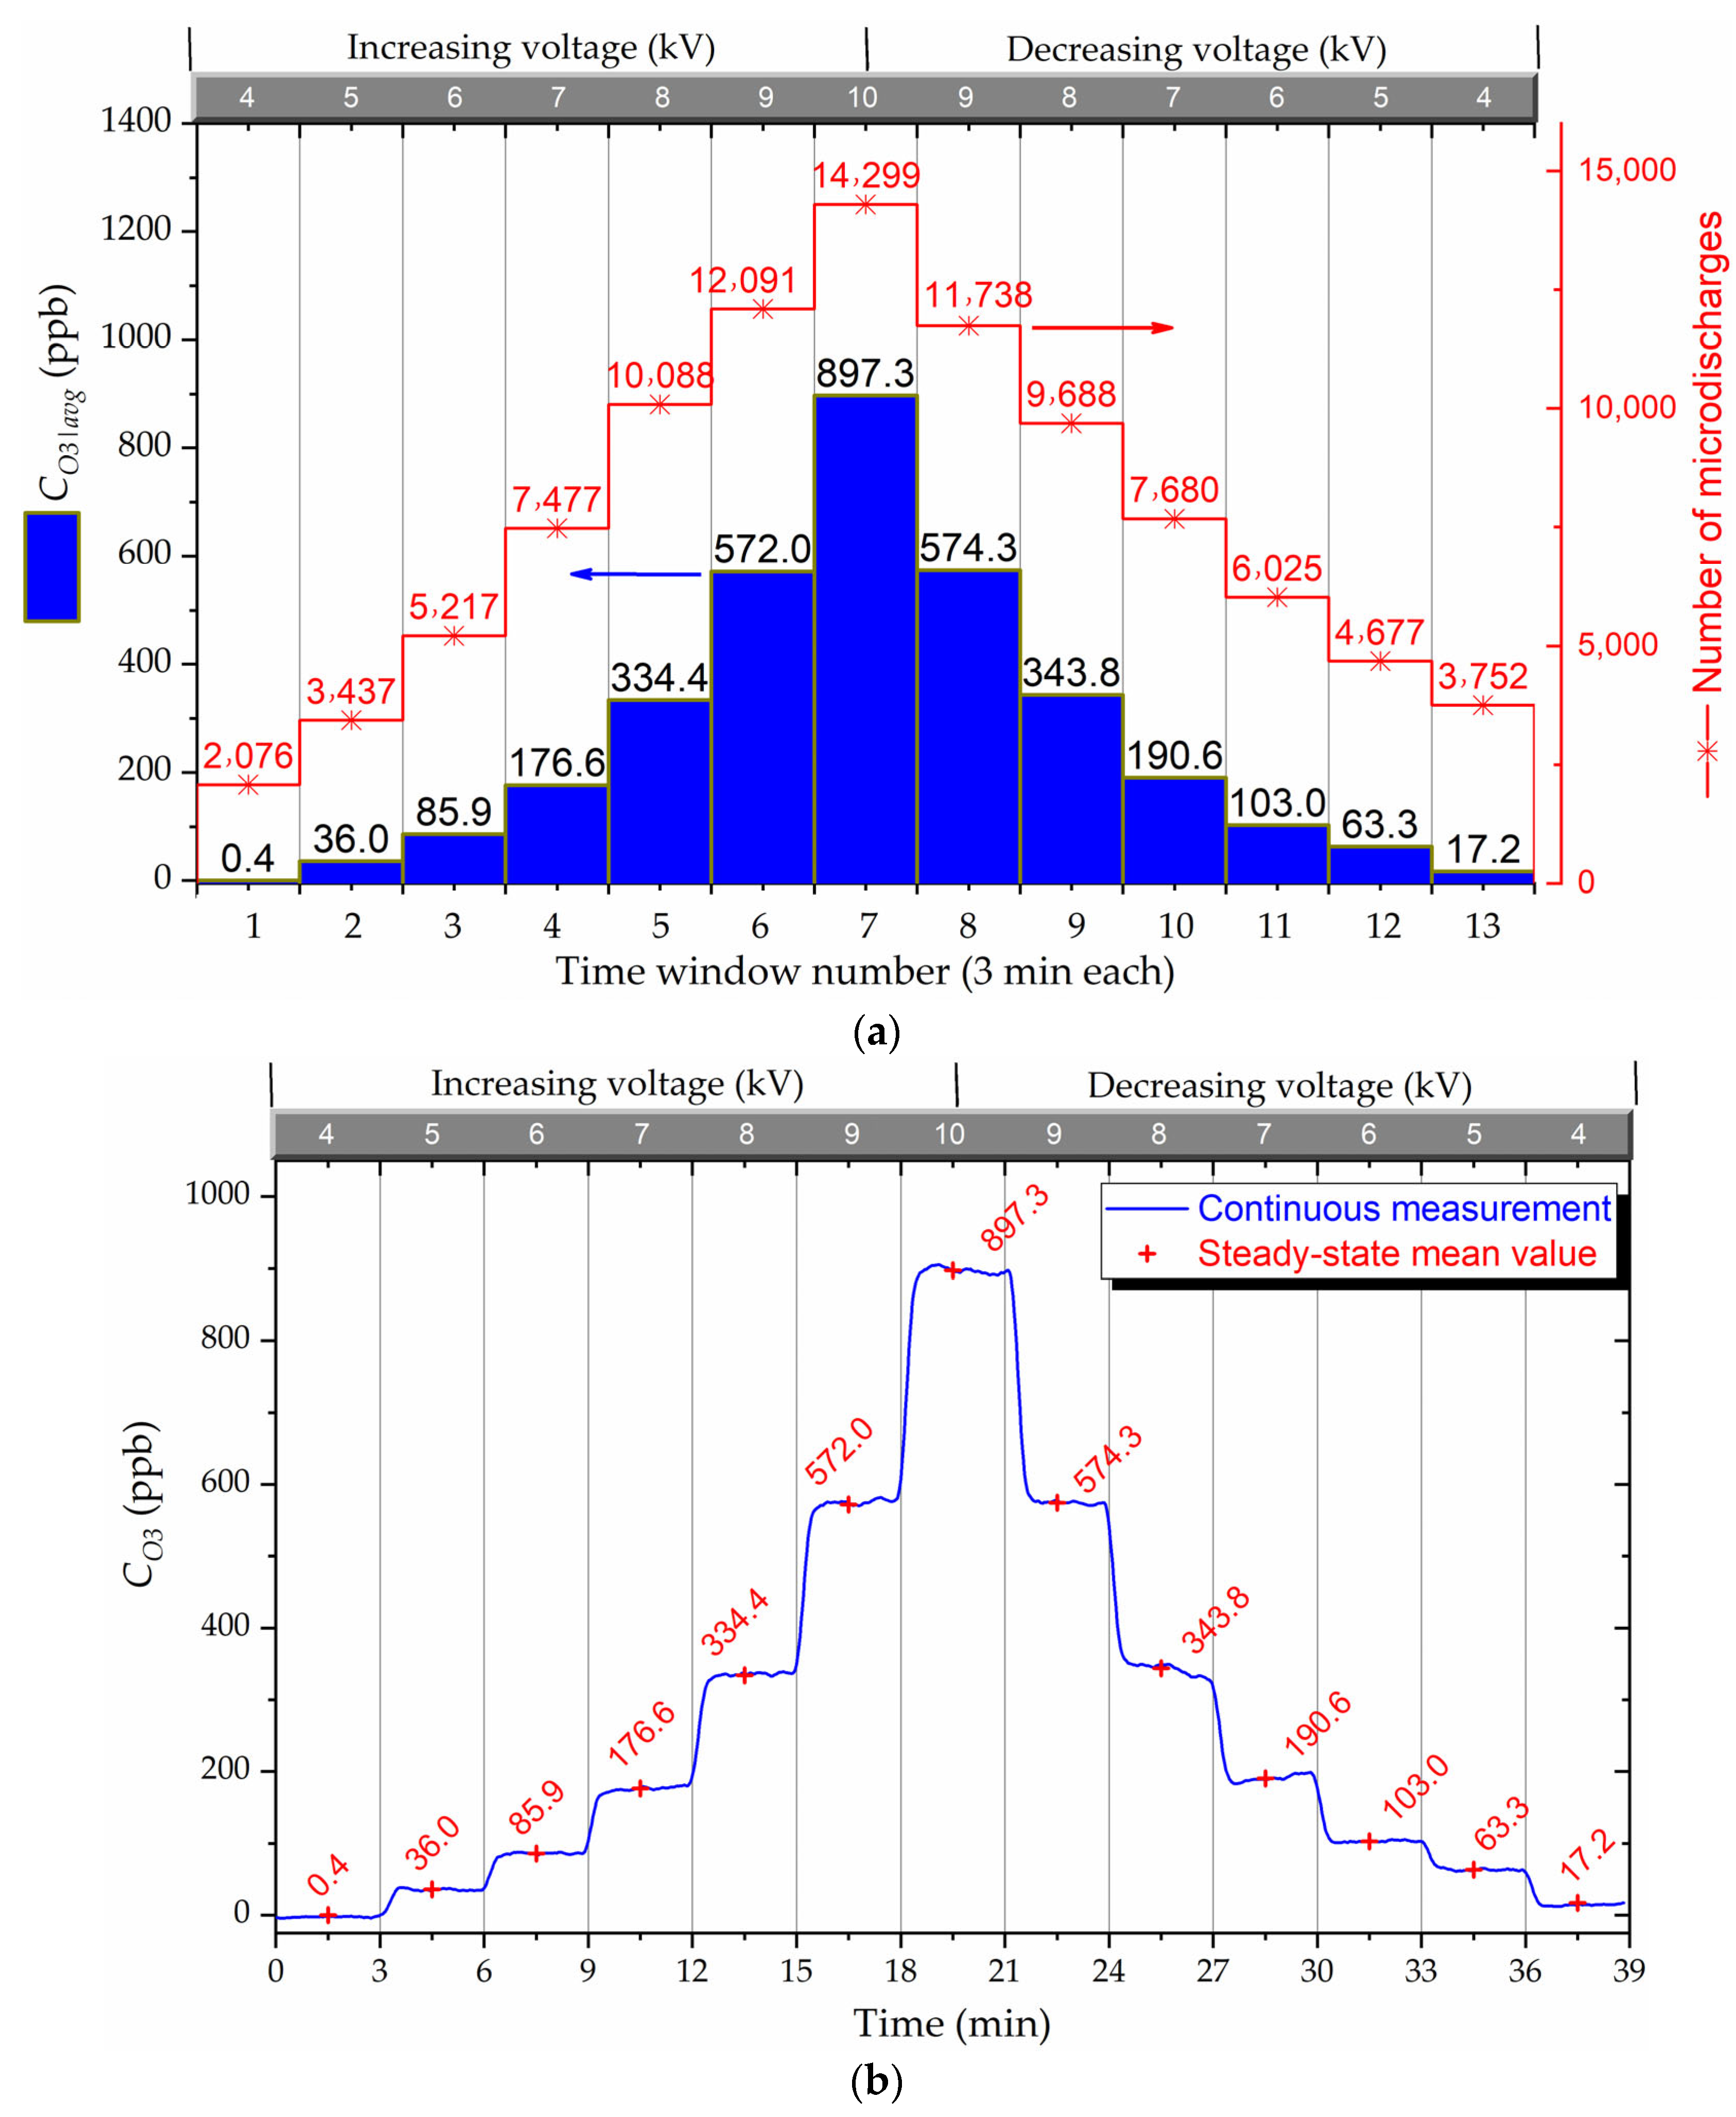
Figure 5 visually portrays the resultant output ozone concentration as a function of the varying input voltage over the experiment time. In
Figure 5a is shown the average ozone output calculated within a time window of 3 min and the corresponding numbers of micro-discharges measured via the PRPD, where the RMS value of the input voltage was maintained constant for each time window.
Figure 5b shows the raw data retrieved from the continuous monitoring of the output ozone concentration over time. It was observed during the experiments that convergence was reached in a few seconds at each voltage level. This is due to the reduced dimensions of the chamber and the internal laminar flow. The ozone concentration time average was taken after the convergence time for each applied voltage. In this way, it is possible to compare the experimental results with the steady-state simulation results. Note that the ozone concentrations are higher in the voltage descending regime than the concentrations obtained for the same voltages during the voltage rise regime.
The air volume where the ozone is produced, i.e., where
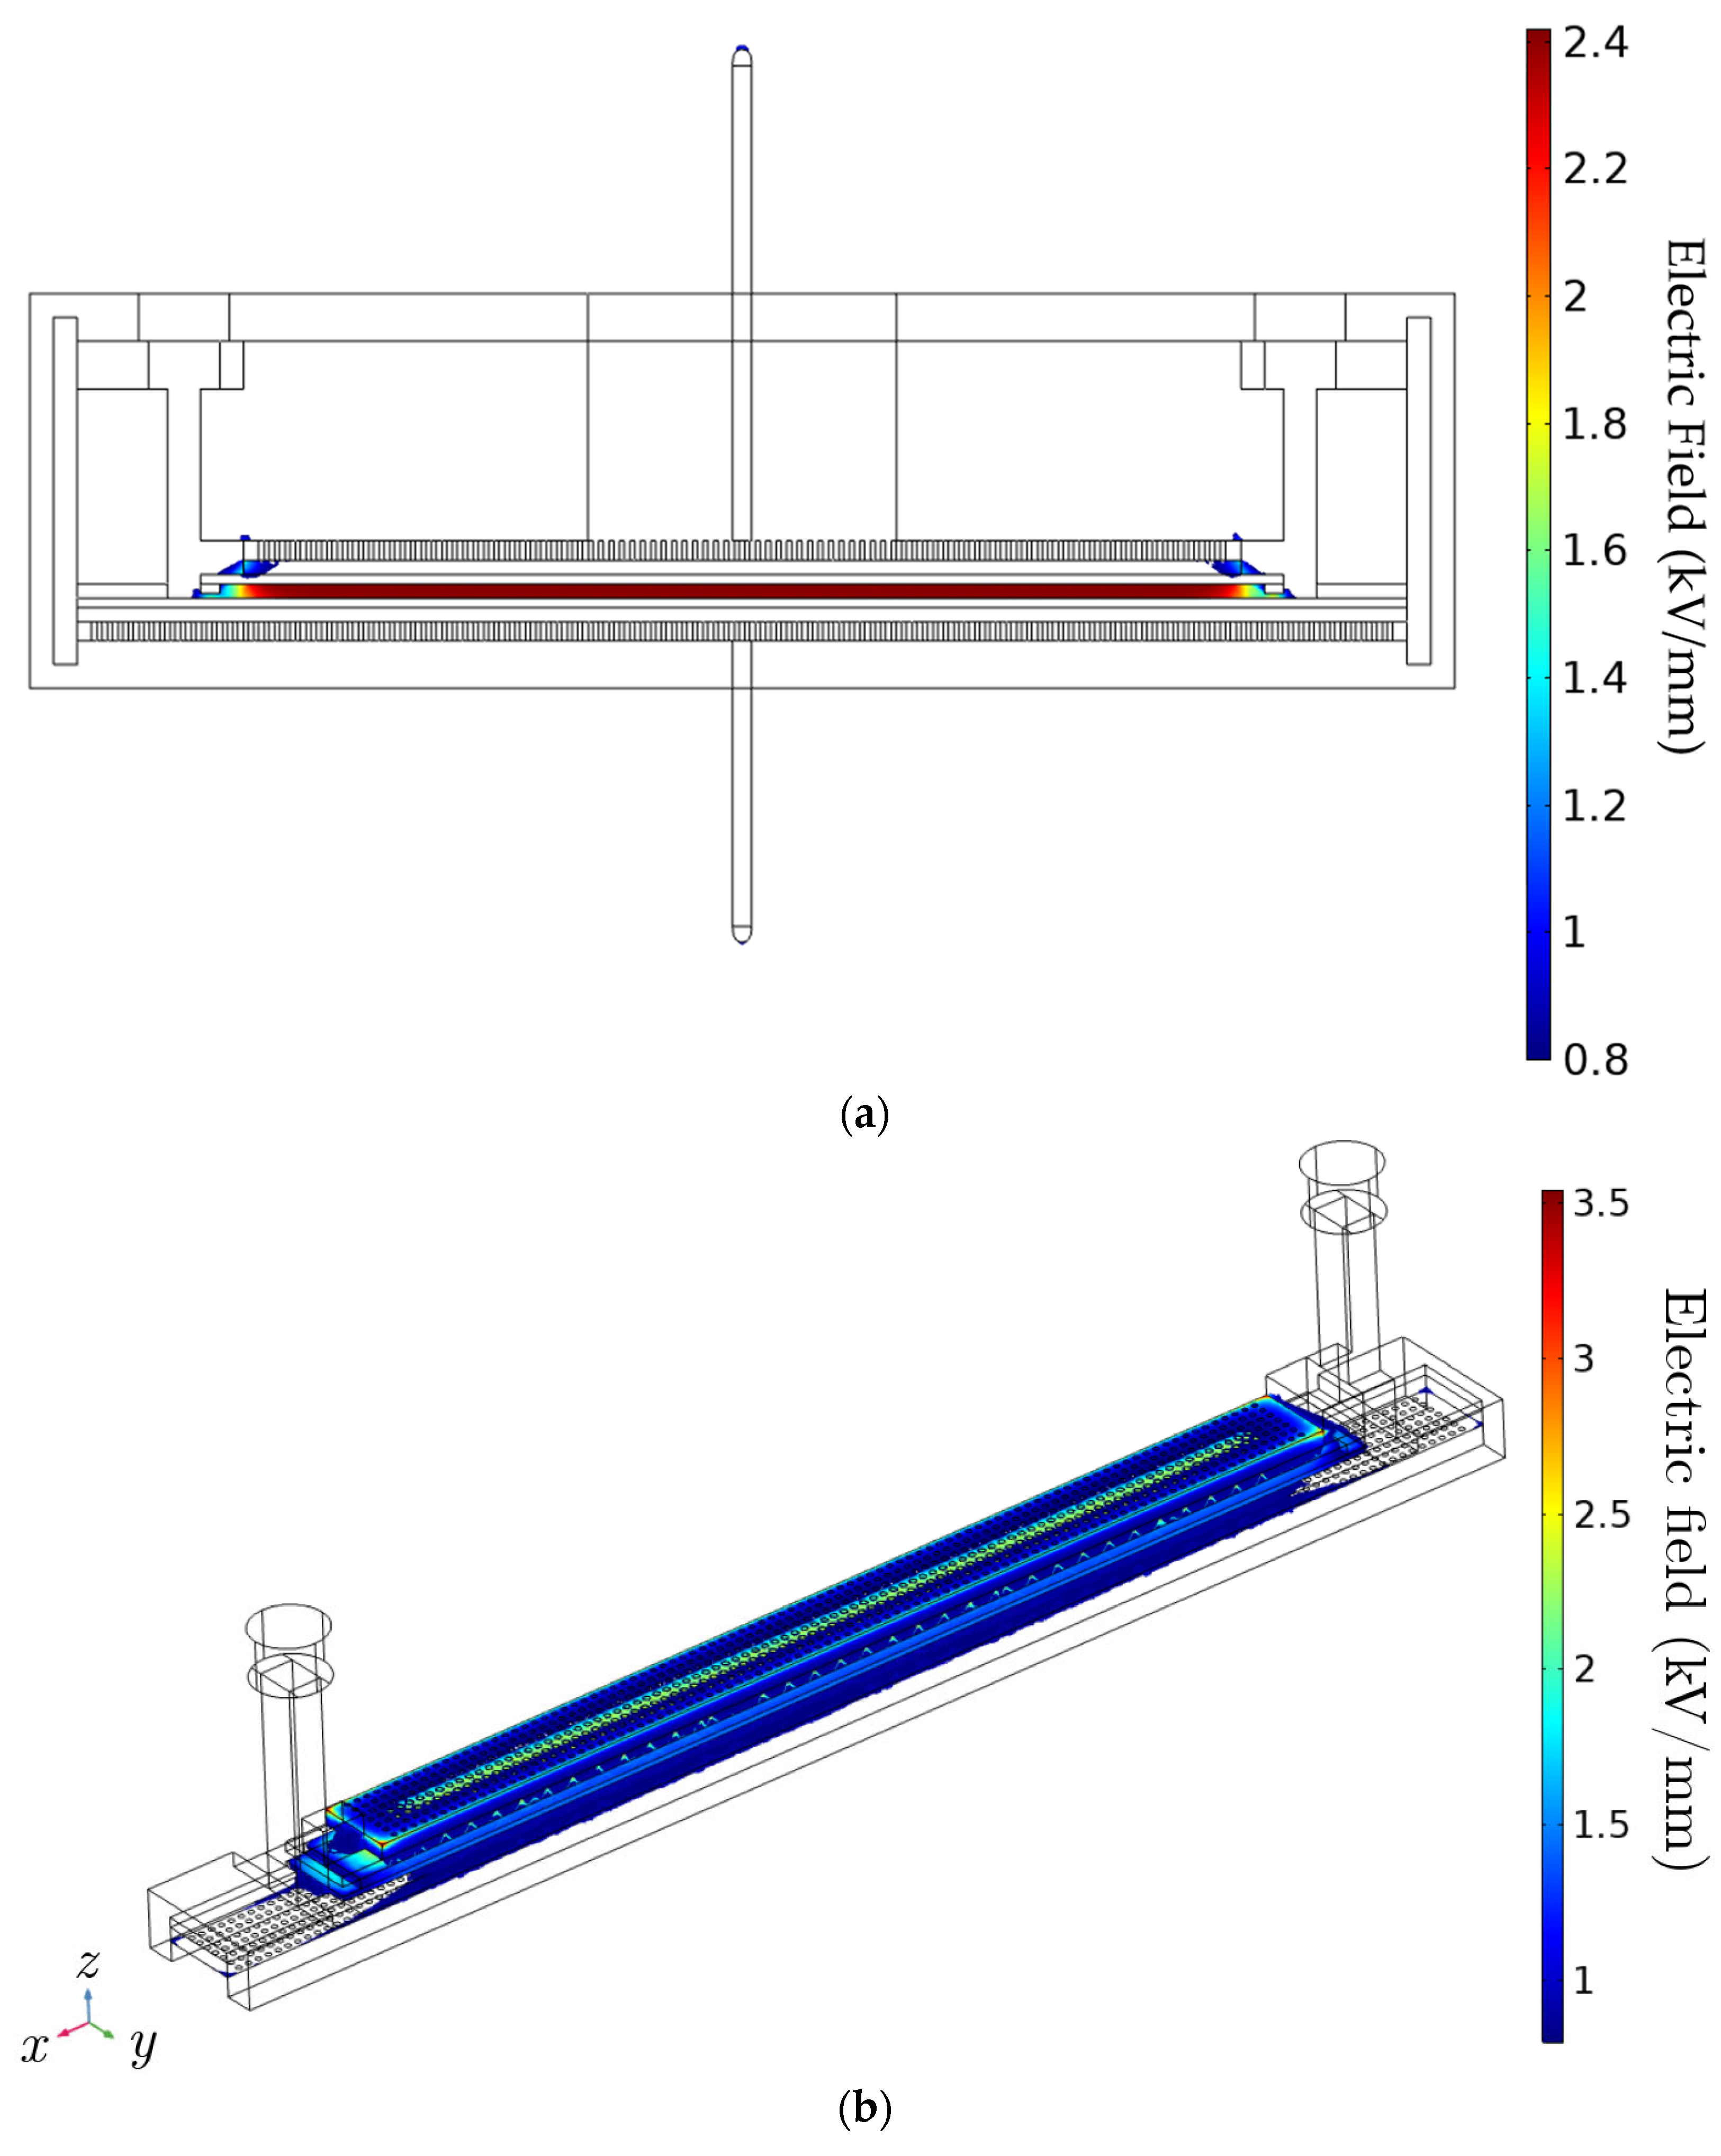
R ≠ 0, was delimited by analyzing the electric field distribution via electromagnetic simulations.
Figure 6 shows the computed electric field distribution above the level of 0.8 kV/mm for the input RMS voltage of 10 kV (oscillating at 60 Hz). The volumetric region where
R ≠ 0 was approximately delimited to the region shown in
Figure 6 in our fluid dynamics model. The estimated volume was V
O3 = 1.07 × 10
−5 m
3, which was used to compute
R from (5). By slowly increasing the voltage, we observed from the PRPD diagrams that micro-discharges in the chamber started to emerge with a minimum applied RMS voltage of approximately 1.75 kV, resulting in a maximum electric field strength slightly above 0.8 kV/mm in the air gap.
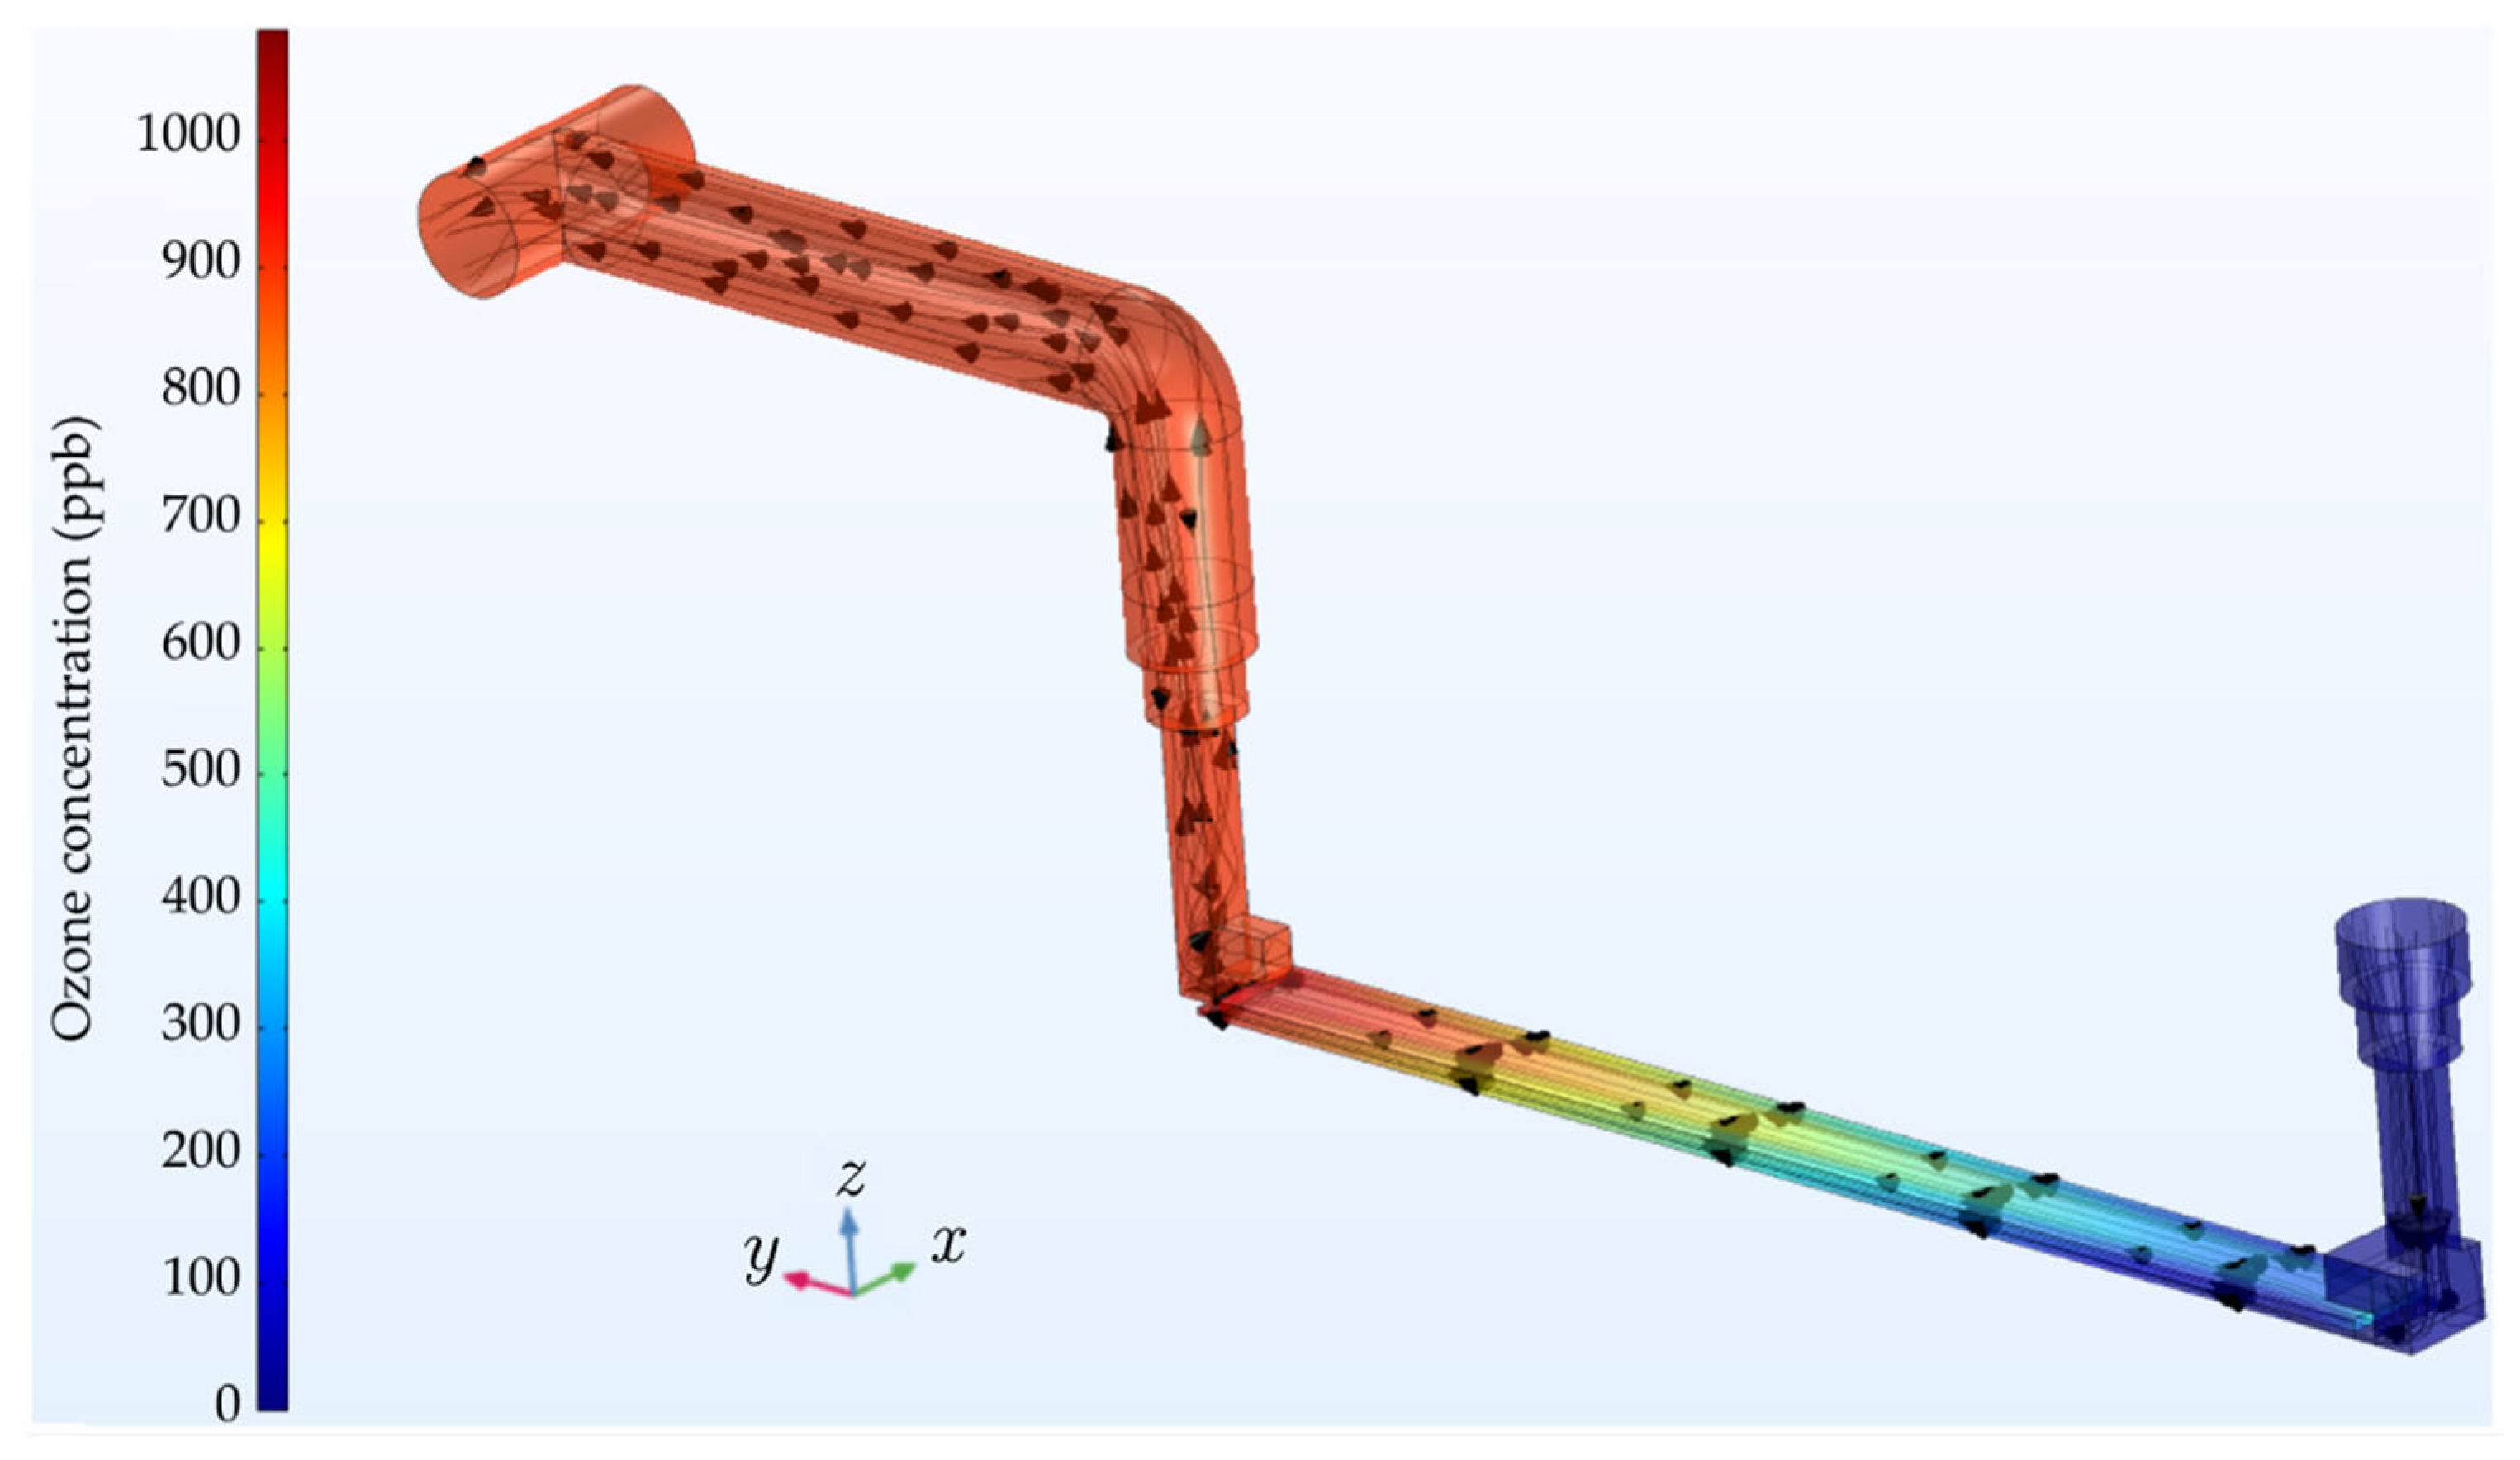
Figure 7 shows the airflow lines and the distribution of ozone concentration, obtained with the computational model for an RMS input voltage of 10 kV, oscillating at 60 Hz. In these simulations, the air velocity in the input valve was set to 2.46 m/s. In the air-gap region between the parallel glass plates, numerical output data indicate that the average air velocity increases to approximately 14.75 m/s. The experimental data were also used in the computational model to estimate the ozone reaction rate
R in the gap region where air ionization occurs.
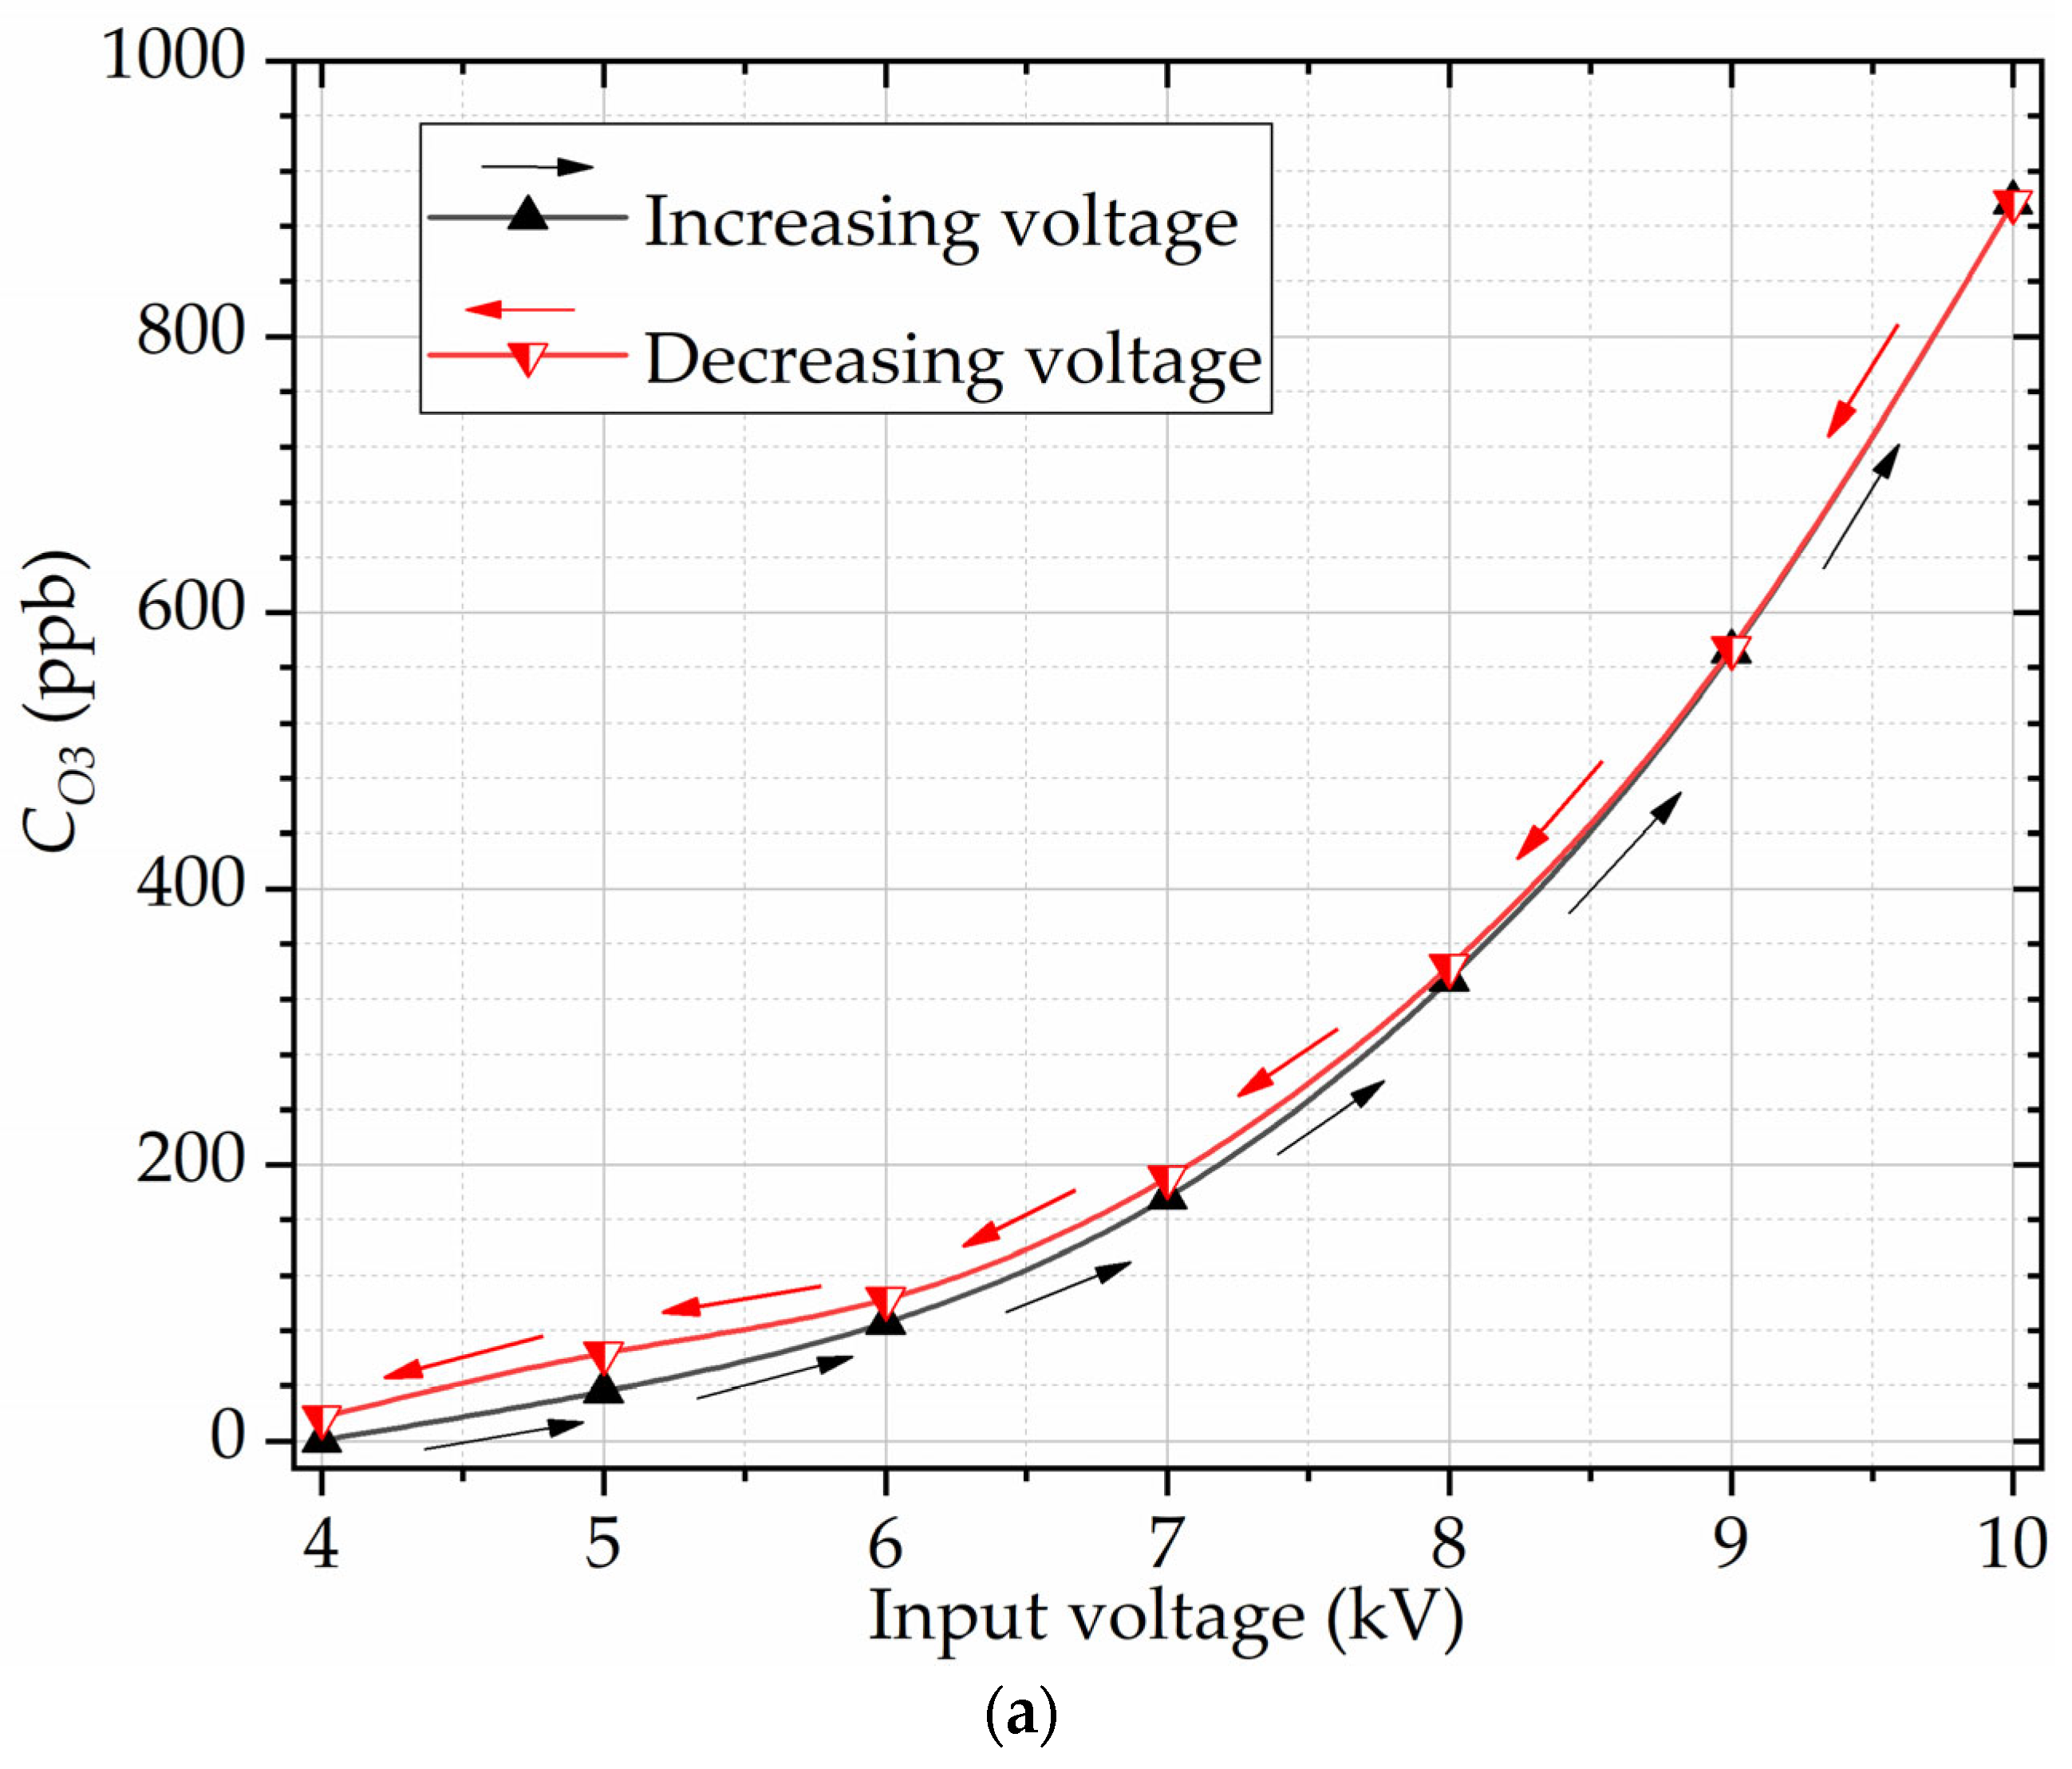
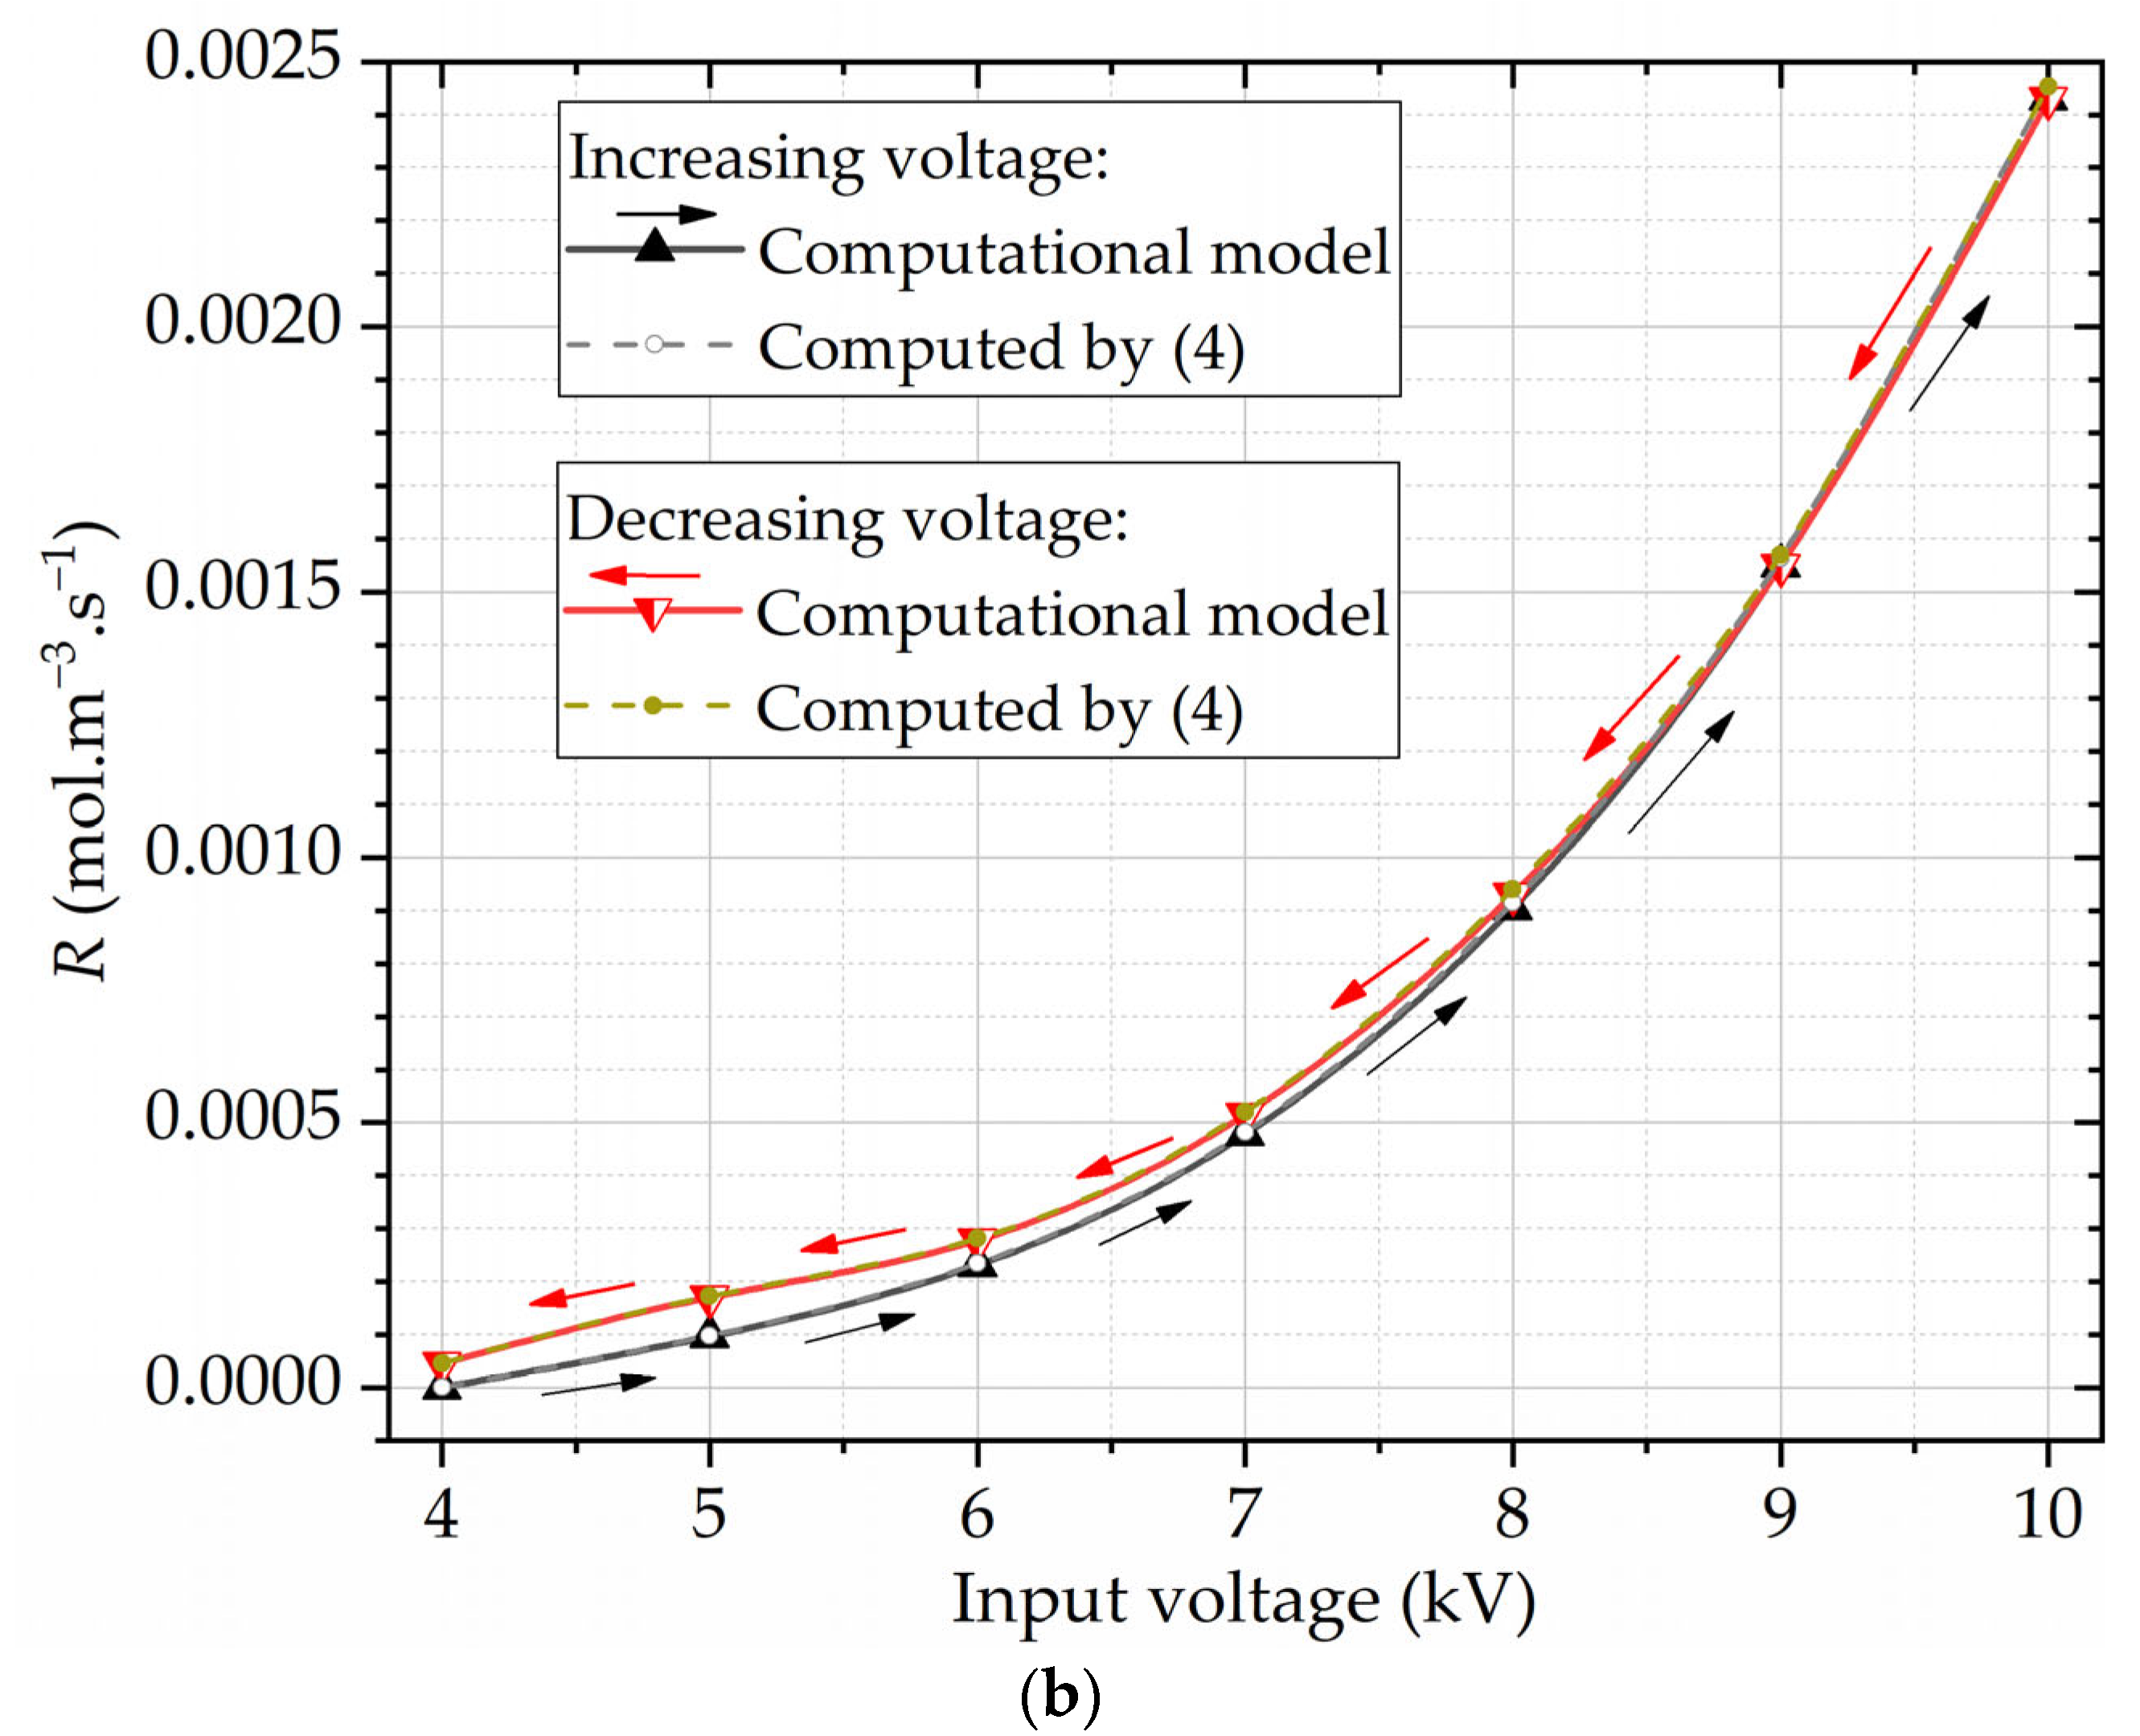
Figure 8 shows the ozone concentrations obtained experimentally and the parameter
R calculated as a function of the input voltage Δ
V. The parameter
R was also estimated using (5), derived in this work. The results in
Figure 8b show that the estimates for
R agree well with the ones obtained with the computational model.
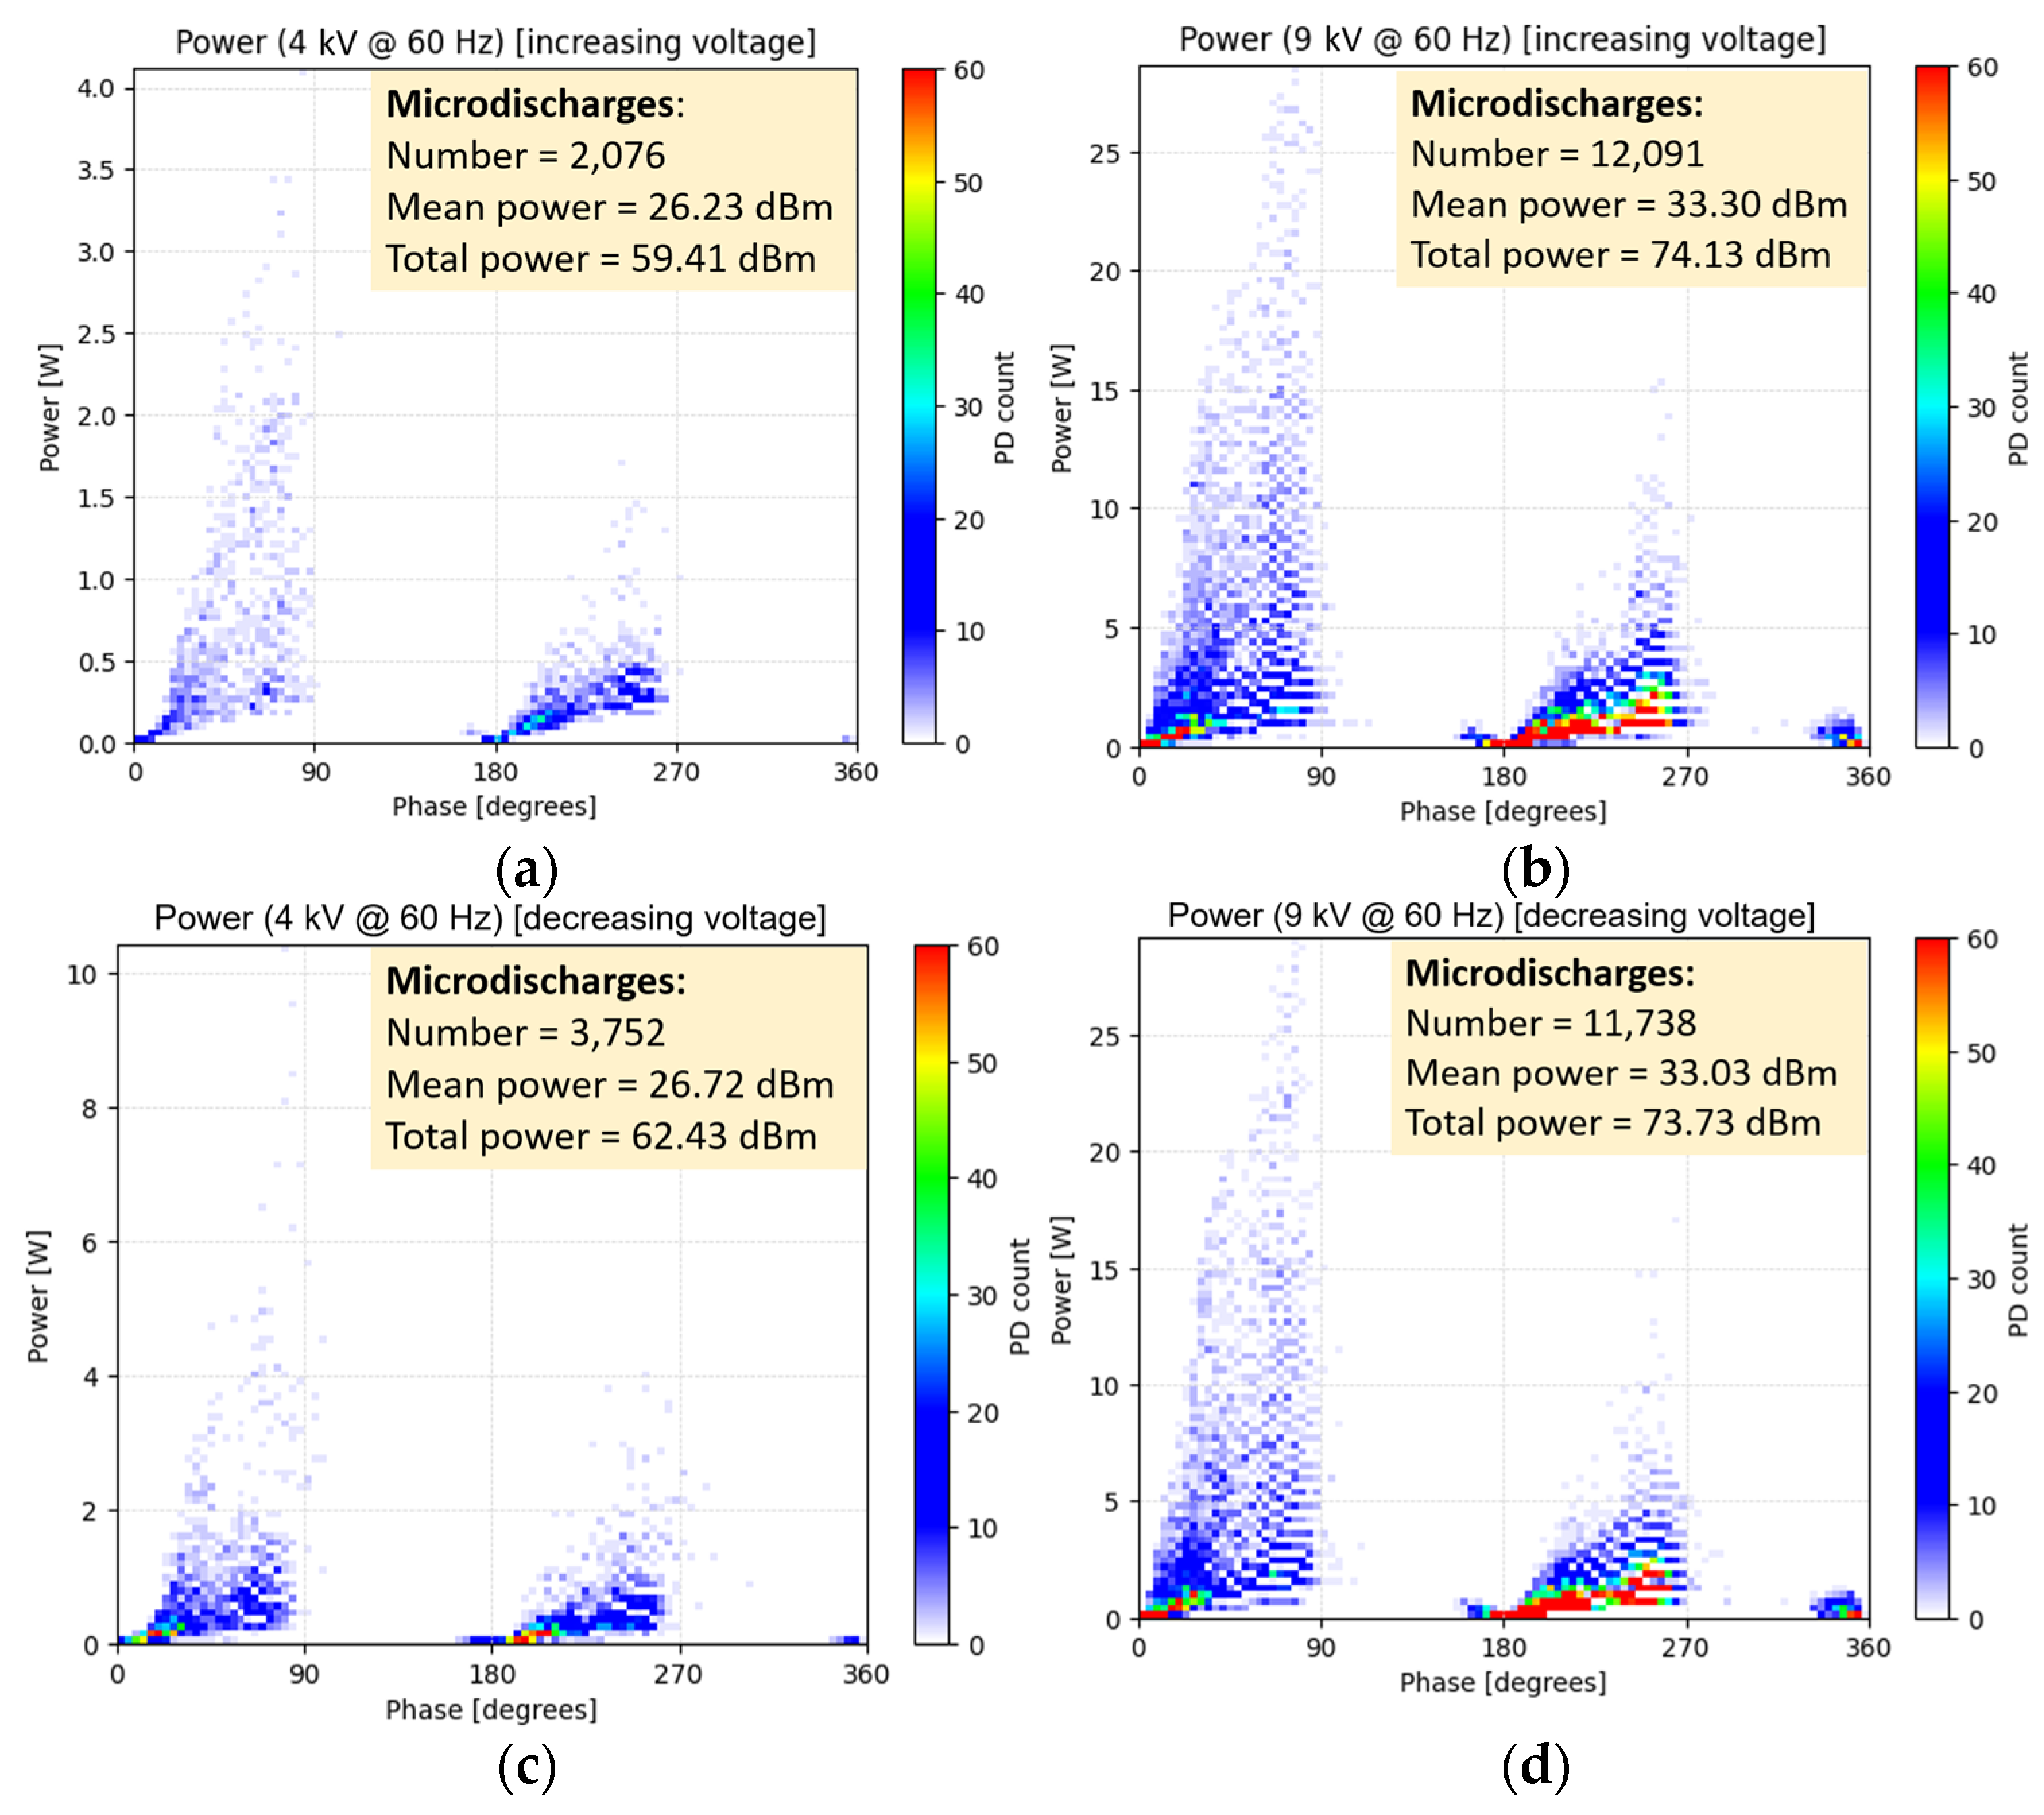
The PRPD measurements were carried out along the experiment to monitor the PD occurrences and their power for each 60 Hz input voltage level.
Figure 9 shows phase-resolved PD power maps obtained from PRPD data for the RMS voltages of 4 kV and 9 kV, during the rise and descent voltage regimes. The number of PD occurrences, mean PD power
PM, and total (cumulative) PD power
PT were calculated for each case. Those parameters were retrieved for all the input voltage levels from the PRPD measurements.
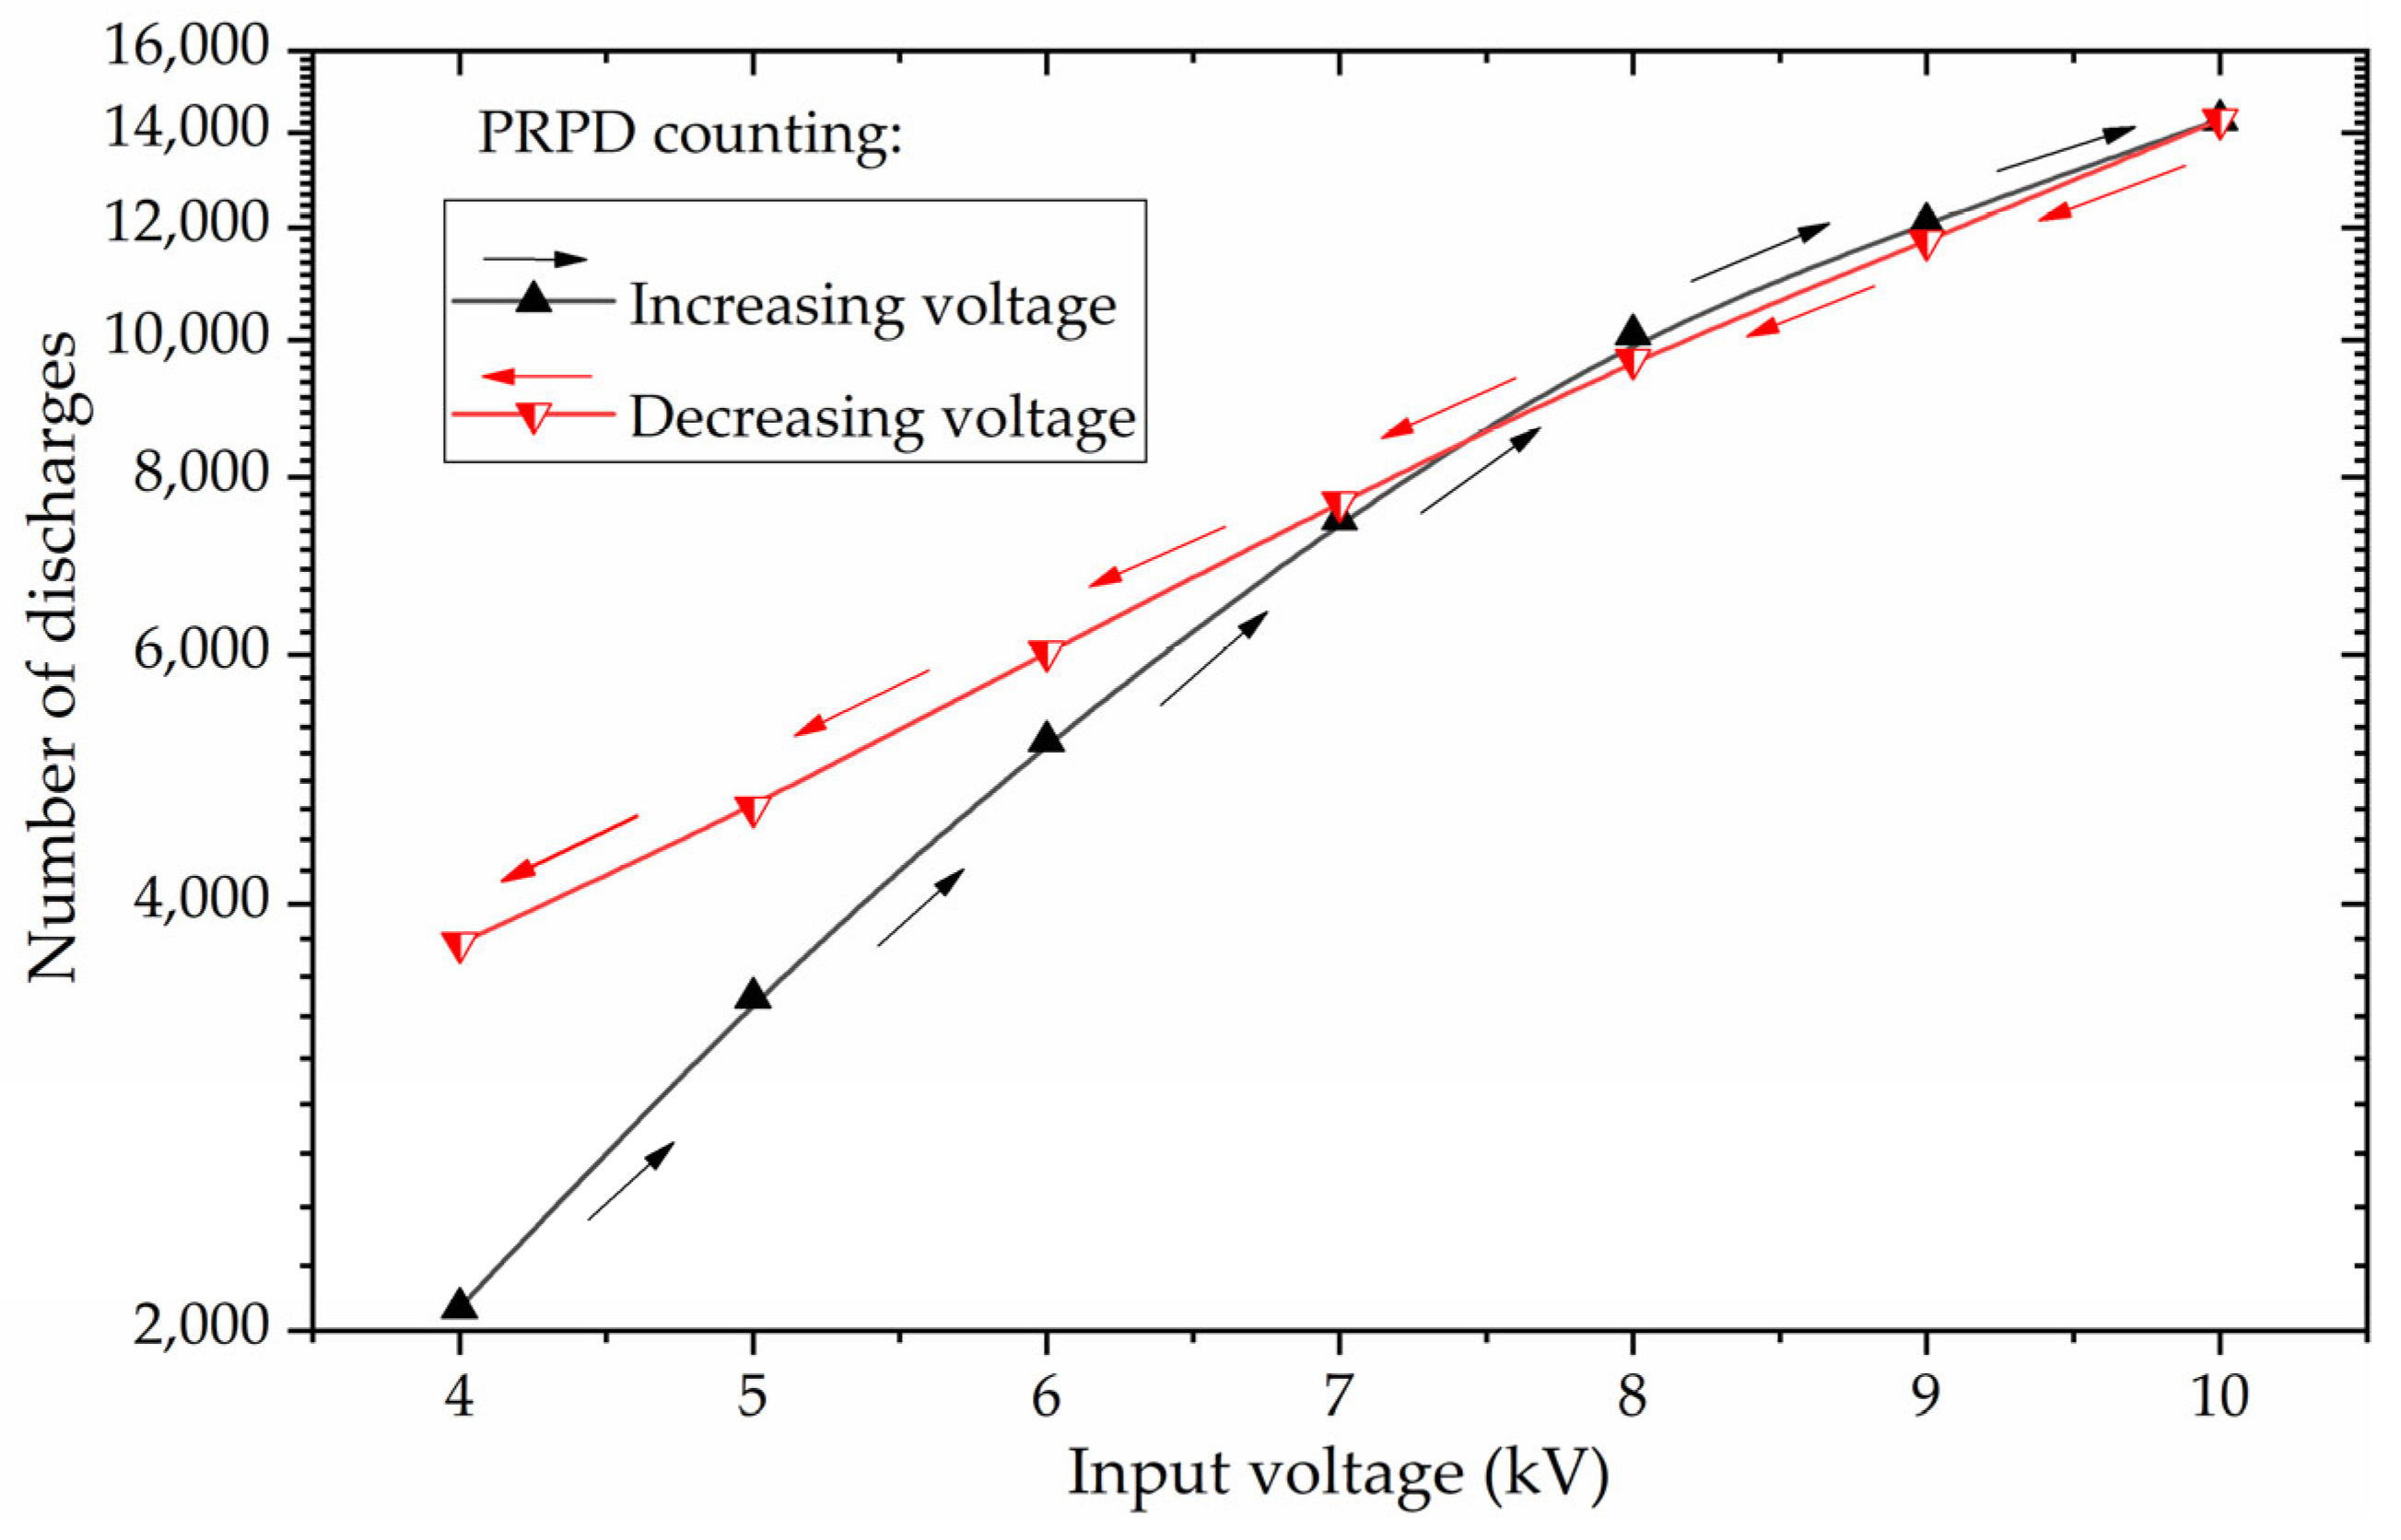
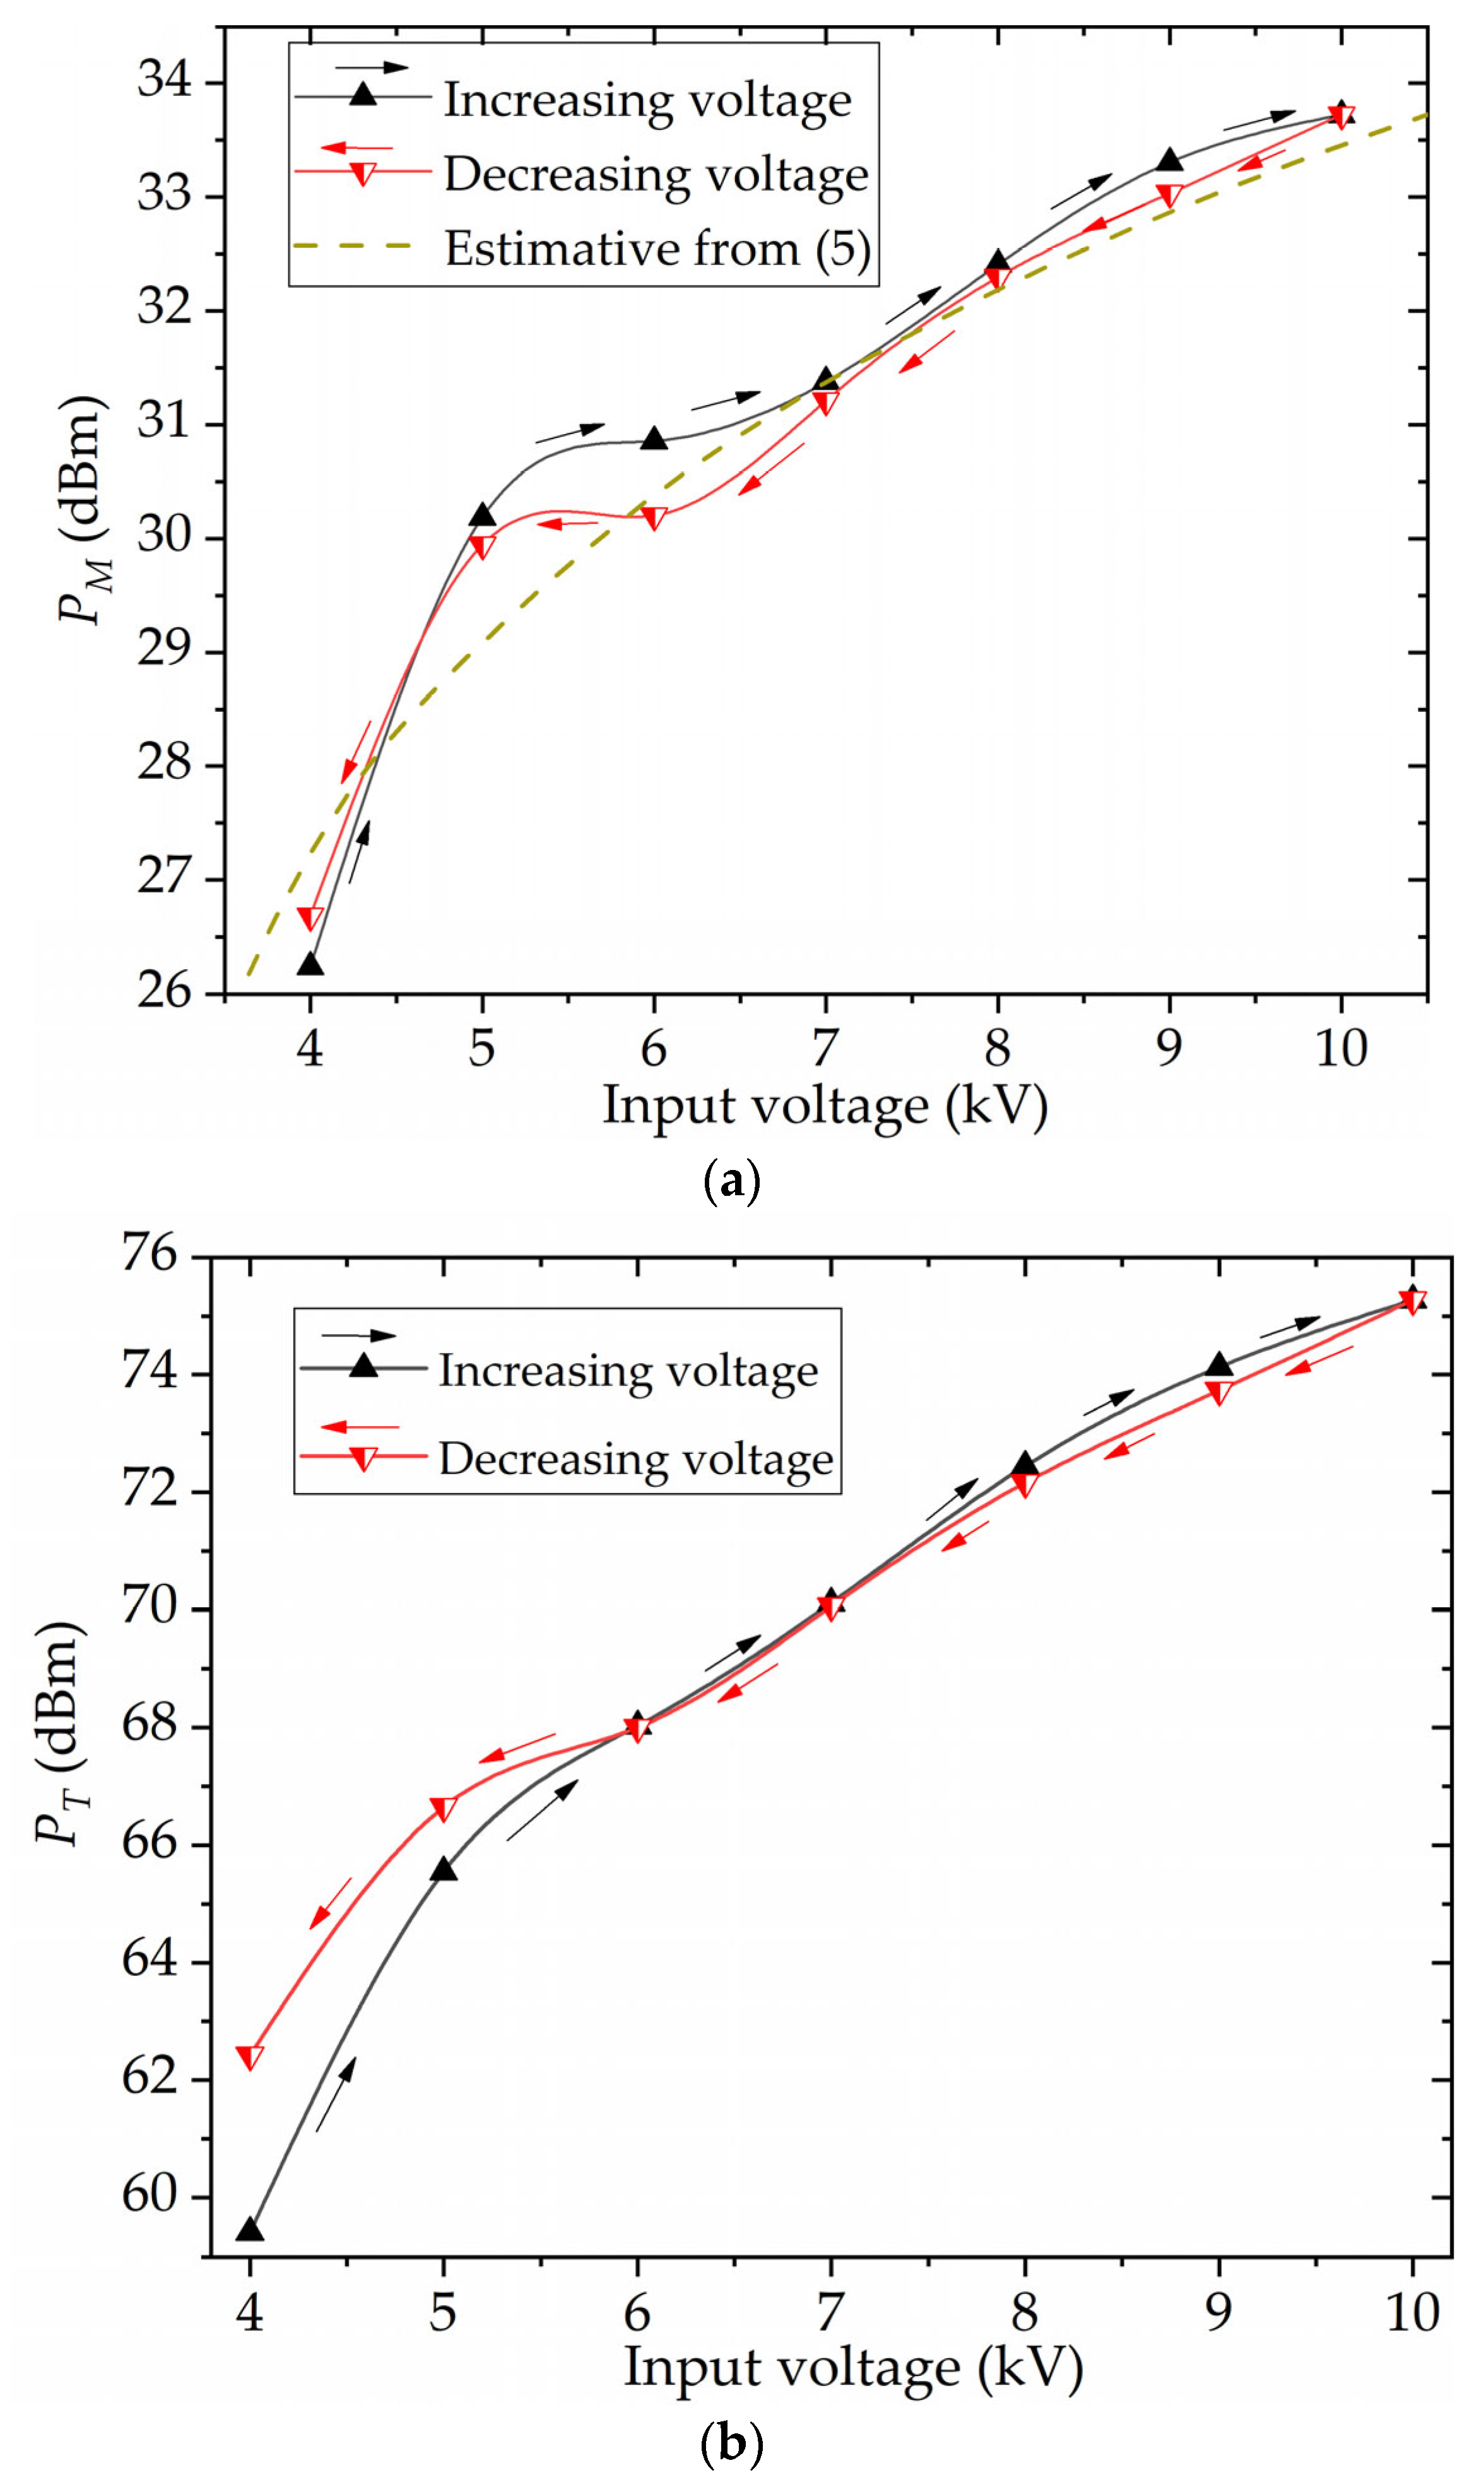
Figure 10 and
Figure 11, respectively, show the absolute number and the mean power of micro-discharges as the input voltage was increased and then decreased.
Figure 10 shows the number of micro-discharges in a time window of 120 cycles (2 s), when the count rate of micro-discharges over time had already reached a steady-state value for each voltage. If we take as reference a micro-discharge power of 2.36 W, which was the value obtained via the PRPD for the applied voltage of 10 kV, we have an energy value of 2.36 W × 2 s = 4.72 J, which is in the same order of magnitude of the energy per pulse value of 3.5 J obtained by Buntat in [
10] for an input voltage of 13 kV. In
Figure 11a, a mean power estimate obtained from (6) is also included (dashed line) for comparison. Equation (6) is an approximation formula derived in [
25] and does not account for hysteresis effects. The calculation of parameters used in (6) and (7) are detailed in
Appendix A. Furthermore,
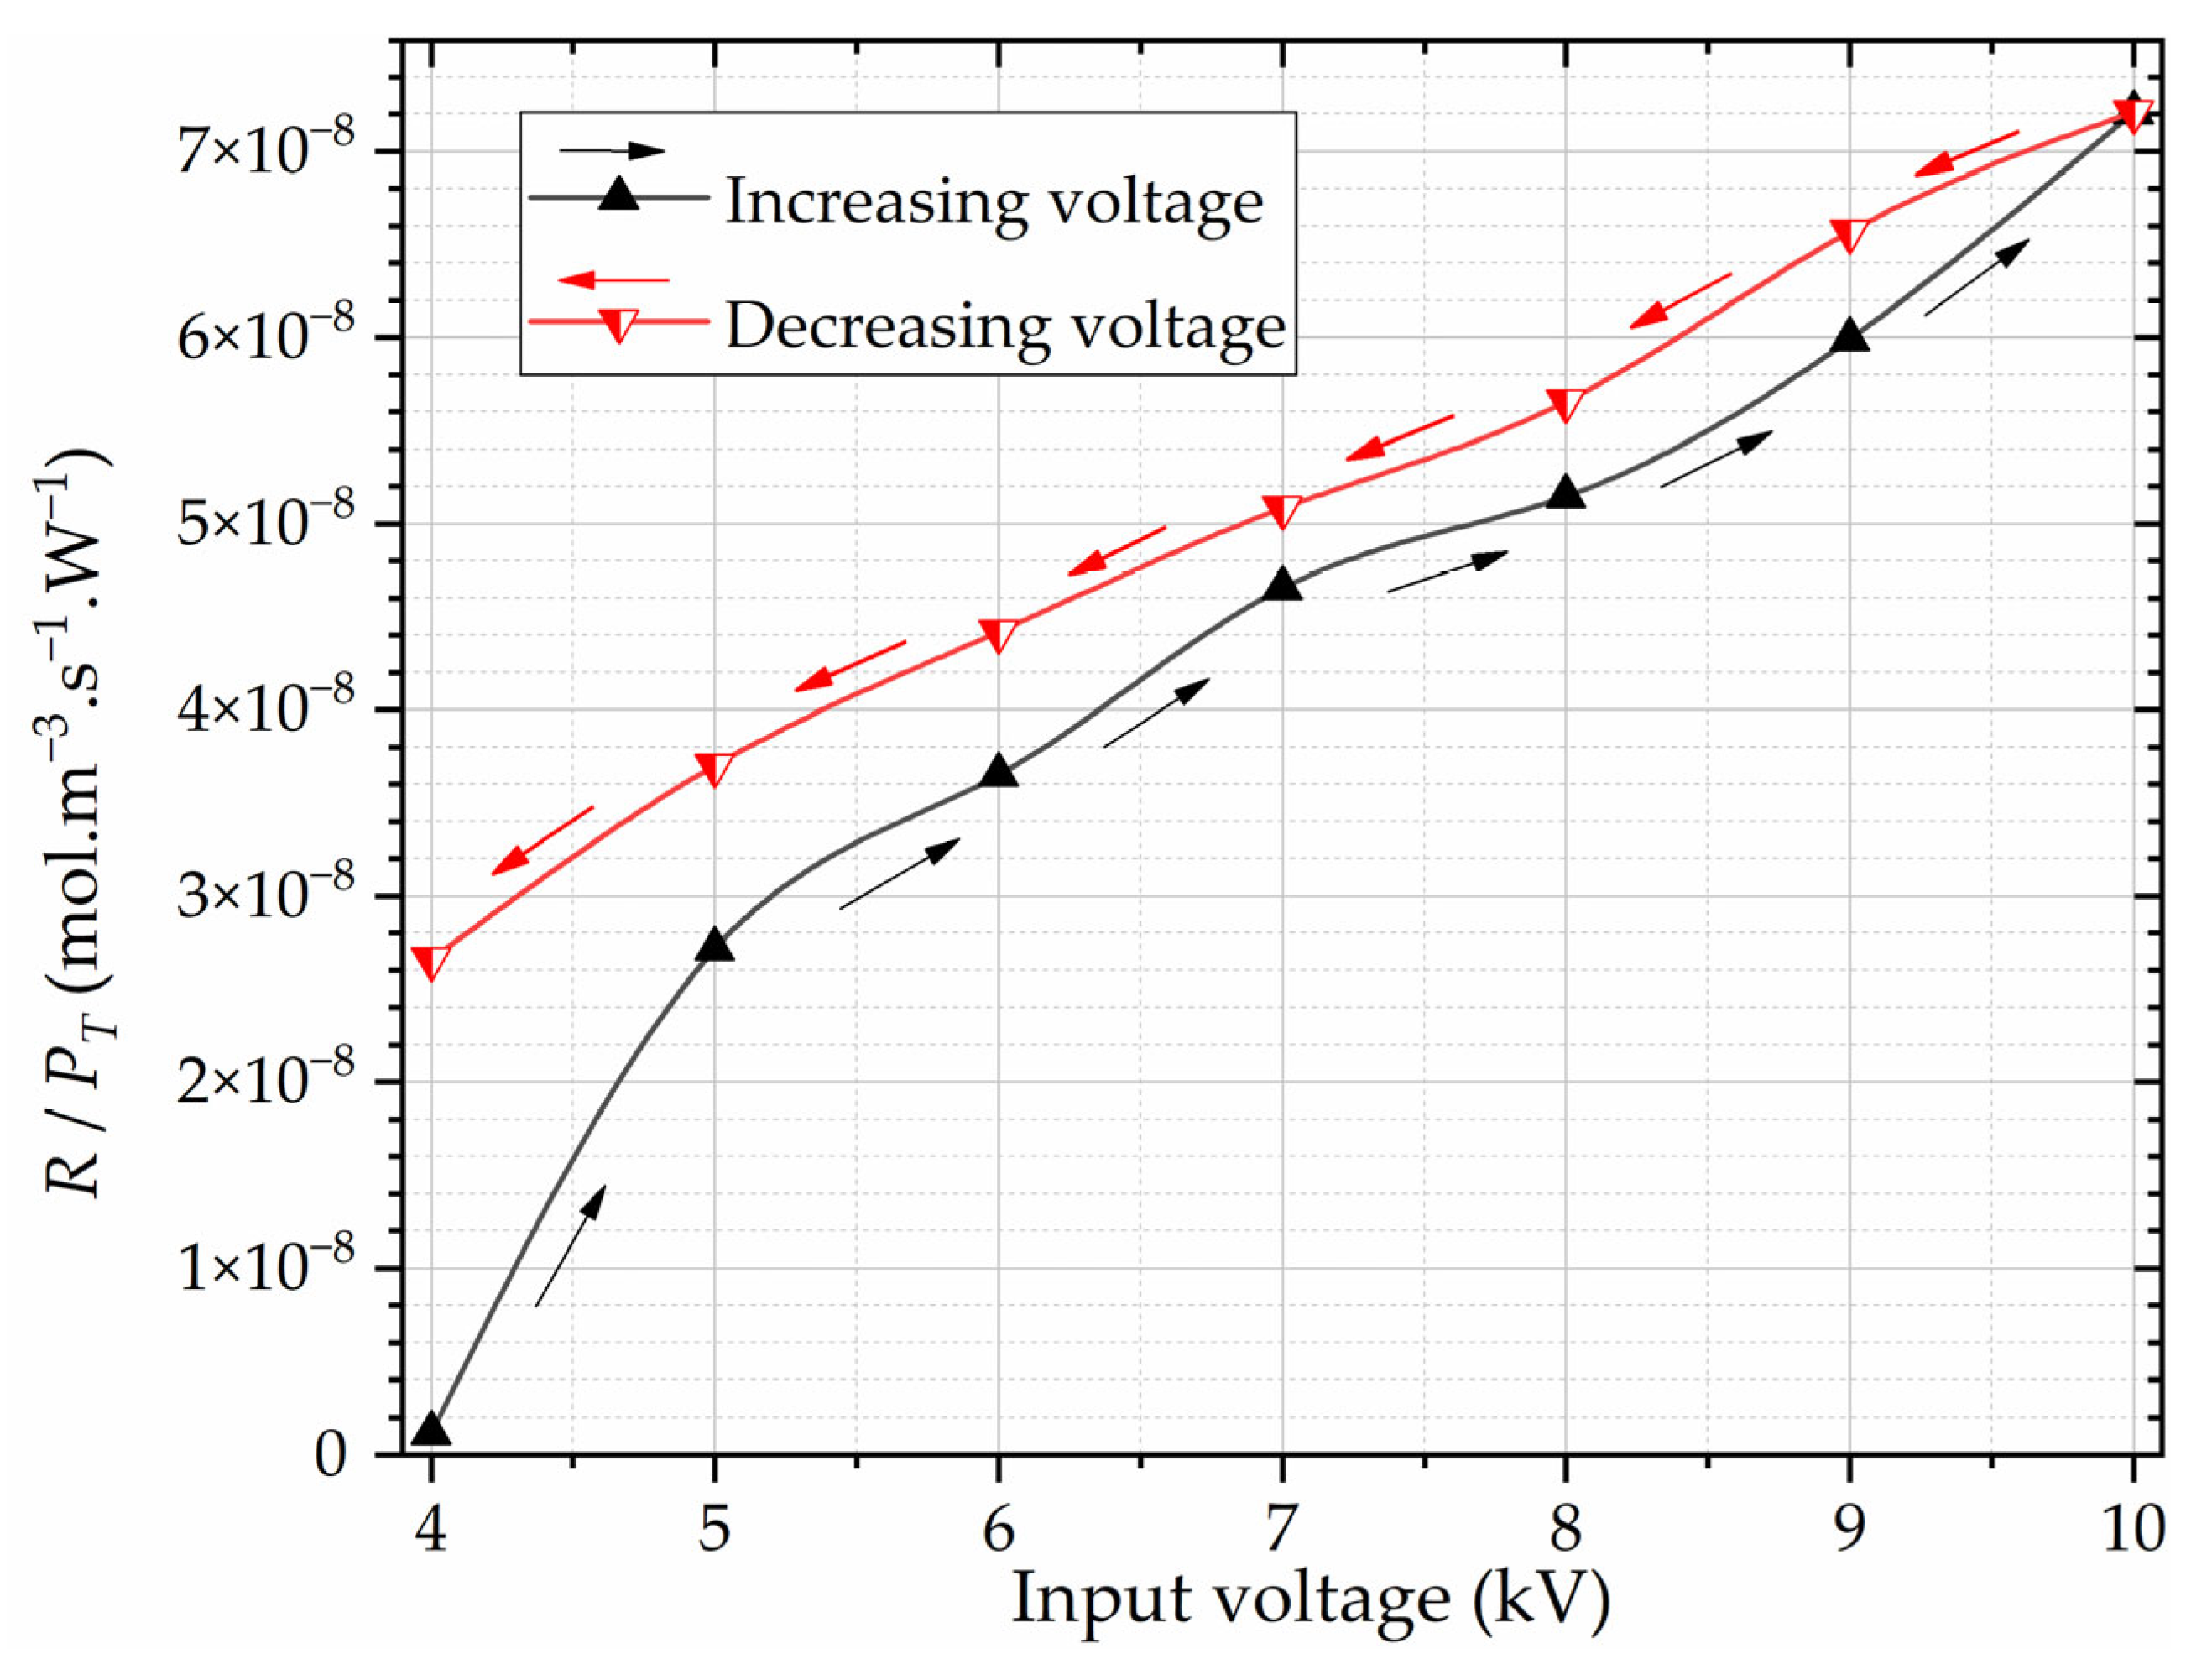
Figure 12 shows the ozone reaction rate per watt
R/
PT, obtained in the reaction chamber, as a function of the input RMS voltage, and
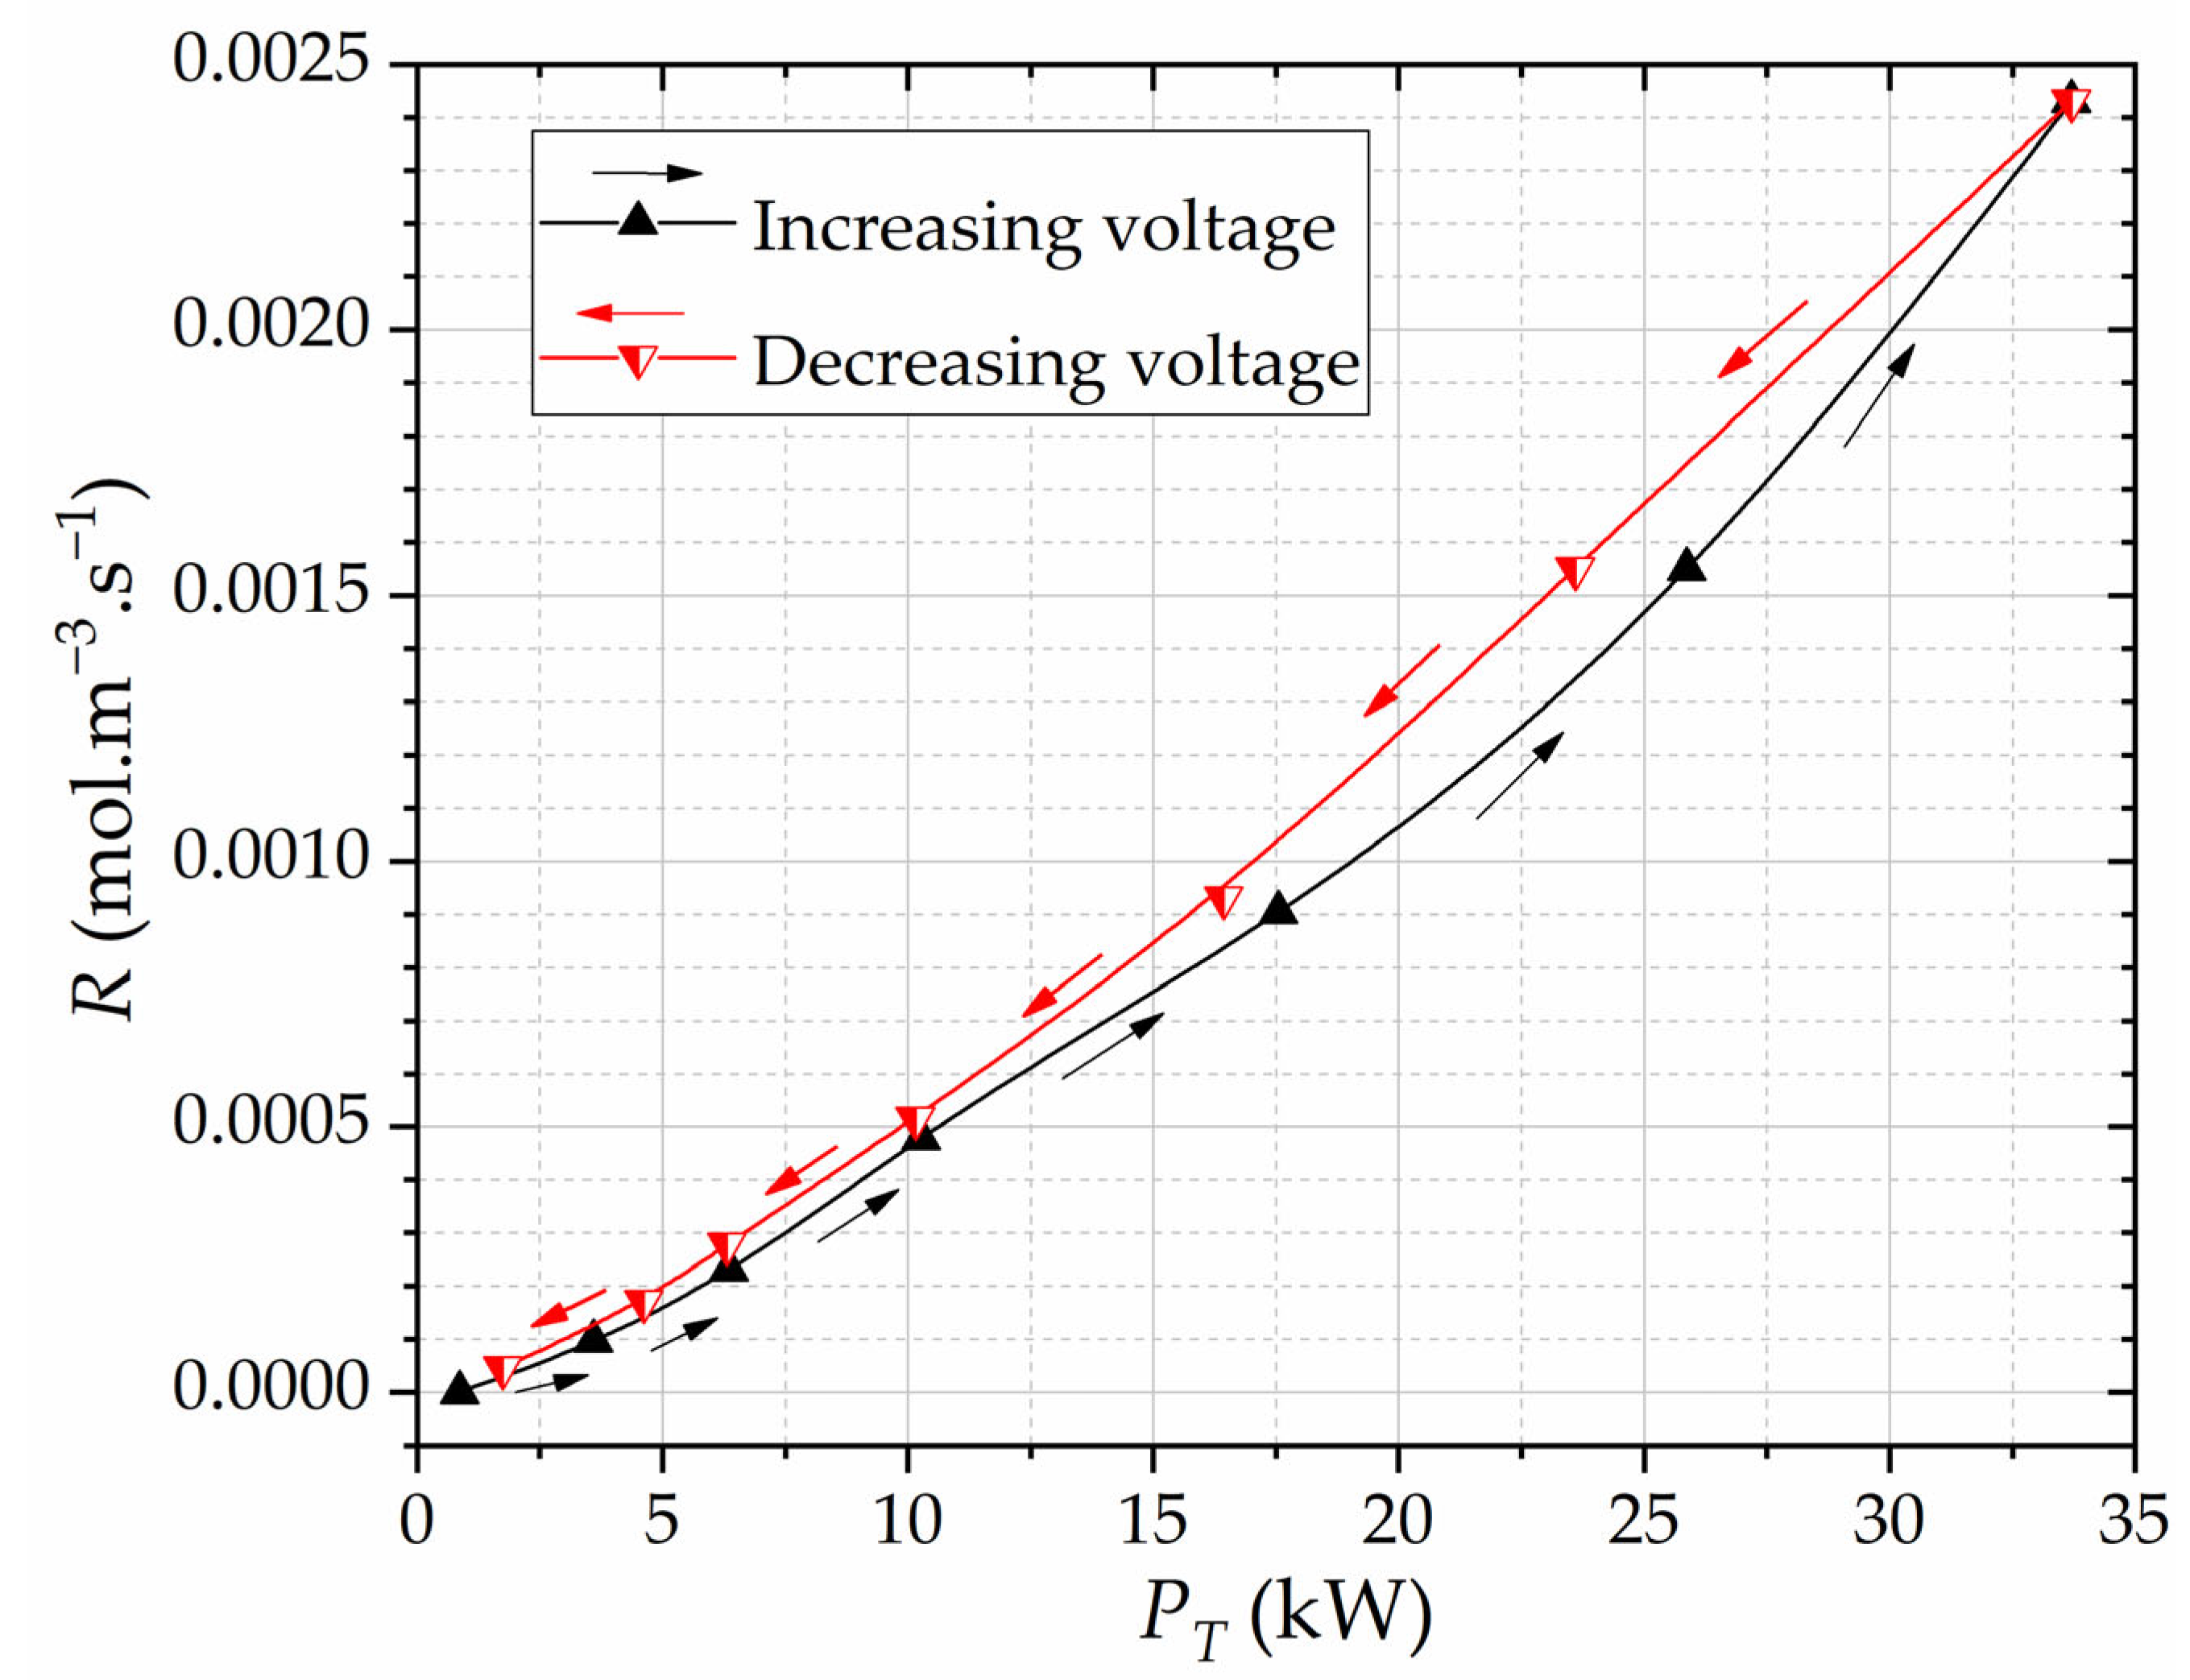
Figure 13 shows the reaction rate
R as a function of the total power of micro-discharges
PT.
4. Discussion
Throughout the course of the experiment, the ozone generated within the reaction chamber’s gap undergoes transport by means of both diffusion and advection, propelled towards the chamber’s output by the enforced airflow. This dynamic interplay results in the observed ozone concentration profile, graphically depicted in
Figure 7. Notably, the concentration profile exhibits an incremental trend in the direction of the airflow.
Figure 8 shows that the reaction rate for ozone generation increases exponentially with the input voltage. Hysteresis phenomena manifest across measured and calculated parameters: the output ozone concentration, the power of partial discharges, and the absolute count of the PD events. Specifically, when the input RMS voltages are maintained below 8 kV, the ozone concentrations within the voltage-decreasing regime marginally surpass the concentrations measured during the voltage-increasing regime, as seen in
Figure 5a and
Figure 8a. This behavior extends to the computed reaction rates, as depicted in
Figure 8b. In
Figure 5a, we also observe that there is a strong correlation between the output ozone concentration and the number of micro-discharges. Note that the steady-state of ozone concentration is reached at each time window (
Figure 5b) and, under such condition, the hysteresis effect is observed.
For an input RMS voltage of 9 kV in both increasing and decreasing voltage regimes, the corresponding PRPD power diagrams remain remarkably consistent (
Figure 9), as does the count of gap PDs (
Figure 10). Nevertheless, for RMS voltages below 8 kV, a distinct behavior emerges. In the decreasing voltage regime, the count of PDs demonstrates a gentler slope compared to the steeper incline observed in the increasing voltage trajectory. The hysteresis effect is vividly depicted in
Figure 10 and
Figure 11, illustrating the interplay between the count and power of the PDs, as also seen in
Figure 5a for the ozone concentrations and the PDs count. Notably,
Figure 10 and
Figure 11b reveal an important pattern: when input voltages are maintained below 8 kV, the number of partial discharges is higher during the decreasing voltage variations compared to the instances when the voltage is increasing, which is consistent to what is seen in
Figure 11b for the total PD power
PT. In contrast, we see that the mean power of the PDs
PM for the decreasing variations of the input voltage remained mostly lower than for the increasing variations, which does not seem to agree to the ozone concentration profile seen in
Figure 8a. Thus, we see that
PT has a stronger correlation with the experimental chamber output ozone concentration
CO3. Note that
R as a function of the RMS voltage has a similar profile to that of
CO3, as shown in
Figure 8b.
We may derive further interesting conclusions by analyzing the rate
R/
PT as a function of the RMS voltage and
R as a function of
PT. From
Figure 12, we note that the hysteresis is more evident in the analysis of the ozone concentration per watt. The calculated rate
R/
PT also becomes almost linear with the input voltage when the voltage is increased from 5 kV onward, and it remains linear for all the considered decreasing voltage range. During the entire voltage decreasing regime, the rate
R/
PT assumes higher values than during the increasing voltage proceeding.
The hysteresis response in
Figure 13 for
R(
PT) shows that, in the decreasing voltage procedure, a given amount of micro-discharges power is related to a slightly higher ozone production. Note that
R(
PT) is quasi-linear (especially in the voltage decreasing regime) and, for the lowest voltage in both regimes, the total PD power reduces significantly to the point that ozone production becomes near zero, forming then practically closed hysteresis loops in
Figure 8 and
Figure 13.
There seem to be no reports in the literature that deal directly with the estimation of the reaction rates for DBD structures. However, ozone generation is usually expressed in terms of ozone production yield, which increases with power and may reach saturation or a peak at a given voltage or power, as shown in [
31]. This behavior qualitatively agrees with the data shown in
Figure 13, where the reaction rate increases with the total power of micro-discharges, except for the fact that we did not observe ozone production saturation within our considered input voltage range.
Finally, in [
32], a hysteresis effect on a dielectric-barrier discharge structure was investigated, where the authors reported differences in the pulse repetition frequencies (PRF) of the initiating and extinguishing boundaries of the micro-discharges. According to [
32], excited and metastable particles are produced in the excitation process. Excited particles are unstable because they emit energy back in the form of radiation photons to the ground state. Once the excited particles rise to the metastable state, they cannot spontaneously jump to the ground state, so the metastable particles have a relatively long lifetime. The authors of [
32] affirm that these metastable species could survive and lead to a memory effect. This effect may also be responsible for the observed hysteresis in our results, as, in
Figure 10 and
Figure 11b, we note that the number of micro-discharges and total PD power
PT become higher for the decreasing voltage regime, affecting the measured ozone concentration (which follows a similar pattern, as seen in
Figure 8a). In this case, the air region already has a greater density of such excited metastable particles that may affect the number and mean power of micro-discharges. Therefore, this characteristic leads to the nonlinear electrical properties of the air medium between the dielectric layers of the reaction chamber.
5. Conclusions
In this work, experiments were carried out in an acrylic reaction chamber to analyze ozone generation as a function of 60 Hz electric voltage applied to the chamber terminals and PD power. A CFD model for representing chamber geometry was developed using a finite-element-based software to analyze the ozone concentration distribution inside the chamber subjected to airflow. The ozone reaction rates were computed with the aid of the CFD model in conjunction with the obtained experimental data. The experiment allowed the measurement of ozone concentrations at the chamber’s outlet for an input gauge pressure of 0.1 bar and specific levels of the input voltage.
Our analysis shows details of the role of input voltage in influencing ozone generation dynamics, revealing the emergence of hysteresis effects across critical parameters, including ozone concentration, total PD power, and count of PD occurrences. Notably, the ozone concentrations in the voltage-decreasing regime surpass their voltage-increasing counterparts, a phenomenon especially pronounced for the RMS voltages below 8 kV. This behavior echoes in the experimentally measured total PD power PT and PD count, as well as in the calculated ozone reaction rates.
By further scrutinizing the PRPD data, we discern the remarkable consistency of the PD power diagrams and gap PD counts for RMS voltages at 9 kV. However, for diminishing RMS voltages, distinctive trends come to the forefront, where the PD counts exhibit gentler slopes within the voltage-decreasing regime. Moreover, an exploration into the rate R/PT as a function of RMS voltage and R as a function of PT unveils interesting patterns. Particularly notable is the amplification of the visibility of hysteresis effects when investigating ozone production per watt. The calculated rate R/PT demonstrates a certain level of linearity as the input voltage escalates beyond 5 kV, showcasing the profile of the interdependence of total PD power and ozone production. These observations culminate in the understanding of the pivotal role played by cumulative (total) PD power PT, extracted from PRPDs, in defining ozone production dynamics. In particular, the function R(PT) sheds light on the dependence between the total PD power and the resultant ozone generation. We may thus say that each micro-discharge contributes to the measured ozone concentration. Furthermore, the strong reduction in PT at lower voltages leads to a virtually negligible ozone production, effectively delineating closed hysteresis loops. R(PT) is quasi-linear, especially during the voltage reduction regime.
In future works, we aim to investigate the effect of the distance between the dielectric barriers on the ozone reaction rate R. Future experiments and simulations will also be carried out using a larger reaction chamber to analyze ozone generation from an energized stator bar. The intention is to analyze multiple types of stator bar defects at different severity levels.


 ,
, 


