Article

A New Method of Building Envelope Thermal Performance Evaluation Considering Window–Wall Correlation

1
School of Mechanical Engineering, Tongji University, Shanghai 201804, China
2
College of Architecture and Urban Planning, Tongji University, Shanghai 200092, China
3
School of Civil Engineering, Guangzhou University, Guangzhou 510206, China
*
Author to whom correspondence should be addressed.
Energies 2023, 16(19), 6927; https://doi.org/10.3390/en16196927
Submission received: 6 September 2023 / Revised: 26 September 2023 / Accepted: 28 September 2023 / Published: 2 October 2023
(This article belongs to the Section G: Energy and Buildings)

Abstract

:
This study proposes a new method to accurately evaluate the overall building envelope thermal performance considering the window–wall correlation, providing a new tool for building thermal design. Firstly, a non-stationary room heat transfer model is established based on the Resistance-Capacity Network method. The influence of solar heat gain through the windows on the heat transfer process of the walls in the actual environment is considered, and the room’s integrated thermal resistance and integrated heat capacity indexes describing the overall room thermal resilience performance are proposed. Then, a field research test is conducted around Lhasa to obtain the local dwelling information, climate conditions, and indoor thermal environment. Numerical simulations using EnergyPlus are made to verify the effectiveness of the indexes in describing the overall building (maximum difference within 3.67% MBE and 2.92% CVRMSE) based on the field test results. Finally, the proposed envelope thermal performance index is used to analyze the local residential buildings around Lhasa. The results show that the lack of consideration of window–wall correlation has led to the failure of a local newly built building’s actual envelope performance to meet the design requirements. These findings could help to develop the thermal design method of the building envelope.

1. Introduction

In recent years, the world’s energy consumption has been increasing, and energy shortages and environmental degradation are worsening. Effectively reducing energy consumption has become a common challenge for all countries worldwide. As a resource-intensive and energy-consuming industry, the energy consumption of the construction industry occupies an increasingly large proportion of the total energy consumption of society [1,2]. The energy consumption of buildings in some developed countries has reached about 40% of the total energy consumption. Rapid economic development has brought about a continuous increase in the total number of buildings and a continuous improvement in residents’ living standards. People’s demand for a more comfortable indoor environment is also growing, with a greater reliance on heating and air conditioning systems [3], leading to a steady increase in the energy consumption of buildings. Energy supply capacity is gradually struggling to meet the growing demand for energy consumption.
Heating and air conditioning is the largest energy consumption point of a building [3], and its primary purpose is to address the air cooling and heating loads formed by indoor and outdoor disturbances (outdoor climate conditions and indoor occupancy, equipment, and lighting) acting on the building. The disturbances form loads by working directly on the indoor air or indirectly on the building envelope [4,5,6,7]. On the other hand, reasonable passive design of buildings (including night ventilation, passive solar energy utilization, etc.) can also reduce the reliance on heating and air conditioning [8,9,10]. As a medium connecting the indoor and outdoor environments of a building, the envelope structure accounts for 50–60% of the heat exchange in a room [11]. Its thermal insulation and storage capacity significantly affect the formation of cooling and heating loads. The envelope structure design is also an essential part of the passive design of a building. Therefore, reasonable envelope design is the key to further reducing heating and air-conditioning energy consumption.
How buildings respond to different regions and climate conditions is constantly changing with the development of the economy and technology. Scholars have concluded in their studies of traditional buildings that in dry and hot regions, heavy envelopes and shading measures were designed to insulate heat and cool the building [12,13,14]; in cold regions, the thermal insulation properties of heavy mass envelopes are utilized to minimize indoor heat loss [15,16,17]. In hot and humid regions, lightweight walls are used in combination with natural ventilation to reduce indoor air temperatures [14,18,19]. For modern buildings, high-performance buildings represented by passive houses, ultra-low-energy buildings, and nearly-zero-energy buildings minimize heat loss through super-insulation and air tightness [20,21,22]. From the construction of traditional buildings to the development of modern energy-efficient buildings, the envelope design has changed from simply resisting natural disasters to adapting to each region’s climate. The envelope’s performance has changed from thermal insulation and storage adapted to the local corresponding climate conditions in traditional buildings to emphasizing the thermal insulation performance in terms of modern buildings. The building envelope has always been the most essential technological carrier to cope with different indoor and outdoor environments.
Envelopes can be categorized into non-transparent and transparent parts. The above study focuses more on the role of the non-transparent envelope (wall) in “separating” the building’s indoor and outdoor environments. The transparent envelope, i.e., windows, is also an important part. A window plays the role of “connecting” the indoor and outdoor environments in a building. The window’s transparent nature allows 30% higher heat gain or loss [23,24], which in turn affects the heating or cooling load of any building [25,26]. For example, De Masi et al. [27], in a study to quantify the impact of different window designs on energy consumption and visual comfort in European office buildings, found that the use of triple low-emissive windows can further save energy by 35% in oceanic and continental climates.
Many scholars have studied the performance, impact, and optimal design of walls and windows under various scenarios and conditions, respectively. However, according to the room heat balance theory, it is not difficult to find that the performance of the windows will significantly affect the amount of solar heat gain in the building. The distribution of this part of solar heat gain to the envelope surface will change the surface temperature, which in turn affects the heat transfer between the envelope and the indoor air and thermal conduction inside the envelope. The formation of the building’s cooling and heating load will also change. Therefore, windows and walls are not independent of each other. In existing studies, the impact of windows and walls as a whole on building energy consumption and occupant comfort is often studied through the indicator of WWR (window-to-wall area ratio). Chi et al. [28] studied the optimal WWR for traditional residential houses in Zhejiang, China, which considered thermal comfort and energy consumption objectives and determined the optimal WWR intervals under different building orientations. Obrecht et al. [29] investigated the effect of building orientation on the optimal WWR for passive houses in different European climates. Ashrafian et al. [30] studied a school building in Eskisehir, Turkey, and found that a WWR of 50% reduces the need for artificial lighting by more than 15% and results in a more comfortable indoor environment. Other researchers also found that a lower WWR is more suitable for energy consumption reduction and building energy performance optimization [31,32,33]. However, fewer studies have evaluated the overall thermal performance of the envelope considering the correlation between windows and walls.
In summary, to further reduce building energy consumption, rational envelope design is the key to achieving this goal. The prerequisite for realizing rational envelope design is the accurate evaluation of the building envelope’s thermal performance in the real environment. To address this problem, this study proposes a new method for evaluating the overall envelope thermal performance. Firstly, a room heat transfer model is established using the Resistance-Capacity Network method, and the comprehensive thermal performance index of the envelope is proposed based on this model. Secondly, the validity of the index is verified by software simulation based on a field research test of residential houses around Lhasa. Finally, the proposed new comprehensive thermal performance index is used to analyze the performance of the local residential buildings in Lhasa and to study the problems of the local residential buildings in developing from traditional to modern buildings.

2. Methodology

2.1. Room Comprehensive Thermal Performance Indexes

2.1.1. Room Heat Transfer RC Model

The RC network model method is based on the similarity between the heat transfer problem and the electrical conductivity problem, equating the thermal conductivity problem with the electrical conductivity problem, and was initially used to calculate the unsteady-state heat transfer problem for multilayer walls [34,35,36,37]. The analogous structure of the heat conduction problem includes the thermal resistance in series, the parallel heat capacity concentrated at each temperature node, and the temperature difference corresponding to the potential difference.
A room thermal system is an open system consisting of indoor air, external windows, and a non-transparent envelope of the room. Solar radiation has a significant influence on the indoor thermal environment. When performing building heat transfer simulation, the correct solar heat gain distribution calculation can help to achieve the study purpose. The purpose of this study is not to accurately describe the solar radiation distribution through the window, so the area weight distribution method in the simple algorithm is chosen.
For the envelope heat transfer process, the internal temperature distribution of the envelope is not a concern in this study. Therefore, the wall is modeled by the RC network method and described by the 2R1C model. In Figure 1, R w a l l , o u t , i is the wall external surface thermal resistance; R w a l l , i h is the wall equivalent thermal conduction resistance; R w a l l , i n , i is the wall internal surface thermal resistance; C w a l l , i is the wall thermal capacity; T o u t is the air temperature in contact with the wall external surface; T a i r is the indoor air temperature.
The heat transfer process of the enclosure is divided into three parts: convective and radiative heat transfer between the external surface and the outdoor environment, wall internal heat conduction, and convective and radiative heat transfer between the internal surface and the indoor environment.
The following conditions are assumed:
(a)
The indoor air temperature is uniformly distributed and treated as a single node;
(b)
Neglecting the heat capacity of exterior windows;
(c)
The envelope structure consists of homogeneous materials, and the physical parameters do not vary with temperature;
(d)
The surface of the envelope structure is a diffuse gray surface;
(e)
Neglecting considering latent heat transfer and its influence;
(f)
No air conditioning in the room;
(g)
The room’s envelope consists of one exterior wall and five interior walls (including the ceiling and floor).
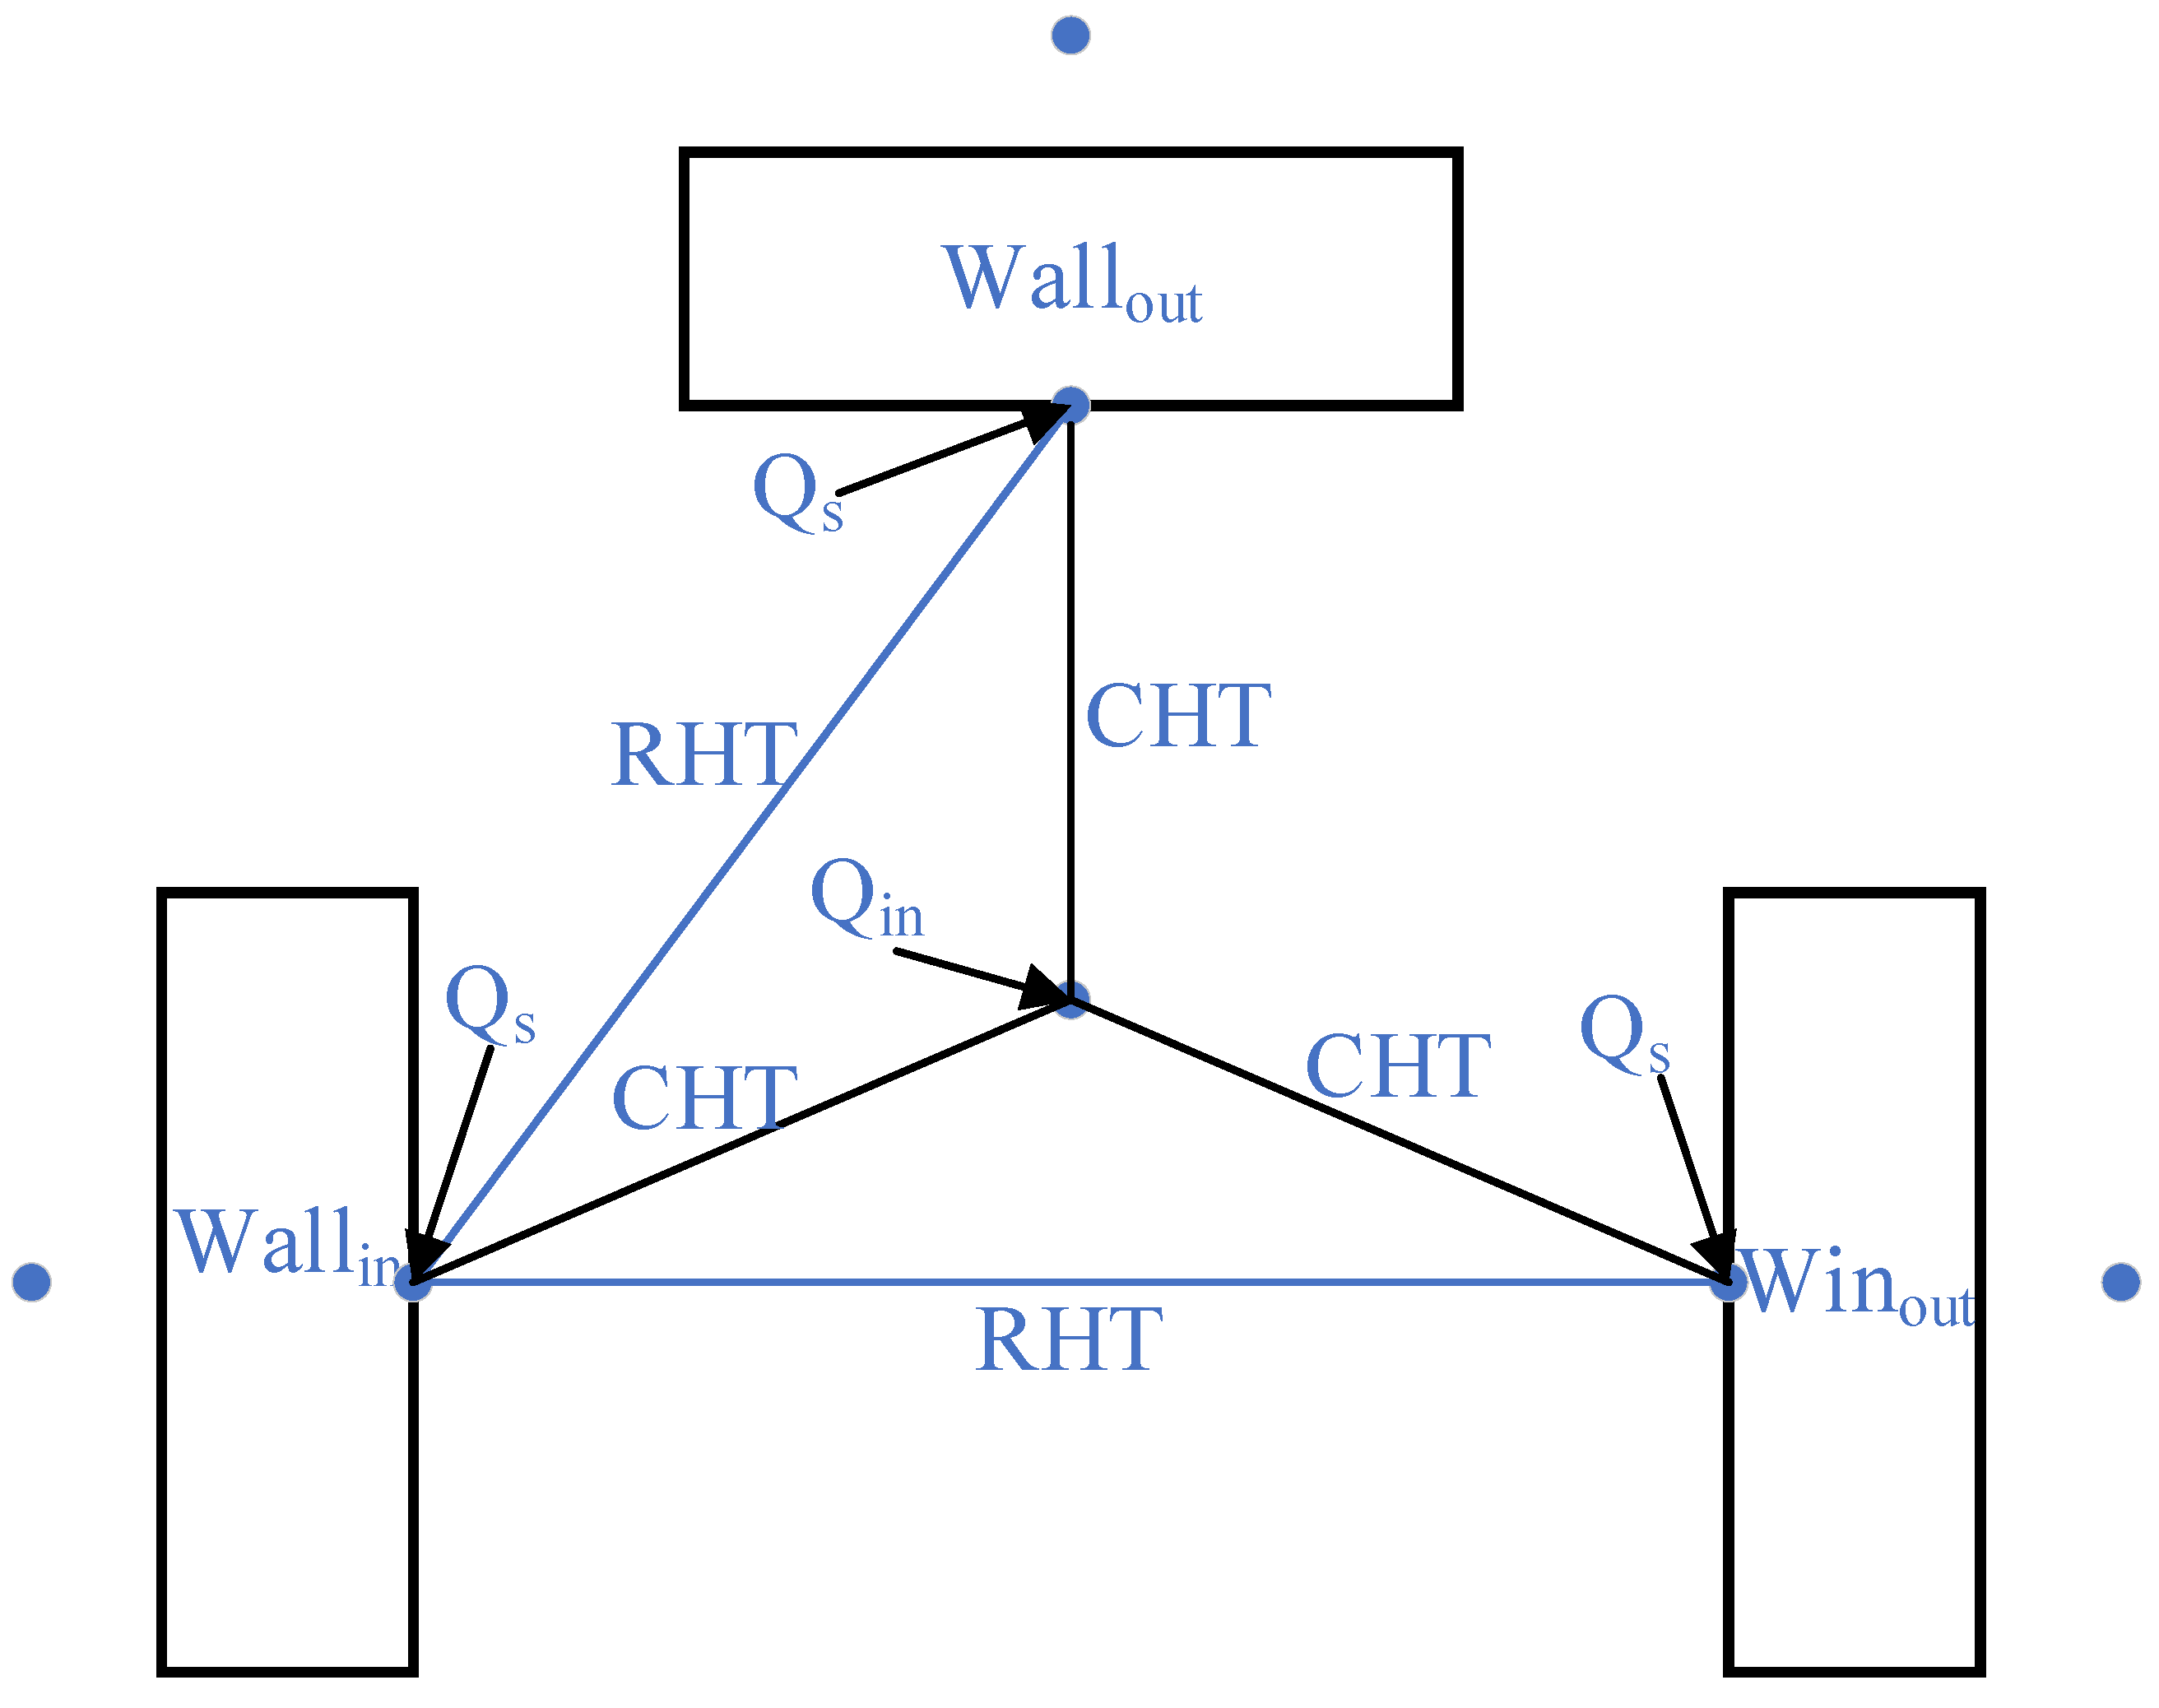
Figure 2 shows the simplified room thermal system. In Figure 2, Wallout denotes the external wall; Winout denotes the exterior window; Wallin denotes the internal wall; CHT denotes convective heat transfer; RHT denotes radiant heat transfer; Qs denotes the indoor radiant heat gain from the internal surface of a wall; and Qin is the indoor heat gain.
Based on the simplified room thermal system model, the room’s heat transfer RC model is established.
According to the heat transfer model shown in Figure 3, each surface node’s set of heat balance equations is established according to Kirchhoff’s law and RC network model diagram.
The set of heat balance equations for the exterior wall nodes is as follows:
T w a l l , i n s , 1 : T z , o u t T w a l l , i n s , 1 R w a l l , o u t , 1 + R w a l l , 1 h + T w a l l , i n , 1 T w a l l , i n s , 1 R w a l l , 1 h = 0
T w a l l , i n , 1 : T w a l l , i n s , 1 T w a l l , i n , 1 R w a l l , 1 h + T a i r T w a l l , i n , 1 R w a l l , i n , 1 + J w a l l o u t σ T w a l l , i n .1 4 R r , w a l l , o u t + Q s , o u t w a l l = 0
J w a l l o u t : σ T w a l l , i n .1 4 J w a l l o u t R r , w a l l , o u t + J w a l l i n J w a l l o u t R r , i n o u t = 0
where T z , o u t (°C) is the comprehensive outdoor air temperature, T w a l l , i n s , 1 (°C) is the exterior wall interior equivalent temperature, T w a l l , i n , 1 (°C) is the exterior wall internal surface temperature, T a i r (°C) is the indoor air temperature, J w a l l o u t (W) is the exterior wall internal surface effective radiation, J w a l l i n (W) is the interior wall internal surface effective radiation, R w a l l , o u t , 1 (K/W) is the exterior wall external surface thermal resistance, R w a l l , 1 h (K/W) is the exterior wall equivalent thermal conduction resistance, R w a l l , i n , 1 (K/W) is the exterior wall internal surface thermal resistance, R r , w a l l , o u t (K/W) is the exterior wall internal surface thermal radiation resistance, R r , i n o u t (K/W) is the space radiation thermal resistance between exterior wall internal surface and interior wall internal surface, Q s , o u t w a l l (W) is the exterior wall internal surface solar heat gain.
The set of heat balance equations for the Internal wall nodes Is as follows:
T w a l l , i n s , 2 : T a i r , n e i g h T w a l l , i n s , 2 R w a l l , o u t , 2 + R w a l l , 2 h + T w a l l , i n , 2 T w a l l , i n s , 2 R w a l l , 2 h = 0
T w a l l , i n , 2 : T w a l l , i n s , 2 T w a l l , i n , 2 R w a l l , 2 h + T a i r T w a l l , i n , 2 R w a l l , i n , 2 + J w a l l i n σ T w a l l , i n .2 4 R r , w a l l , i n + Q s , i n w a l l = 0
J w a l l i n : σ T w a l l , i n .2 4 J w a l l i n R r , w a l l , i n + J w a l l o u t J w a l l i n R r , i n o u t + J w i n J w a l l i n R r , i n w i n = 0
where T a i r , n e i g h (°C) is the adjacent room air temperature, T w a l l , i n s , 2 (°C) is the interior wall interior equivalent temperature, T w a l l , i n , 2 (°C) is the interior wall internal surface temperature, J w i n (W) is the window internal surface effective radiation, R w a l l , o u t , 2 (K/W) is the interior wall external surface thermal resistance, R w a l l , 2 h (K/W) is the interior wall equivalent thermal conduction resistance, R w a l l , i n , 2 (K/W) is the interior wall internal surface thermal resistance, R r , w a l l , i n (K/W) is the interior wall internal surface thermal radiation resistance, R r , i n w i n (K/W) is the space radiation thermal resistance between interior wall internal surface and window internal surface, Q s , i n w a l l (W) is the interior wall internal surface solar heat gain.
The set of heat balance equations for the exterior window node Is:
T w i n : T z , o u t T w i n R w i n , o u t + R w i n + T a i r T w i n R w i n , i n + J w i n σ T w i n 4 R r , w i n + Q s , w i n = 0
J w i n : σ T w i n 4 J w i n R r , w i n + J w a l l i n J w i n R r , i n w i n = 0
where T w i n (°C) is the window temperature, R w i n , o u t (K/W) is the window external surface thermal resistance, R w i n (K/W) is the window thermal conduction resistance, R w i n , i n (K/W) is the window internal surface thermal resistance, R r , w i n (K/W) is the window internal surface thermal radiation resistance, Q s , w i n (W) is the window internal surface solar heat gain.
The indoor air node heat balance equation is:
T a i r : T w a l l , i n , 1 T a i r R w a l l , i n , 1 + T w a l l , i n , 2 T a i r R w a l l , i n , 2 + T w i n T a i r R w i n . i n + Q i n = 0
where Q i n (W) is the room’s internal heat gain.
The overall heat balance equation of the room is:
T a i r , n e i g h T w a l l , i n s , 2 R w a l l , o u t , 2 + R w a l l , 2 h + T z , o u t T w a l l , i n s , 1 R w a l l , o u t , 1 + R w a l l , 1 h + Q s + Q i n = 0
where Q s (W) is the room’s solar heat gain through the window.

2.1.2. Room Comprehensive Thermal Resistance

According to the room’s heat transfer process, the heat gain of indoor air comes from (1) the thermal conduction entering through the non-transparent envelope, (2) the solar radiation heat gain entering the room through the external windows, and (3) other heat gain including infiltration heat, lighting, equipment, etc. Among them, Parts 1 and 2 will jointly affect the internal surface temperature of each wall and then change the indoor air temperature through convective heat transfer. Therefore, when discussing the thermal performance of non-transparent and transparent envelopes, simply discussing the respective thermal parameters and ignoring the correlation of their heat transfer processes can result in an inaccurate evaluation of the envelope’s thermal performance.
In this study, a simplified room heat transfer RC model, as shown in Section 2.1.1, is developed to derive the room’s comprehensive thermal resistance indexes. These indexes will quantitatively characterize the relative magnitude of the overall thermal insulation performance of the room’s envelope. The driving factors for the room’s heat transfer process are the temperature difference between the outdoor and indoor air, the temperature difference between the neighboring air and the indoor air, and the solar heat gain through the windows. According to the idea of thermoelectric analogy, the room’s comprehensive thermal resistance can be obtained by solving the ratio of “temperature difference” and heat flow rate. This comprehensive thermal resistance differs from the total thermal resistance of single-layer wall heat transfer, considering the correlation of heat transfer through the envelope and sunlight heat gain through the exterior windows.
To consider the room as the object for analysis, divide the envelope into the exterior side (exterior walls and windows) and the interior side (interior walls), and analyze the room’s heat transfer RC model to establish each part’s heat transfer driving potential. As shown in Equation (11), the total heat gain of the room Q r o o m can be divided into (1) the heat transferred by the external wall and external window under the temperature difference between indoors and outdoors; (2) the heat transferred by the internal wall under the temperature difference between adjacent rooms; (3) the heat distributed to the internal surface of each wall through the external window; and (4) the heat generated in the room.
Q r o o m = K o u t A w a l l , o u t + A w i n T z , o u t T a i r + K i n A w a l l , i n T a i r , n e i g h T a i r + Q s + Q i n
In addition to the indoor heat generation, the other three parts of the heat gain can be divided into two parts: the outdoor side Q o u t and the indoor side Q i n according to the wall where the inner surface of convective heat exchange with indoor air is located, as shown in Equations (12) and (13).
Q o u t = K o u t A w a l l , o u t + A w i n T z , o u t T a i r + A w a l l , o u t + A w i n A w a l l , o u t + A w i n + A w a l l , i n Q s
Q i n = K i n A w a l l , i n T a i r , n e i g h T a i r + A w a l l , i n A w a l l , o u t + A w i n + A w a l l , i n Q s
where K o u t [W/(m2·K)] is the exterior envelope equivalent heat transfer coefficient, K i n [W/(m2·K)] is the interior envelope equivalent heat transfer coefficient, A w a l l , o u t (m2) is the exterior wall area, A w a l l , i n (m2) is the interior wall area, A w i n (m2) is the window area.
Deforming Equations (12) and (13):
Q o u t = K o u t A w a l l , o u t + A w i n T z , o u t T a i r + 1 K o u t A w a l l , o u t + A w i n + A w a l l , i n Q s
Q i n = K i n A w a l l , i n T a i r , n e i g h T a i r + 1 K i n A w a l l , o u t + A w i n + A w a l l , i n Q s
From this, an expression for the driving potential of the room’s heat transfer process Δ T o u t and Δ T i n , considering solar heat gain through the window, can be obtained, as shown in Equations (16) and (17):
Δ T o u t = T z , o u t T a i r + 1 K o u t A w a l l , o u t + A w i n + A w a l l , i n Q s
Δ T i n = T a i r , n e i g h T a i r + 1 K i n A w a l l , o u t + A w i n + A w a l l , i n Q s
For K o u t and K i n :
K o u t ( A w a l l , o u t + A w i n ) ( T z , o u t T a i r ) = T z , o u t T w a l l , i n s , 1 R w a l l , o u t , 1 + R w a l l , 1 h + T z , o u t T w i n R w i n , o u t + R w i n
K i n A w a l l , i n ( T a i r , n e i g h T a i r ) = T a i r , n e i g h T w a l l , i n s , 2 R w a l l , o u t , 2 + R w a l l , 2 h
According to the simplified RC heat transfer model of the room, the heat flow obtained by the indoor air can be divided into two parts ϕ o u t and ϕ i n :
ϕ o u t = T w a l l , i n , 1 T a i r R w a l l , i n , 1 + T w i n T a i r R w i n , i n
ϕ i n = T w a l l , i n , 2 T a i r R w a l l , i n , 2
Thus, calculating the ratio between the heat transfer driving potential of the room’s outside and inside and the corresponding heat flow rate of the indoor air. The room’s comprehensive thermal resistance per unit area r o u t and r i n can be obtained as shown in Formulas (22) and (23).
r o u t = T z , o u t T a i r + 1 K o u t ( A w a l l , o u t + A w i n + A w a l l , i n ) Q s T w a l l , i n , 1 T a i r R w a l l , i n , 1 + T w i n T a i r R w i n , i n A w a l l , o u t + A w i n
r i n = T a i r , n e i g h T a i r + 1 h i n ( A w a l l , o u t + A w i n + A w a l l , i n ) Q s T w a l l , i n , 2 T a i r R w a l l , i n , 2 A w a l l , i n

2.1.3. Room Comprehensive Thermal Capacity
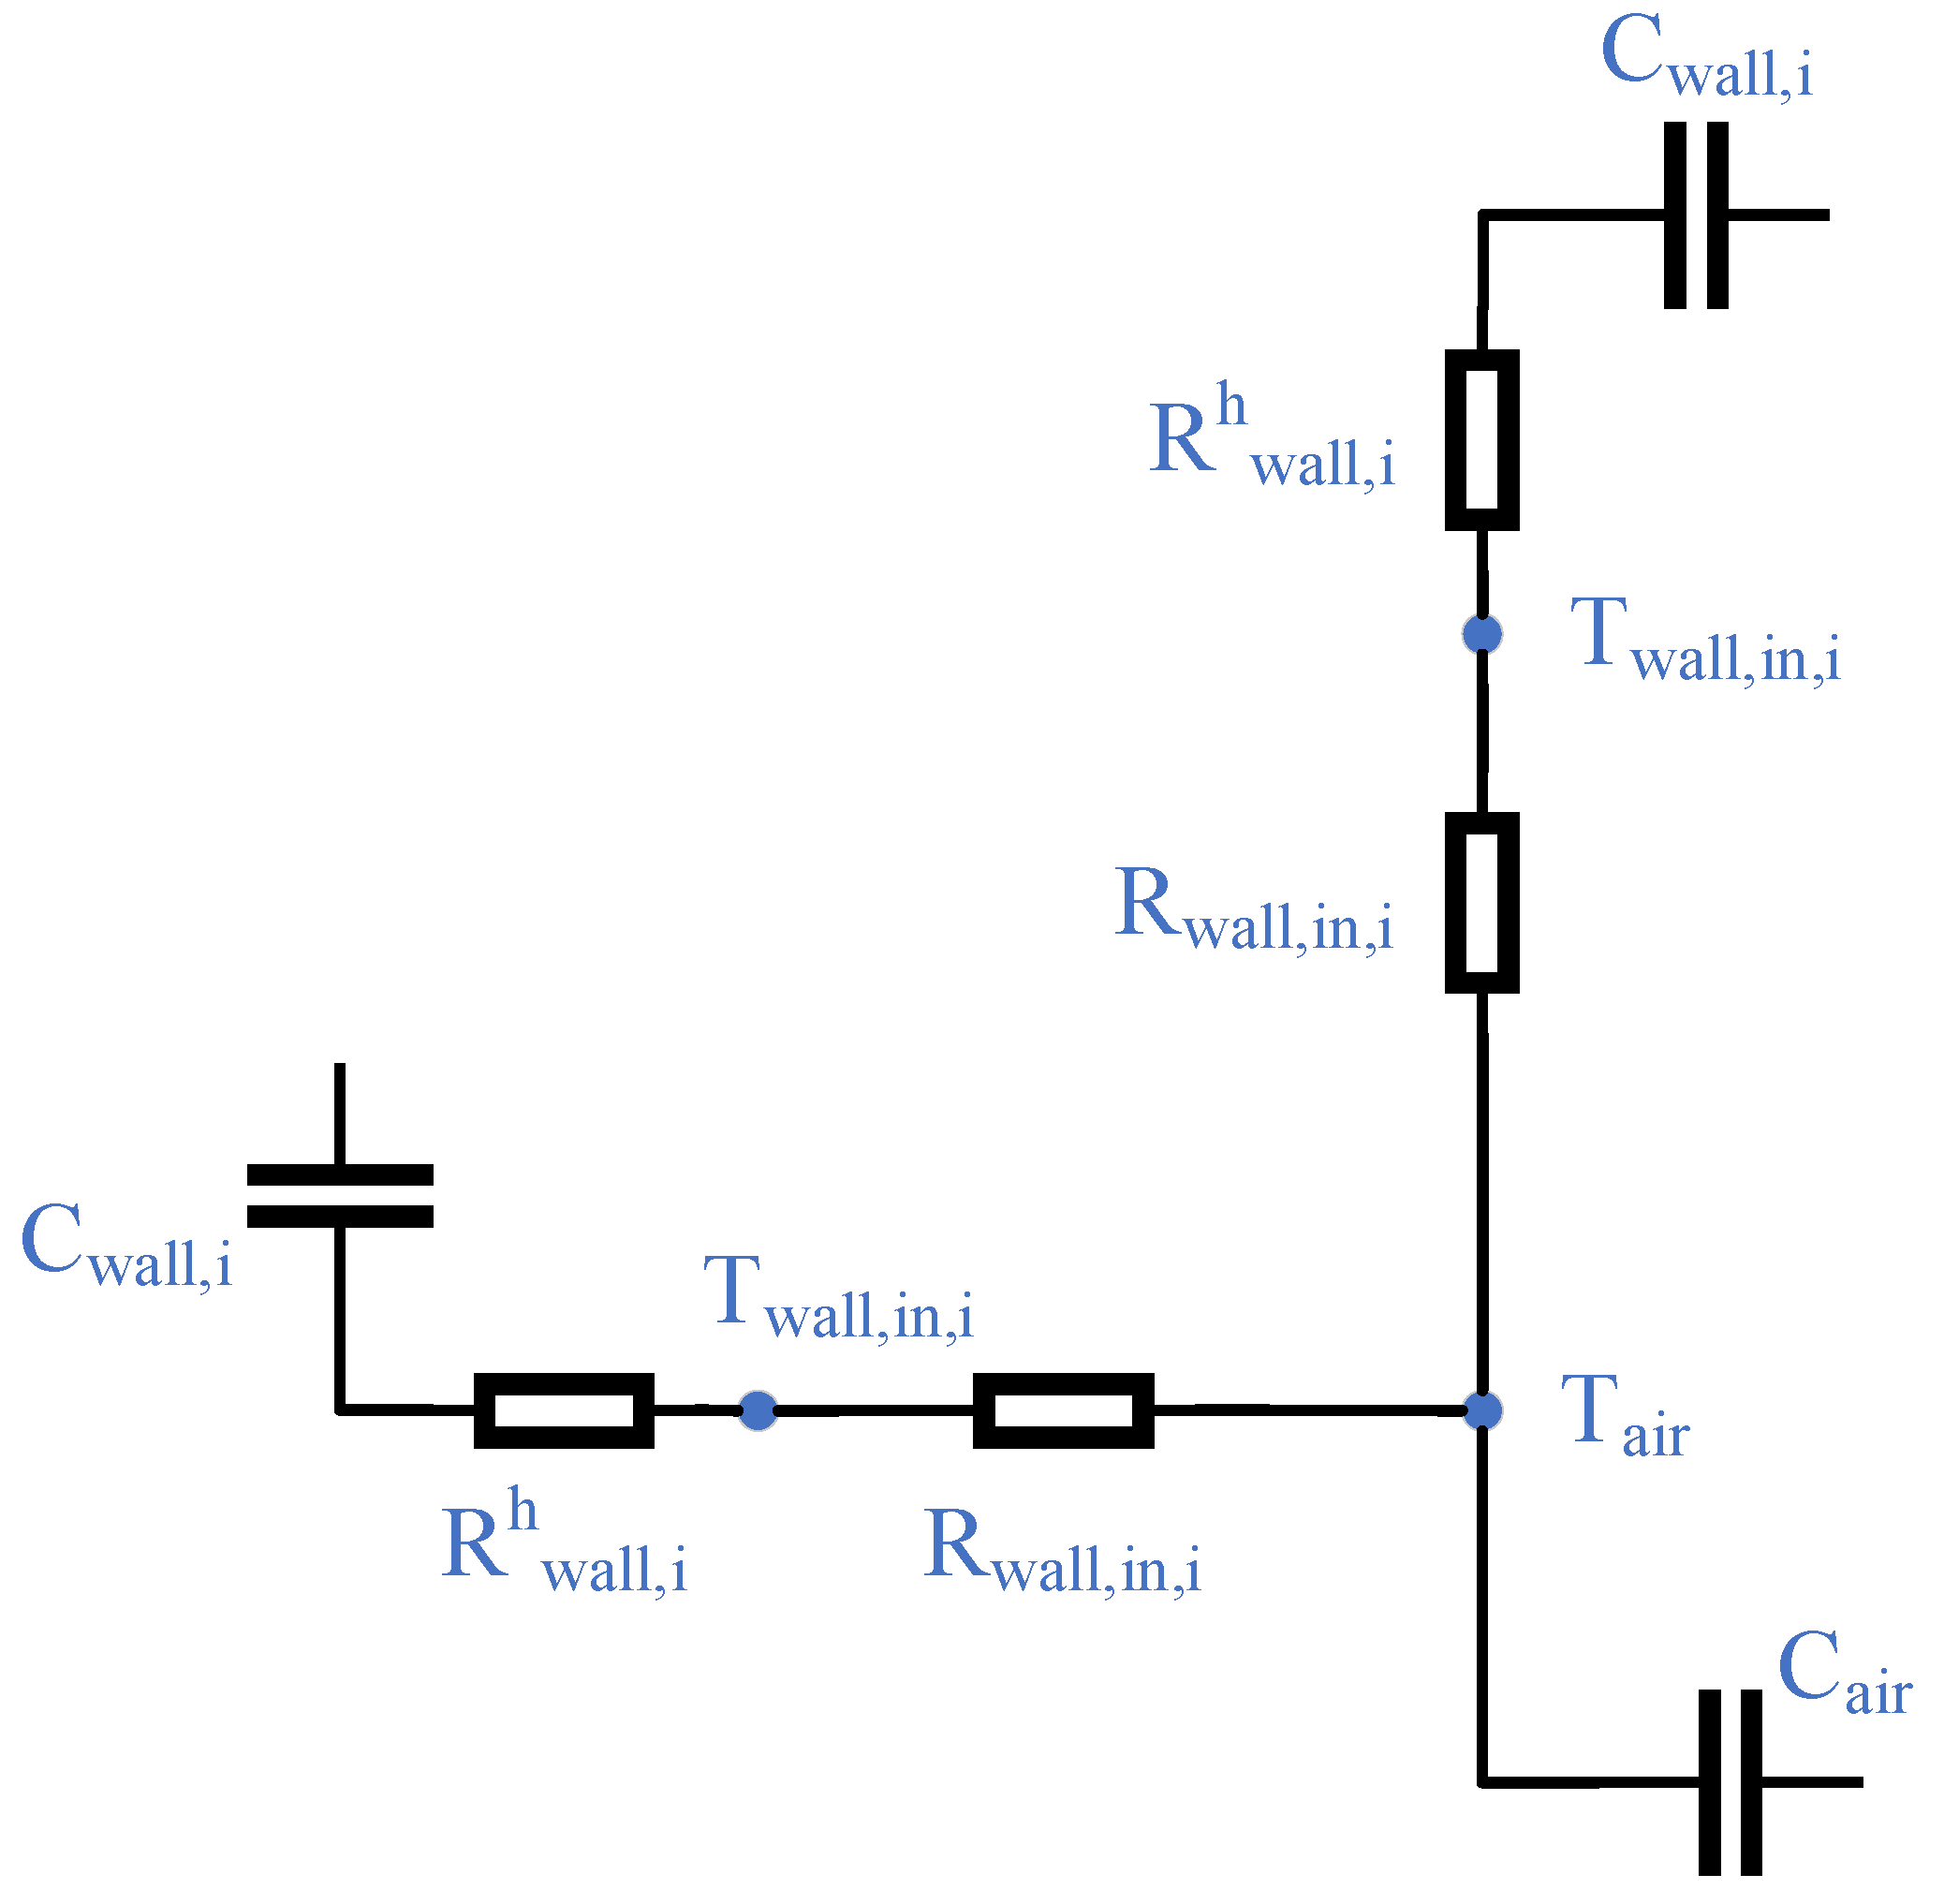
According to the room heat transfer process, the heat conduction entering through the non-transparent envelope and the solar radiation heat gain entering the room through the external windows will affect the indoor air temperature through the envelope’s internal surface. In the room’s non-stationary heat transfer process, part of the indoor and outdoor disturbance to the room directly acts on the indoor air to make its temperature change; the other part of the disturbance first acts on the envelope, which changes the wall heat storage, and then the changing temperature of the envelope inner surface affects the change of the indoor air temperature.
Therefore, the room heat transfer RC model is simplified, as shown in Figure 4. The exterior wall thermal capacity C w a l l , o u t , interior wall thermal capacity C w a l l , i n , and indoor air thermal capacity C a i r are concentrated in the indoor air temperature node. According to the thermoelectric analogy theory, the heat capacity concentrated in the same node is in a parallel relationship. Therefore, the total integrated heat capacity of the room C r o o m satisfies the following relation:
C r o o m = C w a l l , o u t + C w a l l , i n + C a i r
The formula for calculating the room’s comprehensive heat capacity per unit volume C r o o m V can be obtained as shown in Equation (25):
C r o o m V = C a i r + C w a l l , i n + C w a l l , o u t V r o o m
Figure 4. Room thermal capacity.
Energies 16 06927 g004

2.1.4. Room Comprehensive Thermal Performance Indexes Solution

To calculate the room’s comprehensive thermal resistance and capacity, the multivariate nonlinear system of equations from Equations (1)–(9) is solved, and the values of the solved nodes are substituted into Formulas (22) and (23) for calculation. In this study, the corresponding building material thermal parameters, envelope structure, building location, and building geometry information are obtained first. The heat balance equations are solved using MATLAB software, and the room’s comprehensive thermal resistance and capacity values are calculated accordingly. The relevant parameters of this model are shown in Table 1.
Among the above parameters, the unknown quantities are T w a l l , i n s , 1 , T w a l l , i n , 1 , T w a l l , i n s , 2 , T w a l l , i n , 2 , T w i n , T a i r , J w a l l o u t , J w a l l i n , and J w i n . The system of equations has the same number of equations as the number of unknowns, and the system of equations is solvable. The specific input parameters are as follows:
(1)
Comprehensive outdoor air temperature
The outer wall surface is affected by solar radiation while exchanging heat with the outdoor air, including direct solar radiation, sky scattered radiation, ground reflected radiation, atmospheric long-wave radiation, and long-wave radiation from the ground and other surrounding surfaces. The comprehensive outdoor temperature T z , o u t can be used to express the combined thermal effect of these factors on the outer wall surface.
T z , o u t = T a i r , o u t + α I e x h w a l l , o u t
where T z , o u t is the comprehensive outdoor air temperature, T a i r , o u t (°C) is the outdoor air dry bulb temperature, h w a l l , o u t [W/(m2·K)] is the wall external surface heat transfer coefficient, and I e x (W/m2) is the outdoor solar radiation intensity.
(2)
Adjacent room air temperature
Adjacent room air temperature is used to calculate the heat transfer to the room through the interior wall. T a i r . n e i g h is set according to the actual situation of the calculated building. In this study, the adjacent room is considered as a non-air-conditioned room with good ventilation conditions, and its room air temperature is set according to the outdoor air dry-bulb temperature.
(3)
Surface heat transfer thermal resistance
The surface heat transfer thermal resistance is used to calculate the convective heat transfer between each surface of the wall and exterior window and the contact air and is calculated by the following formula:
R i = 1 h i A i
where R i (K/W) is the surface thermal resistance, h i [W/(m2·K)] is the surface heat transfer coefficient, A i (m2) is the surface area. The convective heat transfer coefficients of the internal and external surfaces of walls and windows are taken as empirical values, which are 23 W/(m2·K) for outdoors and 8 W/(m2·K) for indoors, respectively.
(4)
Thermal conduction resistance
Thermal conduction resistance R j is used to calculate the thermal conduction heat inside the wall. For exterior and interior walls, each thermal conductive resistance is calculated as follows:
R j = δ j λ j A j = 2 R w a l l , j h
For external windows, its thermal conductive resistance is the total thermal resistance of exterior windows minus the surface heat transfer thermal resistance of internal and external surfaces of exterior windows:
R w i n = 1 K w i n A w i n 1 h w i n , i n A w i n 1 h w i n , o u t A w i n
where K w i n [W/(m2·K)] is the window overall heat transfer coefficient, h w i n , o u t [W/(m2·K)] is the window external surface heat transfer coefficient, and h w i n , i n [W/(m2·K)] is the window internal surface heat transfer coefficient.
(5)
Surface thermal radiation resistance
The surface thermal radiation resistance R r , i is calculated as follows:
R r , i = 1 ε i A i ε i
(6)
Space radiation thermal resistance between surfaces
The space radiation thermal resistance between surfaces R r , i j is calculated as follows:
R r , i j = 1 F i j A i
Angle coefficients are calculated based on actual building conditions or building models.
(7)
Indoor heat gain
The indoor heat gain is determined according to the actual condition of the building construction or simulated working conditions.
(8)
Solar heat gain
Since the aim is not to accurately describe the distribution of solar radiation entering the room and it is proposed to treat the indoor air as a single node for the study, the area weight distribution method in the simple algorithm is chosen to calculate the solar heat gain from each surface, as shown in the following equations:
Q s , i = Q s A i j = 1 n A j
Q s = I e x A w i n τ w i n
where I e x (W/m2) is the outdoor solar radiation intensity, and τ w i n is the window transmittance.

2.2. Lhasa Dwelling Field Studies

The altitude of the Qinghai–Tibet Plateau is generally between 3000 and 5000 m, with an average altitude of over 4000 m. The special geographical environment has formed this region’s unique alpine climate conditions, whose general characteristics are strong radiation; low temperature and large diurnal variation; long dry and cold winter, and warm and cool summer with lots of rain.
To study the adaptation of local residential buildings and prove the new envelope evaluation method, a field test study was carried out in the Tibetan plateau region in Duilongdeqing District, Lhasa. With the rapid development of the rural economy in the Tibetan area, the progress of renovation and relocation of residential buildings in Duilongdeqing district is also advancing rapidly. New-built and traditional dwellings exist simultaneously. In the renovation and renewal process, the plan form and functional layout of traditional dwellings have been continued and inherited. At the same time, due to the influence of modern lifestyles and concepts, the new dwellings have also undergone significant changes in the selection of materials and construction of their envelope.
The authors visited the Naqurongma relocation site township and Jiare village in Duilongdeqing District around Lhasa in July 2018. Three representative dwellings of the typical local concrete-walled, stone-walled, and adobe brick-walled dwellings were tested for over three days, as shown in Figure 5.

Test Methods and Instrumentation

This field test work tested local outdoor meteorological parameters and indoor thermal environment parameters of traditional residential buildings. Specific test parameters include outdoor meteorological parameters (total solar radiation intensity, outdoor air temperature, relative humidity, wind speed), indoor air temperature and relative humidity. The measurement methods for each measurement parameter were developed according to the measurement standards such as “Technical Regulations for Heating, Ventilation and Air Conditioning Engineering Testing” JGJ/T 260-2011 [38], “Energy Efficiency Testing Standards for Residential Buildings” JGJ/T 132-2009 [39], and “Total Solar Energy Resources Measurement Radiation” GB/T 31156-2014 [40]. The testing length was set according to the “Energy Efficiency Testing Standards for Residential Buildings” JGJ/T 132-2009 [39].
Total solar radiation intensity: There is no obstacle above the induction surface of the measuring instrument, the shadow of any obstacle around the observatory should not be projected on the induction surface of the measuring instrument, the measuring instrument should not be close to the light-colored wall or other objects that can easily reflect sunlight and should not be exposed to artificial radiation sources. There should be no obstacle with a height angle of more than 5 degrees, especially in the range of azimuth at sunrise and sunset throughout the year. Horizontal installation of the total radiation table should be firmly installed 1.5 m from the ground on a special table column to avoid vibration caused by the horizontal state change.
Indoor temperature and humidity: The measurement point arrangement should meet: test one central point when the indoor area is less than 16 m2; test two points when the indoor area is between 16–30 m2. The measurement point is located at two trisection points of the room’s diagonal. Instrument arrangement from the ground 0.7~1.8 m, not less than 0.5 m from the external wall or heat and cold sources.
In this field test, the outdoor parameters (outdoor air temperature, humidity, and total solar radiation intensity) were tested using a portable weather station, HOBO H21-USB; the indoor air parameters were tested using HOBO U12-011 data logger. Detailed information on the used instruments is shown in Table 2.

2.3. Numerical Modeling for Room Comprehensive Thermal Performance Indexes Validity

The validation of the comprehensive room thermal resistance index needs to address the problem it is intended to solve, i.e., the existing thermal performance index of the envelope cannot accurately describe its effect on the formation of the room’s thermal environment. The room’s thermal resistance and capacity index need to be able to describe the response of a room to indoor and outdoor disturbances. For multiple rooms with different envelope structures, if they have the same room comprehensive thermal resistance and capacity value, the changing trend of indoor air temperature and the level of temperature value should be consistent under the same indoor and outdoor disturbance conditions. Accordingly, this study verifies the validity of the room’s comprehensive thermal index based on the above idea by combining numerical simulation and field tests.
First, the local envelope materials and construction forms are determined based on the field research and test results. The newly built concrete residential building is selected as the modeling object, and its living room is selected as the study room. Then, according to the above validation method, multiple cases with the same room comprehensive thermal resistance capacity value and different envelope structures are determined. Next, the established cases are simulated using EnergyPlus software, which is widely used and highly reliable in building simulation [41]. The usability of the model is verified by comparing the simulation result with the measured data. Finally, by comparing the time-to-time indoor air temperature of the building under the same indoor and outdoor disturbances in different cases, the differences between cases are compared using statistical indicators. Thus, the magnitude of the differences is quantified to verify the validity of the room’s comprehensive thermal resistance and capacity indexes.

2.3.1. Case Description

(1)
Meteorological condition
The selected building is located in the Lhasa region of Tibet, and the outdoor weather data from the field test are used as input parameters for the building simulation. The selected data is from 13:00 on 29 July 2018, to 13:00 on 30 July 2018.
(2)
Heat transfer-related parameters
For the local residential houses in Lhasa, the convective heat transfer coefficients of the internal and external surfaces of the walls are taken as empirical values, which are 23 W/(m2·K) for outdoors and 8 W/(m2·K) for indoors, respectively [42]. The surface emissivity of the exterior walls, interior walls and exterior windows are all 0.92.
(3)
Light and occupancy schedules
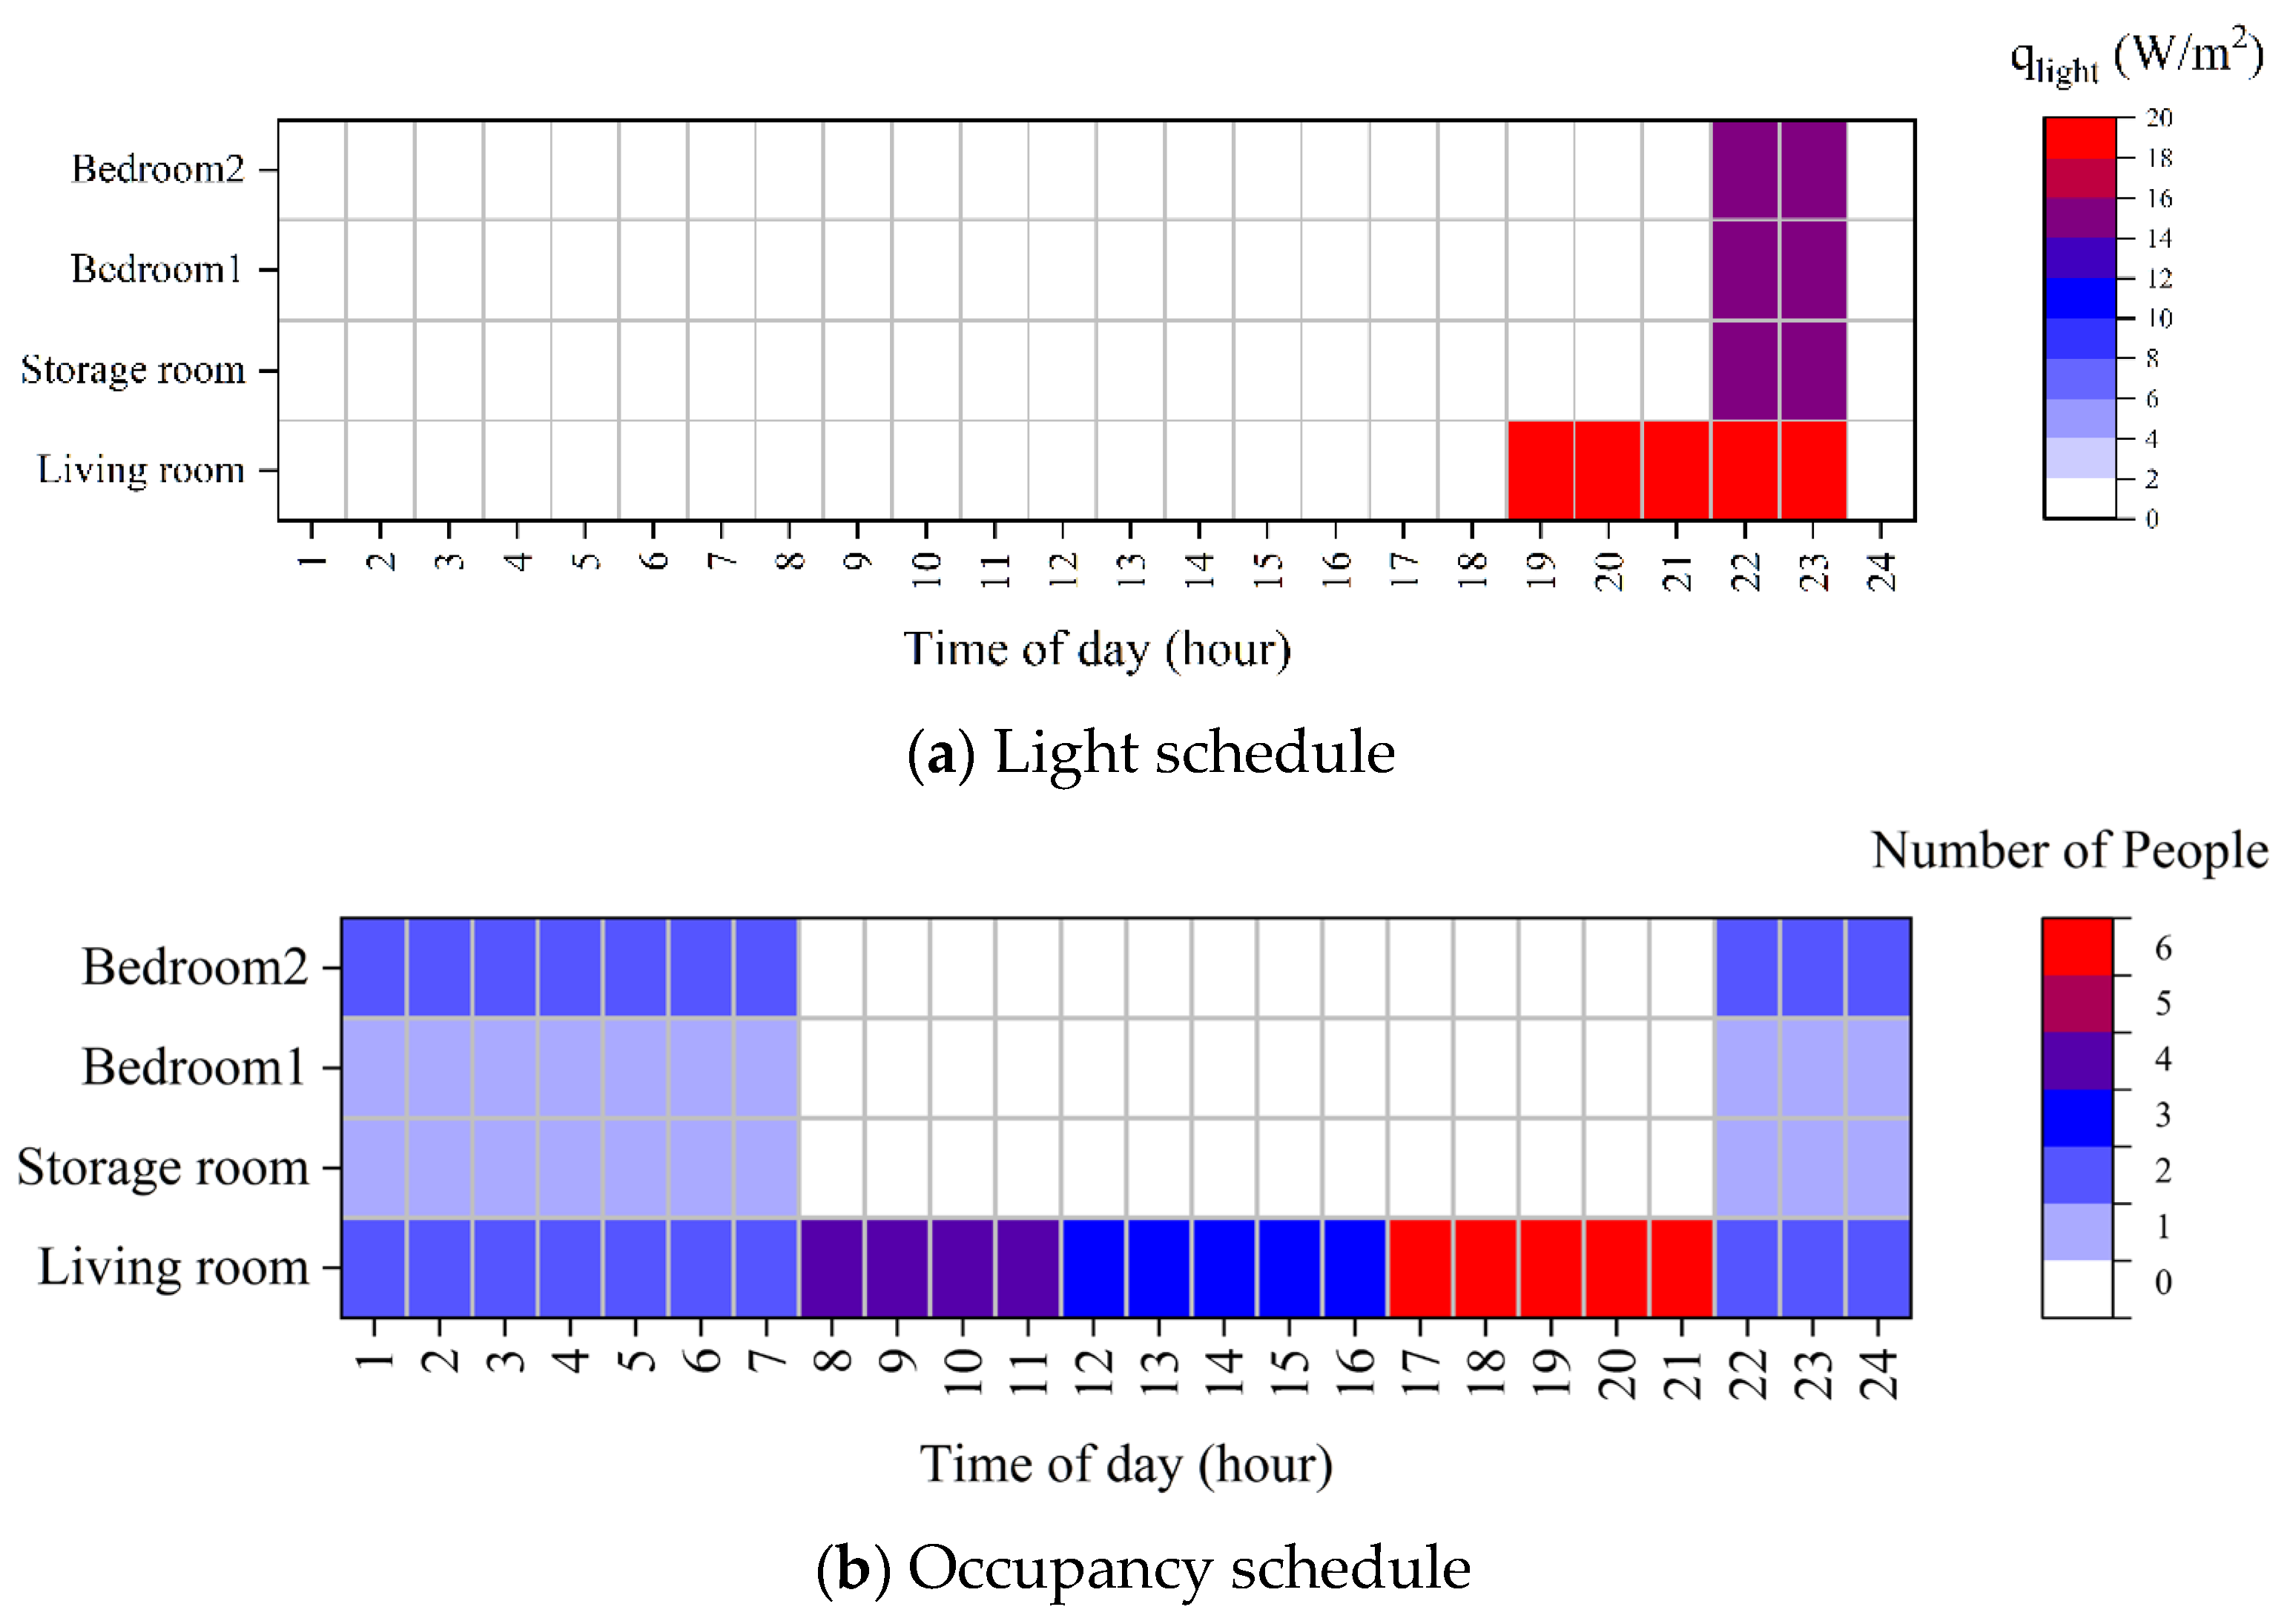
According to the results of the field research, a total of six people live in the selected building, and the lighting and occupancy schedules are shown in the following Figure 6.
(4)
Basic building information
According to the statistics of field research results, the envelope materials selected for local residential houses in the Lhasa area are mainly clay (500–800 mm), stone (350–550 mm), crushed concrete (250–350 mm), and the roof is clay. The envelope structure of the newly built residential houses is a composite wall (250–350 mm) of crushed concrete combined with high-efficiency insulation material (40 mm EPS insulation board) with concrete roofs. The window-to-wall ratios of the south-facing rooms in traditional houses are mostly between 0.2–0.4, and the window-to-wall ratios of the remaining facing rooms are smaller. The new houses are mainly designed with a large window-to-wall ratio in the south and a small window-to-wall ratio in the north. The thermal parameters of the envelope materials involved are shown in Table 3.
A newly built local concrete residential building is selected for the simulation study, as shown in Figure 7. The internal layout of the building is shown in Figure 8a. The building envelope construction is 40 mm EPS (expanded polystyrene board), +300 mm crushed concrete for exterior walls and 300 mm concrete for interior walls, roofs, and floors. Based on the available information, the room’s comprehensive thermal resistance and capacity values of the south-facing living room can be obtained, and this case is set as the benchmark case.
According to the common building materials used in local residential buildings, other working conditions with the same room comprehensive thermal resistance and capacity value but different wall structures are determined. All cases share the same building layout, orientation, and geometry conditions. The specific case input parameters are shown in Table 4.

2.3.2. Evaluating Indicators

The purpose of the analysis of the results of this study is to quantitatively compare the differences between the two columns of data, and the common indicators used to characterize the differences between the two columns of data are R2 (R-square), MAPE (mean absolute percentage error), MBE (mean bias error), NMBE (normalized mean bias error), and CVRMSE (coefficient of the variation of the root mean square error). Referring to the evaluation indexes used in the calibration study of building energy consumption simulation and prediction models, the two most used indexes, MBE and CVRMSE [43,44,45,46], are selected in this study. It is concluded that when MBE < 10% and CVRMSE < 20%, there is no significant difference between the two columns of data.
MBE = τ = 1 n ( y τ y ^ τ ) 2 τ = 1 n y τ
CVRMSE = τ = 1 n ( y τ y ^ τ ) 2 n τ = 1 n y τ n

2.4. Index-Based Lhasa Residential Building Envelope Thermal Performance Study

The building envelope parameters can be obtained from the field research test. Based on the obtained parameters and the proposed new evaluation method, the comprehensive thermal resistance and capacity values of the local traditional and newly built dwellings in Lhasa are calculated and used to analyze the building’s thermal performance in local unique climate conditions
The south-facing room for each local dwelling is selected as the calculation object, and the building’s outdoor meteorological parameters are determined according to the typical meteorological year data of the Lhasa area in the CSWD meteorological database [47]. The building indoor disturbance is set according to the field research results, as shown in Section 2.3.1.

3. Result and Discussion

3.1. Field Test Result

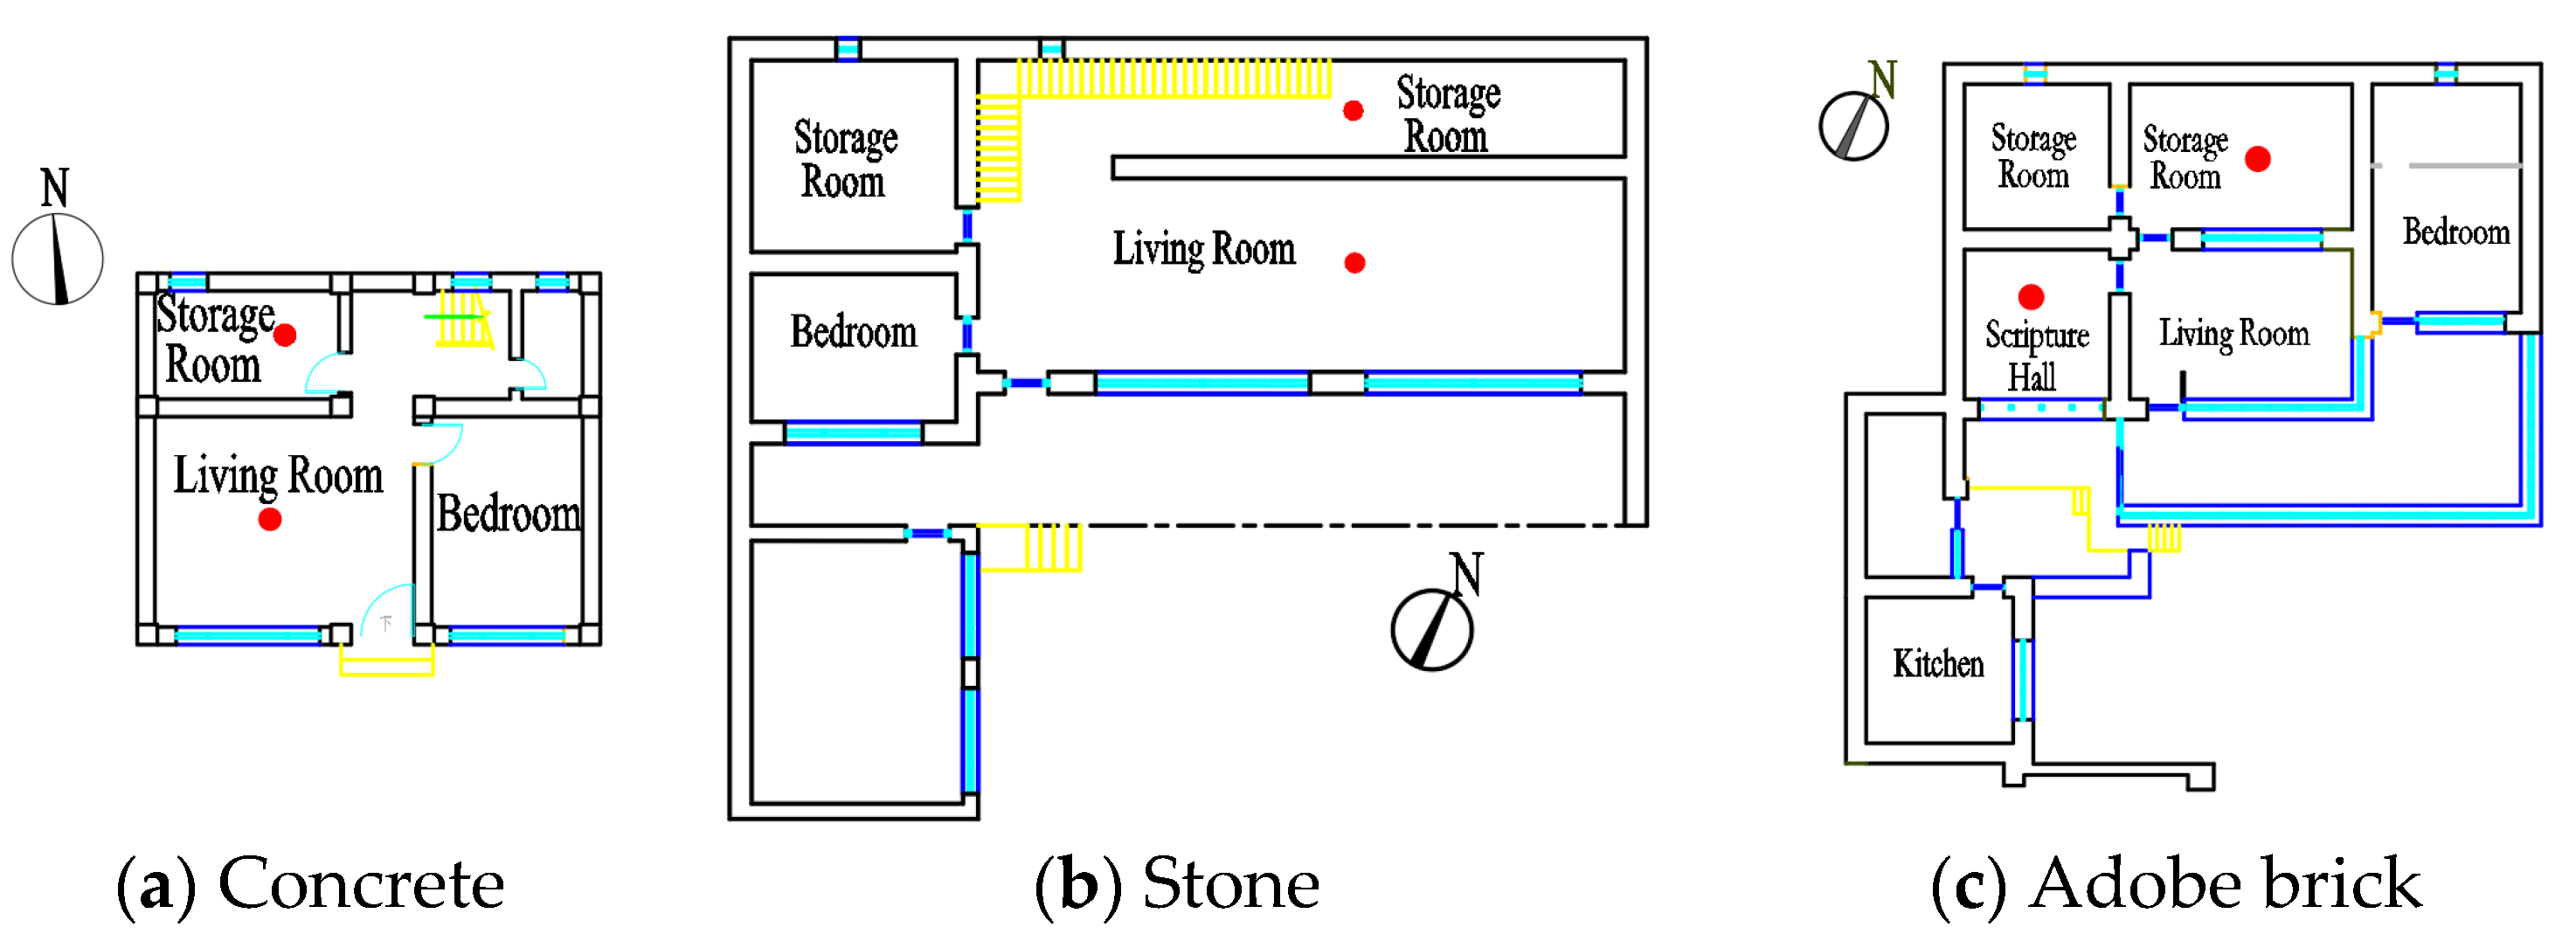
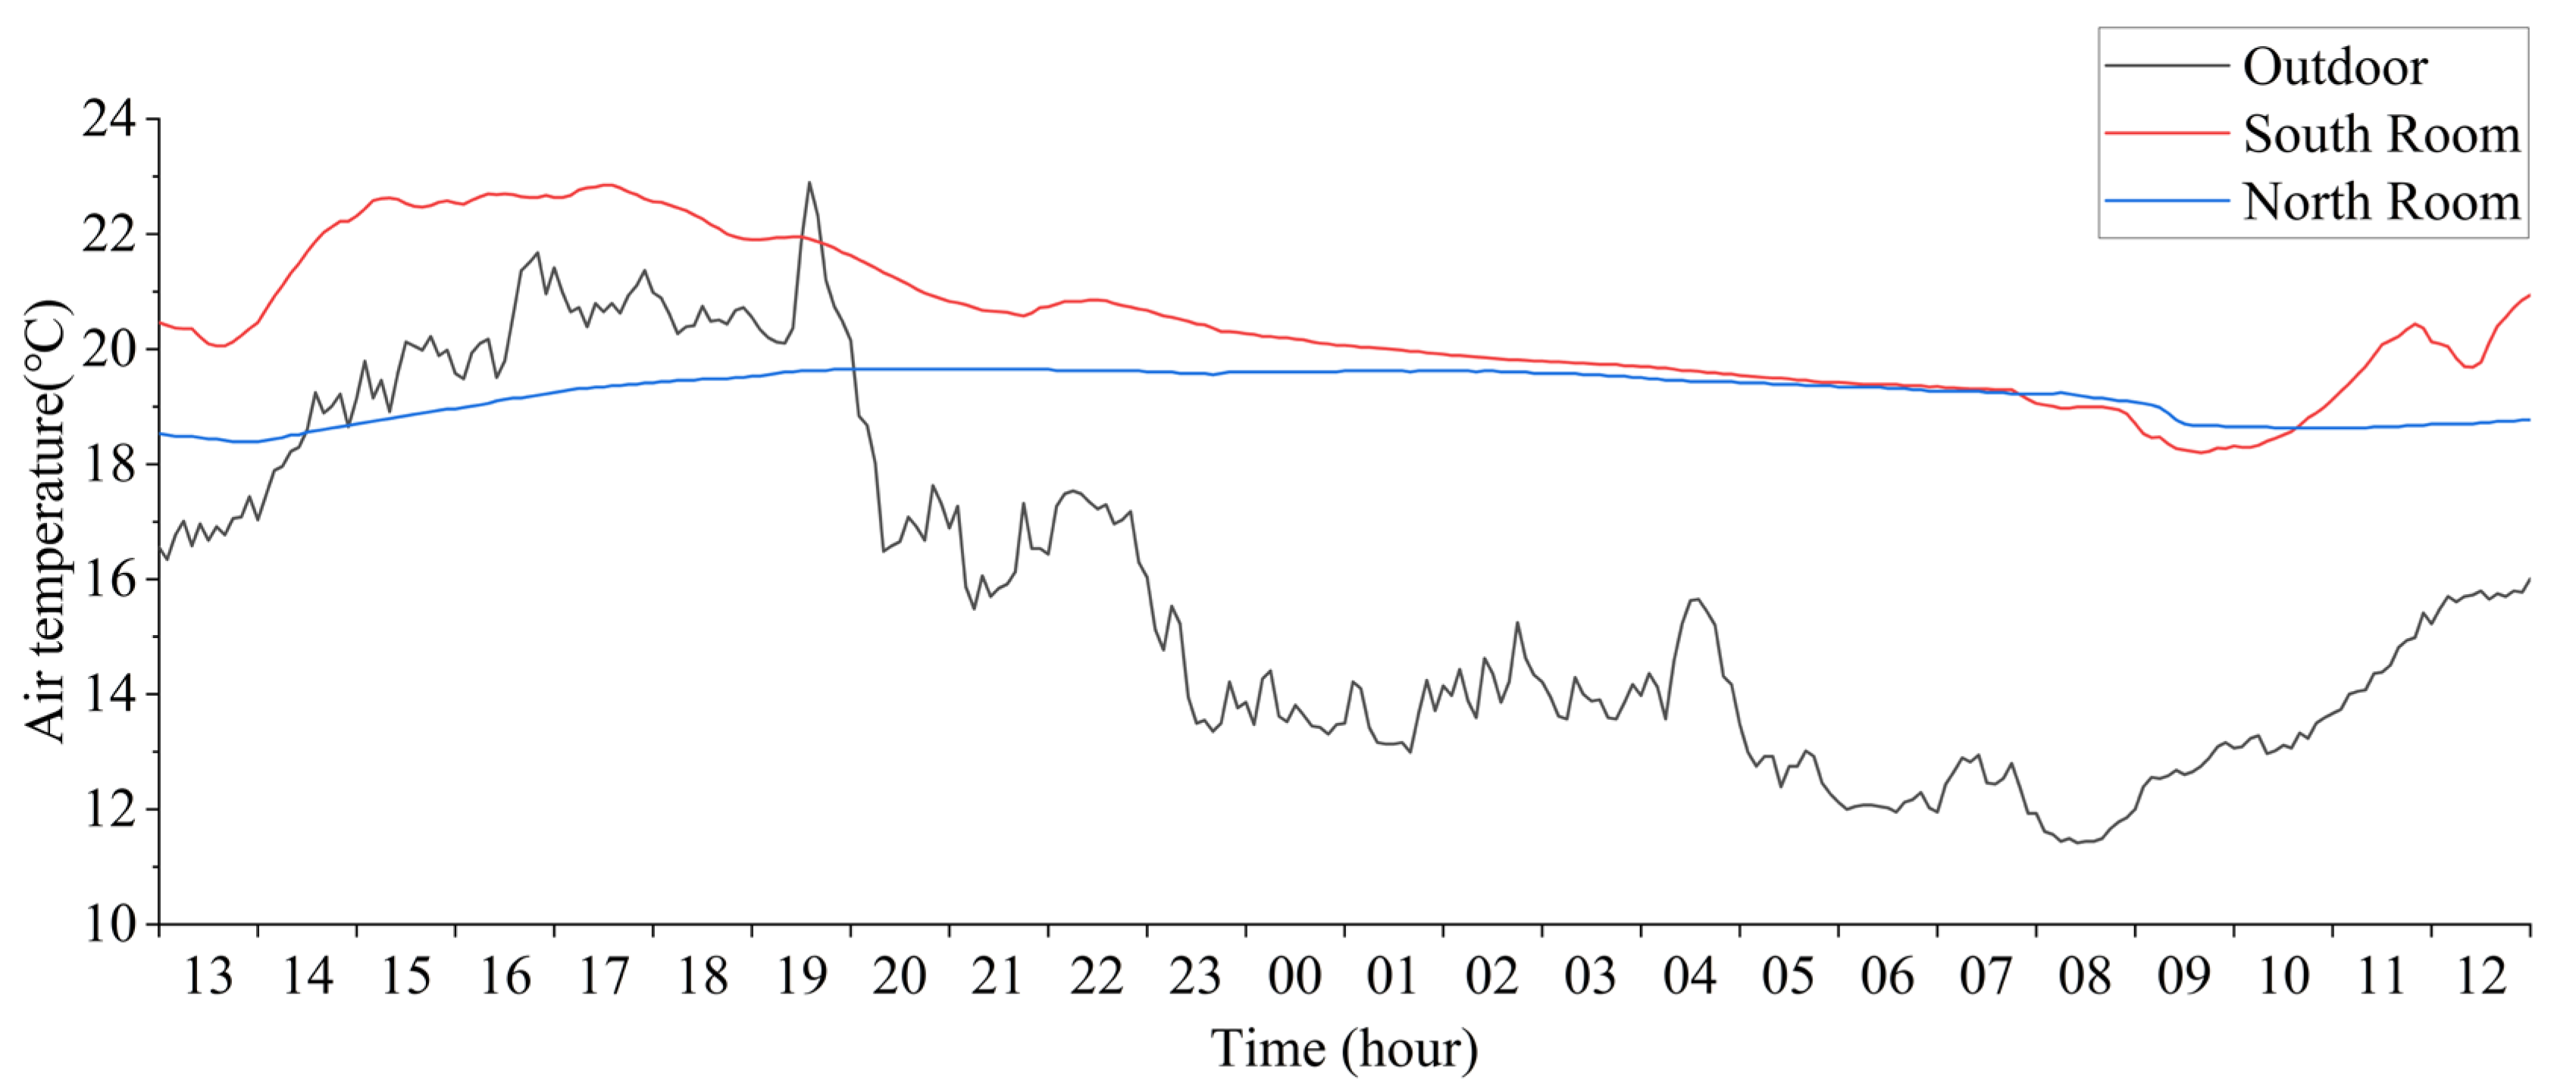
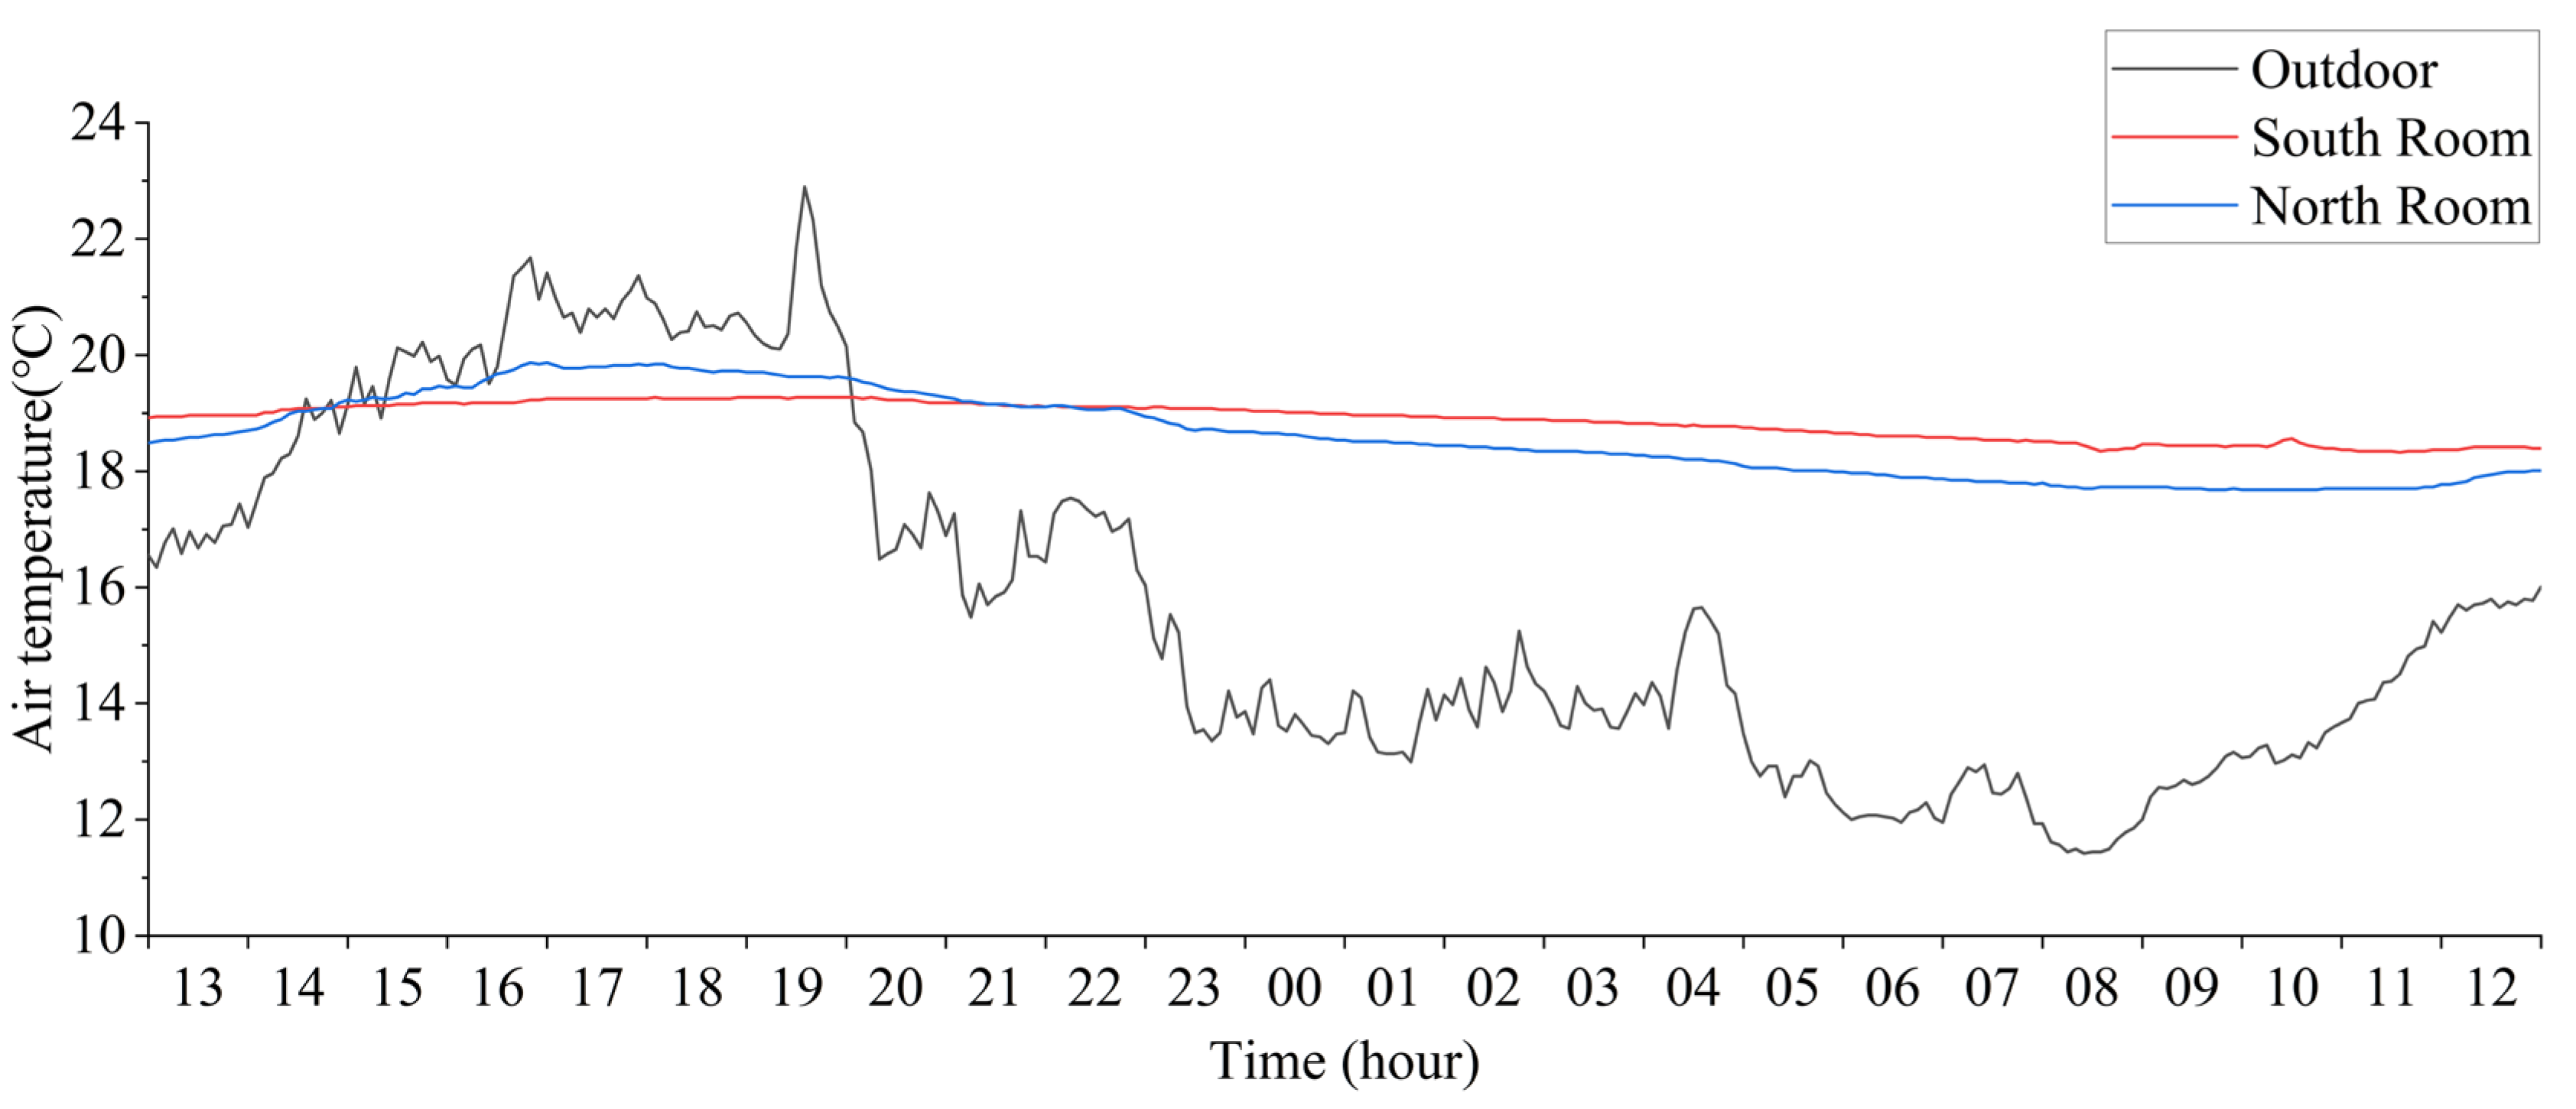
For the typical local, new residential houses, traditional residential houses with stone walls, and traditional residential houses with adobe brick walls, the authors selected one representative residential house each for over three days of testing (no less than 72 h), according to the “Energy Efficiency Testing Standards for Residential Buildings” JGJ/T 132-2009 [39]. The envelope construction forms and related parameters of the three residential dwellings are shown in Table 5. The measurement point layout was determined according to the measurement method described in Section 2.1. The layout and measurement point layout of each residential house are shown in Figure 8. The indoor and outdoor air temperatures of the adjacent north-south facing rooms from 13:00 on 29 July to 13:00 on 30 July are shown in Figure 9, Figure 10 and Figure 11 below.
The daily average outdoor air temperature during the selected time period was 15.75 °C, and the daily difference was 11.48 °C. The measurement results showed that the indoor temperatures were all lower than 24 °C in summer with no overheating. Under the same outdoor meteorological conditions, the daily average indoor air temperature in the south-facing rooms of the newly built concrete houses was 20.44 °C, with a daily temperature fluctuation of 4.66 °C, of which the maximum value was 22.85 °C at 17:30 and the minimum value was 18.20 °C at 09:40; the daily average indoor air temperature in the north-facing rooms was 19.23 °C, with a daily temperature fluctuation of 1.26 °C. The difference between the newly built residential buildings’ north- and south-facing rooms is large, and the temperature fluctuates greatly in the south-facing rooms, while the north-facing rooms are more stable.
For the stone wall dwelling, the average daily indoor air temperatures in the north and south-facing rooms were 19.63 °C and 19.48 °C, with daily temperature fluctuations of 1.61 °C and 1.07 °C, respectively. The heavy wall design of the traditional dwelling attenuates the 11 °C outdoor air temperature fluctuation to within 2 °C, making the indoor temperature of both north and south-facing rooms of the dwelling stable.
For the clay wall dwelling, the average daily indoor air temperatures in its north and south facing room were 18.88 °C and 18.61 °C, with daily temperature fluctuations of 0.95 °C and 2.19 °C, respectively. For its south-facing rooms, the maximum daily room temperature was 19.27 °C, which occurred at 20:15. The minimum value was 18.32, which happened at 11:55. Compared with the newly built houses, the traditional clay-walled houses achieved greater delay and attenuation of outdoor temperature fluctuations by virtue of its heavy envelope design, reducing the impact of outdoor disturbances on the indoor environment.
By analyzing the above data, it can be found that the average daily indoor temperature in the south-facing rooms of the newly built house is higher, and the room’s temperature fluctuates wildly. At the same time, there is a significant temperature difference between the north and south-facing rooms. The temperature difference between traditional houses’ north and south-facing rooms is slight, and the room’s temperature is relatively stable. However, the daily average value is lower than that of the newly built house.
On the other hand, the exterior wall serves as the most important barrier between indoor and outdoor environments. According to Table 5, the lightweight concrete wall with external insulation has the best insulation capacity among the three types of residential envelope forms. However, in the actual environment, by comparing the time-by-time room temperature of the south-facing rooms, the delay and attenuation of outdoor disturbance from the external wall of the south-facing rooms of the newly built residential houses are weaker than those of the traditional residential houses with heavy walls. The composite walls with insulation layers fail to meet the designed thermal insulation requirements in practice. The heavyweight wall design of traditional residential houses effectively reduces the impact of outdoor disturbance on the indoor environment. However, their room temperature levels are lower than those of newly built residential buildings. The existing evaluation indexes of wall thermal performance do not accurately reflect its performance in the real environment.

3.2. Thermal Performance Indexes Validity

As shown in Section 2.3, the validity of the room’s comprehensive thermal resistance capacity index was studied by software simulation using EnergyPlus software. Based on field research and testing, a local residential building model was selected to obtain each input condition required for the software simulation. First, the hourly indoor air temperature values are obtained from the simulations using the building model based on the existing houses, and the results are compared with the measured values to verify the model’s accuracy. Then, the hourly indoor air temperature under different conditions is simulated with the same integrated thermal resistance value but different envelope structures according to the validation method described in Section 2.3. The differences in room temperature are quantitatively compared between the working conditions to determine the validity of room comprehensive thermal resistance and capacity index.

3.2.1. Model Verification

The indoor air temperature data of different rooms in the building under the benchmark case were selected and compared with the corresponding test air temperature data of each room at the same period of time. The magnitude of the difference was quantified using the indexes selected in Section 2.3.2. The results of the quantified differences are shown in the following Table 6.
From the above table, for different rooms, the maximum value of MBE for the difference between the simulation results and the measured data is 8.25%, and the maximum value of CVRMSE is 17.91%, both of which are within the consistency judgment range shown in Section 2.3.2. Therefore, it is considered that the software simulation results of this building model can reflect the actual situation of the building. The simulation input conditions are set reasonably, and the follow-up study is conducted on this basis.

3.2.2. Index Validity Analysis

Based on the comparison results in Section 3.2.1, the software modeling settings were considered correct. The room’s air temperature simulation results for cases I–III were compared, and the differences’ magnitude was quantified using the metrics selected in Section 2.3.2. The results of the quantified differences are shown in Table 7 and Table 8.
From the above table, it can be seen that for different rooms, the difference between the simulated results and the measured data is 3.67% MBE maximum and 2.92% CVRMSE maximum, both of which are within the consistency judgment range shown in Section 2.3.2. Therefore, it is considered that when the room’s comprehensive thermal resistance capacity values are the same, its room temperature changes under the same indoor and outdoor disturbance conditions are consistent, i.e., the proposed room’s comprehensive thermal indexes can effectively reflect the room’s response to different disturbances.

3.3. Index-Based Lhasa Residential Building Envelope Performance Evaluation

According to the field research tests, the walls and related parameters at that time are shown in Table 5.
For the non-transparent part of the three types of local residential envelope, according to the calculation results, the thermal resistance of the external walls of the three types of residential buildings: concrete walls > adobe brick walls > stone walls, and their thermal inertia index: adobe brick walls > stone walls > concrete walls. The above comparison only discusses a single wall without considering the correlation between the walls and the windows.
We used the room’s comprehensive thermal resistance and capacity index to calculate the index value of the above three types of buildings. The south-facing room is selected as the calculation object; the building’s outdoor meteorological parameters are determined according to the typical meteorological year data of the Lhasa area in the CSWD meteorological database [47], and the building’s indoor disturbance is set according to the field research results as follows.
(1) The outdoor meteorological parameters at 12:00 noon on the summer solstice and the indoor disturbances obtained from the research are used as the input conditions for the calculation of the index, and the comprehensive thermal resistance and capacity values of the rooms of the three types of residential houses are shown in Table 9 and Table 10.
(2) The outdoor meteorological parameters at 12:00 noon on the winter solstice and the indoor disturbances obtained from the research are used as the input conditions for the calculation of the index, and the comprehensive thermal resistance and capacity values of the rooms of the three types of residential houses are shown in Table 11 and Table 12.
From the results, it can be seen that for the actual building in Lhasa’s climate conditions and external wall comprehensive thermal resistance that adobe brick building > concrete building > stone building, interior wall comprehensive thermal capacity: adobe brick building > stone building > concrete building. Compared with the three types of wall thermal insulation thermal storage capacity size ranking obtained directly from the calculation of wall thermal parameters, a significant change occurred. In addition, the local indoor thermal environment actual measurement data also corroborate this result.
The reason for the occurrence of the above situation is that when considering the heat transfer process of a room under the joint action of non-transparent and transparent envelopes, the solar radiation heat entering the room significantly affects the heat conduction inside the non-transparent envelope due to the presence of the transparent envelope, which in turn affects the surface temperature value of each internal wall, causing a change in the convective heat exchange with the indoor air. The newly built concrete building with a large south-facing WWR design allows for more solar heat gain directly into the interior, and the indoor air temperature fluctuates significantly with the change of outdoor solar radiation intensity throughout the day. The wall thermal insulation performance cannot be fully utilized in this situation. As for the traditional adobe brick building, it has the highest room comprehensive thermal resistance and capacity value due to its heavy mass wall and small south-facing window design. This envelope design allows the building to effectively reduce room heat gain from the outside and reduce room heat loss from the inside while also better maintaining the indoor air temperature. This explains why the south-facing room of the newly built concrete building with the highest design thermal resistance had a higher indoor air temperature level and wider fluctuation in the field test, while the adobe brick building consistently maintained a lower and more stable indoor air temperature.
When discussing the heat transfer process of a building in the actual environment, the design of the envelope separately into non-transparent and transparent parts will result in the pre-designed design requirements not being met due to the influence of the transparent envelope on the heat transfer process of the non-transparent envelope. Thus, the overall performance of the two envelope parts must be described using the room’s comprehensive thermal resistance and capacity index.

4. Conclusions

In this study, the deficiencies of existing thermal performance indexes of walls in practical applications are clarified from field research tests in the surrounding areas of Lhasa. Based on heat transfer theory, the RC network method is used to establish the room heat transfer model and propose the room comprehensive thermal resistance and capacity index and its calculation method. The derivation of the index takes into account the influence of the solar heat gain through the external windows and the heat conduction through the wall interior on the internal surface temperature of the envelope. The index can be used to accurately describe the overall response of the room to indoor and outdoor disturbances and to accurately describe the envelope’s thermal performance in the actual environment. Subsequently, the index is used to analyze the thermal performance of the envelope structure of residential houses in Lhasa city.
Accordingly, the following conclusions were drawn:
(1) The newly built residential houses in the Lhasa area have the best exterior wall insulation performance among local residential houses. However, its south-facing large window-to-wall ratio setting makes it unable to meet the design requirements in practical application, resulting in the barrier role of their exterior walls not being given full play.
(2) Ensuring that the room’s comprehensive thermal resistance indexes are constant in value determines the building envelope’s structure construction. This method can make rooms with different combinations of envelope parameters, of which indoor air temperature changes consistently (maximum difference within 3.67% MBE and 2.92% CVRMSE according to the case study), under the same indoor and outdoor disturbances.
(3) When analyzing the thermal performance of the building envelope, the correlation between the transparent and non-transparent envelopes cannot be ignored. Considering this correlation, the proposed room comprehensive thermal resistance capacity index can accurately describe the overall response of the envelope to the disturbance. In the thermal design of buildings, using this index to describe the envelope’s thermal performance can effectively reduce the deviation of the building in the design and operation phases.
The results of this paper provide new insights into the thermal design of building envelopes by focusing on the interactions between transparent and non-transparent envelopes in the room heat transfer process and propose a new performance parameter—the room’s comprehensive thermal resistance and capacity indexes. The calculation results show the shortcomings of the existing thermal indicators in some cases and indicate the importance of the linkage design of transparent and non-transparent envelopes.

Author Contributions

Z.L.: Conceptualization, methodology, supervision, writing-review&editing. Y.S.: Conceptualization, methodology, supervision, writing-original draft, data curation. Q.Z.: Methodology, supervision, data curation. X.F.: writing-review&editing. All authors have read and agreed to the published version of the manuscript.

Funding

This work was supported by the Science and Technology Support Carbon Emission Peak and Carbon Neutralization Special Project of Shanghai 2021, “Science and Technology Innovation Action Plan”, Low-carbon Transformation and Energy Efficiency Improvement in Industrial Parks (No. 21DZ208400).

Data Availability Statement

The data used to support the findings of this study are included in the article.

Conflicts of Interest

The authors declare no conflict of interest.

Nomenclature

T z , o u t Comprehensive outdoor air temperature [°C]
T a i r , n e i g h Adjacent room air temperature [°C]
T w a l l , i n s , i Wall interior equivalent temperature [°C]
T w a l l , i n , i Wall internal surface temperature [°C]
T w i n Window temperature [°C]
T a i r Indoor air temperature [°C]
Δ T o u t Building external envelope equivalent temperature difference [°C]
Δ T i n Building internal envelope equivalent temperature difference [°C]
J w a l l o u t Exterior wall internal surface effective radiation [W]
J w a l l i n Interior wall internal surface effective radiation [W]
J w i n Window internal surface effective radiation [W]
R w a l l , o u t , i Wall external surface thermal resistance [K/W]
R w a l l , i h Wall equivalent thermal conduction resistance [K/W]
R w a l l , i n , i Wall internal surface thermal resistance [K/W]
R w i n , o u t Window external surface thermal resistance [K/W]
R w i n Window thermal conduction resistance [K/W]
R w i n , i n Window internal surface thermal resistance [K/W]
R r , w a l l , o u t Exterior wall internal surface thermal radiation resistance [K/W]
R r , w a l l , i n Interior wall internal surface thermal radiation resistance [K/W]
R r , w i n Window internal surface thermal radiation resistance [K/W]
R r , i n o u t , R r , i n w i n Space radiation thermal resistance [K/W]
r o u t Exterior envelope comprehensive thermal resistance [m2·K/W]
r i n Interior envelope comprehensive thermal resistance [m2·K/W]
K o u t Exterior envelope equivalent heat transfer coefficient [W/(m2·K)]
K i n Interior envelope equivalent heat transfer coefficient [W/(m2·K)]
K w i n Window overall heat transfer coefficient [W/(m2·K)]
A w a l l , o u t Exterior wall area [m2]
A w a l l , i n Interior wall area [m2]
A w i n Window area [m2]
V r o o m Room volume [m3]
Q s Room solar heat gain through the window [W]
Q s , i Envelope internal surface solar heat gain [W]
Q i n Building internal heat gain [W]
Q r o o m Room heat gain [W]
ϕ o u t Exterior envelope heat gain [W]
ϕ i n Interior envelope heat gain [W]
C w a l l , o u t Exterior wall thermal capacity [J/K]
C w a l l , i n Interior wall thermal capacity [J/K]
C a i r Indoor air thermal capacity [J/K]
C r o o m Room thermal capacity [J/K]
C r o o m V Room comprehensive thermal capacity per unit volume [kJ/(m3·K)]
I e x Outdoor solar radiation intensity [W/m2]
τ w i n Window transmittance

References

  1. Perez-Lombard, L.; Ortiz, J.; Pout, C. A review on buildings energy consumption information. Energy Build. 2008, 40, 394–398. [Google Scholar] [CrossRef]
  2. Bhamare, D.K.; Rathod, M.K.; Banerjee, J. Proposal of a unique index for selection of optimum phase change material for effective thermal performance of a building envelope. Sol. Energy 2021, 218, 129–141. [Google Scholar] [CrossRef]
  3. Bastide, A.; Lauret, P.; Garde, F.; Boyer, H. Building energy efficiency and thermal comfort in tropical climates—Presentation of a numerical approach for predicting the percentage of well-ventilated living spaces in buildings using natural ventilation. Energy Build. 2006, 38, 1093–1103. [Google Scholar] [CrossRef]
  4. Balaras, C.A. The role of thermal mass on the cooling load of buildings. An overview of computational methods. Energy Build. 1996, 24, 1–10. [Google Scholar] [CrossRef]
  5. Hong, T.Z.; Chou, S.K.; Bong, T.Y. Building simulation: An overview of developments and information sources. Build. Environ. 2000, 35, 347–361. [Google Scholar] [CrossRef]
  6. Li, Q.; Meng, Q.; Cai, J.; Yoshino, H.; Mochida, A. Applying support vector machine to predict hourly cooling load in the building. Appl. Energy 2009, 86, 2249–2256. [Google Scholar] [CrossRef]
  7. Fan, C.; Xiao, F.; Zhao, Y. A short-term building cooling load prediction method using deep learning algorithms. Appl. Energy 2017, 195, 222–233. [Google Scholar] [CrossRef]
  8. Dunn, G.; Knight, I. Small power equipment loads in UK office environments. Energy Build. 2005, 37, 87–91. [Google Scholar] [CrossRef]
  9. Page, J.; Robinson, D.; Morel, N.; Scartezzini, J.L. A generalised stochastic model for the simulation of occupant presence. Energy Build. 2008, 40, 83–98. [Google Scholar] [CrossRef]
  10. Kwok, S.S.K.; Lee, E.W.M. A study of the importance of occupancy to building cooling load in prediction by intelligent approach. Energy Convers. Manag. 2011, 52, 2555–2564. [Google Scholar] [CrossRef]
  11. Gupta, V.; Deb, C. Envelope design for low-energy buildings in the tropics: A review. Renew. Sustain. Energy Rev. 2023, 186, 113650. [Google Scholar] [CrossRef]
  12. Philokyprou, M.; Michael, A.; Malaktou, E.; Savvides, A. Environmentally responsive design in Eastern Mediterranean. The case of vernacular architecture in the coastal, lowland and mountainous regions of Cyprus. Build. Environ. 2017, 111, 91–109. [Google Scholar] [CrossRef]
  13. Benslimane, N.; Biara, R.W. The urban sustainable structure of the vernacular city and its modem transformation: A case study of the popular architecture in the saharian Region. In Proceedings of the International Conference on Technologies and Materials for Renewable Energy, Environment and Sustainability (TMREES), Athens, Greece, 19–21 September 2018; pp. 1241–1252. [Google Scholar]
  14. Mohammadi, A.; Saghafi, M.R.; Tahbaz, M.; Nasrollahi, F. The study of climate-responsive solutions in traditional dwellings of Bushehr City in Southern Iran. J. Build. Eng. 2018, 16, 169–183. [Google Scholar] [CrossRef]
  15. Cook, J. Architecture indigenous to extreme climates. Energy Build. 1996, 23, 277–291. [Google Scholar] [CrossRef]
  16. Almssad, A.; Almusaed, A. Environmental reply to vernacular habitat conformation from a vast areas of Scandinavia. Renew. Sustain. Energy Rev. 2015, 48, 825–834. [Google Scholar] [CrossRef]
  17. Rijal, H.B. Thermal adaptation of buildings and people for energy saving in extreme cold climate of Nepal. Energy Build. 2021, 230, 110551. [Google Scholar] [CrossRef]
  18. Motealleh, P.; Zolfaghari, M.; Parsaee, M. Investigating climate responsive solutions in vernacular architecture of Bushehr city. HBRC J. 2018, 14, 215–223. [Google Scholar] [CrossRef]
  19. Mazzone, A. Thermal comfort and cooling strategies in the Brazilian Amazon. An assessment of the concept of fuel poverty in tropical climates. Energy Policy 2020, 139, 111256. [Google Scholar] [CrossRef]
  20. Badescu, V.; Sicre, B. Renewable energy for passive house heating Part I. Building description. Energy Build. 2003, 35, 1077–1084. [Google Scholar] [CrossRef]
  21. Wang, Y. Optimization for Building Control Systems of a School Building in Passive House Standard. Ph.D. Thesis, Technische Universität München, Munich, Germany, 2015. [Google Scholar]
  22. Wang, Y.; Kuckelkorn, J.; Zhao, F.-Y.; Spliethoff, H.; Lang, W. A state of art of review on interactions between energy performance and indoor environment quality in Passive House buildings. Renew. Sustain. Energy Rev. 2017, 72, 1303–1319. [Google Scholar] [CrossRef]
  23. Hee, W.J.; Alghoul, M.A.; Bakhtyar, B.; Elayeb, O.; Shameri, M.A.; Alrubaih, M.S.; Sopian, K. The role of window glazing on daylighting and energy saving in buildings. Renew. Sustain. Energy Rev. 2015, 42, 323–343. [Google Scholar] [CrossRef]
  24. Ghosh, A. Diffuse transmission dominant smart and advanced windows for less energy-hungry building: A review. J. Build. Eng. 2023, 64, 105604. [Google Scholar] [CrossRef]
  25. Gratia, E.; De Herde, A. Design of low energy office buildings. Energy Build. 2003, 35, 473–491. [Google Scholar] [CrossRef]
  26. Xing, Y.; Hewitt, N.; Griffiths, P. Zero carbon buildings refurbishment—A Hierarchical pathway. Renew. Sustain. Energy Rev. 2011, 15, 3229–3236. [Google Scholar] [CrossRef]
  27. De Masi, R.F.; Festa, V.; Gigante, A.; Ruggiero, S.; Vanoli, G.P. The role of windows on building performance under current and future weather conditions of European climates. Energy Build. 2023, 292, 113177. [Google Scholar] [CrossRef]
  28. Chi, F.A.; Wang, Y.; Wang, R.; Li, G.; Peng, C. An investigation of optimal window-to-wall ratio based on changes in building orientations for traditional dwellings. Sol. Energy 2020, 195, 64–81. [Google Scholar] [CrossRef]
  29. Obrecht, T.P.; Premrov, M.; Leskovar, V.Z. Influence of the orientation on the optimal glazing size for passive houses in different European climates (for non-cardinal directions). Sol. Energy 2019, 189, 15–25. [Google Scholar] [CrossRef]
  30. Ashrafian, T.; Moazzen, N. The impact of glazing ratio and window configuration on occupants’ comfort and energy demand: The case study of a school building in Eskisehir, Turkey. Sustain. Cities Soc. 2019, 47, 101483. [Google Scholar] [CrossRef]
  31. Saroglou, T.; Meir, I.A.; Theodosiou, T. Quantifying Energy Consumption in Skyscrapers of Various Heights. Procedia Environ. Sci. 2017, 38, 314–321. [Google Scholar] [CrossRef]
  32. Saroglou, S.; Meir, I.A.; Theodosiou, T. Energy Efficiency of a High-Rise Office Building in the Mediterranean Climate with the Use of Different Envelope Scenarios. In Smart and Sustainable Cities and Buildings; Roggema, R., Roggema, A., Eds.; Springer International Publishing: Cham, Switzerland, 2020; pp. 651–661. [Google Scholar]
  33. Arnaoutakis, G.E.; Katsaprakakis, D.A. Energy Performance of Buildings with Thermochromic Windows in Mediterranean Climates. Energies 2021, 14, 6977. [Google Scholar] [CrossRef]
  34. Bueno, B.; Norford, L.; Pigeon, G.; Britter, R. A resistance-capacitance network model for the analysis of the interactions between the energy performance of buildings and the urban climate. Build. Environ. 2012, 54, 116–125. [Google Scholar] [CrossRef]
  35. Ogunsola, O.T.; Song, L. Application of a simplified thermal network model for real-time thermal load estimation. Energy Build. 2015, 96, 309–318. [Google Scholar] [CrossRef]
  36. Jara, E.Á.R.; de la Flor, F.J.S.; Domínguez, S.Á.; Félix, J.L.M.; Lissén, J.M.S. A new analytical approach for simplified thermal modelling of buildings: Self-Adjusting RC-network model. Energy Build. 2016, 130, 85–97. [Google Scholar] [CrossRef]
  37. Lu, L.; Chen, J.; Su, T.; Liu, X.; Hu, Y.; Luo, Q.; Luo, L. An RC-network model in the frequency domain for radiant floor heating coupled with envelopes. J. Affect. Disord. 2022, 225, 109617. [Google Scholar] [CrossRef]
  38. JGJ/T 260-2011; Technical Regulations for Heating, Ventilation and Air Conditioning Engineering Testing. China Building Industry Press: Beijing, China, 2011.
  39. JGJ/T 132-2009; Energy Efficiency Testing Standards for Residential Buildings. China Building Industry Press: Beijing, China, 2009.
  40. GB/T 31156-2014; Total Solar Energy Resources Measurement Radiation. Standardization Administration of China: Beijing, China, 2014.
  41. Stavrakakis, G.M.; Katsaprakakis, D.A.; Damasiotis, M. Basic Principles, Most Common Computational Tools, and Capabilities for Building Energy and Urban Microclimate Simulations. Energies 2021, 14, 6707. [Google Scholar] [CrossRef]
  42. Sang, G.J.P. Study on Construction System of Low Energy Consumption Residential Buildings in Tibet Plateau. Ph.D. Thesis, Xi’an University of Architecture and Technology, Xi’an, China, 2010. [Google Scholar]
  43. Tüysüz, F.; Sözer, H. Calibrating the building energy model with the short term monitored data: A case study of a large-scale residential building. Energy Build. 2020, 224, 110207. [Google Scholar] [CrossRef]
  44. Gao, L.; Liu, T.; Cao, T.; Hwang, Y.; Radermacher, R. Comparing deep learning models for multi energy vectors prediction on multiple types of building. Appl. Energy 2021, 301, 117486. [Google Scholar] [CrossRef]
  45. Ahn, Y.; Kim, B.S. Prediction of building power consumption using transfer learning-based reference building and simulation dataset. Energy Build. 2022, 258, 111717. [Google Scholar] [CrossRef]
  46. Ma, L.; Huang, Y.; Zhao, T. A synchronous prediction method for hourly energy consumption of abnormal monitoring branch based on the data-driven. Energy Build. 2022, 260, 111940. [Google Scholar] [CrossRef]
  47. Weather Data|Energy Plus. Available online: https://energyplus.net/weather (accessed on 1 October 2018).
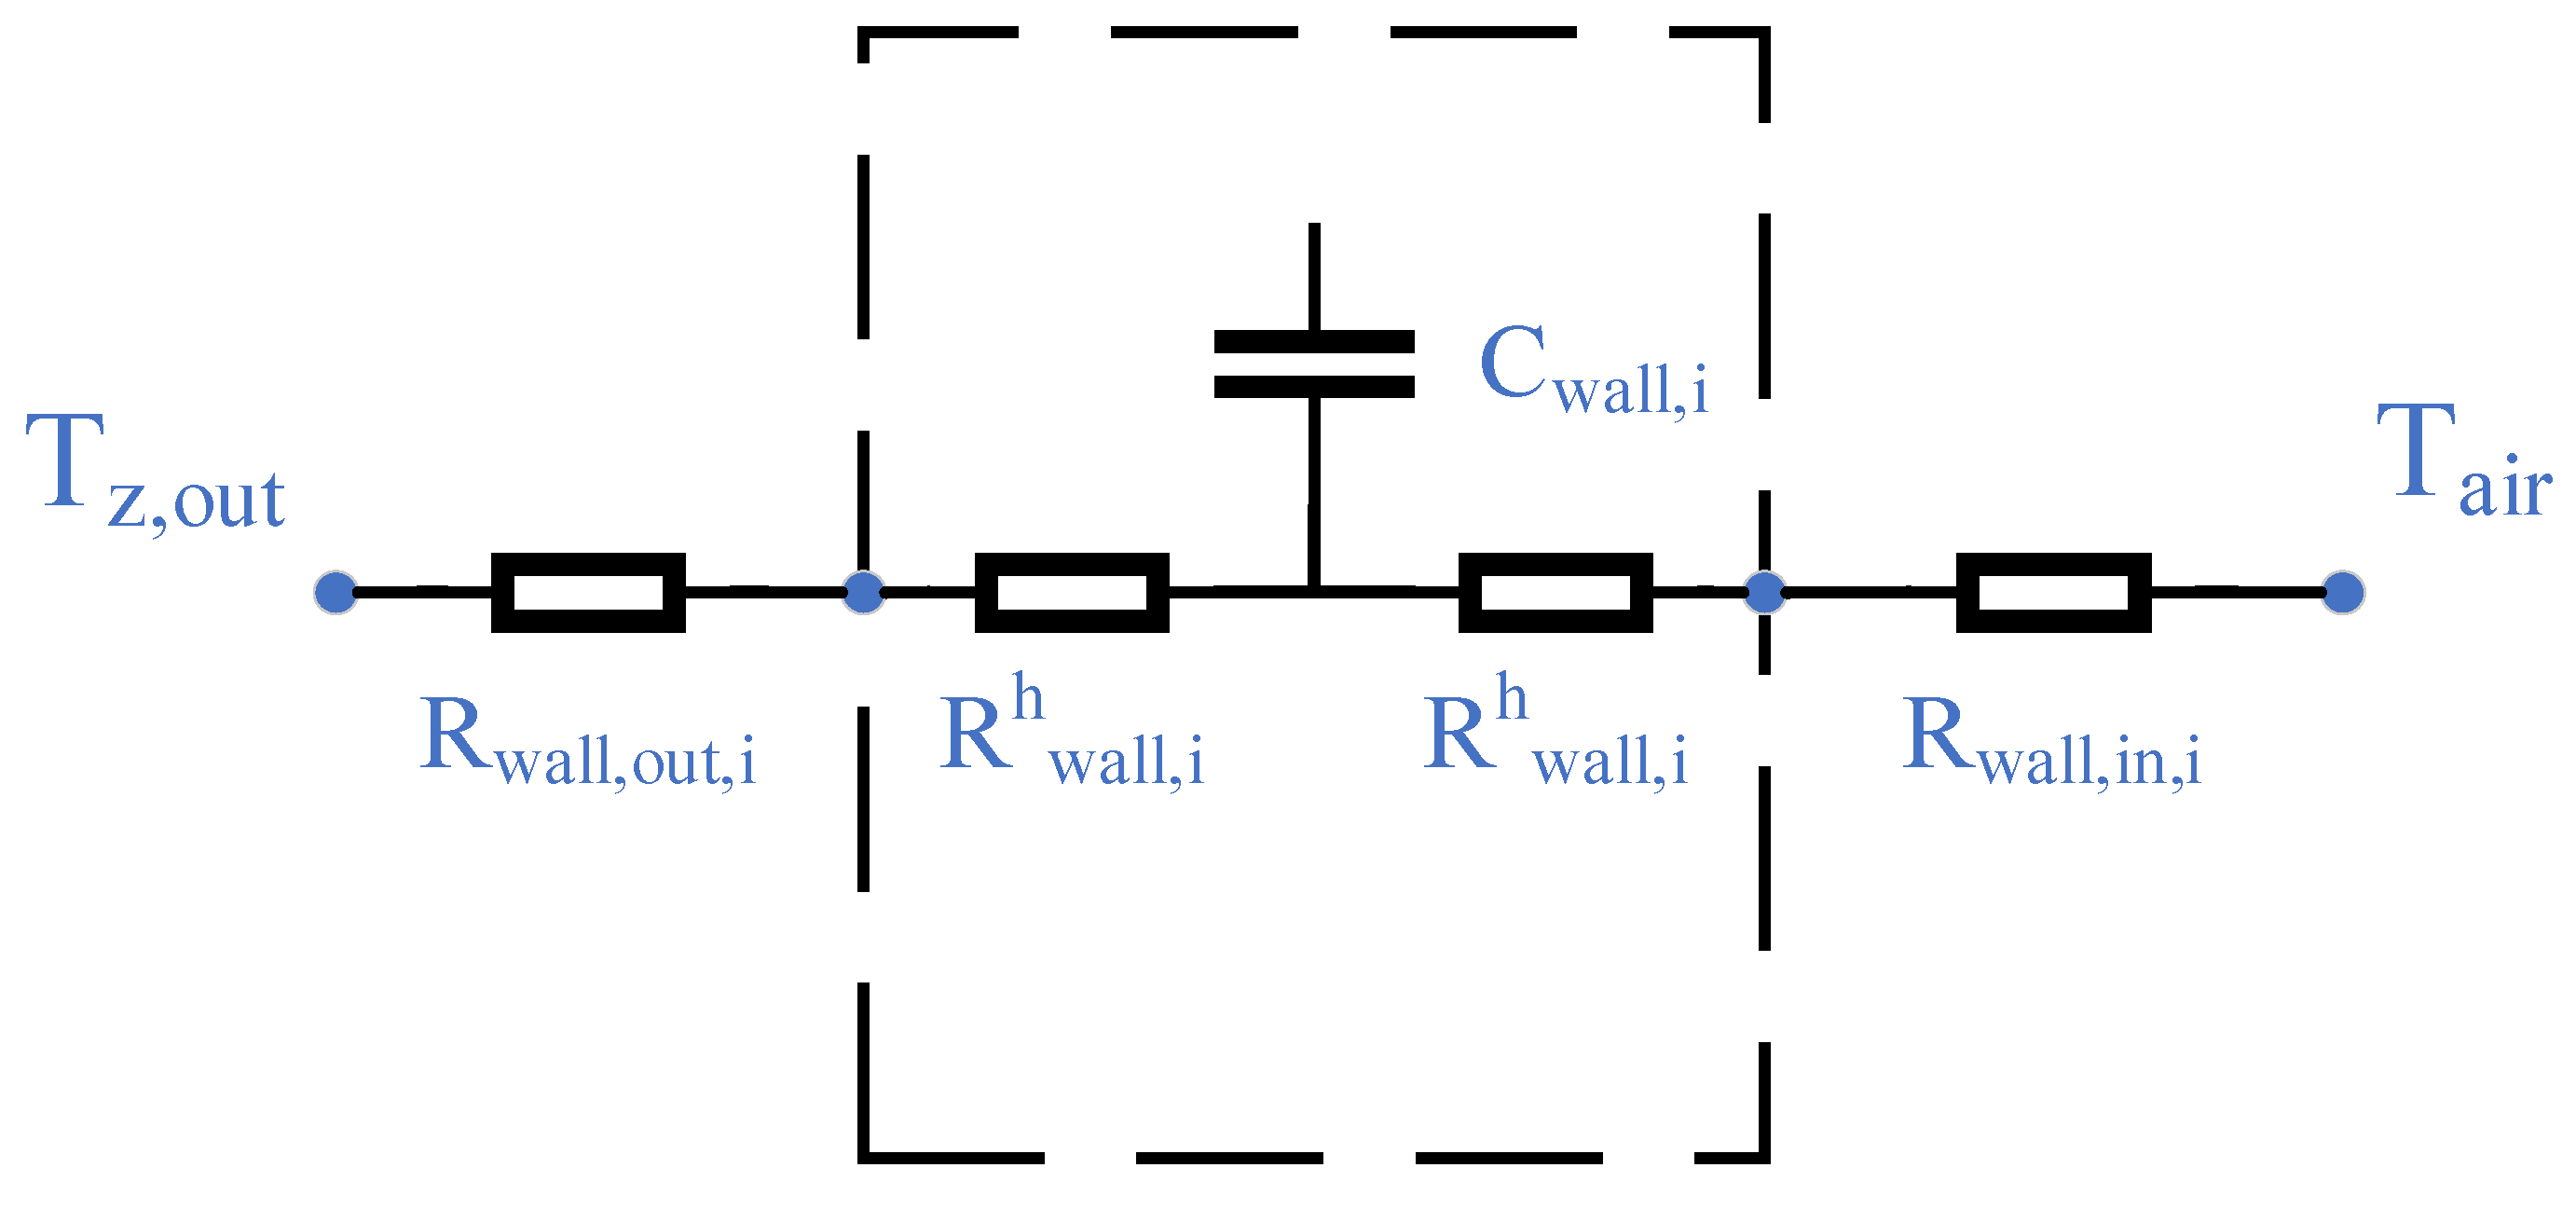
Figure 1. Simplified thermal 2R1C wall model.
Energies 16 06927 g001
Figure 2. Room thermal system. (Wallout denotes the external wall; Winout denotes the exterior window; Wallin denotes the internal wall; CHT denotes convective heat transfer; RHT denotes radiant heat transfer; Qs denotes the indoor radiant heat gain from the internal surface of a wall; and Qin is the indoor heat gain.).
Energies 16 06927 g002
Figure 3. Room heat transfer RC model.
Energies 16 06927 g003
Figure 5. Local dwellings. (Photo by authors).
Energies 16 06927 g005
Figure 6. Light and occupancy schedules.
Energies 16 06927 g006
Figure 7. Building model.
Energies 16 06927 g007
Figure 8. Dwelling layouts and test points. (The red dots indicate the location of the measurement points).
Energies 16 06927 g008
Figure 9. Indoor and outdoor temperature of concrete wall building.
Energies 16 06927 g009
Figure 10. Indoor and outdoor temperature of stone wall building.
Energies 16 06927 g010
Figure 11. Indoor and outdoor temperature of abode wall building.
Energies 16 06927 g011
Table 1. Room heat transfer RC model parameters.
CategoryParameter
Temperature Node T z , o u t , T a i r . n e i g h , T w a l l , i n s , 1 , T w a l l , i n , 1 , T w a l l , i n s , 2 , T w a l l , i n , 2 T w i n , T a i r
Radiance Node J w a l l o u t , J w a l l i n , J w i n
Thermal Resistance R w a l l , o u t , 1 , R w a l l , 1 h , R w a l l , i n , 1 , R w a l l , o u t , 2 , R w a l l , 2 h , R w a l l , i n , 2
R w i n , o u t , R w i n , R w i n , i n , R r , w a l l , o u t , R r , w a l l , i n , R r , w i n , R r , i n o u t , R r , i n w i n
Indoor Heat Gain Q i n
Solar Heat Gain Q s , o u t w a l l , Q s , i n w a l l , Q s , w i n
Table 2. Instrumentation.
ParameterInstrumentRangeAccuracy
Temperature and HumidityHOBO
U12-011
−20~70 °C,
0–95%
0.5 °C, 5% RH
Outdoor TemperatureHOBO
H21-USB
−40~+75 °C±0.21 °C
Outdoor Humidity0~100%±2.5%
Total Solar
Radiation Intensity
0~1680
W/m2
±10 W/m2
Table 3. Main materials of Lhasa residential building walls.
MaterialThermal Conductivity
[W/(m·K)]
Thermal Storage Coefficient
[W/(m2·K)]
Specific Heat Capacity
[kJ/(kg·K)]
Density
[kg/m3]
Stone2.4519.260.822320
Crushed concrete1.8416.580.752100–2600
Clay0.709.241.051600
EPS 0.0280.462.150
Table 4. Input parameters.
ParameterCase 1
(Benchmark Case)
Case 2Case 3
Adjacent room air temperature [°C]18.018.018.0
Comprehensive outdoor
air temperature [°C]
48.748.748.7
Window overall heat
transfer coefficient [W/(m2·K)]
1.51.41.7
Outdoor solar radiation intensity [W/m2]768768768
Window transmittance0.870.870.91
Window–wall ratio0.50.50.5
External wall thickness [m]0.340.520.46
Interior wall thickness [m]0.300.300.30
External wall
Thermal conductivity [W/(m·K)]
0.180.702.45
Interior wall
Thermal conductivity [W/(m·K)]
1.841.841.84
External wall density [kg/m3]207416002320
Interior wall density [kg/m3]234422152026
External envelope comprehensive
thermal resistance [m2·K/W]
3.463.463.46
Interior envelope comprehensive
thermal resistance [m2·K/W]
7.237.237.23
Room comprehensive thermal capacity per unit volume [kJ/(m3·K)]853853853
Table 5. Different wall construction and thermal performance.
WallConstruction
(From Outside to Inside)
Thermal Conductivity [W/(m·K)]Thermal Inertia Index
Crushed concreteExternal wall40 mm EPS + 300 mm concrete0.573.28
Interior wall300 mm concrete3.062.62
ClayExternal wall25 mm mud + 500 mm clay + 25 mm mud1.017.28
Interior wall25 mm mud + 500 mm clay + 25 mm mud1.017.28
StoneExternal wall550 mm stone2.544.32
Interior wall550 mm stone2.544.32
Table 6. Quantified differences.
RoomMBECVRMSE
Living room5.79%11.48%
Storage room8.25%17.91%
Bedroom17.12%13.89%
Bedroom29.95%15.30%
Table 7. Quantified differences between cases I and II.
RoomMBECVRMSE
Living room2.56%1.44%
Storage room3.67%2.92%
Bedroom11.53%0.39%
Bedroom21.42%0.42%
Table 8. Quantified differences between cases I and III.
RoomMBECVRMSE
Living room0.40%0.06%
Storage room0.57%0.09%
Bedroom10.62%0.07%
Bedroom20.28%0.02%
Table 9. Input parameters.
ParameterConcrete BuildingStone BuildingAdobe Brick
Building
Adjacent room
air temperature [°C]
18.018.018.0
Comprehensive outdoor
air temperature [°C]
48.748.748.7
Window overall heat transfer coefficient [W/(m2·K)]1.51.51.5
Outdoor solar
radiation intensity [W/m2]
768768768
Window transmittance0.870.870.87
Window–wall ratio0.500.400.40
External wall thickness [m]0.340.550.50
Interior wall thickness [m]0.300.550.50
External wall thermal conductivity [W/(m·K)]0.182.450.93
Interior wall thermal
Conductivity [W/(m·K)]
1.842.450.93
External wall density [kg/m3]207426401600
Interior wall density [kg/m3]234426401600
Table 10. Room comprehensive thermal index.
IndexConcrete BuildingStone BuildingAdobe Brick
Building
External wall comprehensive thermal resistance [m2·K/W]3.461.685.90
Interior wall comprehensive thermal resistance [m2·K/W]7.237.8221.05
Room comprehensive thermal capacity per unit volume [kJ/(m3·K)]85311701744
Table 11. Input parameters.
ParameterConcrete BuildingStone BuildingAdobe Brick
Building
Adjacent room
air temperature [°C]
−3.1−3.1−3.1
Comprehensive outdoor
air temperature [°C]
28.128.128.1
Window overall heat transfer coefficient [W/(m2·K)]1.51.51.5
Outdoor solar
radiation intensity [W/m2]
779779779
Window transmittance0.870.870.87
Window–wall ratio0.500.400.40
External wall thickness [m]0.340.550.50
Interior wall thickness [m]0.300.550.50
External wall thermal conductivity [W/(m·K)]0.182.450.93
Interior wall thermal
Conductivity [W/(m·K)]
1.842.450.93
External wall density [kg/m3]207426401600
Interior wall density [kg/m3]234426401600
Table 12. Room comprehensive thermal index.
IndexConcrete BuildingStone BuildingAdobe Brick
Building
External wall comprehensive thermal resistance [m2·K/W]3.271.585.69
Interior wall comprehensive thermal resistance [m2·K/W]6.837.4520.12
Room comprehensive thermal capacity per unit volume [kJ/(m3·K)]85311701744
Disclaimer/Publisher’s Note: The statements, opinions and data contained in all publications are solely those of the individual author(s) and contributor(s) and not of MDPI and/or the editor(s). MDPI and/or the editor(s) disclaim responsibility for any injury to people or property resulting from any ideas, methods, instructions or products referred to in the content.