Article

Predicting Silica Deposition from Superheated, Pressurized Steam Using Numerical Modeling of Nucleation, Agglomeration and Deposition

1
Department of Energy and Process Technology, Norwegian University of Science and Technology, 7491 Trondheim, Norway
2
Department of Chemistry, Norwegian University of Science and Technology, 7491 Trondheim, Norway
3
Department of Chemical Engineering, Norwegian University of Science and Technology, 7491 Trondheim, Norway
4
Department of Metallurgical and Materials Engineering, Middle East Technical University, 06800 Ankara, Turkey
*
Author to whom correspondence should be addressed.
Energies 2023, 16(19), 6906; https://doi.org/10.3390/en16196906
Submission received: 3 August 2023 / Revised: 20 September 2023 / Accepted: 25 September 2023 / Published: 30 September 2023
(This article belongs to the Section J: Thermal Management)

Abstract

:
A model that can be used to quantify silica deposition from superheated depressurized steam is developed. Classical nucleation theory, agglomeration and deposition onto a wall are combined in a numerical model that calculates the concentration profile, the particle size distribution and the deposition in a flow through a pipeline after a sudden increase in supersaturation. The work presented here is an important step in understanding the mechanisms governing precipitation from supercritical and superheated steam as produced by deep geothermal wells drilled in magmatic areas. The power potential in such systems can be significantly higher than for conventional systems if utilized efficiently. The presented results can be applied to improve industrial designs and decrease energy costs. The model predicts the amount of precipitation along a pipe at various supersaturations, and the resulting deposition velocity in a straight pipe correlates fairly well with recent experimental results. There is a high number of nanocolloids formed close to the pressure reduction position, where deposition is at its maximum. Downstream, larger agglomerates develop, and deposition decreases as the number of particles and the overall concentration decreases. The local maximum deposition rate increases with increasing supersaturation. The calculations show that deposition mechanisms are as important as the chemical process of solidification when estimating where and how most material will be deposited. The rapid formation and deposition of solids predicted indicate that depressurization along with solid capture could be used to rid fluid of silica.

1. Introduction

Geothermal energy is an important source of low-carbon emission, weather-independent, baseload energy in the near future. Geothermal energy from supercritical sources is superior in its low power cost if such resources can be utilized efficiently [1,2]. It is known that silica solubility in superheated steam increases with pressure [3]. The kinetics of precipitation from pressurized steam differ from the solidification of silica in liquid water. Research on precipitation of silica from highly supersaturated superheated steam is scarce, as exploration of geothermal wells from supercritical waters, where silica content is expected to be high [4], is relatively new. Knowledge of particle number density, size and time scales of growth in different depressurization scenarios is essential to handle deposits and avoid scaling in inconvenient parts of the steam processing.
The inspiration for the hot case well considered in this paper is the deep wells drilled into near magmatic areas as attempted by the Iceland Deep Drilling Project (IDDP) and several other projects in recent years [5,6,7]. The IDDP1 well showed that production close to a magma plume was possible and hit the record as the hottest-producing well on the planet in 2010 [8,9]. If supercritical fluids similar to that modeled in the case study for this paper are used in a steam turbine where silica is extracted without energy loss, the electric power per well can be up to 49 MW for a well producing at 50 kg/s [10]. The thermal efficiency, η t h = W o u t / Q i n , can be up to 50%, compared to a conventional well that may range between 8–20%. The concept, therefore, represents a significant decrease in energy cost per well. Conventional silica handling involves quenching of the fluid, which leads to a potential decrease of down to 30 MW of electric power per well [10]. Knowledge that may lead to improved methods for silica handling is, thus, important to maximize power output. This, however, requires knowledge of the detailed process of precipitation from depressurized supercritical steam with relatively high mineral concentrations. References [10,11] compare different methods of utilizing the geothermal steam from a supercritical fluid reservoir considering silica precipitation and formation of hydrochloric acid, respectively.
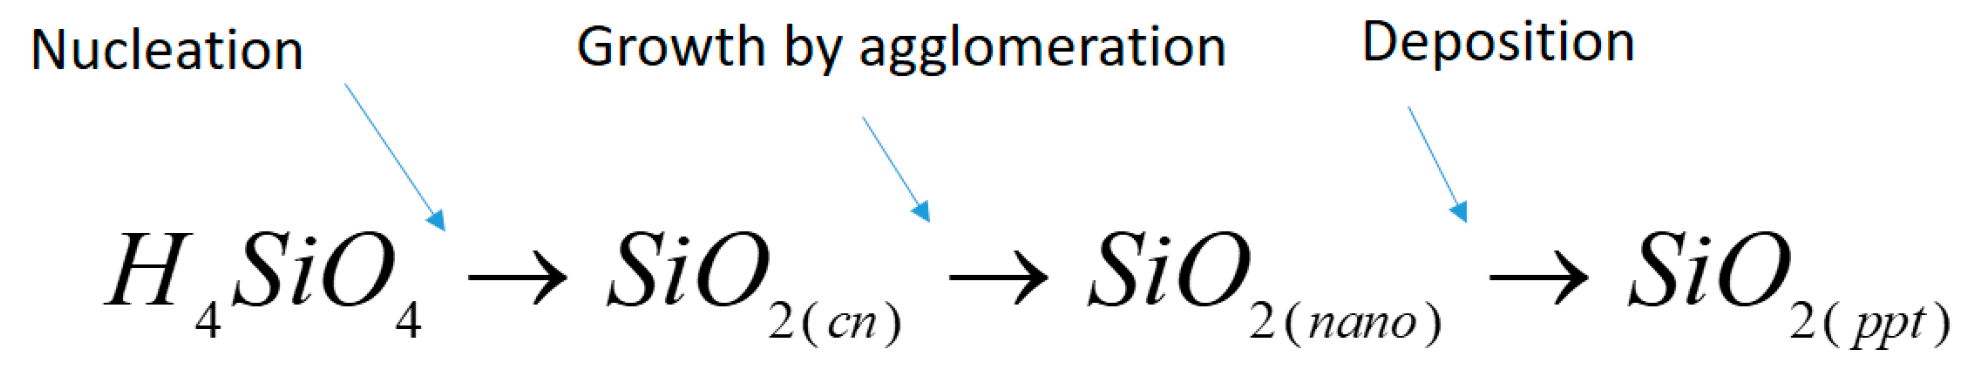
The model presented in this paper describes the precipitation process of solid silica from steam at varying pressures and a constant enthalpy. The model quantifies the total deposited material in a specific system for varying initial supersaturation values. Supersaturation is herein defined as the ratio of the actual concentration of silicic acid in the solution to the equilibrium concentration for amorphous silica. The calculated deposition rate presented is based on the numerical integration of the classical nucleation theory and growth by agglomeration. To complete the model, the deposition of particles onto a surface and hydrodynamic effects are included. These three separate processes are co-dependent, as illustrated in Figure 1.
The concentration of solid particles in the solution will affect the agglomeration rate. The size development of the particles determines the transport of solids to the wall of the pipeline. The deposition rate will, in turn, affect the concentration of solid particles in the solution. Critical nuclei and nanocolloids are both defined as solid forms of silica in the bulk. All size ranges of solid silica may deposit. However, the total number concentration in each size range affects the agglomeration rate. As the deposition velocity and agglomeration rates are different for each size range, the agglomeration rate will affect the further agglomeration and the deposition rate.
Although there is a lack of research data for silica nanocolloid formation in steam, a lot of information is gathered on experimental and theoretical research of silica solidification and growth in liquid water. Despite the vast amount of research on the kinetic process of silica polymerization and nanocolloid formation in both pure water [12,13,14,15,16,17,18,19,20,21] and in natural waters or simulated geothermal systems [22,23,24,25,26,27,28,29,30,31], there is still strong disagreement between the experimental results. As a result, the reaction rates and the kinetic models used to explain silica precipitation in aqueous solutions vary.
Observations made in the Icelandic Deep Drilling Project, especially the geothermal fluid produced from well IDDP1, give indications of the nature and morphology of the silica precipitate from superheated pressurized steam with this specific chemical composition. During the flow testing in 2010–2012, where geothermal steam of 145 bar and 450 °C was produced at the wellhead, precipitation was apparent within the first few days of testing [9]. When the well reached 500 °C, white dust started depositing on the silencer rocks. The control orifices used to limit the well flow also showed signs of clogging due to the silica scale. The clogging of a 26.6 mm bed after only 24 days indicates high scaling rates [32]. The scale was characterized as soft, porous and removable by compressed air. A scaling experiment performed by Hauksson Kemia and Markusson is described in [9], where pressure drops were induced by a cascade of orifices with a pipe section in between. The work quantifies the precipitation on each orifice plate, but primary particle size development, concentration of solids versus dissolved material in each stage and deposition velocity in these conditions remain unknown. In the review presented by reference [33], previous work relevant to silica precipitation behavior in supercritical fluids and superheated pressurized steam is analyzed further.
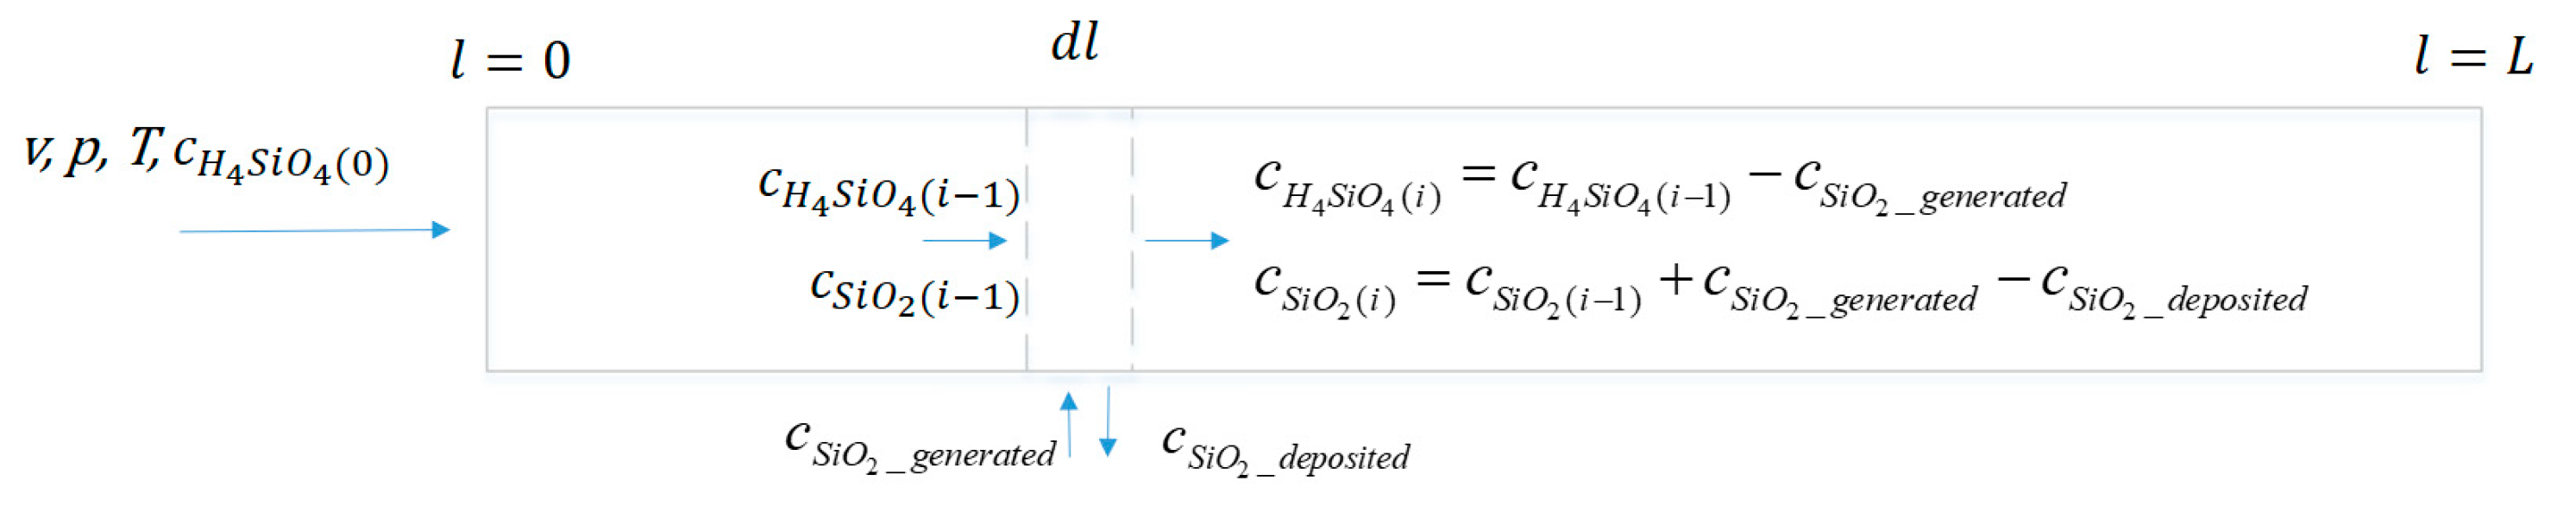
Figure 2 represents a pipe segment after a sudden depressurization where supersaturation is only affected by the change in concentration of dissolved silicic acid due to precipitation. The initial conditions, velocity v, pressure p, temperature T, concentration of dissolved silicic acid c, and the supersaturation S, are known. Supersaturation, S, is defined as the ratio of the actual concentration of silicic acid in the solution to the equilibrium concentration for amorphous silica. The cause of the increase in supersaturation can be a sudden pressure drop so that the time required to achieve the supersaturation is fast enough to be considered instantaneous.

2. Materials and Methods

Nucleation, by definition, applies to both a new thermodynamic phase and a self-organizing new structure. The standard theory that describes the behavior for the nucleation of a new thermodynamic phase from a stochastic process is called classical nucleation theory [34]. The classical nucleation theory is a physical model with several assumptions that may or may not hold. It has been shown to give reasonable results when compared to computer simulations but may not be relied upon for accuracy [35]. The nucleation theorem relates nucleation rate, the nucleus size and the supersaturation.
In classical nucleation theory, the total change in Gibbs free energy, Δ G r , during formation of a solid in a solution is the sum of the total change in Gibbs surface free energy and change in Gibbs volume free energy as given in Equations (1)–(4), respectively [34].
Δ G r = Δ G V + Δ G S
Δ G S = A S γ
Δ G V = V Δ G v = V Δ μ V m
Δ μ = R T ln ( a a )
In these equations, AS is the surface area, V is the volume of a particle of radius, r, γ is the interfacial free energy [J/m2], V m is the molecular volume = M / ( ρ c N A ) [m3/molecule] and Δ μ is the chemical potential difference per solute mol. When looking at dilute solutions, the activity, a, represents the free concentration of a chemical specie that, in an ideal solution, is equal to the concentration in molar units. a*, is the equilibrium concentration and is a function of specific volume. The surface free energy, Δ G S , denotes the free energetic cost of creating a surface, and it increases with increasing interfacial free energy between the solid surface and solution and the particle radius. The average of the interfacial free energies reported is 0.092 J/m2 for amorphous silica surfaces in water [13,36,37]. The volume of excess free energy, Δ G V , depends on the change in chemical potential and, therefore, the degree of supersaturation in the solution.
The nucleus is a structural cluster of molecules above the critical radius rcrit. Below this radius, the nucleus is unstable and will dissolve. Above this radius, the nucleus is stable and will continue to grow. The maximum of the Gibbs free energy will be at the critical radius, and the critical radius can, therefore, be defined by Equation (5).
r c r i t = 2 γ V m Δ μ
Crystallization is viewed as a first-order phase transition along two order parameters, namely concentration and structure. In a situation where crystals nucleate from a melt, mainly structural fluctuations are needed. In the situation where crystallization occurs in a dilute solution, both structural and density fluctuations need to take place. In the classical approach to nucleation, these two processes are assumed to take place simultaneously [34].
The nucleation rate, J, was first proposed as proportional to the exponential of the energy required to form a nucleus over the Boltzmann constant and temperature by Volmer and Weber in 1929. Later, Becker, Döring and Zeldovic provided important insight into the kinetic nature of the prefactor, leading to the expressions in Equations (6) and (7) [34]. J is then the product of a thermodynamic barrier and a kinetic barrier given by the rate of atomic attachment. In Equation (6), A is the kinetic factor made up by f*, the rate of transport and attachment of new molecules on the surface. NS is the number of nucleation sites available. Z is called the Zeldovich factor, and it is the probability that a nucleus at the top of the barrier will go on to form the new phase and not dissolve. Z can be calculated [38] but is often close to unity.
J = A exp Δ G k T
A = Z f N S
There are many expressions for the rate of attachment of new molecules on the surface found in the literature [39]. Usually, in dilute solutions, either the transport of molecules to the surface of the particle, the condensation reaction on the surface of the particle, or the structural organization of the crystal will govern the kinetic factor. In the case of amorphous precipitation, both surface reactions and diffusion must be compared as the limiting factor. The Brownian motion diffusion coefficient for Silica, D S i , can be determined by the Stokes–Einstein equation (Equation (8)) [40]. Equations (9) and (10) are provided for calculation of the volume diffusion-controlled kinetic factor, A V D , and the surface integration-controlled kinetic factor, A S I , respectively [34]. The lesser of these will be the rate-limiting kinetic barrier. In Equations (8)–(10), k b is the Boltzmann constant, c e q is the equilibrium concentration of silicic acid and d p is the particle diameter.
D S i = k b T 3 π ν ρ d p
A V D = k b T γ D S i c e q N A V m ln S
A S I = 2 γ k T D S i c e q N A 2 r
Several experimental studies on homogenous nucleation in various systems have been compared to results from the classical nucleation theory in the last decade. Experimental studies have mostly confirmed classical nucleation theory to be fairly correct, at least for unary systems of non-polar molecules [41,42]. The theory has also been modified and extended with some success to address a wide variety of issues, including multicomponent nucleation [43]. The calculated results remain sensitive to assumptions regarding the interfacial free energy, the value of which varies in the literature. Also, the assumption that the interfacial free energy of a nucleus is equivalent to that of a macroscopic flat surface is known to be true on a molecular level. Surface energy of nanocolloids depends on radius of curvature. Nevertheless, the assumptions allow for a reasonably accurate analysis [35,44]. An atomistic approach, like Molecular Dynamics simulation, takes care of the pathways of individual molecules in the nucleation process. However, this method is limited in the size of discrete cluster it can consider.
If a solid surface is available, heterogeneous primary nucleation will occur before homogenous nucleation. The activation energy barrier for nucleation is lower in this case due to the reduced energetic cost of creating the surface. Free energy required for heterogeneous nucleation is lower than homogenous nucleation by a factor related to the contact angle between the nuclei and the foreign substrate. When nucleation sites are available, the probability of nucleation increases as a result of the lower activation energy barrier. The nucleation rate is often enhanced due to the effects of the nucleation sites on kinetic factors of nucleation.
The following assumptions apply for calculation of the nucleation rate presented herein:
  • The thermodynamic barrier for formation of a nucleus is that of the total Gibbs free energy corresponding to the critical radius. This is calculated according to Equations (1)–(4).
  • Interfacial free energy is assumed to be constant with a value of 0.092 J/m2
  • The process is limited by transport of molecules to the surface of the nucleation site as opposed to dehydration and attachment. This assumption can be justified by the relatively low concentration of silicic acid molecules in the solution. Further, the transport of molecules to the surface is mainly by diffusion, and Stokes–Einstein equation (Equation (8)) can be used to determine the diffusion coefficient.
  • The kinetic barrier for formation of a nucleus can be determined by Equation (9) (volume-diffusion controlled kinetic factor), with dimension (number of nuclei). The kinetic factor for surface integration control was also calculated by Equation (10), but as this equation yields slightly higher values, the volume diffusion mechanism is, therefore, taken as limiting for all temperatures and supersaturations in the investigated range.
  • The number of available nucleation sites is equal to the initial total number of silicic acid molecules in the solution per cubic meter of water.
A realistic initial concentration of silicic acid is derived from quartz solubility data for this pressure and temperature condition, assuming that the reservoir is in equilibrium and neglecting the effect of other species in the water. The initial concentration of silicic acid is calculated according to the well-known correlation described in reference [
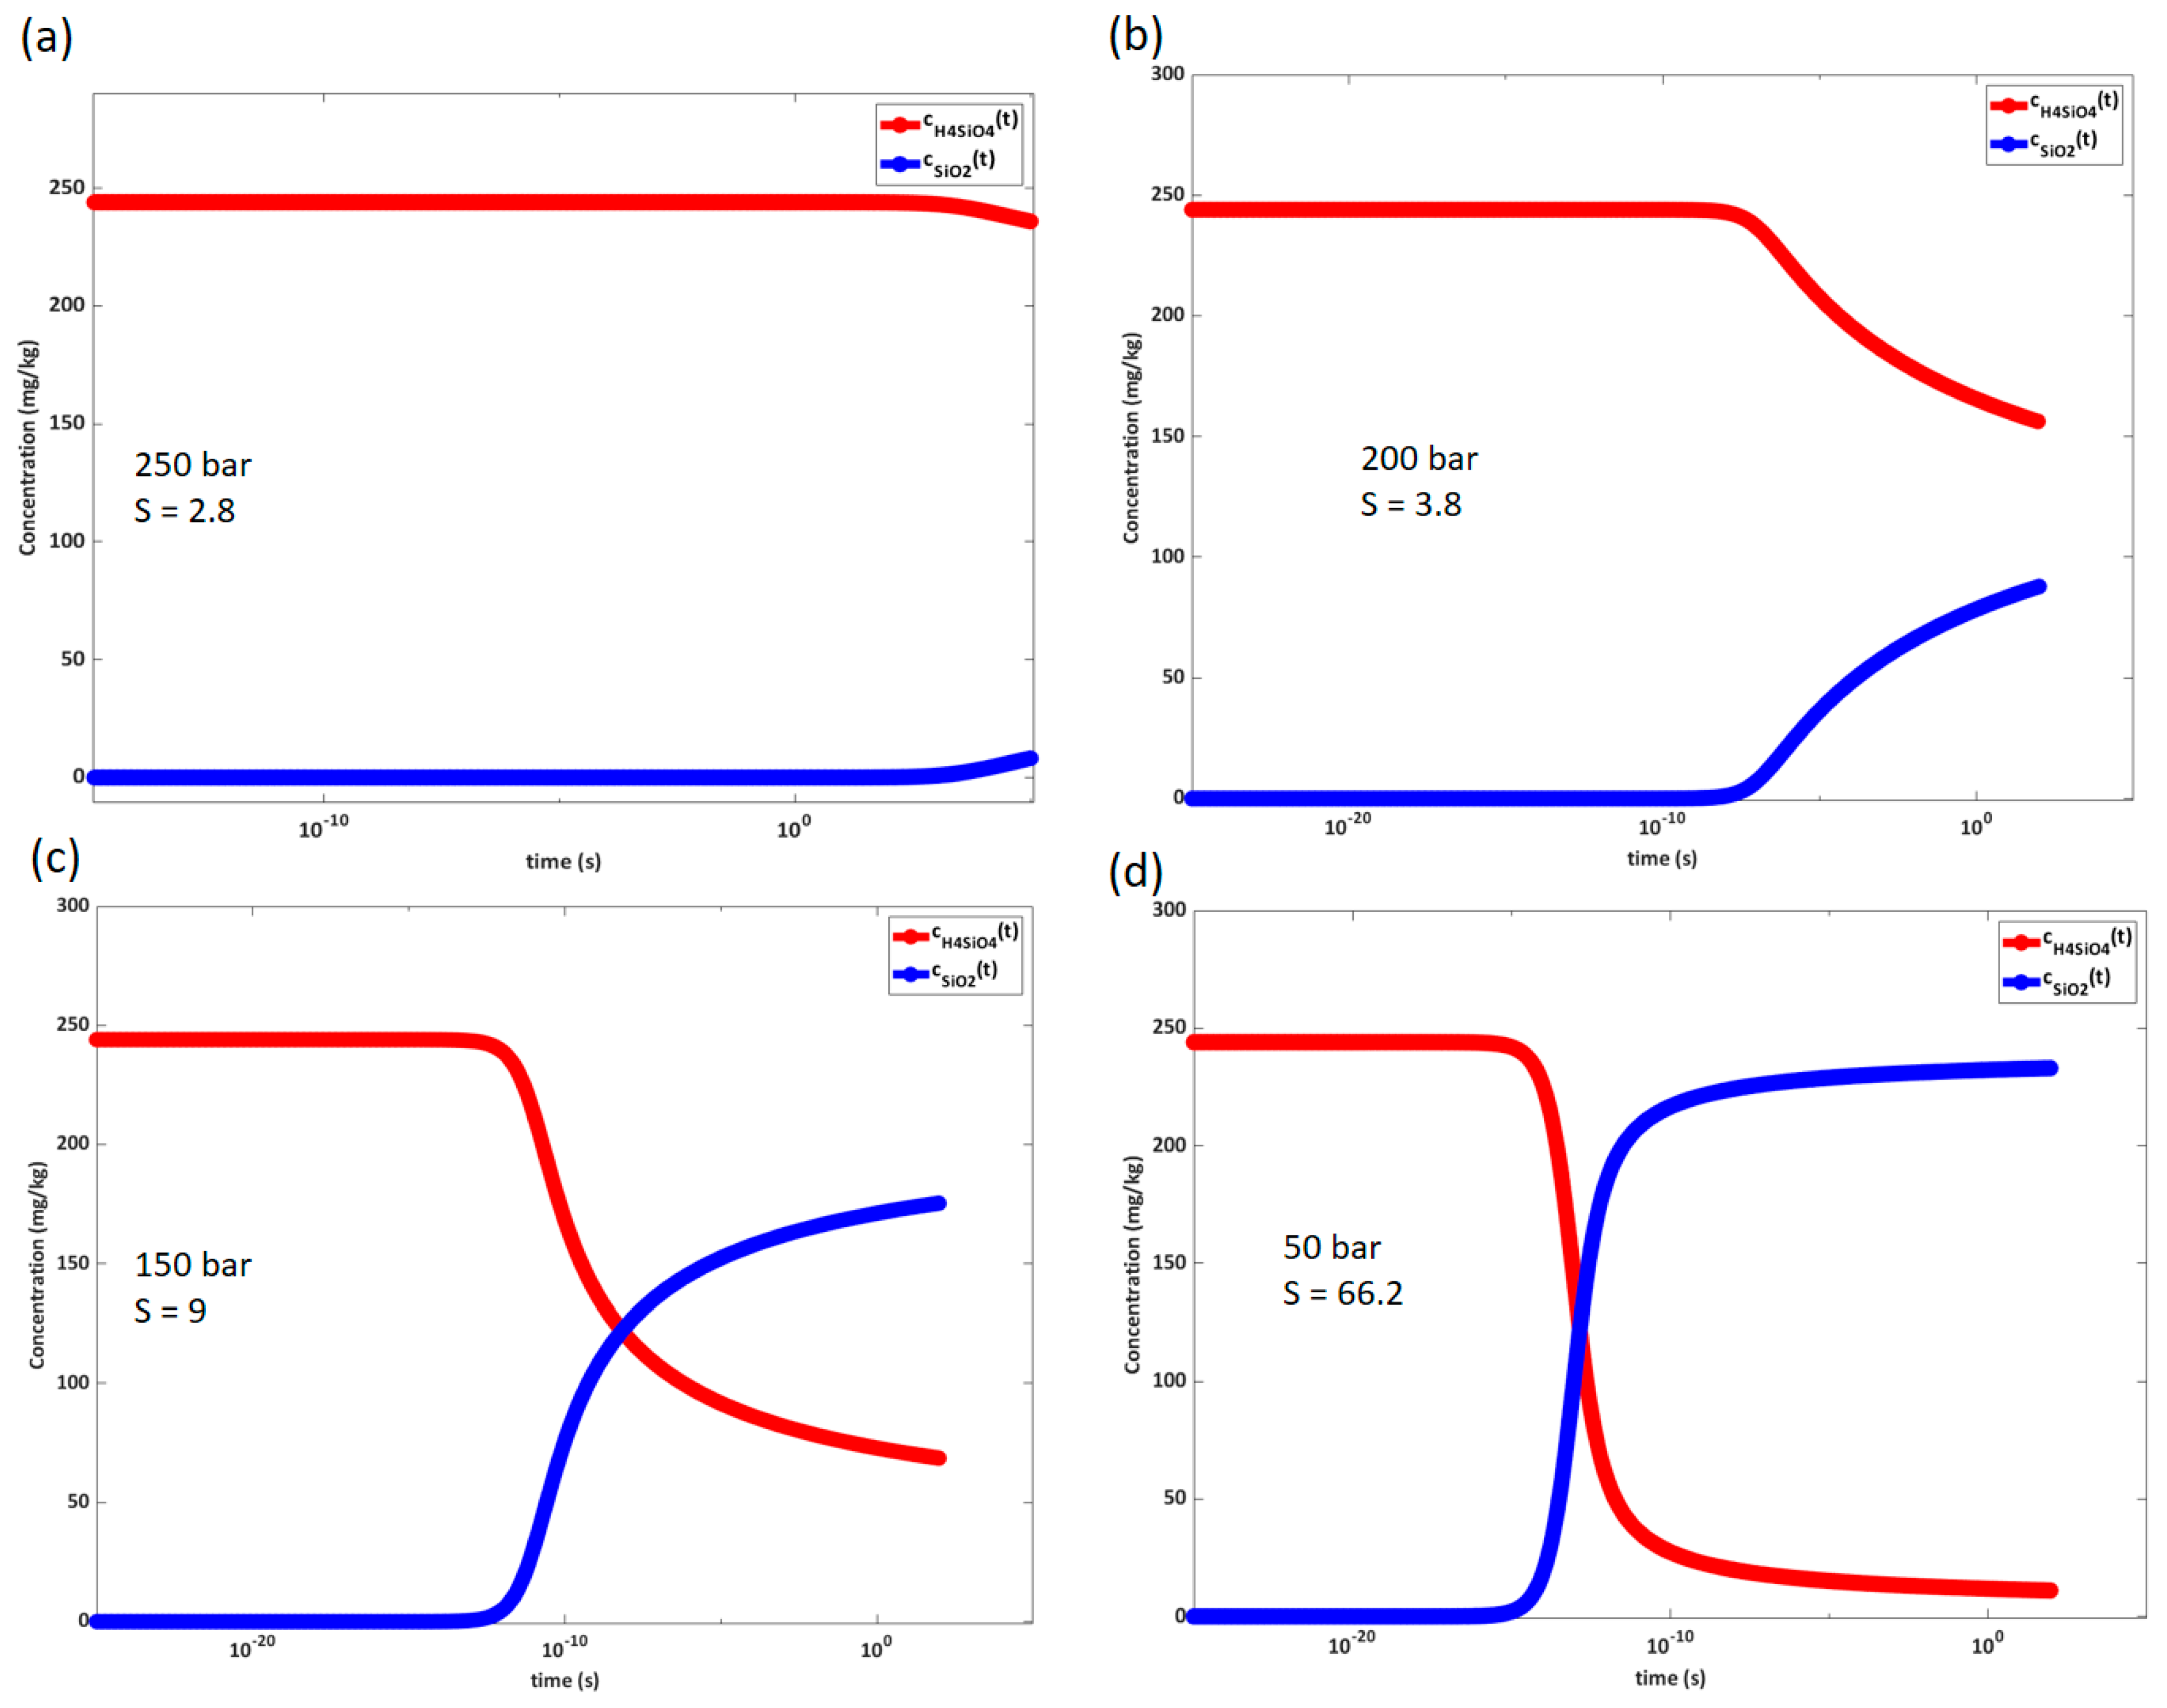
45] to be 244 mg/kg for quartz in pure water. Precipitation is evaluated for sudden depressurization to varying pressures. Amorphous silica solubility is used to determine precipitation potential.
The solubility of amorphous silica in the steam phase presented here and used further in the model relies mainly on the work of [46] and the experimental values of [47,48]. The data are density-corrected and interpolated to obtain complete amorphous silica solubility data along the isenthalpic line [33].
The further development of the population balance will be affected both by continuous chemically controlled polymerization, herein modeled by classical nucleation theory, and by growth of the nanocolloids formed. When comparing calculated agglomeration rates in a turbulent pipe flow with experimentally determined surface growth rates in liquid water [18,19,21,49], the latter is negligible. In a literature review for similar conditions, it is proposed that for precipitation from highly supersaturated steam, two-step dominate precipitation, nucleation of critical-sized particles and growth of these particles by agglomeration. To determine scaling on a surface or remaining precipitate in the fluid at any given point, a third step, namely deposition of the precipitate on a surface, is as important [33].
Agglomeration is, by definition, the process of several particles coming together to form one larger particle. The process involves transport of particles, collision, interaction and loose attachment, either rupture and dissolution or formation of stronger bonds leading to partly or fully cementation [34]. Fluid motion, particle interaction forces and turbulent diffusivity play an important role in the relative motion of particles and the resulting collision rate. Four types of collisions are often recognized: those due to Brownian motion (perikinetic collisions), those due to the velocity gradient in a laminar or turbulent flow field (orthokinetic collisions), those due to the gravitational settling of particles (inertial collisions) and those due to stirring. Only the two first are relevant for the particle sizes considered here. For the smaller particles, Brownian motion will be governing, then as particles grow, the effect of turbulent diffusivity increases exponentially.
The process of loose attachment is largely governed by the collision rate and particle-particle interaction forces. While there are models for estimating the particle collision rate in turbulent flow, the accurate determination of the effect of repulsive forces may be difficult [50]. The concept of collision efficiency takes into account that not all collisions are successful in forming an attachment. The cementation process is directly related to the growth rate in the corners and spaces between touching particles. The probability of attachment can be expressed as a power law as in Equation (11), where P is the probability, Eb is the energy barrier, kb is the Boltzmann constant and T is absolute temperature.
P e ( E b / k b T )
As it is difficult to model the steps of agglomeration separately, the overall agglomeration rate is mostly described with one size-dependent function combining the effects of collision, interaction, rupture and cementation. This is the agglomeration rate constant, also called agglomeration kernel β a g g , calculated as per Equation (12) [34]. This is often split into a size-independent part β 0 , determined by process conditions and the size-dependent part β 1 , which depends upon characteristic lengths.
β a g g ( L i , L j , ε , S ) = β 0 ( ε , S ) β 1 ( L i , L j )
In this equation, L i and L j , are characteristic lengths of the two approaching particles, ε , is the turbulent energy dissipation and, S, is supersaturation. Several models for the agglomeration kernel exist in the literature [34], but most do not include supersaturation, which has been shown to also significantly affect the agglomeration rate. The size-dependent kernel function is mostly derived only from the collision mechanism. The kernels most commonly used for solid particle precipitation are given in Equations (13)–(16) [34]. These are size-dependent Brownian motion agglomeration kernel, process-dependent Brownian motion agglomeration kernel, process-dependent turbulent shear agglomeration kernel and size-dependent turbulent shear kernel, respectively.
β 1 _ B M = ( L i + L j ) ( 1 L i + 1 L j )
β 0 _ B M = 2 k b T 3 μ
β 0 _ T S = ε ν
β 1 _ T S = ( L i + L j ) 3
In these equations, as previously, kb is Boltzmann constant, T is absolute temperature, μ is the dynamic viscosity, ε is the turbulent dissipation, assumedly equal to 0.1, and ν is the kinematic viscosity.
Silica deposition in steam has been shown to vary with hydrodynamic conditions [50,51]. In some chemical and hydrodynamic conditions, protrusions of silica have been observed [26,50]. These types of scale formations will likely be sensitive to varying hydrodynamic conditions. Particle deposition from gas streams is a well-researched area. 
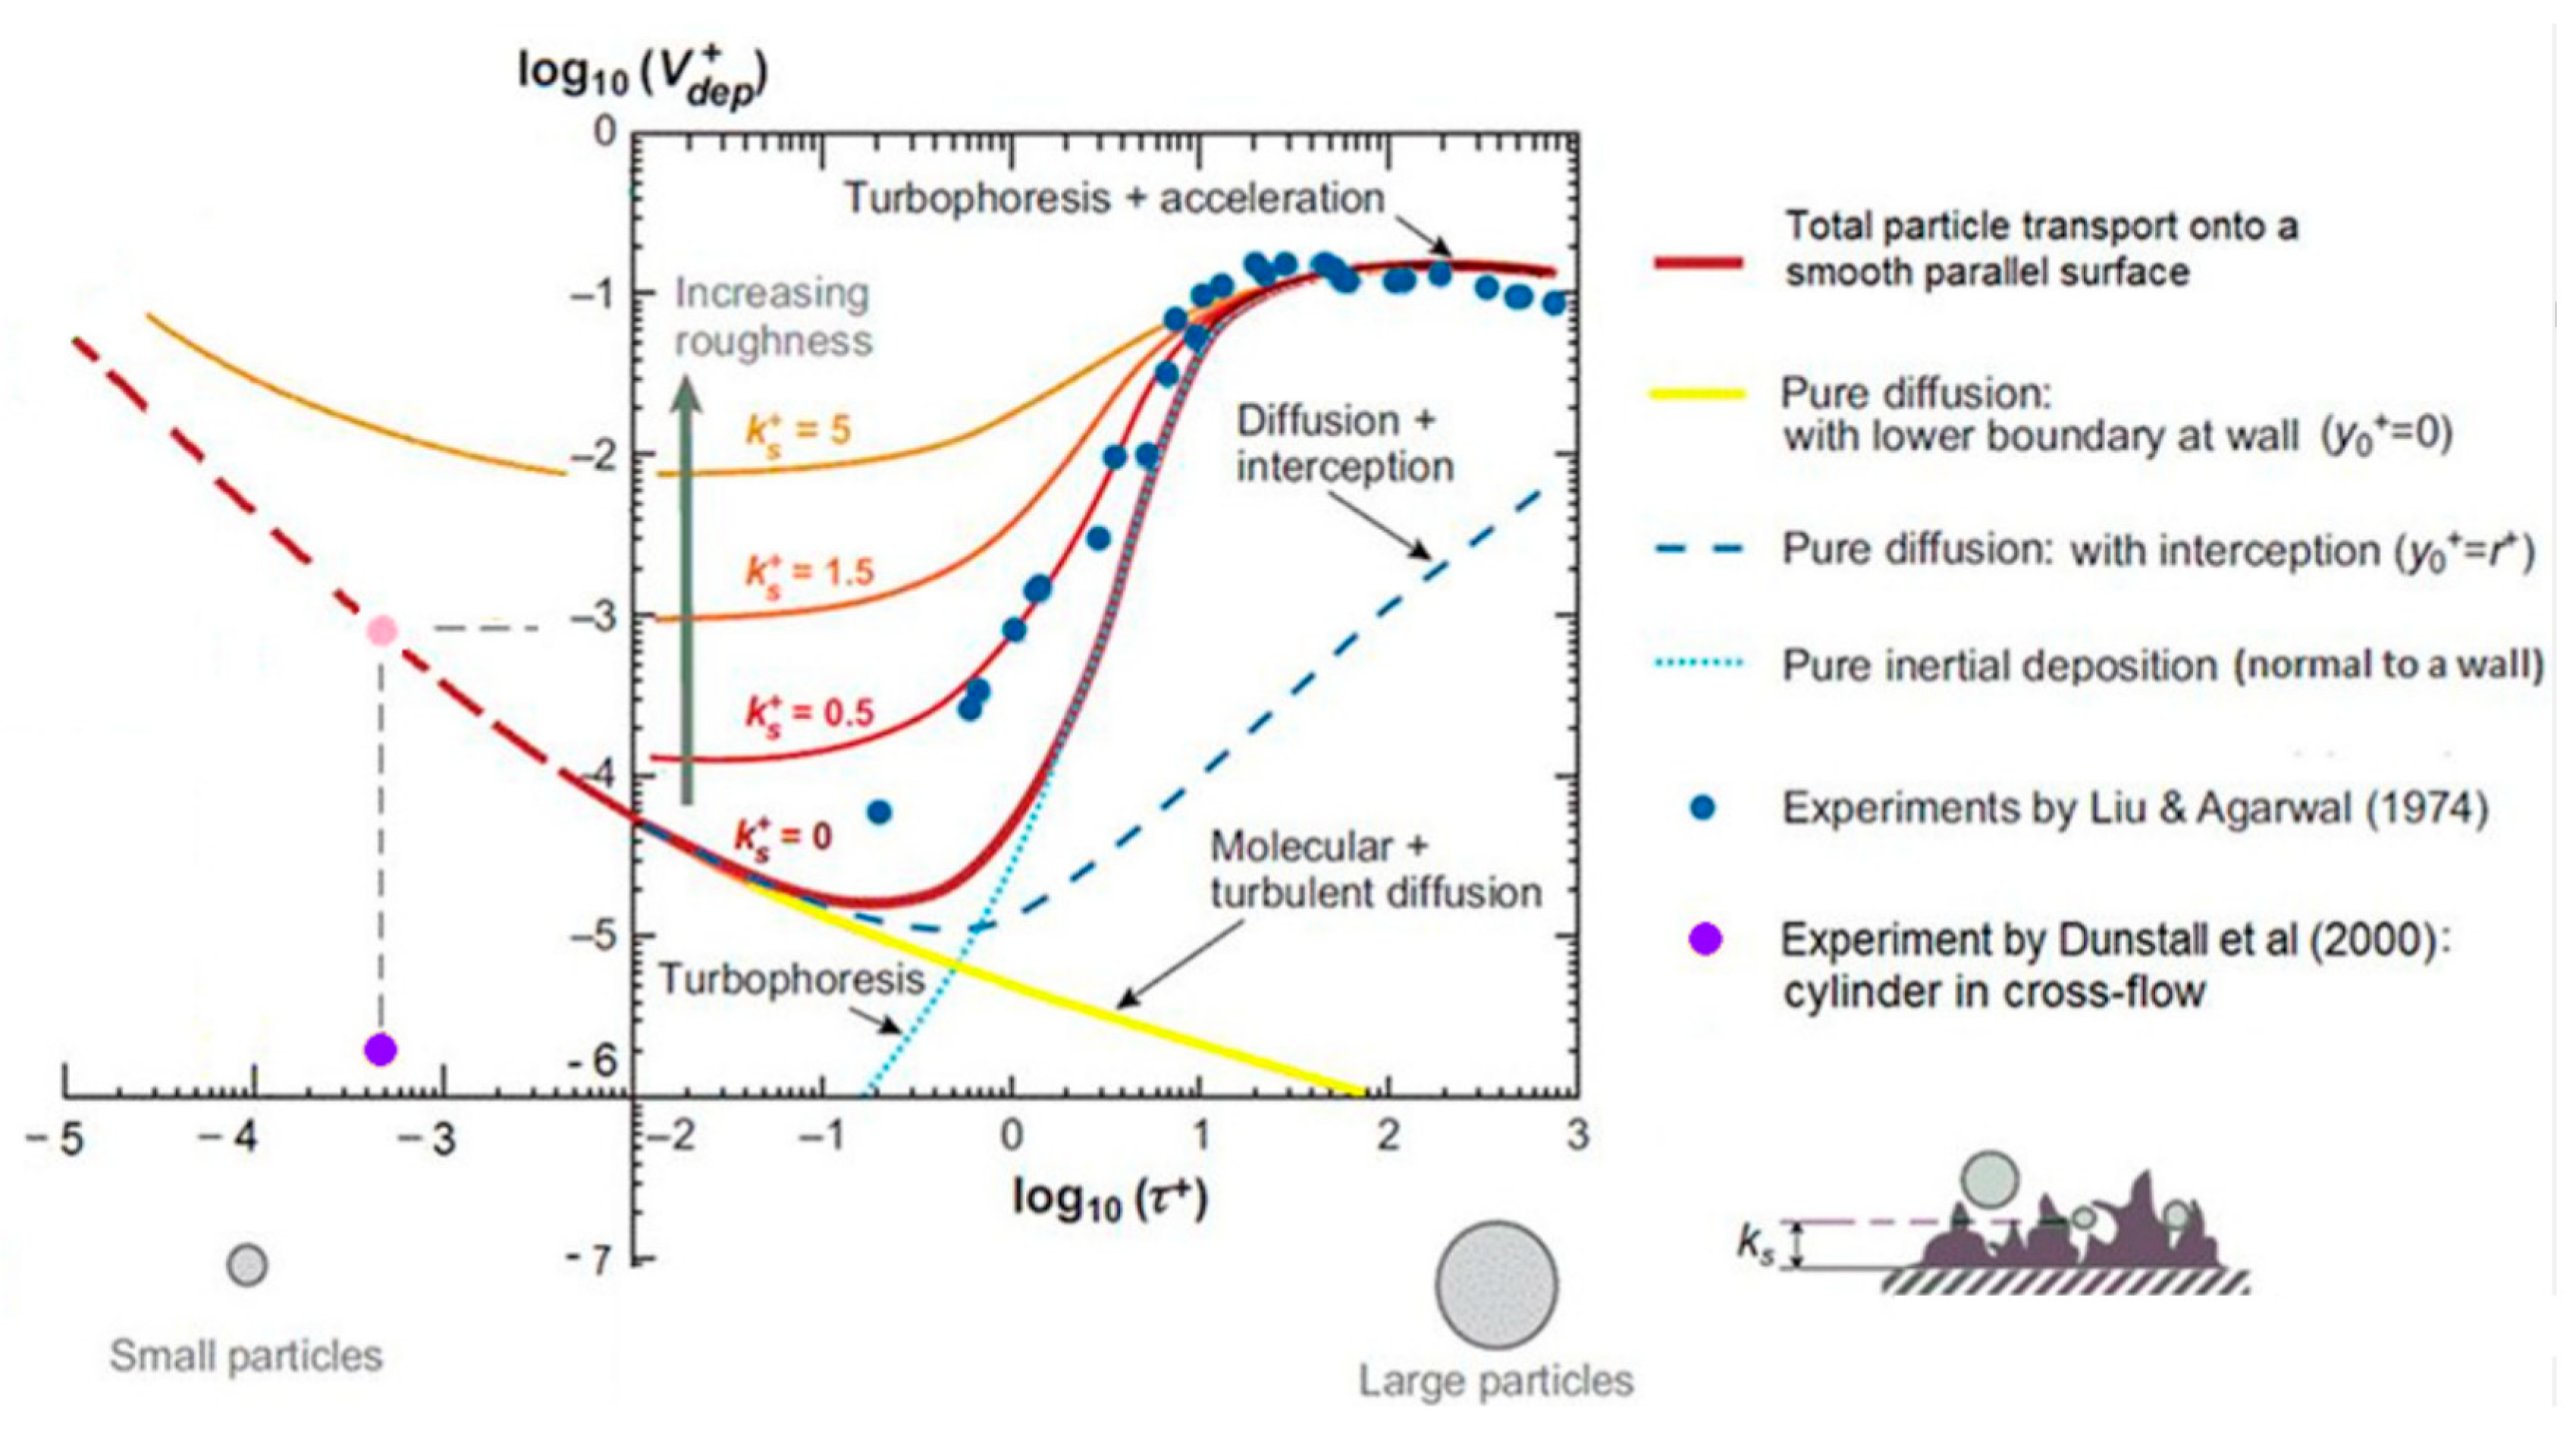
Figure 3 shows the dimensionless particle deposition velocity as a function of the dimensionless particle relaxation time, where also the effect of roughness is indicated [50]. Both roughness and thermophoresis will significantly influence the deposition velocity in the relevant particle relaxation range [52].
The dimensionless particle relaxation time is defined as τ + = ρ p d p 2 18 ρ f C c ( u ν ) 2 , where u = τ w a l l / ρ f is the friction velocity and Cc is the Cunningham slip correction factor. τ w a l l is wall shear stress, ρ f is the fluid density, ρ p is the particle density and ν is kinematic viscosity of the fluid. The dimensionless deposition velocity is defined as V d + = h m a s s / u , where h m a s s is the mass transfer rate in m/s.
Since the wall shear stress, τ w a l l , will depend on Reynolds number and velocity of the flow, it is necessary to introduce an example pipe to evaluate the particles generated at the supersaturations in steam provided in the previous sections. With a relatively small pipe (1.4 mm internal diameter) and a mass flow of 0.23 g/s at 150 bar pressure, Reynolds number will be approximately 8400, and the particle relaxation time for the particles generated will range from 10−7 to 10−3 in a 2 m pipe with the initial conditions used in the previous steps. For a constant mass flow rate, the Reynolds number will decrease with increasing pressure and increase with decreasing pressure. This is due to the change in viscosity of the fluid.
Silica nanoparticles are so small that they behave more like molecules than particles. By the dimensionless relaxation time range calculated, one can conclude that the particles will be in the diffusion-dominated regime. Deposition rates are expected to be low, with dimensionless deposition velocity between 1 and 10−4 for the above example case. For particles in this size range, an analogy to heat transfer can be used to estimate the mass transport rate from the bulk of the fluid through the boundary layer and onto the wall. Corresponding to the yellow line in Figure 3.
The mass transfer version of the correlation of Popov and Petukhov [54], given in Equation (17), is valid for the considered Schmidt numbers, S c = ν / D S i , ranging from 0.03 to 1063, but the Reynolds number Re, ranging from 7000 to 10,000 for the given mass flow, is slightly below the validity range for the high-pressure cases investigated. The Reynolds numbers are, however, still high enough that this correlation should give fairly accurate results. The Sherwood number, Sh, is further used to determine the mass transfer coefficient, h m a s s , by Equation (18).
S h = ( f / 2 ) Re S c ( 1 + 13.6 f ) + ( 11.7 + 1.8 S c 1 / 3 ) ( f / 2 ) 1 / 2 ( S c 2 / 3 1 ) f = ( 3.64 log Re 3.28 ) 2
h m a s s = S h D S i l c h a r
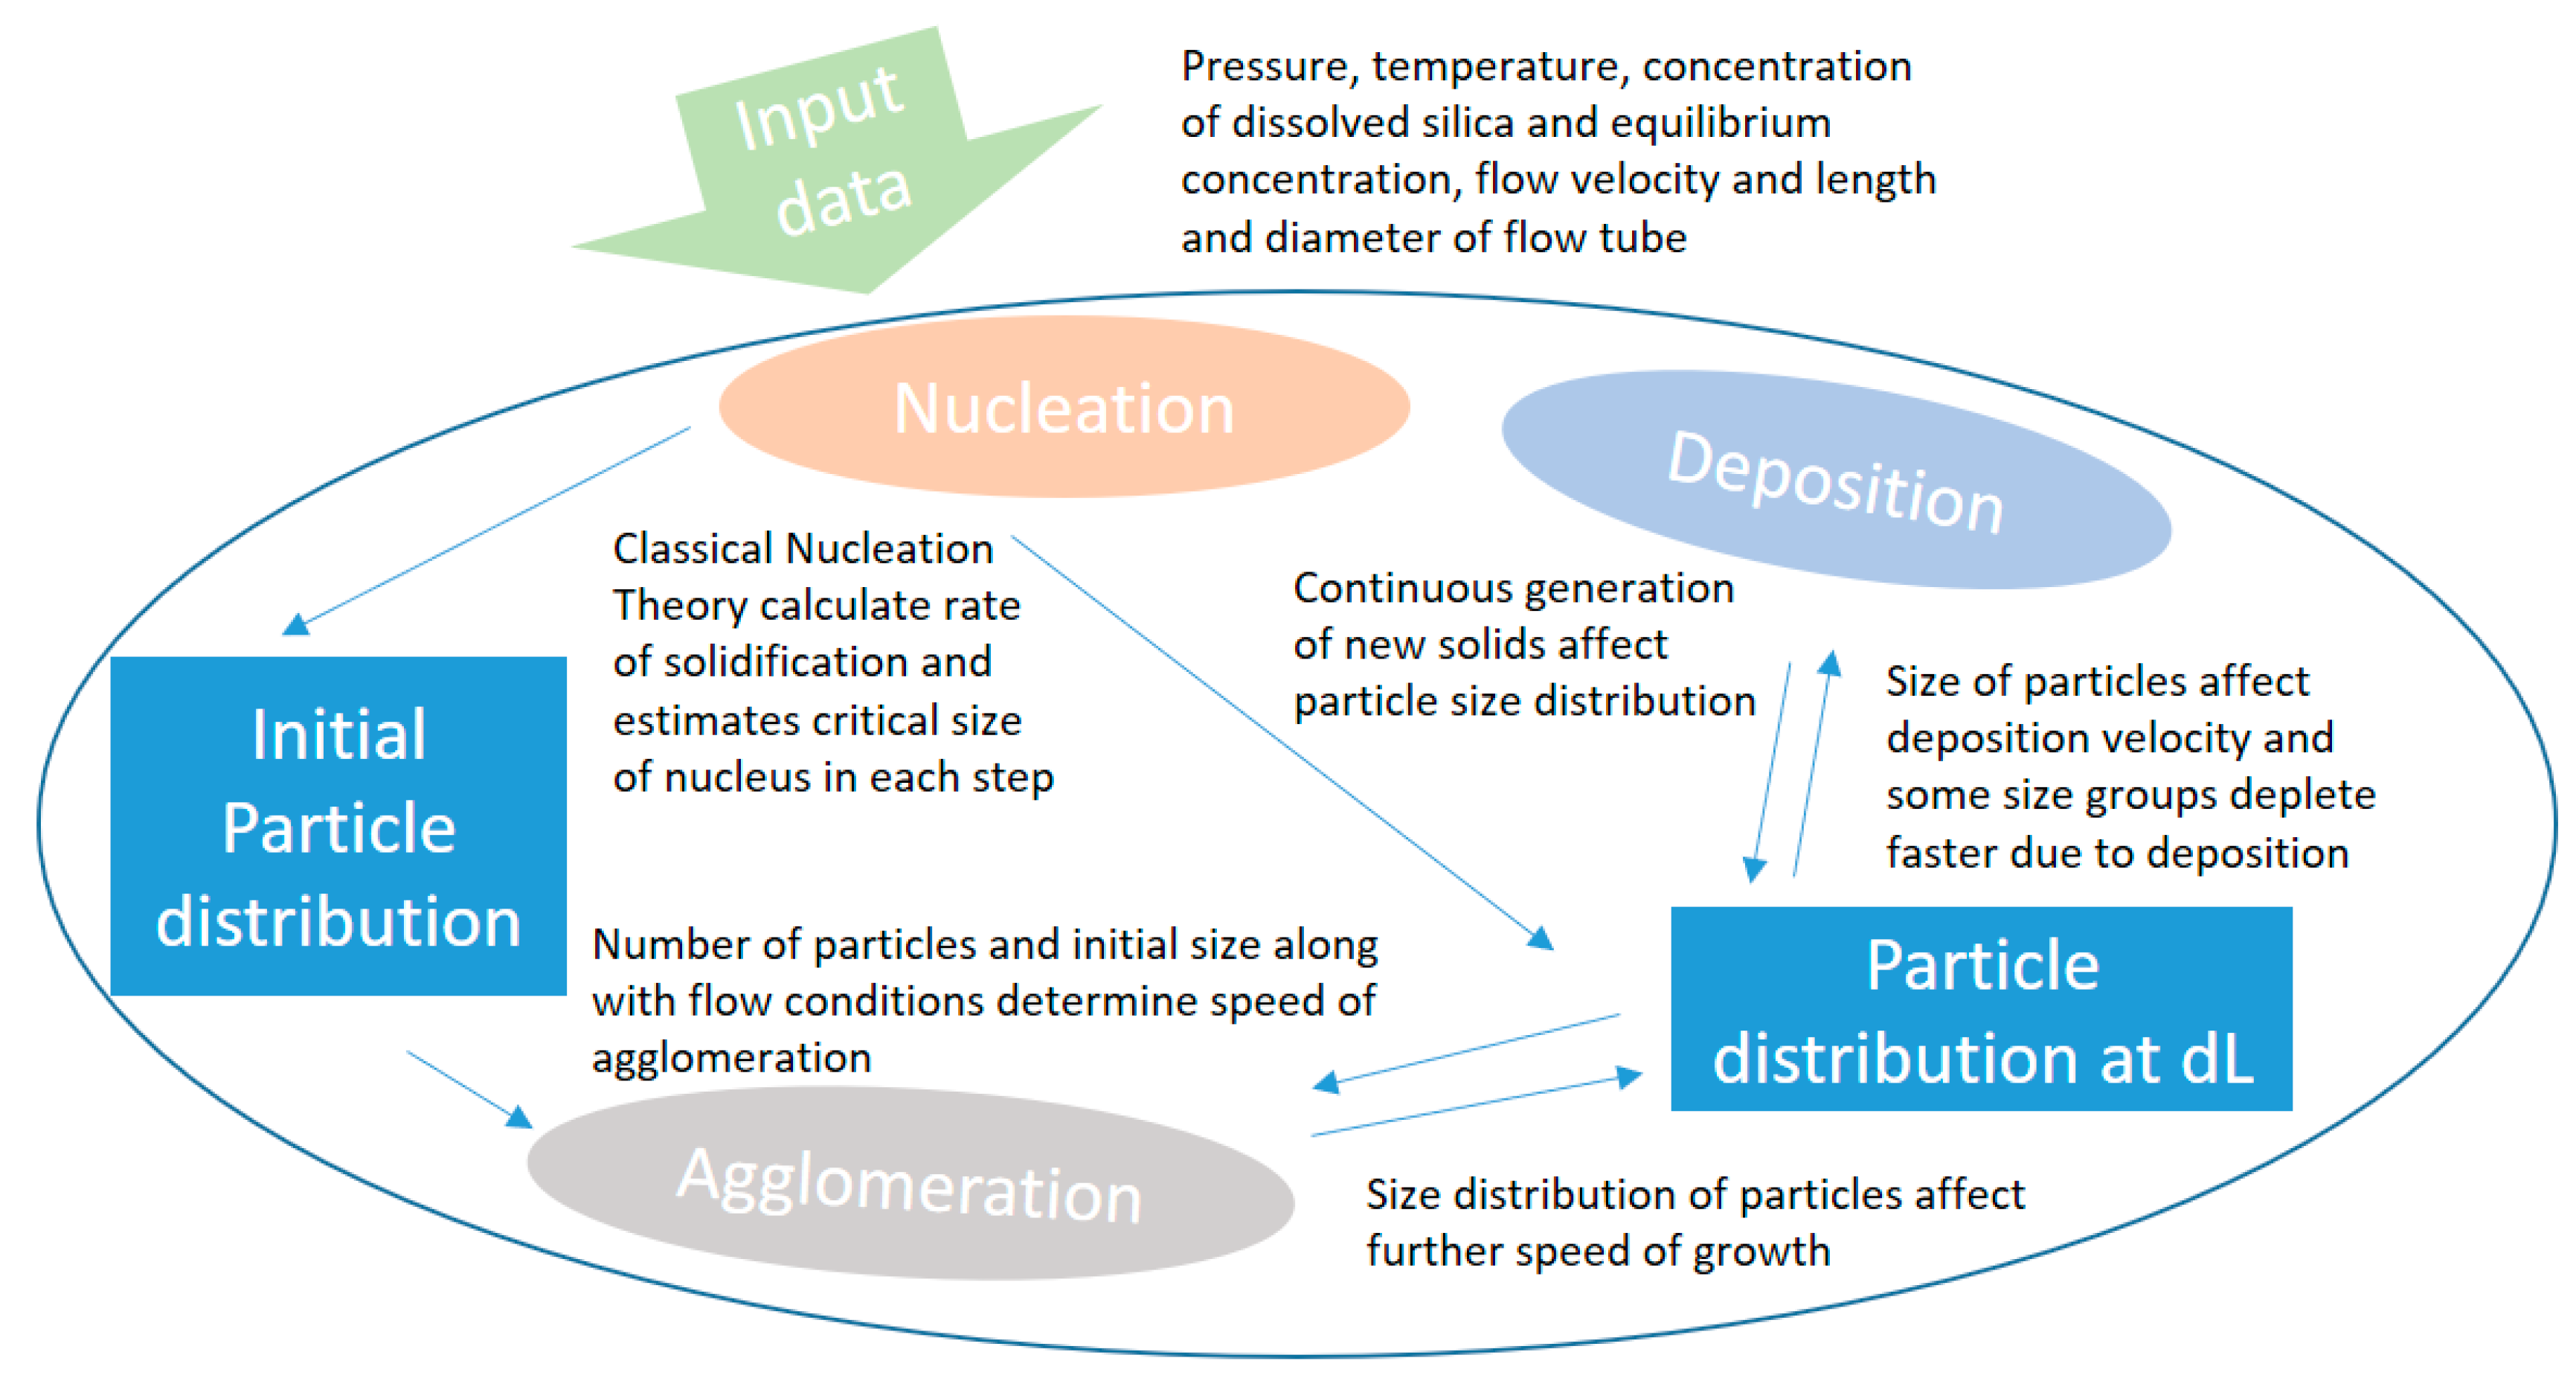
The three processes are combined numerically in a numerical model that calculates initial conditions and development in concentration, deposited material and remaining particle size development for a definite number of size groups in each step. A schematic illustration of the calculation process is given in Figure 4.

3. Results

In the presented calculation case, a constant enthalpy of 3000 kJ/kg is applied, and the initial state is a pressure of 350 bar, corresponding to a temperature of 500 °C. This supercritical steam can be depressurized into superheated steam along the constant enthalpy line without condensation of liquid.

3.1. Calculated Concentration of Solids in the Solution Using Classical Nucleation Theory

To investigate the applicability of classical nucleation theory for silica precipitating from superheated pressurized steam, values for the thermodynamic barrier, critical radius, kinetic factors, nucleation rates and time required to generate one nucleus have been calculated for different pressures corresponding to different supersaturations. Figure 5 shows the concentration of solid versus dissolved silica in four different supersaturation cases, depressurizing to 250, 200, 150 and 50 bar, respectively. Equilibrium concentrations at different pressures reduce exponentially with decreasing pressures, as discussed in [33], and the chemical driving force will increase with decreasing pressure.
The critical radius in these calculation cases ranges from 0.24 nm to 3.35 nm. This is the smallest size of a stable nanocolloid in the solution and not necessarily the maximum particle size generated. The average length of a silicon oxide bond is 0.162 nm, and the distance between the oxygen ions is 0.227 nm [55]. For very high supersaturations, the “cluster” required to make up a critical radius nanocolloid thus consists of barely one molecule. The chemical driving force is thus high enough that both homogenous and heterogeneous nucleation will occur simultaneously. If the critical radius was larger, more molecules would have to randomly collide into a cluster for the homogenous nucleation to occur, and the odds would be in favor of heterogeneous nucleation and growth of already existing particles. Since the chemical driving force is so high when reducing pressure from supercritical steam, the calculations performed by classical nucleation theory indicate that many molecule-size particles will form instantaneously and further grow by agglomeration. The presence of initial growth sites, thus, has a smaller relevance for the population balance development than it would have in the extensively researched case where the temperature is lowered in liquid, giving a gradual and more modest change in supersaturation.

3.2. Calculated Growth by Agglomeration

From the concentration and size of the critical nucleus calculated, one can evaluate the agglomeration rates based on Equations (12)–(16) [34]. The collision rate given in the number of collisions per second per cubic meter of fluid is given in Equation (19). The number concentration gradient is given by Equation (20) [50]. This equation can be simplified by disregarding the convective transport. The number concentration as a function of time can then be solved numerically.
c o l l = 1 2 β ( t ) n 2 ( t )
n t = 1 2 β ( t ) n 2 ( t ) ( n ( t ) v )
Assuming that the particles are relatively monodisperse so that the two particles colliding are of approximately the same characteristic length, the Brownian motion agglomeration kernel is constant with time as Equation (13) simplifies to a constant. The turbulent shear agglomeration kernel is, however, highly dependent on the characteristic length. In this case, the characteristic length is the radius of the particle, which is not independent of time. As particle size increases, the contribution from turbulent shear collisions becomes significant and accelerates agglomeration. As the nucleation and, thus, concentration of silica particles in the solution is gradual with time, the agglomeration rate gradually increases with increasing concentration of solids in the solution as well as with increasing particle size. The critical radius of the nucleated particles also increases as more solids are converted, and supersaturation decreases. The particles generated near equilibrium are an order of magnitude larger than the initial particles. The development of particle size in a solution flowing through a pipe, including the maximum size calculated, is plotted as a function of time in Figure 6. At a constant velocity, the time scale corresponds to a position in the pipe. The increase in particle number seen in the first nanoseconds is due to nucleation of new solid material. As nucleation becomes slower and there are enough particles for agglomeration to become significant, the total number of particles starts to decrease, and the average radius of particles increases. Figure 7 gives the actual concentration and the fraction of concentration in each size group as a function of time. The maximum group plotted corresponds to a particle size 1,048,576 times the average size of the initial group that has not agglomerated. The size of this group changes only due to the change in critical radius. Both figures show development for an initial supersaturation of 9, achieved by instantaneous depressurization from 350 bar and 500 °C to 150 bar at constant enthalpy.
The calculation setup has a finite number of groups. In reality, the agglomeration will continue according to the trend, but for the time perspective viewed here, this further agglomeration is not relevant. Not all groups calculated are plotted in the figures. The trend is that more and more groups are dominant at the same time. Note that the number of particles of critical size, double and triple that, have decreased close to zero after only 1 s.
A potential weakness in the model is that all collisions are considered effective (leading to agglomeration). Silica particles are negatively charged, and this will form an energy barrier that has to be surpassed when two particles move toward each other. The model may, therefore, overestimate the agglomeration rate.

3.3. Calculated Depositional Rates for Silica Nanoparticles in Pressurized Superheated Steam

The deposition profile, when considering the concentration profile and the change in particle size along the pipe stretch after depressurization for the S = 9 case (depressurized to 150 bar), is depicted in Figure 8a. In Figure 8b, the effect of the deposition on the total amount of solids in the solution and the total amount of deposited material as a function of pipe length and time is calculated for a specific pipe area. The velocity is constant, so the time scale represents the distance traveled by the fluid. The calculated deposition velocities do not consider particle–wall interaction or re-entrainment of particles. In other words, the particle sticking probability is conservatively high (100%).
Figure 9 illustrates deposition in three different locations of 5 cm sections of pipe when reducing to various pressures. The first section is initially downstream of the pressure drop (blue), the second is 10 cm downstream of the pressure drop (orange) and the third is 55 cm downstream of the pressure drop (grey). As also shown in Figure 8, the deposition is significantly higher directly downstream of the pressure drop than after a certain length. The sharp reduction of deposition seen when reducing to 150 bar compared to 250 bar is mainly due to the change in chemical equilibrium. The slight increase in critical nucleus size when supersaturation is lowered also contributes to reducing the deposition rate in this case. Another effect observed is a reduction in turbulence as viscosity decreases with increasing temperature. However, this effect is very small compared to the chemical driving force and position in the pipe.

3.4. Overall Results and Comparisons

The overall results are interdependent. The initial amount of particles and the continuous solidification of new material govern the number and size distribution along with the growth rate. Deposition is, in turn, highly sensitive to particle size and number and will affect the remaining amount of solid in the flow. Figure 10a shows the calculated deposited mass. Figure 10b shows the concentration of solid silica formed in total. Figure 10c shows the number of particles in the steam (not considering deposited particles), and Figure 10d shows the average particle radius all after 1 s and as a function of depressurization where the initial condition is 350 bar at 500 °C, as before. The mass flow of the steam is constant, so the average velocity of the flow will vary, and the length of pipe traveled after 1 s, therefore, decreases with increasing pressure.

4. Discussion

The presented combined model provides an opportunity to calculate the amount of scale in a specific region of a pipeline downstream, a pressure reduction from supercritical conditions and the remaining silica in the fluid. With correct input, vital information about where in the pipe region deposition will be most severe can be obtained for different initial values of supersaturation and system configurations. This information can be used to improve reservoir understanding processing techniques and, if silica scaling mitigation methods are improved as a result, increase plant energy utilization. The calculation will be sensitive to the chemical composition of the fluid in question as this affects solubility, kinetics and collision efficiency. The calculations are also sensitive to the geometries in question, as the hydrodynamic conditions in bends, valves and around obstacles vary from that of a straight pipe and this effect cannot be neglected.
An experiment was designed to measure deposition from depressurized supercritical pure water saturated with silica in a straight pipe. This experiment was designed with simple features such as straight pipe and purified water to enable validation of the mathematical model. A detailed description of the experimental work and its results can be found in [56,57] present preliminary results and comparison. The results reported correlate fairly well with the modeled results. A thorough comparison of this experiment and the modeled results for the same conditions with sensitivity analysis and specific improvement suggestions for the case scenarios evaluated is in progress [58].
Other investigated deposition rates of silica particles from pressurized water vapor include the work reported in [59]. The experimental setup produced larger particles than what can be expected based on the time frame evaluated in this paper. It was, however, concluded that the theory of solid particles in gas can be applied to calculate the deposition rates of silica in steam for the size range investigated.
In the experiment reported by [9], pressure drops were induced by a cascade of orifices with a pipe section in between, as illustrated in Figure 11. Here, the pressures in each chamber are given on top, and the measured deposited material is given below the drawing of each chamber. From the measured deposits on each disk, a sharp increase in scaling was observed on the 3.5 mm orifice disk, where pressure was reduced below 75 bar. There are uncontrolled parameters in the experiment, such as previously precipitated material in the fluid, the effect of other minerals, initial population distribution and exact turbulence and flow conditions along the walls inside the chambers. This limits the possibility of pinpointing exactly what mechanisms are dominating.
The characteristics of the scale were analyzed and varied from “flaky iron oxide” at 138 bar, “granular silica and iron oxide” at 95 bar and “spherical and threadlike scale” at 34 bar [9]. Microstructural analysis in electron microscopes shows great variation in scale structure and degree of cementation. Morphology was analyzed down to 100 nm, where 10–100 nm size particle shapes can barely be differentiated. The number of newly generated nuclei of size 1–10 nm and whether the larger structures are made up of smaller distinct units is difficult to determine in this resolution. The deposits contained traces of iron and iron chloride. From orifice 6, the composition of the deposit is 100% SiO2. On orifice 7, the precipitate starts forming threadlike structures of 100 nm diameter. Further, on orifice 8, thicker threads of up to one-micron diameter are observed in addition to the thinner threads.
Solid conversion in a straight pipe under otherwise similar process conditions has been calculated using the proposed model for the various pressure reductions in the experiment. The calculation is not quantitatively comparable to the experiment, as the hydrodynamics in a straight pipe, and therefore, turbulence and deposition velocity, differ from a flow through an orifice arrangement. The results are intended to give an indication as to how the three discussed processes interplay in a system with several pressure reductions. The measured silica concentration in this experiment was 62 mg/kg before the filter, and this is used as model input. 75 bar at an enthalpy of 3180 kJ/kg corresponds to an equilibrium concentration of 6.5 mg/kg by approximating from experimental solubility data as discussed in [33], where a linear correction for the lower density compared to the density of the experimental solubility measurement is used. The effects of other species in the mixture on solubility and kinetics are not accounted for.
Each chamber between depressurization will be the space between two cylindrical plates. The velocity will be high right after the orifice, and there will be regions of lower velocity, while in a straight pipe, the velocity is fairly uniform. With an approximation of the velocity and volume inside the chamber, one can evaluate what happens in each chamber and what mechanisms are dominant. To quantitatively compare these results, however, an appropriate CFD model for the geometry, taking into account local turbulence, has to be verified. A sensitivity analysis would also have to be performed to evaluate the impact of other components in the fluid on all parts of the analysis. A sensitivity analysis looking at the effect of surface growth and heterogeneous nucleation directly onto the larger particles could also contribute to a better fit for the measured deposition. The expected deposition in each pipe section after each pressure drop, with surface area and velocity comparable to the chamber in the experiment, is given in Figure 12.
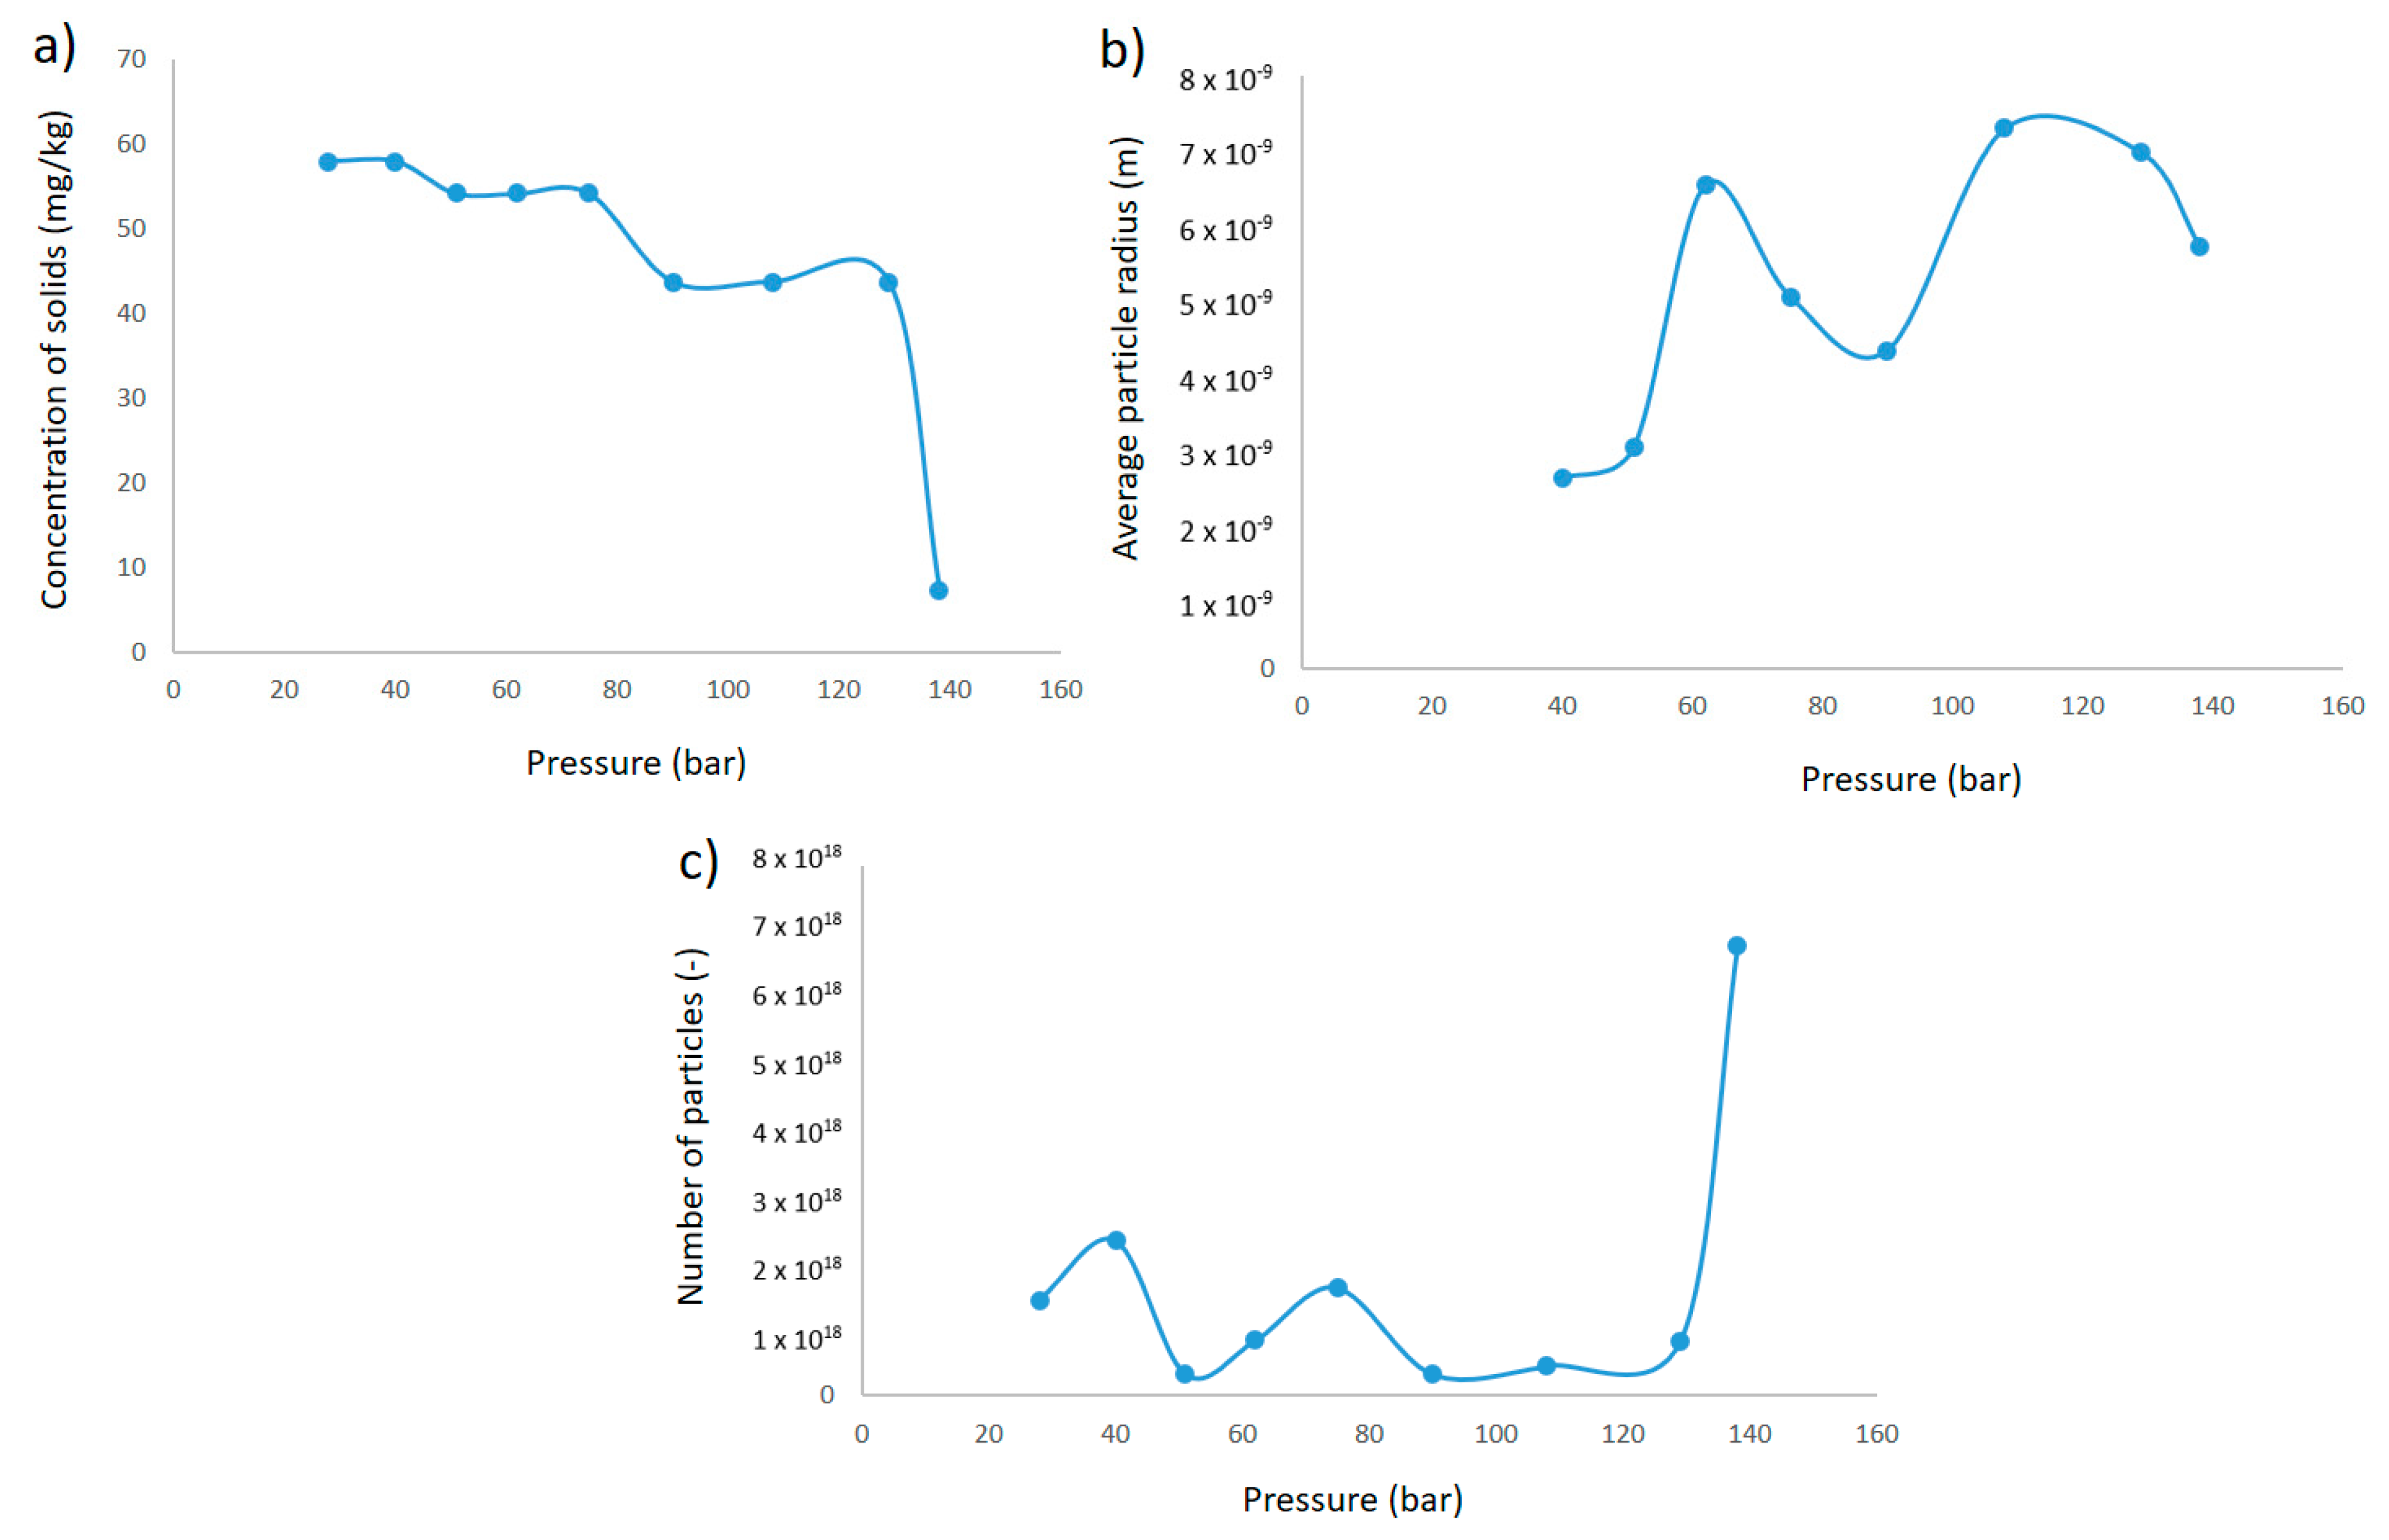
It is calculated that 74% of the silicic acid has transformed into solid particles already after the second orifice, where pressure is reduced from 129 to 108 bar. Deposition is thus the governing mechanism for the measured deposition in the following chambers. While the experiment indicates one peak deposition at the 62 to 51 bar pressure reduction plate and a lowering of deposition as pressure is further reduced below 40 bar, these are not general rules according to the calculations. The calculations show several peaks of deposition. Each peak results in the depletion of solids until pressure again reduces enough to establish significant supersaturation. The maximum deposition peak calculated is two orders of magnitudes lower than the experimental maximum measured. The overall deposition calculated is also lower than the overall deposit measured. It is likely that the overall deposition velocity will be higher in the chamber cascade than in a straight pipe.
The sticking probability in the calculation is assumed to be 100%. Slower agglomeration/increase in stability of particles due to particles’ negative surface charge will slow down growth, but it would also reduce deposition when a thin layer of silica has formed on the surface of the walls. The presence of foreign substances that affect the surface charge of the particles, solubility and interfacial free energy in the experiment could partly explain the discrepancy. Increased growth rate, presence of particles with significant inertia, and increased deposition velocity would not, however, explain the lack of deposition on the first four orifices seen in the experiment. Particles depositing in areas of high velocity will be exposed to high shear forces, and re-entrainment may occur.
Figure 13a shows the development of the concentration of solids in the solution. Figure 13b shows the average radius, and Figure 13c shows the number of concentrations at chamber pressure just before entering the next orifice. In this figure, a sharp decrease in the number of particles is observed after the second pressure reduction. This corresponds to an increase in radius as more particles agglomerate than are generated in this section. After the sharp increase in solid concentration after the first pressure reduction, there are sections where supersaturation is not high enough to generate a significant amount of new particles. Here, agglomeration and growth onto existing particles occur instead, and the deposition rate decreases due to the larger particle sizes until the second deposition peak in the 62 bar pressure reduction, where supersaturation is once again high enough to generate more small particles.
In the population generated and developed by agglomeration in this time frame, the smaller-sized particles have a higher deposition rate. Heterogeneous nucleation or direct growth on existing particles could also contribute to an increase in average particle size, but a relatively high growth rate would have to be applicable for surface growth to be significant in the time span in question.
An assumption in the calculation is that there are no initial particles when the well flow enters the system. CNT (classical nucleation theory) gives the critical nucleus, which is a minimum stable particle size. Using critical nucleus size as a starting point for agglomeration will give a conservatively low particle size. Depending on concentration and supersaturation, there will be a probability of larger particles forming initially in addition to particles already present. A sensitivity analysis related to initial population balance is advisable when using the model without specifying initial particle distribution. The size of the inlet filter in the cascade experiment was 10 µm, and information regarding the percentile of concentration in solid form initially is missing. The low amount of deposition in the filter and in the first chambers in the experiment compared to the deposition on the discs after further pressure reductions indicate, however, that the initial number of particles is not high compared to the number of generated particles.

5. Conclusions

The conversion from silicic acid to solid silica particles of minimum critical size occurs very fast for high supersaturation and very slow for low supersaturations. This is part of the reason why we can expect to see significantly more deposition after a sudden depressurization. The particles generated when the supersaturation is high are also smaller initially. They, therefore, have higher initial deposition velocities than the larger particles generated at higher pressures. Assuming that the particle stability is low, agglomeration is significant during the first second. Even with the assumption of high sticking probability, it is not likely that the particles will grow enough to gain dominating inertia effects within the time frame evaluated in this paper.
The modeled result correlates well with recent experimental studies. Applying the model to a cascade of pressure drops shows that silicic acid is rapidly converted to solids. Deposition is, therefore, a dominant mechanism for scaling in this case. Neither particle size nor changes in Reynolds number when reducing the pressure can be neglected when evaluating the deposited amount as a function of pressure drop.
This is the first model that combines the three processes, nucleation, agglomeration and deposition, in order to predict solid particle deposition in various segments of a pipeline after a sudden depressurization of supercritical water vapor. The model helps our understanding of the precipitation process and how and where it could cause problems in high-enthalpy geothermal systems. It also pinpoints where experimental data could further improve our understanding of the combined processes that lead to this type of scaling. This understanding will, in turn, help make the utilization of supercritical geothermal sources more efficient as more sophisticated methods of dealing with the solids formed can be developed.
The model is relatively simple and easy to use compared to the complexity of the natural process. The application may be to various industries, both in particle generation and for scale prevention purposes. There are also many options to advance and improve the model for specific applications. Including longer pipe stretches with larger particle size specters and looking at gradual depressurization, as would realistically be experienced when producing at high flow through a geothermal well, are some examples. The model may also prove to be applicable to other species than silica where similar behavior is expected.
The chemical composition of the fluid may affect both the solubility profile and kinetics of the calculations. For use on geothermal systems, it is, therefore, likely that the model will have to be tuned to the specific well flow. Experimental studies are needed to validate the use of classical nucleation theory to model the kinetics of silica precipitation from steam. In-situ measurement of the initial size of nanocolloids and particle size distribution in pressurized steam is needed to verify the exact particle size development.

Supplementary Materials

The following supporting information can be downloaded at: https://www.mdpi.com/article/10.3390/en16196906/s1, Matlab code: a150dep; Matlab support file S1: deposition_function_pp; Matlab support file S2: deposition_function_wood.

Author Contributions

Conceptualization, S.B. and E.N.; methodology, S.B., E.N. and S.U.; software, S.B.; validation, S.B., T.S.v.E., S.U. and E.N.; formal analysis, S.B.; investigation, S.B.; resources, S.B. and E.N.; data curation, S.B.; writing—original draft preparation, S.B.; writing—review and editing, S.B., S.U., T.S.v.E. and E.N.; visualization, S.B.; supervision, E.N.; project administration, E.N.; funding acquisition, S.B. and E.N. All authors have read and agreed to the published version of the manuscript.

Funding

This research was funded by NTNU, The Norwegian Research Council and Equinor. NCR grant number: 268028/E20.

Data Availability Statement

Only data provided by the model and discussed in [33] is analyzed in this work. Please see Supplementary Materials.

Conflicts of Interest

The authors declare no conflict of interest. The funders had no role in the design of the study; in the collection, analyses, or interpretation of data; in the writing of the manuscript; or in the decision to publish the results.

References

  1. Barbier, E. Geothermal energy technology and current status: An overview. Renew. Sustain. Energy Rev. 2002, 6, 3–65. [Google Scholar] [CrossRef]
  2. Reinsch, T.; Dobson, P.; Asanuma, H.; Huenges, E.; Poletto, F.; Sanjuan, B. Utilizing supercritical geothermal systems: A review of past ventures and ongoing research activities. Geotherm. Energy 2017, 5, 16. [Google Scholar] [CrossRef]
  3. Bahadori, A.; Vuthaluru, H.B. Prediction of silica carry-over and solubility in steam of boilers using a simple correlation. Appl. Therm. Eng. 2009, 30, 250–253. [Google Scholar] [CrossRef]
  4. Óskarsson, F. Composition of Reservoir Fluids in Well IDDP-2. In Proceedings of the World Geothermal Congress 2020+1, Reykjavik, Iceland, 24–27 October 2021. [Google Scholar]
  5. Oka, D.; Tamura, M.; Mogi, T.; Nakagawa, M.; Takahashi, H.; Ohzono, M.; Ichiyanagi, M. Conceptual model of supercritical geothermal system in Shiribeshi Region, Hokkaido, Japan. Geothermics 2023, 108, 102617. [Google Scholar] [CrossRef]
  6. Asanuma, H.; Mogi, T.; Tsuchiya, N.; Watanabe, N.; Naganawa, S.; Ogawa, Y.; Fujimitsu, Y.; Kajiwara, T.; Osato, K.; Shimada, K. Watanabe, Japanese Supercritical Geothermal Project for Drastic Increase of Geothermal Power Generation in 2050. In Proceedings of the World Geothermal Congress 2020+1, Reykjavik, Iceland, 24–27 October 2021. [Google Scholar]
  7. Lamy-Chappuis, B.; Yapparova, A.; Driesner, T. An Advanced Well and Reservoir Model for Supercritical and Saline Geothermal Applications, the Example of IDDP-2. In Proceedings of the World Geothermal Congress 2020+1, Reykjavik, Iceland, 24–27 October 2021. [Google Scholar]
  8. Friðleifsson, G.Ó.; Pálsson, B.; Albertsson, A.L.; Stefánsson, B.; Gunnlaugsson, E.; Ketilsson, J.; Gíslason, Þ. IDDP-1 Drilled Into Magma—World’s First Magma-EGS System Created. In Proceedings of the World Geothermal Congress, Melbourne, Australia, 19–24 April 2015. [Google Scholar]
  9. Marrkússon, S.; Einarsson, K.; Pálsson, B. Landsvirkjun, IDDP 1, Flow Test 2010–2012, LV-2013-050, Landsvirkjun, Ed.; Landsvirkjun: Reykjavík, Iceland, 2013; 341.
  10. Bordvik, S.; Næss, E. Comparative Analysis of Energy Extraction Systems for High Temperature, High Pressure Geothermal Steam Considering Silica Precipitation World Geothermal Congress 2020. In Proceedings of the World Geothermal Congress 2020, Reykjavik, Iceland, 27 April–1 May 2020; pp. 1–14. [Google Scholar]
  11. Hjartarson, S.; Sævarsdóttir, G.; Ingason, K.; Pálsson, B.; Harvey, W.S.; Pálssone, H. Utilization of the chloride bearing, superheated steam from IDDP-1. Geothermics 2013, 49, 83–89. [Google Scholar] [CrossRef]
  12. Goto, K. Effect of pH on polymerization of silicic acid. J. Phys. Chem. 1956, 60, 1007–1008. [Google Scholar] [CrossRef]
  13. Iler, R.K. Chemistry of silica-Solubility. In Polymerization, Colloid and Surface Properties and Biochemistry; John Wiley & Sons: Hoboken, NJ, USA, 1979. [Google Scholar]
  14. Weres, O.; Yee, A.; Tsao, L. Kinetics of Silica Polymerization. J. Colloid Interface Sci. 1981, 84, 379–402. [Google Scholar] [CrossRef]
  15. Rimstidt, J.D.; Barnes, H.L. The kinetics of silica-water reactions. Geochim. Cosmochim. Acta 1980, 44, 1683–1699. [Google Scholar] [CrossRef]
  16. Crerar, D.A.; Axtmann, E.V. Growth and ripening of silica polymers in aqueous solutions. Geochim. Cosm. Acta 1982, 45, 1259–1266. [Google Scholar] [CrossRef]
  17. Renders, P.J.N.; Gammons, C.H.; Barnes, H.L. Precipitation and dissolution rate constants for cristobalite from 150 to 300 °C. Geochim. Cosmochim. Acta 1995, 59, 77–85. [Google Scholar] [CrossRef]
  18. Dove, P.M.; Rimstidt, J.D. Silica-Water interactions. In Silica-Physical Behavior, Geochemistry, and Materials Applications; Heaney, P.J., Prewitt, C.T., Gibbs, G.V., Eds.; De Gruyter: Chelsea, MI, USA, 1994. [Google Scholar]
  19. Dove, P.M.; Han, N.; Wallace, A.F.; Yoreo, J.J.D. Kintetics of amorphous silica dissolution and the paradox of the silica polymorphs. Proc. Natl. Acad. Sci. USA 2008, 105, 9903–9908. [Google Scholar] [CrossRef]
  20. Icopini, G.A.; Brantley, S.L.; Heaney, P.J. Kinetics of silica oligomerization and nanocolloid formation as a function of pH and ionic strength at 25 °C. Geochim. Cosmochim. Acta 2005, 69, 293–303. [Google Scholar] [CrossRef]
  21. Tobler, D.J.; Shaw, S.; Benning, L.G. Quantification of initial steps of nucleation and growth of silica nanoparticles: An in-situ SAXS and DLS study. Geochim. Cosmochim. Acta 2009, 73, 5377–5393. [Google Scholar] [CrossRef]
  22. Bohlmann, E.G.; Mesmer, R.E.; Berlinski, P. Kinetics of Silica Deposition from Simulated Geothermal Brines; Oak Ridge National Lab.: Oak Ridge, TN, USA, 1980. [Google Scholar]
  23. Carroll, S.; Mroczek, E.; Alai, M.; Ebert, M. Amorphous silica precipitation (60 to 120 °C): Comparison of laboratory and field rates. Geochim. Cosmochim. Acta 1998, 62, 1379–1396. [Google Scholar] [CrossRef]
  24. Conrad, C.F.; Icopini, G.A.; Yasuhara, H.; Bandstra, J.Z.; Brantley, S.L.; Heaney, P.J. Modeling the kinetics of silica nanocolloid formation andprecipitation in geologically relevant aqueous solutions. Geochim. Cosmochim. Acta 2007, 71, 531–542. [Google Scholar] [CrossRef]
  25. Tobler, D.J.; Benning, L.G. In-situ and time resolved nucleation and growth of silica nanoparticles forming under simulated geothermal conditions. Geochim. Cosmochim. Acta 2013, 114, 156–168. [Google Scholar] [CrossRef]
  26. Heuvel, D.B.V.D.; Gunnlaugsson, E.; Gunnarsson, I.; Benning, L.G. Microstructural and chemical variation in silica-rich precipitates at the Hellisheii geothermal power plant. Mineral. Mag. 2014, 78, 1381–1389. [Google Scholar]
  27. Guzman, R.D.; Leon, A.C.C.D.; Advincula, R.; Baltazar, A.D. Characterization of Nanocolloidal Silica Formation of Untreated and Treated Simulated Geothermal Brine through Various Particle Size and Zeta Potential Measurement Techniques. In Proceedings of the World Geothermal Congress, Melbourne, Australia, 19–25 April 2015. [Google Scholar]
  28. Dixit, C.; Bernard, M.-L.; Sanjuan, B.; André, L.; Gaspard, S. Experimental study on the kinetics of silica polymerization during cooling of the Bouillante geothermal fluid (Guadeloupe, FrenchWest Indies). Chem. Geol. 2016, 442, 97–112. [Google Scholar] [CrossRef]
  29. André, L.; Devau, N.; Pedenaud, P.; Azaroual, M. Silica precipitationkinetics: The role of solid surface complexation mechanismintegrating the magnesium effects from 25 to 300 °C. Procedia-Earth Planet. Sci. 2017, 17, 217–220. [Google Scholar] [CrossRef]
  30. Heuvel, D.B.V.D.; Gunnlaugsson, E.; Gunnarsson, I.; Stawskia, T.M.; Peacock, C.L.; Benning, L.G. Understanding amorphous silica scaling under well-constrained conditions inside geothermal pipelines. Geothermics 2018, 76, 231–241. [Google Scholar] [CrossRef]
  31. Setiawan, F.A.; Rahayuningsih, E.; Petrus, H.T.B.M.; Nurpratama, M.I.; Perdana, I. Kinetics of silica precipitation in geothermal brine with seeds addition: Minimizing silica scaling in a cold re-injection system. Geotherm. Energy 2019, 7, 22. [Google Scholar] [CrossRef]
  32. Karlsdottir, S.N.; Ragnarsdottir, K.R.; Moller, A.; Thorbjornsson, I.O.; Einarsson, A. On-site erosion–corrosion testing in superheated geothermal steam. Geothermics 2014, 51, 170–181. [Google Scholar] [CrossRef]
  33. Bordvik, S.; Næss, E. Silica nanoparticle formation from supercritical geothermal sources. Energies 2023, 16, 5981. [Google Scholar] [CrossRef]
  34. Lewis, A.; Seckler, M.; Kramer, H.; Rosmalen, G.V.; Crystallization, I. Fundamentals and Applications; Cambridge University Press: Cambridge, UK, 2015. [Google Scholar]
  35. Benning, L.G.; Waychunas, G.A. Nucleation, Growth, and Aggregation of Mineral Phases: Mechanisms and Kinetic Controls. In Kinetics of Water-Rock Interaction; Brantley, S.L., Kubicki, J.D., White, A.F., Eds.; Springer: Berlin/Heidelberg, Germany, 2008. [Google Scholar]
  36. Yang, J.; Chen, J. Surface free energies and steam stability of methyl-modified silica membranes. J. Porous Mater. 2009, 16, 737–744. [Google Scholar] [CrossRef]
  37. Brauner, S.; Kantro, D.L.; Weise, C.H. The surface energies of amorphous silica and hydrous amorphous silica. Can. J. Chem. 1956, 34, 1483–1496. [Google Scholar] [CrossRef]
  38. Bravina, L.V.; Zabrodin, E.E. Homogeneous nucleation: Comparison between two theories. Phys. Lett. A 1997, 233, 423–429. [Google Scholar] [CrossRef]
  39. Perez, M.; Dumont, M.; Acevedo-Reyes, D. Implementation of classical nucleation and growth theoriesfor precipitation. Acta Mater. 2008, 56, 2119–2132. [Google Scholar] [CrossRef]
  40. Costigliola, L.; Heyes, D.M.; Schrøder, T.B.; Dyre, J.C. Revisiting the Stokes-Einstein relation without a hydrodynamic diameter. J. Chem. Phys. 2019, 150, 021101. [Google Scholar] [CrossRef]
  41. Gaman, A.I.; Napari, I.; Winkler, P.M.; Vehkamäki, H.; Wagner, P.E.; Strey, R.; Viisanen, Y.; Kulmala, M. Homogeneous Nucleation of N-Nonane and N-Propanol Mixtures: A Comparison of Classical Nucleation Theory and Experiments. J. Chem. Phys. 2005, 123, 244502. [Google Scholar] [CrossRef]
  42. Kathman, S.M. Understanding the chemical physics of nucleation. Theor. Chem. Acc. 2006, 116, 169–182. [Google Scholar] [CrossRef]
  43. Wyslouzil, B.E.; Wölk, J. Overview: Homogeneous nucleation from the vapor phase—The experimental science. J. Chem. Phys. 2016, 145, 211702. [Google Scholar] [CrossRef] [PubMed]
  44. Agarwal, V.; Peters, B.; Rice, S.A.; Dinner, A.R. Solute Precipitate Nucleation: A Review of Theory and Simulation Advances. In Chemical Physics; Wiley: Hoboken, NJ, USA, 2014. [Google Scholar]
  45. Fournier, R.O.; Potter, R.W. An equation correlating the solubility of quartz in water from 25 to 900 °C at pressures up to 10,000 bars. Geochim. Cosmochim. Acta 1982, 46, 1969–1973. [Google Scholar] [CrossRef]
  46. Plyasunov, A.V. Thermodynamics of Si(OH)4 in the vapor phase of water: Henry’s and vapor–liquid distribution constants, fugacity and cross virial coefficients. Geochim. Cosmochim. Acta 2012, 77, 215–231. [Google Scholar] [CrossRef]
  47. Heitmann, H.G. Die Loslichkeit von Kieselsaure in Wasser und Wasserdampf Sowie ihr Einfluss auf Turbinenverkieselungen; Technische Hochschule Karlsruhe: Karlsruhe, Germany, 1964; p. 255. [Google Scholar]
  48. Morey, G.W.; Hesselgesser, J.M. The solubility of some minerals in superheated steam at high pressures. Econ. Geol. 1951, 46, 821–835. [Google Scholar] [CrossRef]
  49. Berger, G.; Cadore, E.; Schott, J.; Dove, P.M. Dissolution rate of quartz in lead and sodium electrolyte solutions between 25 and 300 °C: Effect of the nature of surface complexes and reaction affinity. Geochim. Cosmochim. Acta 1994, 58, 541–551. [Google Scholar] [CrossRef]
  50. Kokhanenko, P. Hydrodynamics and Chemistry of Silica Scale Formation in Hydrogeothermal Systems; University of Canterbury: Christchurch, New Zealand, 2014. [Google Scholar]
  51. Brown, K.; Dunstall, M. Silica scaling under controlled hydrodynamic conditions. In Proceedings of the World Geothermal Congress, Kyshu-Tohuku, Japan, 28 May–10 June 2000. [Google Scholar]
  52. Guha, A. Transport and Deposition of Particles in Turbulent and Laminar Flow. Annu. Rev. Fluid Mech. 2008, 40, 311–334. [Google Scholar] [CrossRef]
  53. Liu, B.Y.H.; Agarwal, J.K. Experimental observation of aerosol deposition in turbulent flow. J. Aerosol Sci. 1974, 5, 145–148. [Google Scholar] [CrossRef]
  54. Webb, R.L. A critical evaluation of analytical solutions and Reynolds analogy equations for turbulent heat and mass transfer in smooth tubes. Wärme-Und Stoffübertragung 1971, 4, 197–204. [Google Scholar] [CrossRef]
  55. Holleman, A.F.; Wiberg, E.N.W. (Eds.) Inorganic Chemistry; Academic Press: San Diego, CA, USA; De Gruyter: Berlin, Germany, 2001. [Google Scholar]
  56. Bordvik, S.; Næss, E.; Tjelta, M. Experimental investigation of Deposition of silica nanocolloids from depressurized supercritical water vapor. DOI (In review).
  57. Bordvik, S. Solid silica precipitation, growth and deposition in depressurized supercritical steam. In Proceedings of the CGER (Norwegian Center for Geothermal Energy Reserach) Network Meeting, Bergen, Norway, 5–6 June 2023. [Google Scholar]
  58. Bordvik, S.; Næss, E.; Tjelta, M. Comparing modelled and measured precipitation from depressurized supercritical water vapor. DOI (In progress).
  59. Chauhan, V. Superheated Steam Scrubbing and Utilization for Power Generation. Ph.D. Thesis, School of Science and Engineering, Reykjavik University, Reykjavík, Iceland, 2019; p. 104. [Google Scholar]
Figure 1. Development phases of silica solidification. Si(OH)4 is dissolved silicic acid, and SiO2 is the solid form of silica. “cn” stands for critical nucleus, “nano” for particles grown into nano-sized agglomerates and “ppt” represents material deposited onto a surface.
Energies 16 06906 g001
Figure 2. Schematic representation of the mathematical model for development in concentration of silicic acid in the steam through a pipe section after a sudden depressurization. The fluid enters the pipe with a certain velocity v, pressure p, temperature T and the initial concentration of dissolved silicic acid c. The initial supersaturation index and the concentration of dissolved silicic acid will change as solids are formed. L is the total length of the pipe, and dl represents the discretization in the x direction. In each discrete section of pipe, solid material is generated through nucleation and removed from the fluid through deposition. c S i O 2 ( i ) , include both solids of critical nucleus size and larger agglomerates.
Energies 16 06906 g002
Figure 3. Particle deposition velocity at varying relaxation times as presented in reference [50] including data presented in [51,53].
Energies 16 06906 g003
Figure 4. Schematic illustration of simulation process.
Energies 16 06906 g004
Figure 5. Development of concentration of solid versus dissolved silica with time in solutions with various supersaturations achieved by decreasing pressure from 350 bar at constant enthalpy of 3000 kJ/kg. Decrease in silicic acid and increase in solid silica as a function of time for an initial supersaturation of (a) 2.8, corresponding to a depressurization to 250 bar; (b) 3.8, corresponding to depressurization to 200 bar; (c) 9, corresponding to depressurization to 150 bar; (d) 66.2, corresponding to a depressurization to 50 bar.
Energies 16 06906 g005
Figure 6. (a) rcrit in red is the development of the critical radius. This increase in critical radius is a result of the decrease in supersaturation as more solids are formed. rg1av is the average radius in group 1 where no agglomeration has occurred. The radius corresponding to 1,048,576 times the critical volume is shown, as this is the maximum radius calculated. Lastly, the average nucleated radius, ragglnum is the average radius of all groups considering both change in size of the generated particles and agglomeration into larger-sized particles. Note that the maximum particle size group evaluated in the time span is less than 100 nm, and the average particle size is less than 20 nm after one second. (b) The average number of particles considering agglomeration is plotted as a function of time in black. The blue line is the number in group 1. This is the dominant group in the first nanosecond as new solid is formed into this group. ng8 denotes the number of particles per cubic of water in group 8 where volume is 8 times double that of group 1, and so on.
Energies 16 06906 g006
Figure 7. (a) Actual concentration and (b) fraction of concentration in each group as function of time. On the left plot (a), the blue line shows increase in total solids in the solution. The pink lines represent concentrations in groups of increasing size. As agglomeration evolves, the concentration in the smaller-sized groups decreases in favor of the larger-sized groups. On the right side (b), the increasing group size is given in different colors. The trend is, however, the same.
Energies 16 06906 g007
Figure 8. (a) Change in deposition rate with time considering the concentration profile and particle size for the S = 9 case. One can see that the highest deposition rates occur directly after the pressure drop. (b) Accumulated deposition in the pipe as a function of time (black) and decrease in total concentration of solids as a result of deposition (green) for the same case. As in the previous figures, the red line indicates decrease in concentration of dissolved silicic acid, and the blue line indicates increase in the concentration of solid silica in the solution. A significant decrease in concentration of solids due to deposition is observed after only 1 s.
Energies 16 06906 g008
Figure 9. Change in deposition rate as a function of pressure reduction/supersaturation in specific 5 cm sections of pipe starting first initially downstream the pressure drop (blue), then 10 cm downstream of the pressure drop (orange) and finally 55 cm downstream of the pressure drop (grey).
Energies 16 06906 g009
Figure 10. (a) Total amount of mass deposited in a pipe segment corresponding to a point 1 s downstream of the pressure drop in a steady flow. Given as a function of depressurization/supersaturation. (b) Total concentration of solids formed 1 s after the pressure drop as a function of depressurization/supersaturation. (c) Number of particles in the steam 1 s after depressurization (not considering deposited particles) as a function of depressurization/supersaturation. (d) The average radius of the particles in the steam 1 s after depressurization. Given as a function of depressurization rate/supersaturation.
Energies 16 06906 g010
Figure 11. IDDP1 scaling experiment with cascading orifices.
Energies 16 06906 g011
Figure 12. Expected deposition profile in a cascade of pressure drops calculated using the model presented in this paper with process conditions and silica content similar to the experimental conditions.
Energies 16 06906 g012
Figure 13. (a) Concentration of solids in the solution in each pressure reduction section just before entering the next orifice. (b) Average radius at the end of each pressure reduction section and (c) Average number of particles at the end of each section.
Energies 16 06906 g013
Disclaimer/Publisher’s Note: The statements, opinions and data contained in all publications are solely those of the individual author(s) and contributor(s) and not of MDPI and/or the editor(s). MDPI and/or the editor(s) disclaim responsibility for any injury to people or property resulting from any ideas, methods, instructions or products referred to in the content.

