


Long-Term Forecasting Framework for Renewable Energy Technologies’ Installed Capacity and Costs for 2050


Abstract
:1. Introduction
- Best-fit temporal quadratic regressions on available annual capacity data provide narrower decadal forecasts than those published for wind and solar energy technologies.
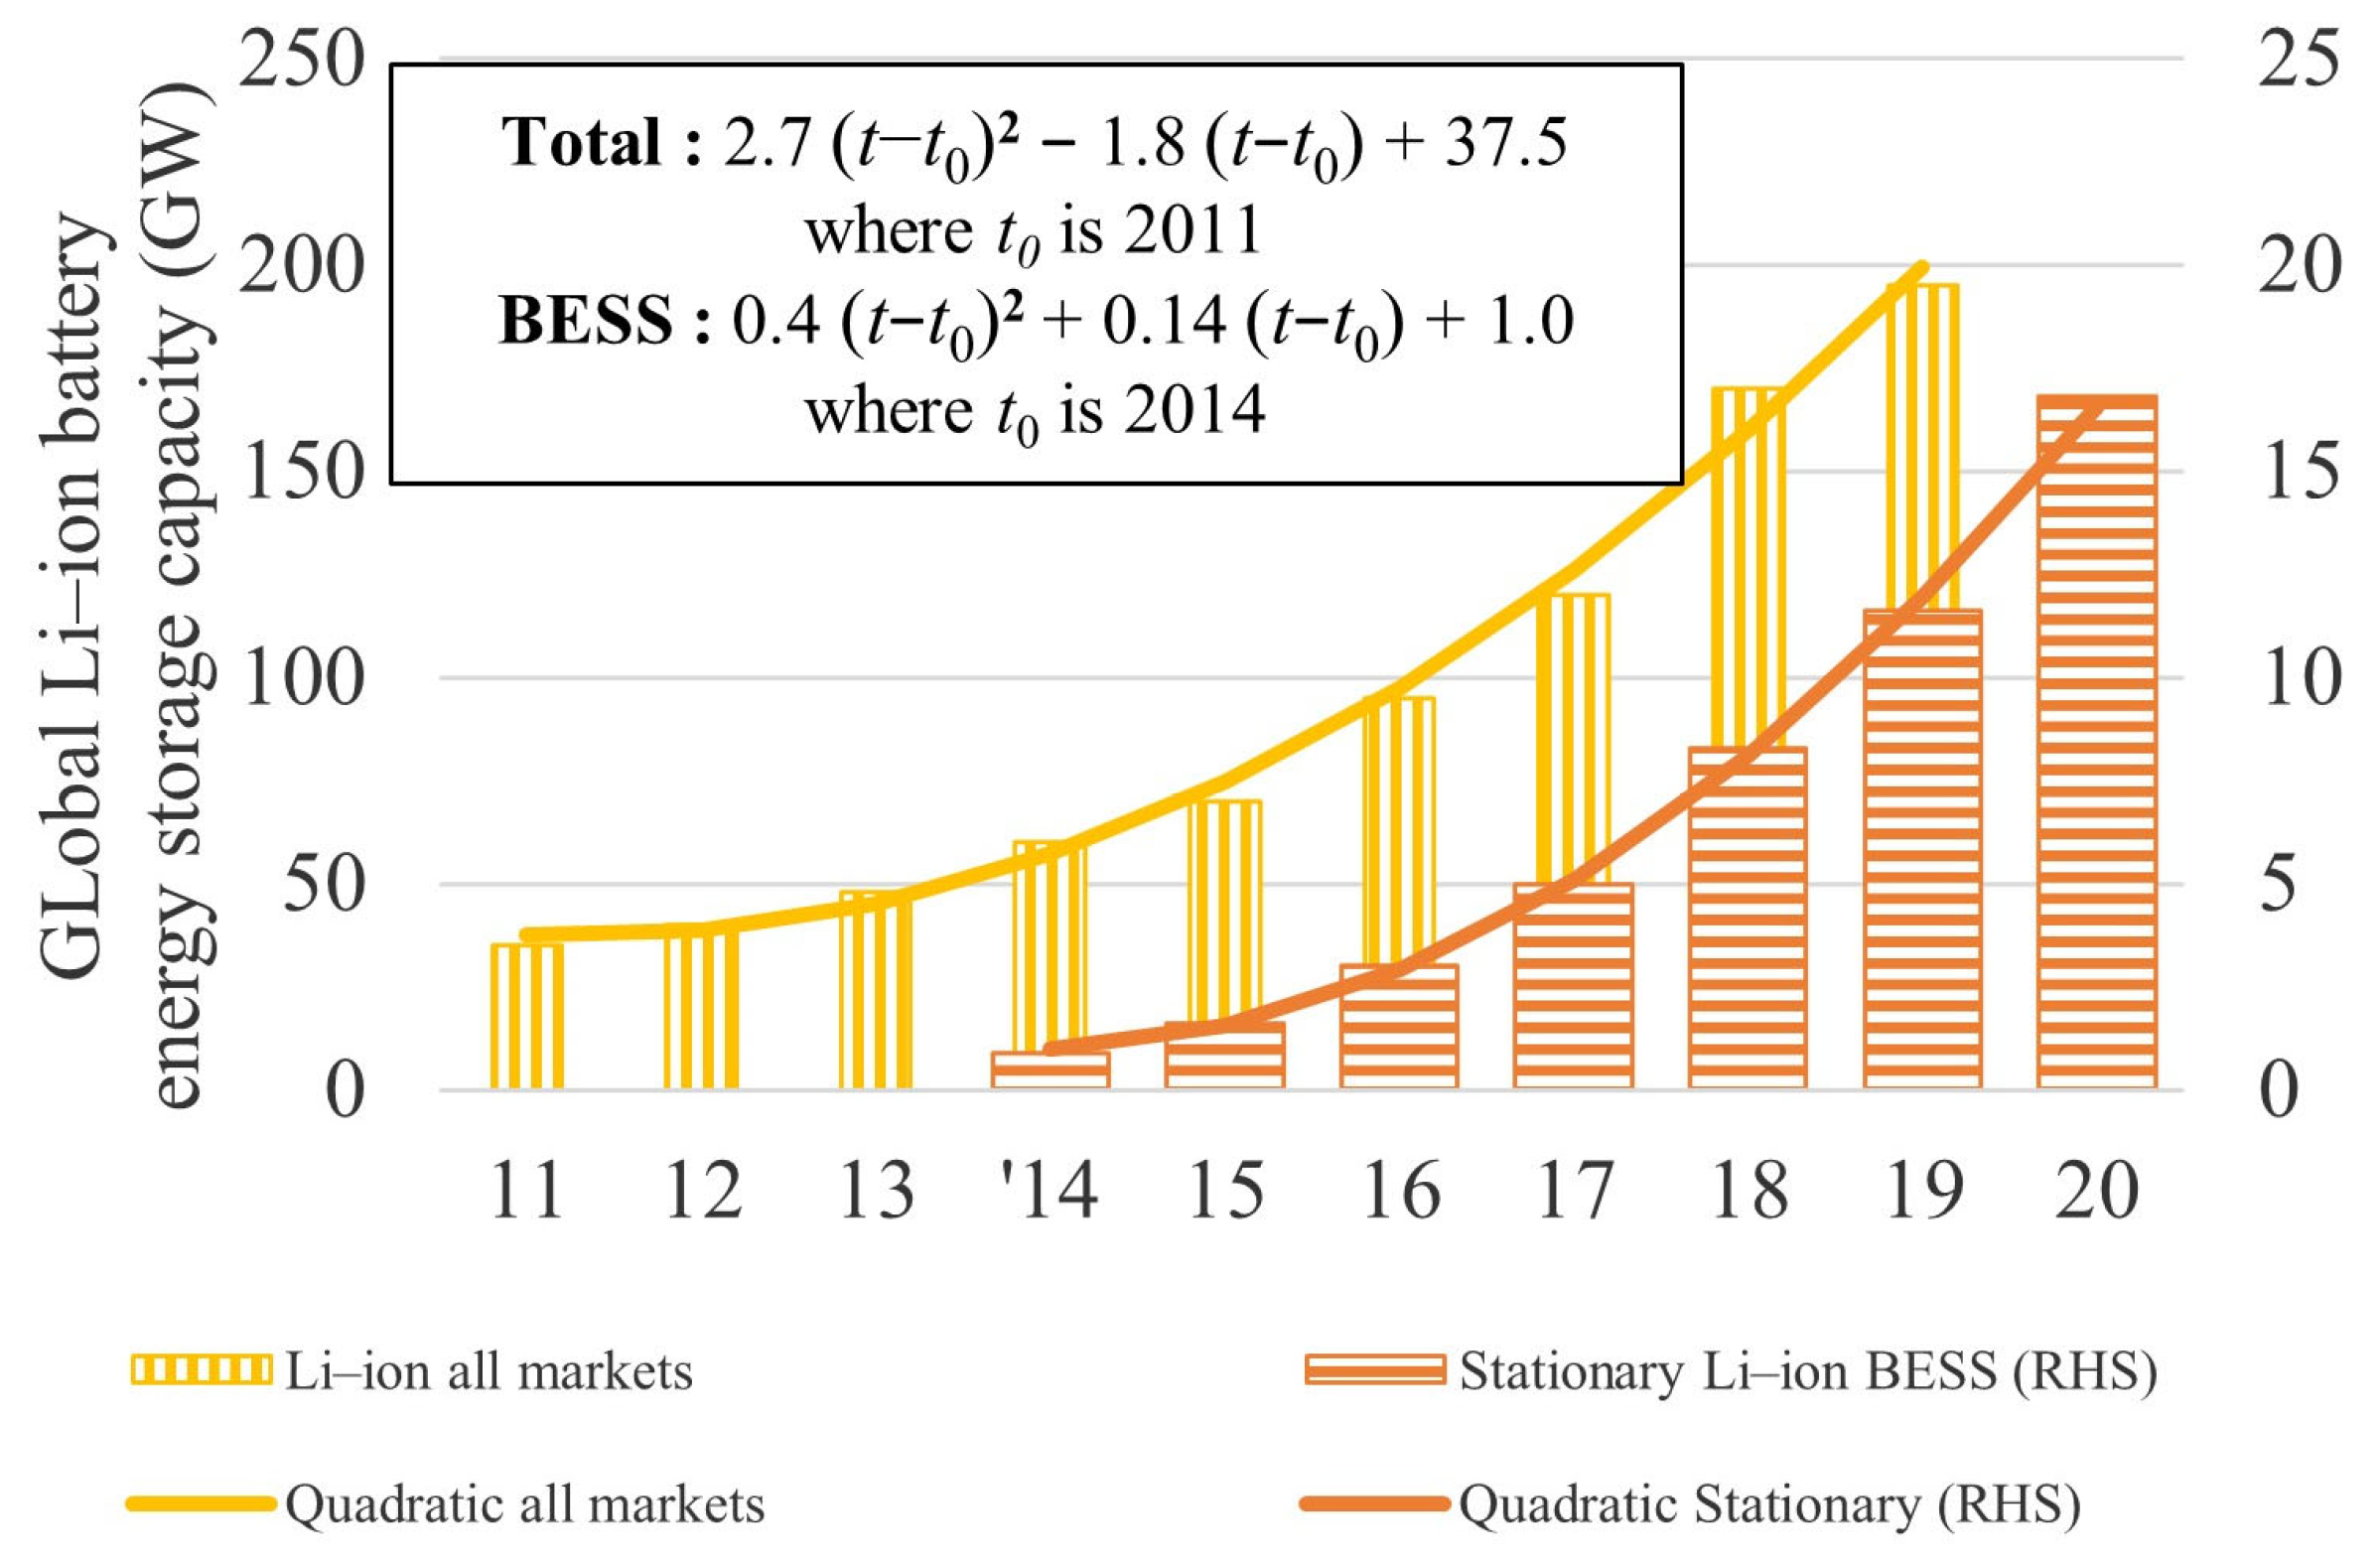
- New long-term forecasts for capacity and cost are provided for the more novel battery energy storage systems.
- Insights into the manufacturing infrastructure required for renewable technologies’ continued growth are shown as among the most influential drivers of capacity expansion.
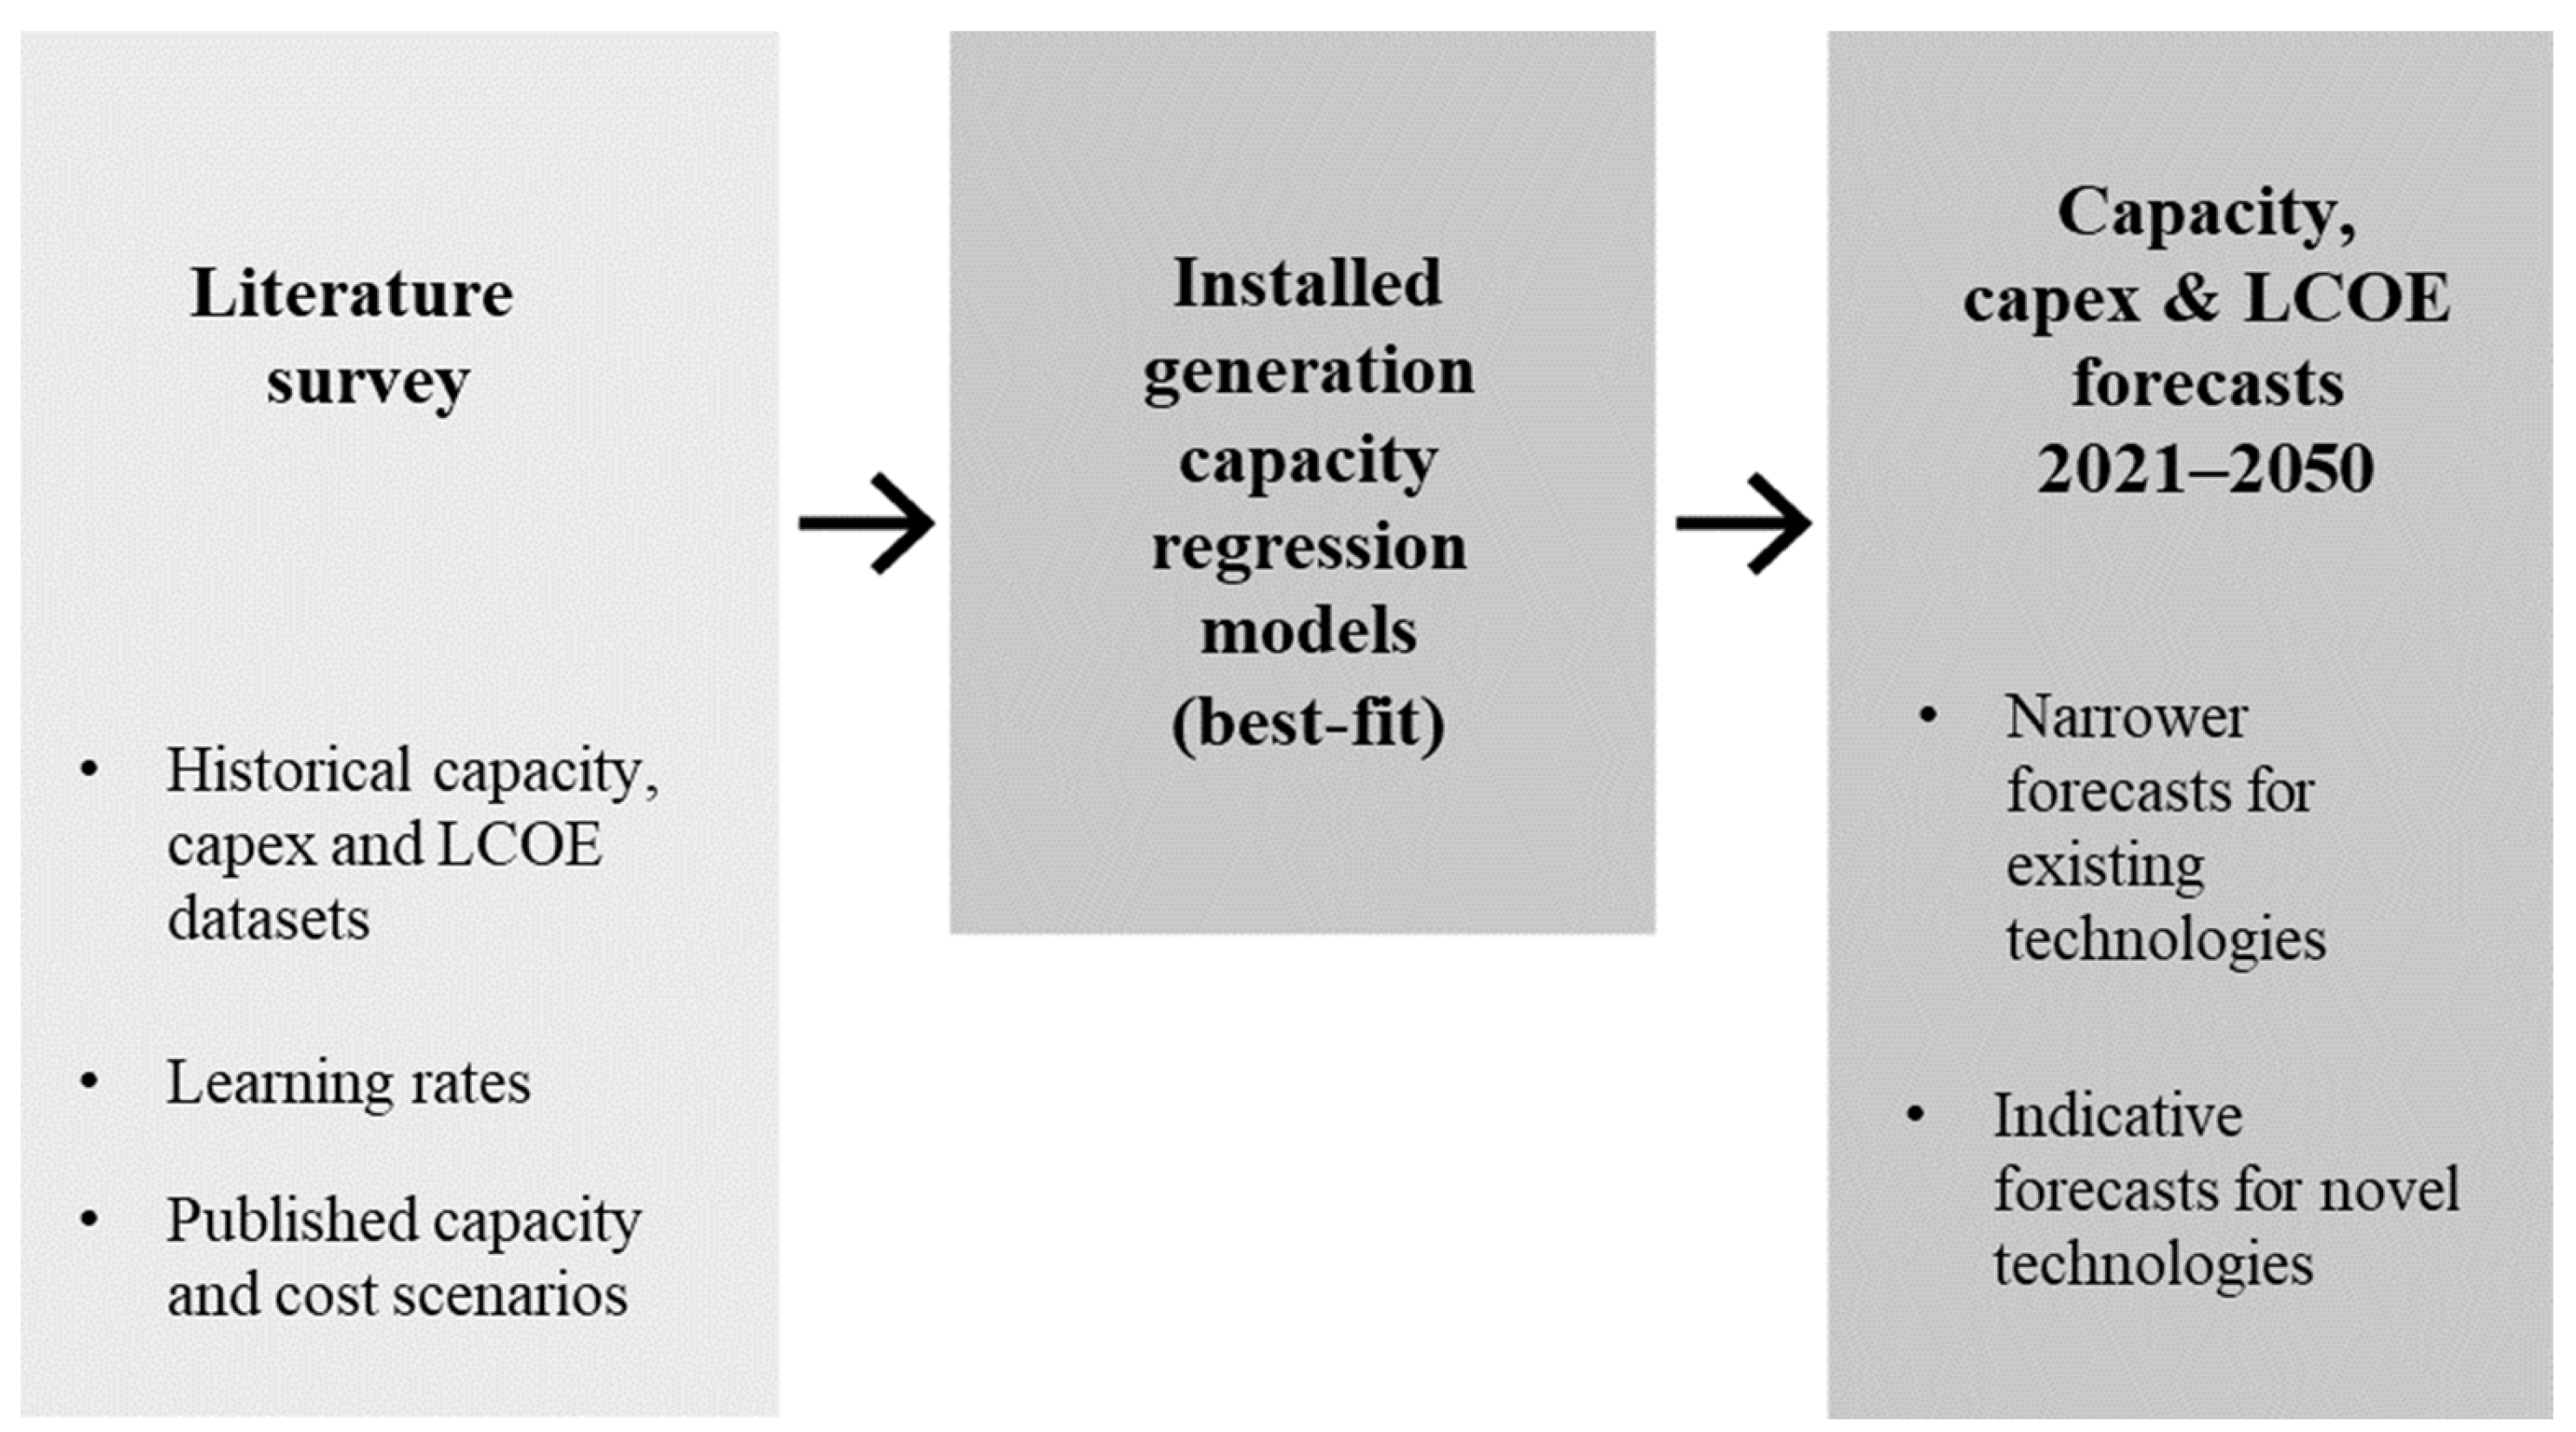
2. Materials and Methods
2.1. Global Installed Electricity Generation Capacity Scenarios
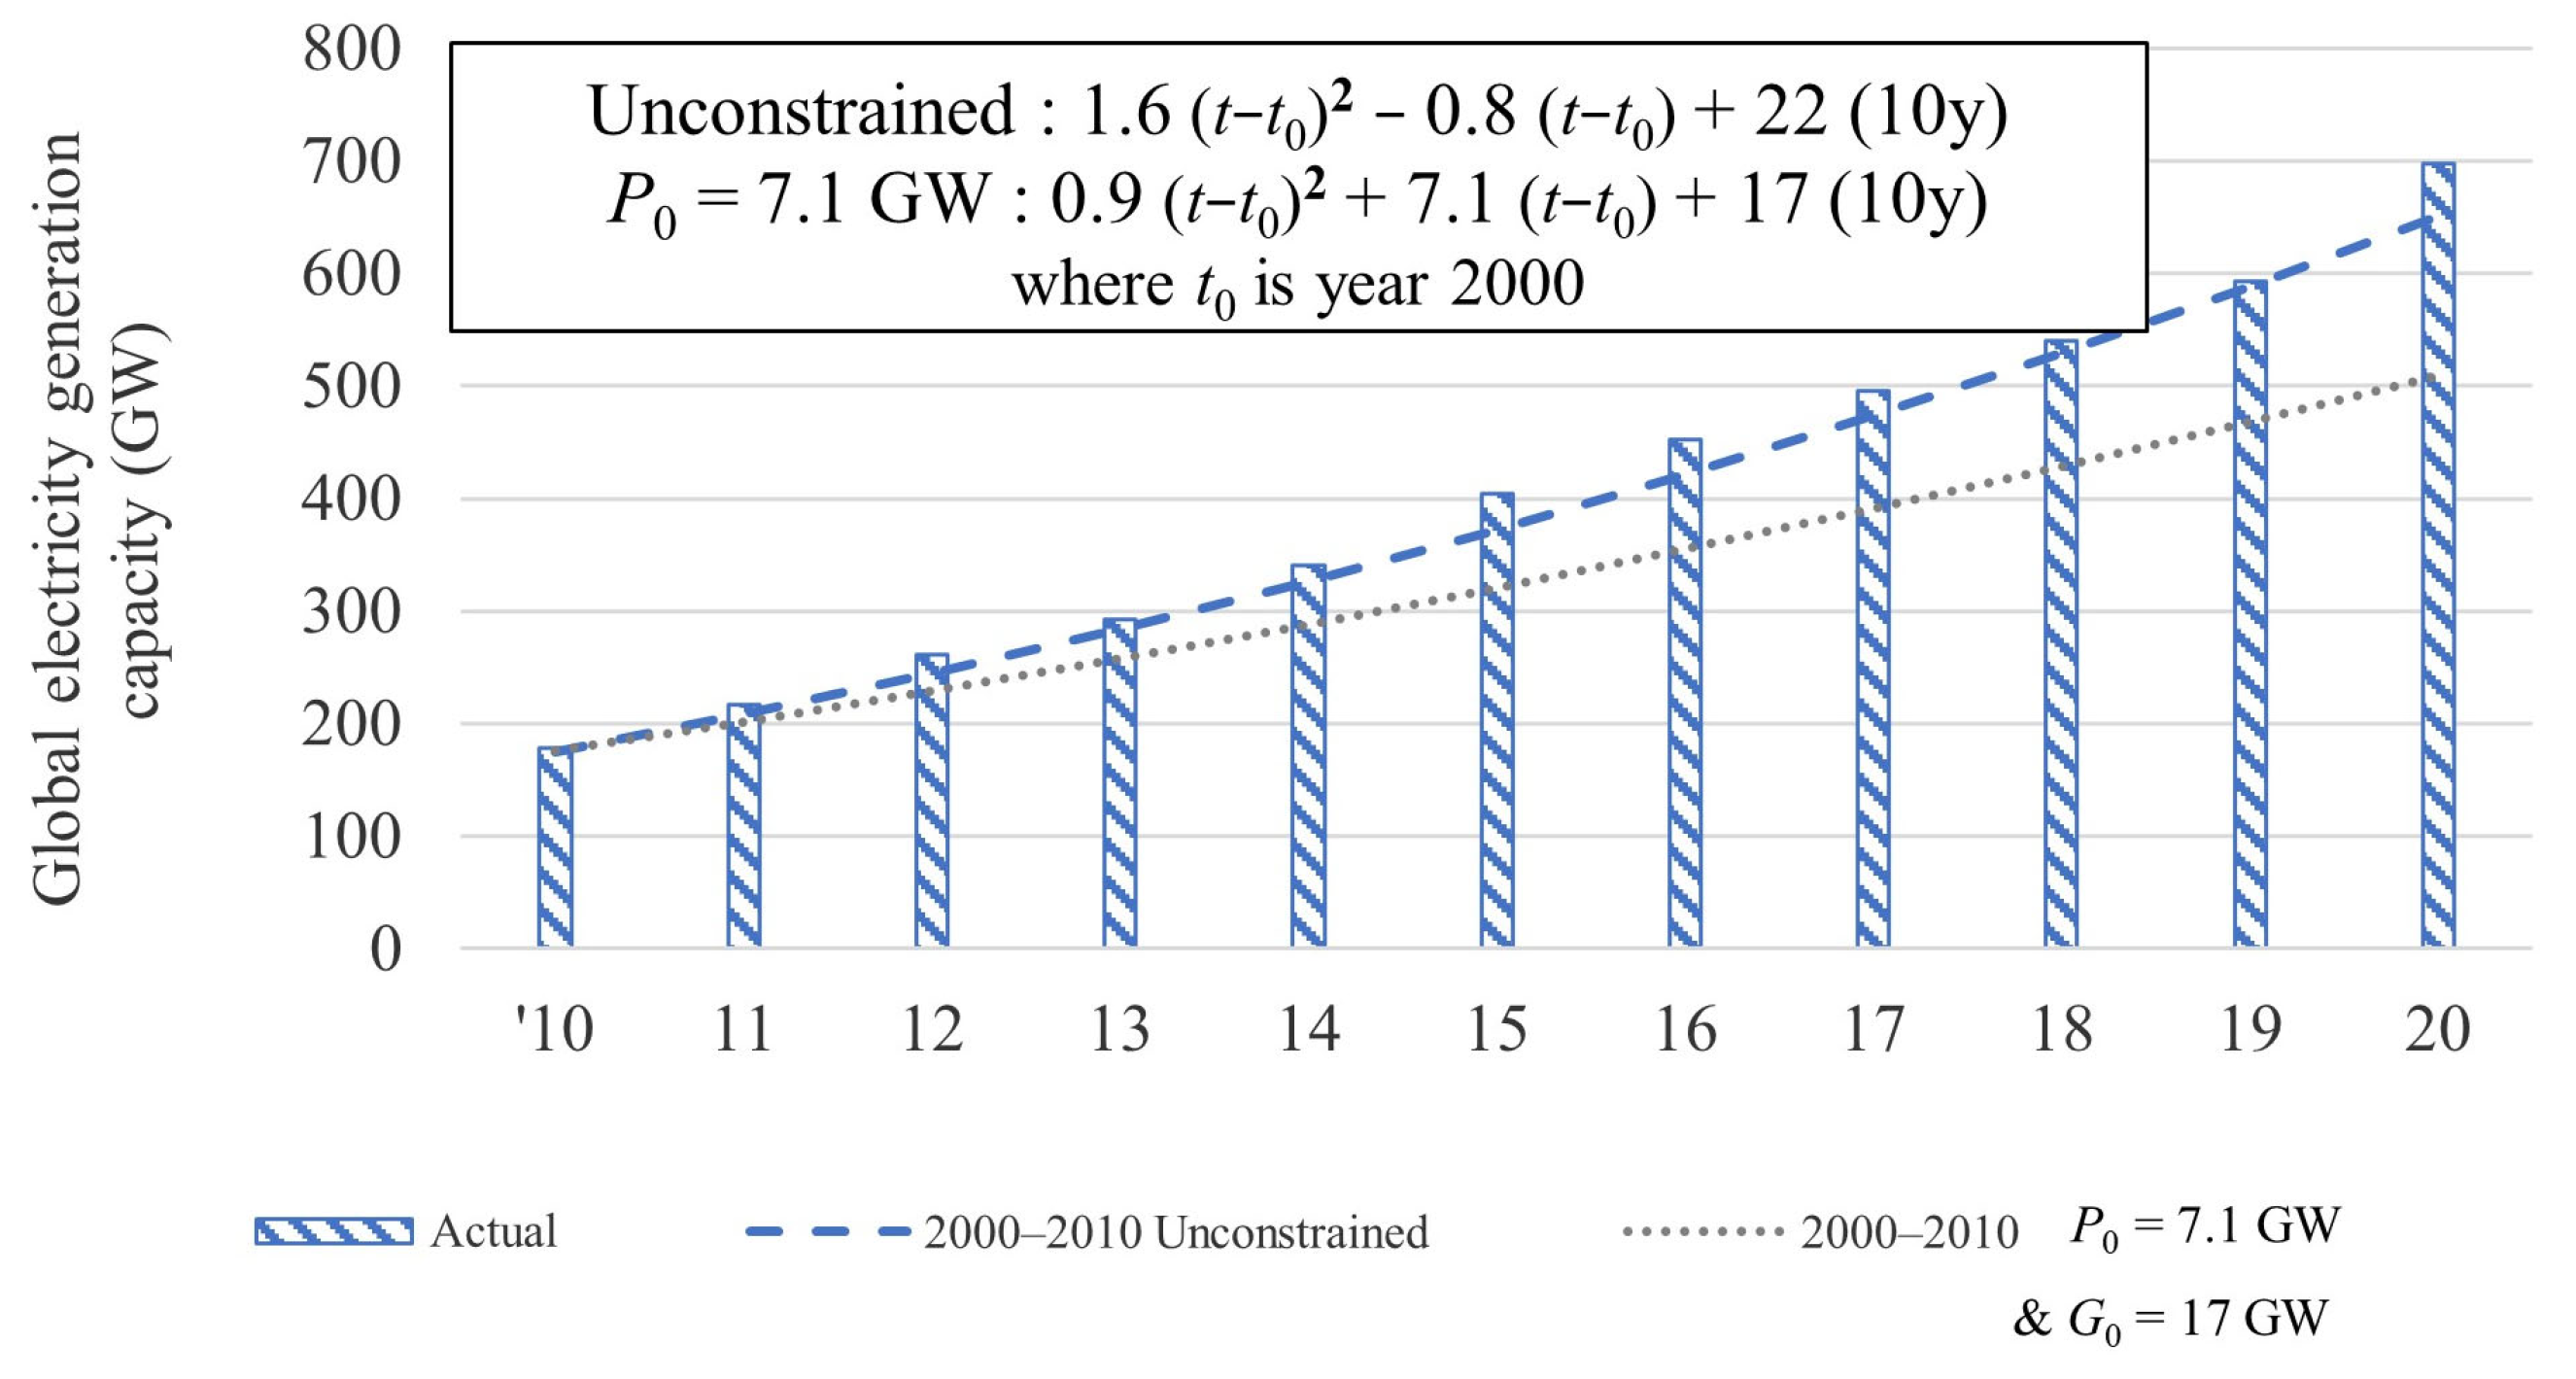
2.2. Global Installed Electricity Generation Capacity Growth Profile of Solar and Wind Technologies
2.3. Learning Rates as a Means to Determine Cost Trends
- Improvements to production processes such as productivity, process innovations, standardization, and economies of scale;
- Changes in product design, namely, redesign and the use of novel materials;
- Real-term reductions in the input price of materials and labor.
2.4. Empirical and Theoretical Underpinnings
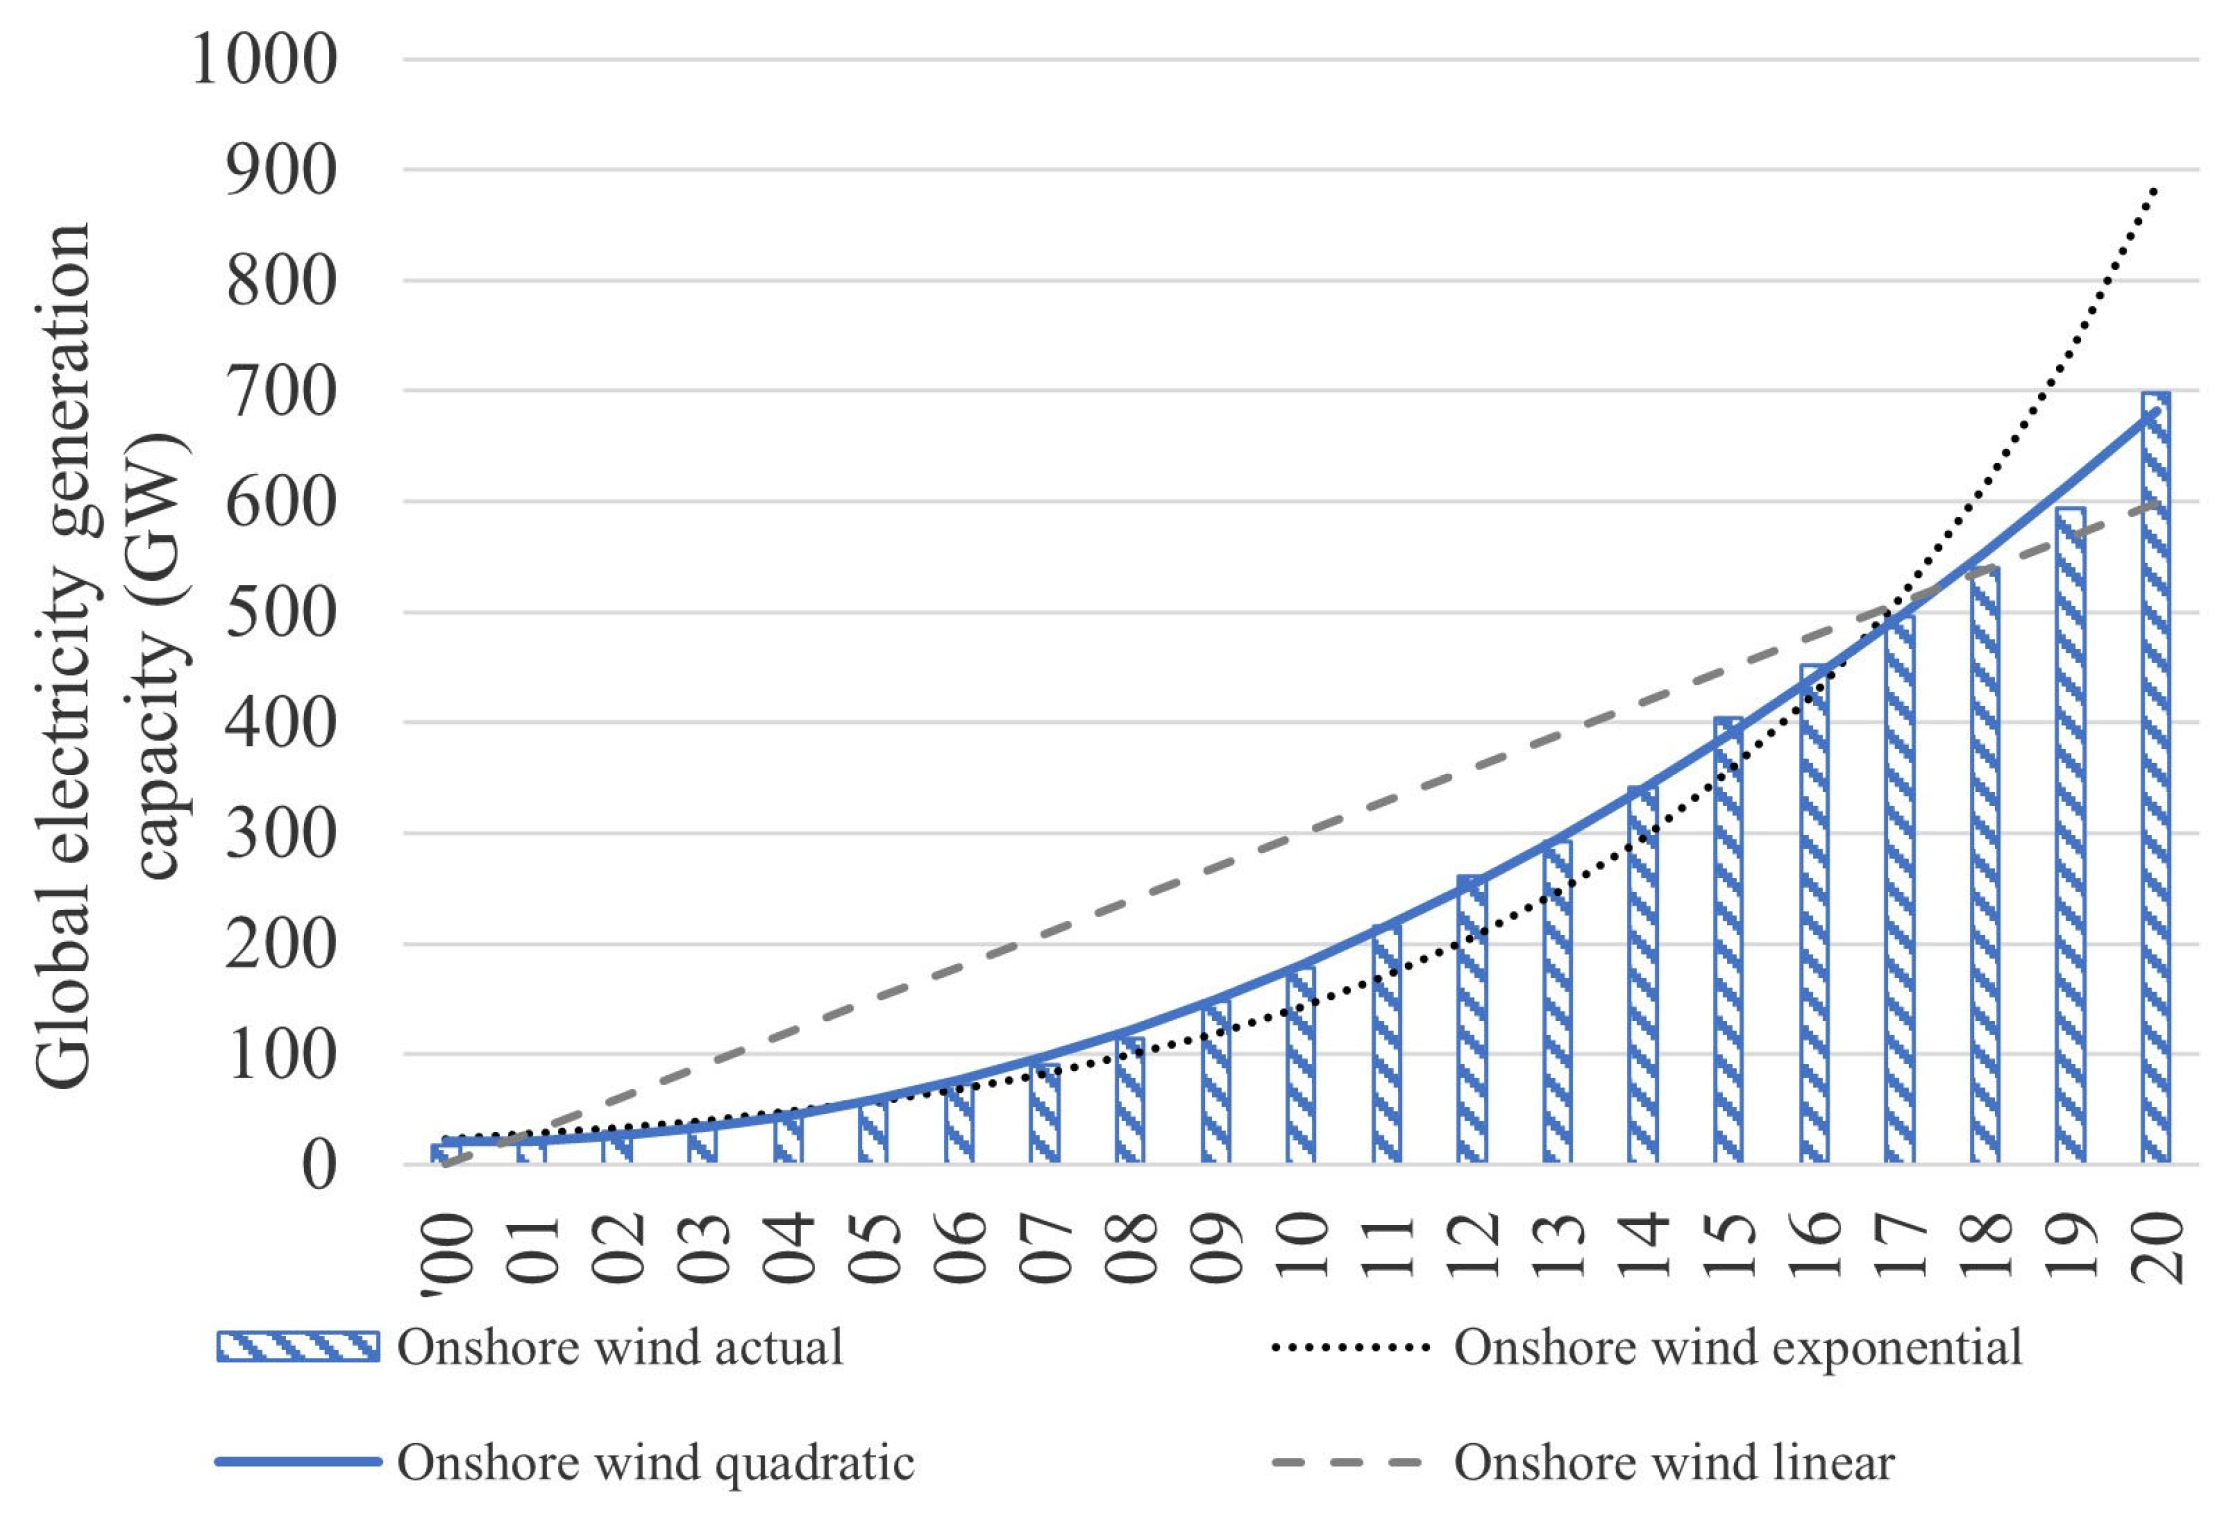
- Onshore wind showed the highest level of coherence over the 10- and 20-year time frames, with a relatively constant rate of increase in manufacturing capacity. Whether unconstrained or forced, the 20-year regressions yielded R2 greater than 0.994.
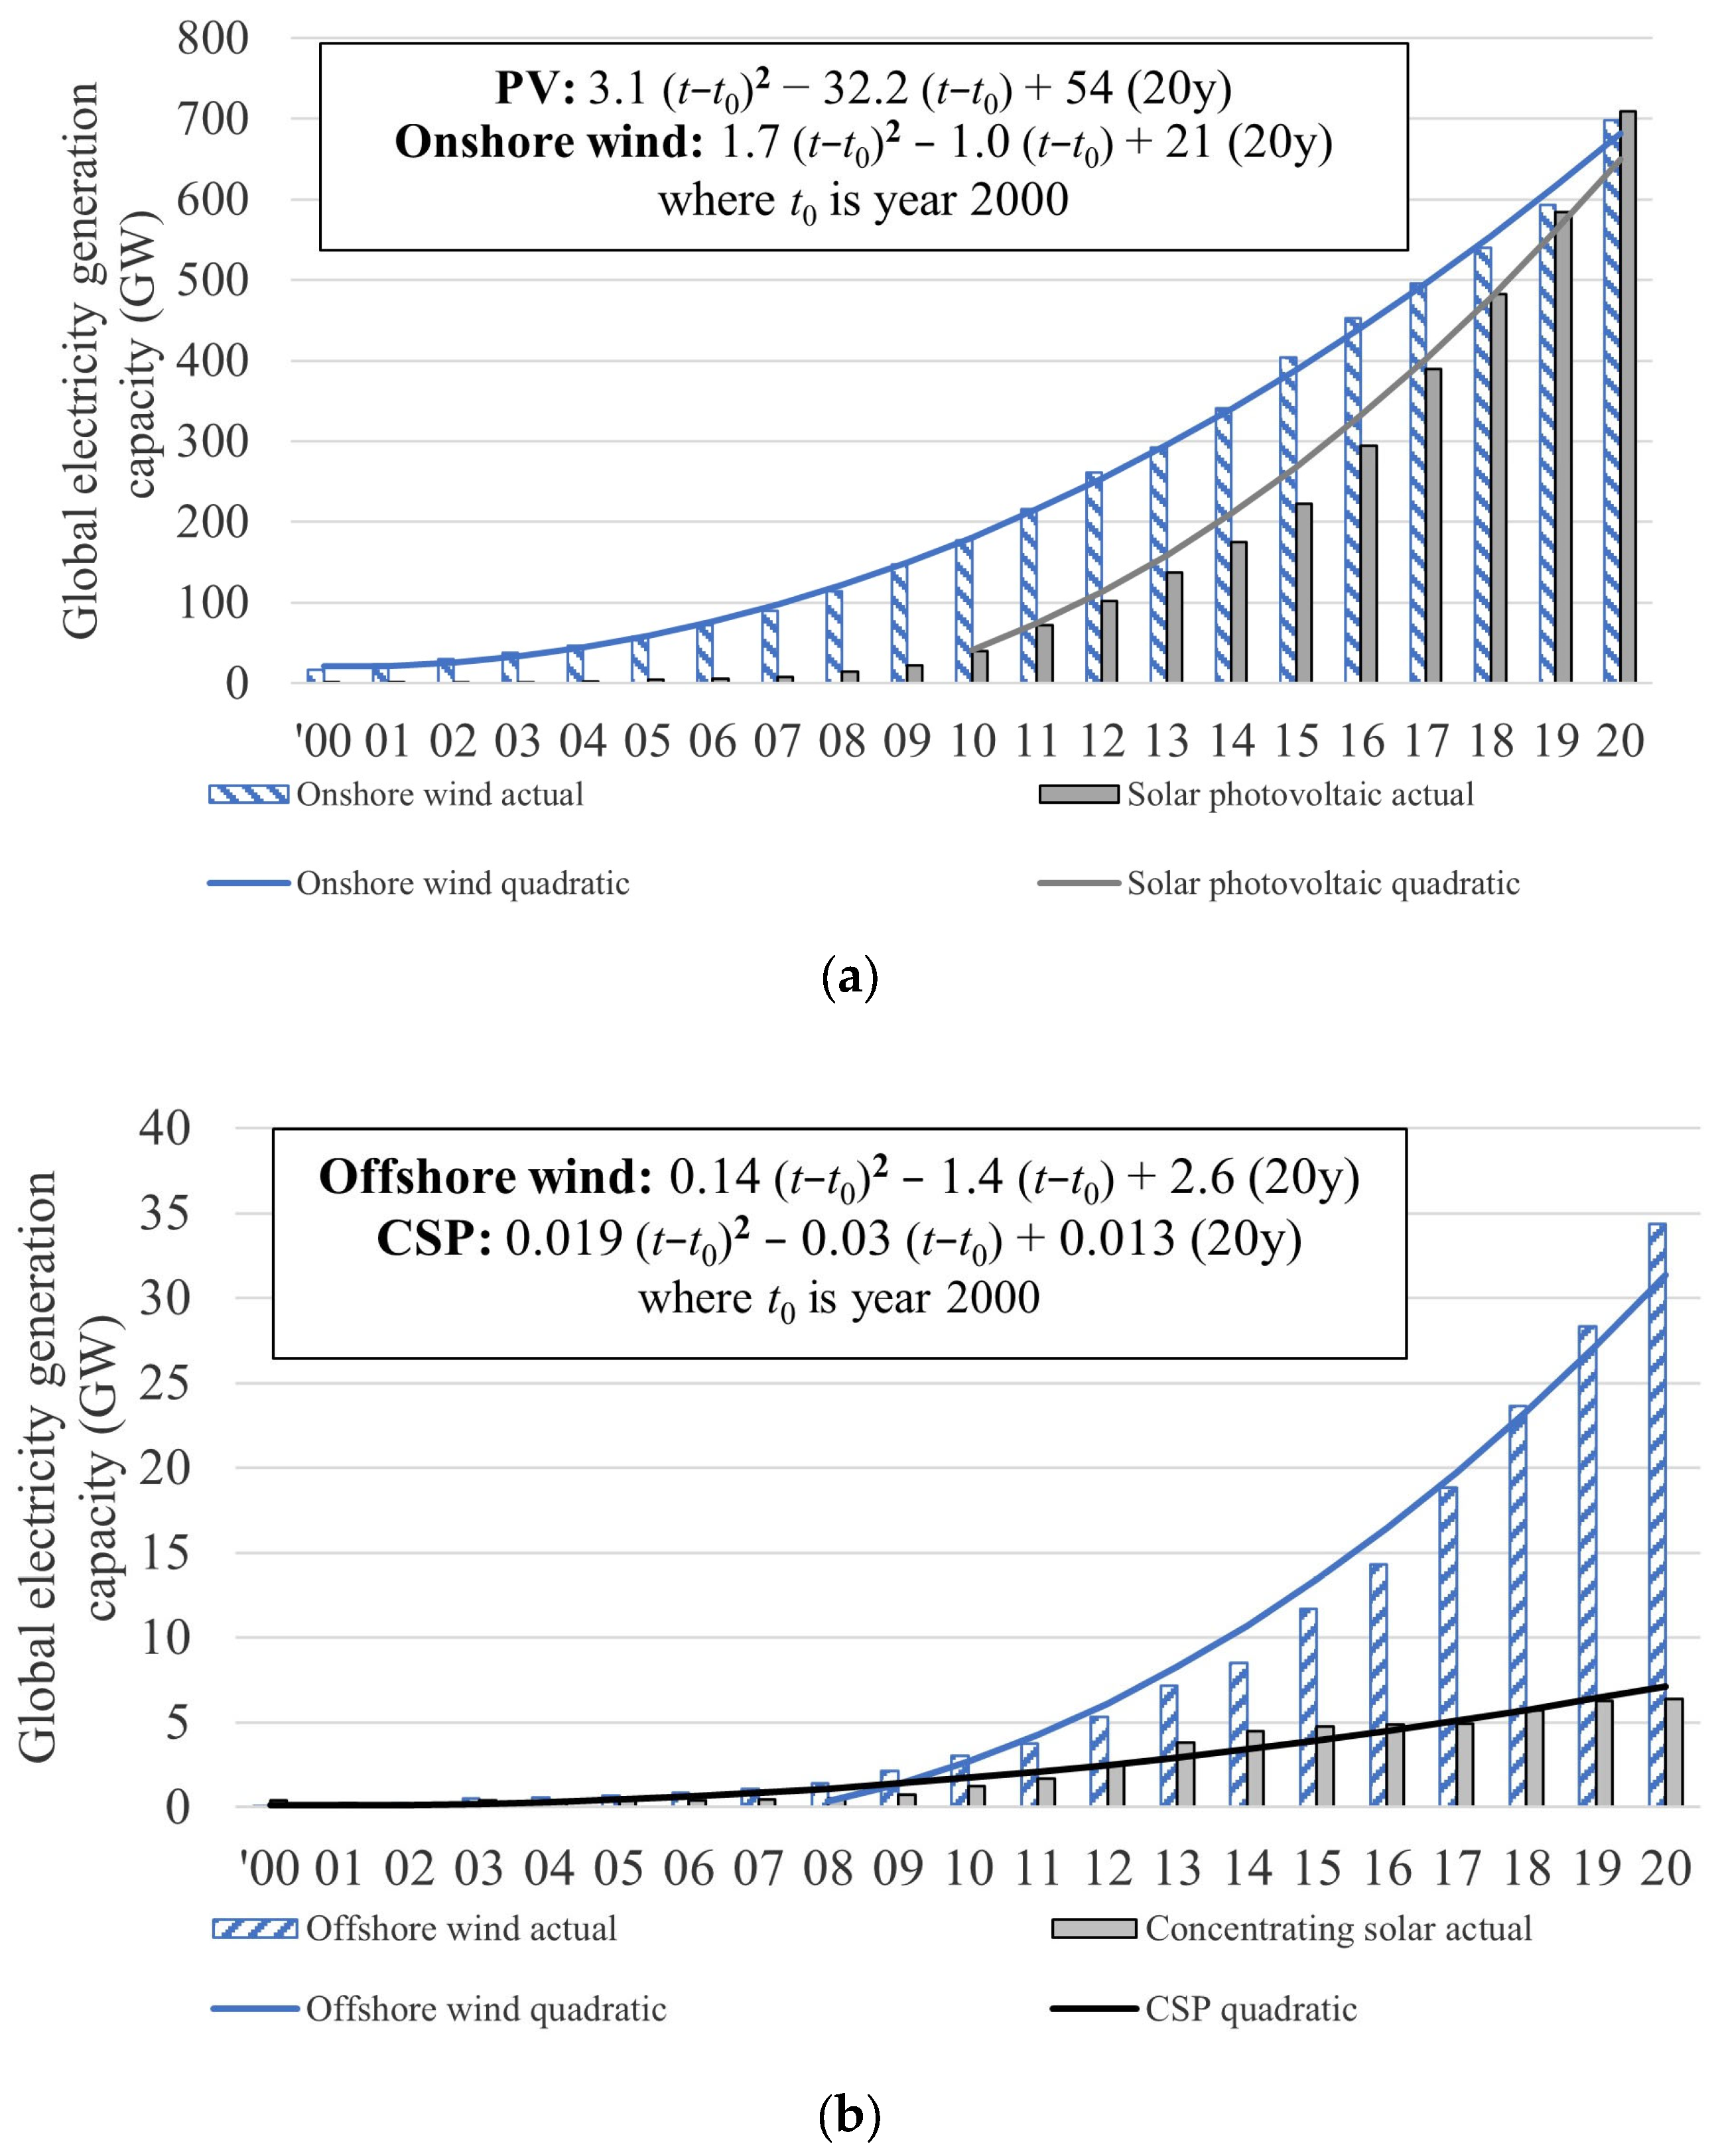
- For both PV and offshore wind, the correlation weakened with R2 reducing from 0.98 to 0.92 when forcing reference manufacturing and generation capacity for the year 2000. The 2010–2020 regression better predicted future trends for both technologies. This result can be attributed to the scaling of manufacturing infrastructure over the last decade. There have been notable shifts for PV since 2010, with Chinese PV production aggressively coming onstream, which is accommodated by a rebasing in manufacturing capacity.
- CSP showed a robust correlation between actual generation capacity and the 10- and 20-year regressions. However, the erratic capacity addition provided distortions to the shorter 10-year time series, an unlikely predictor of future trends.
3. Results
3.1. A Narrower 2050 Global Electricity Generation Capacity Outlook
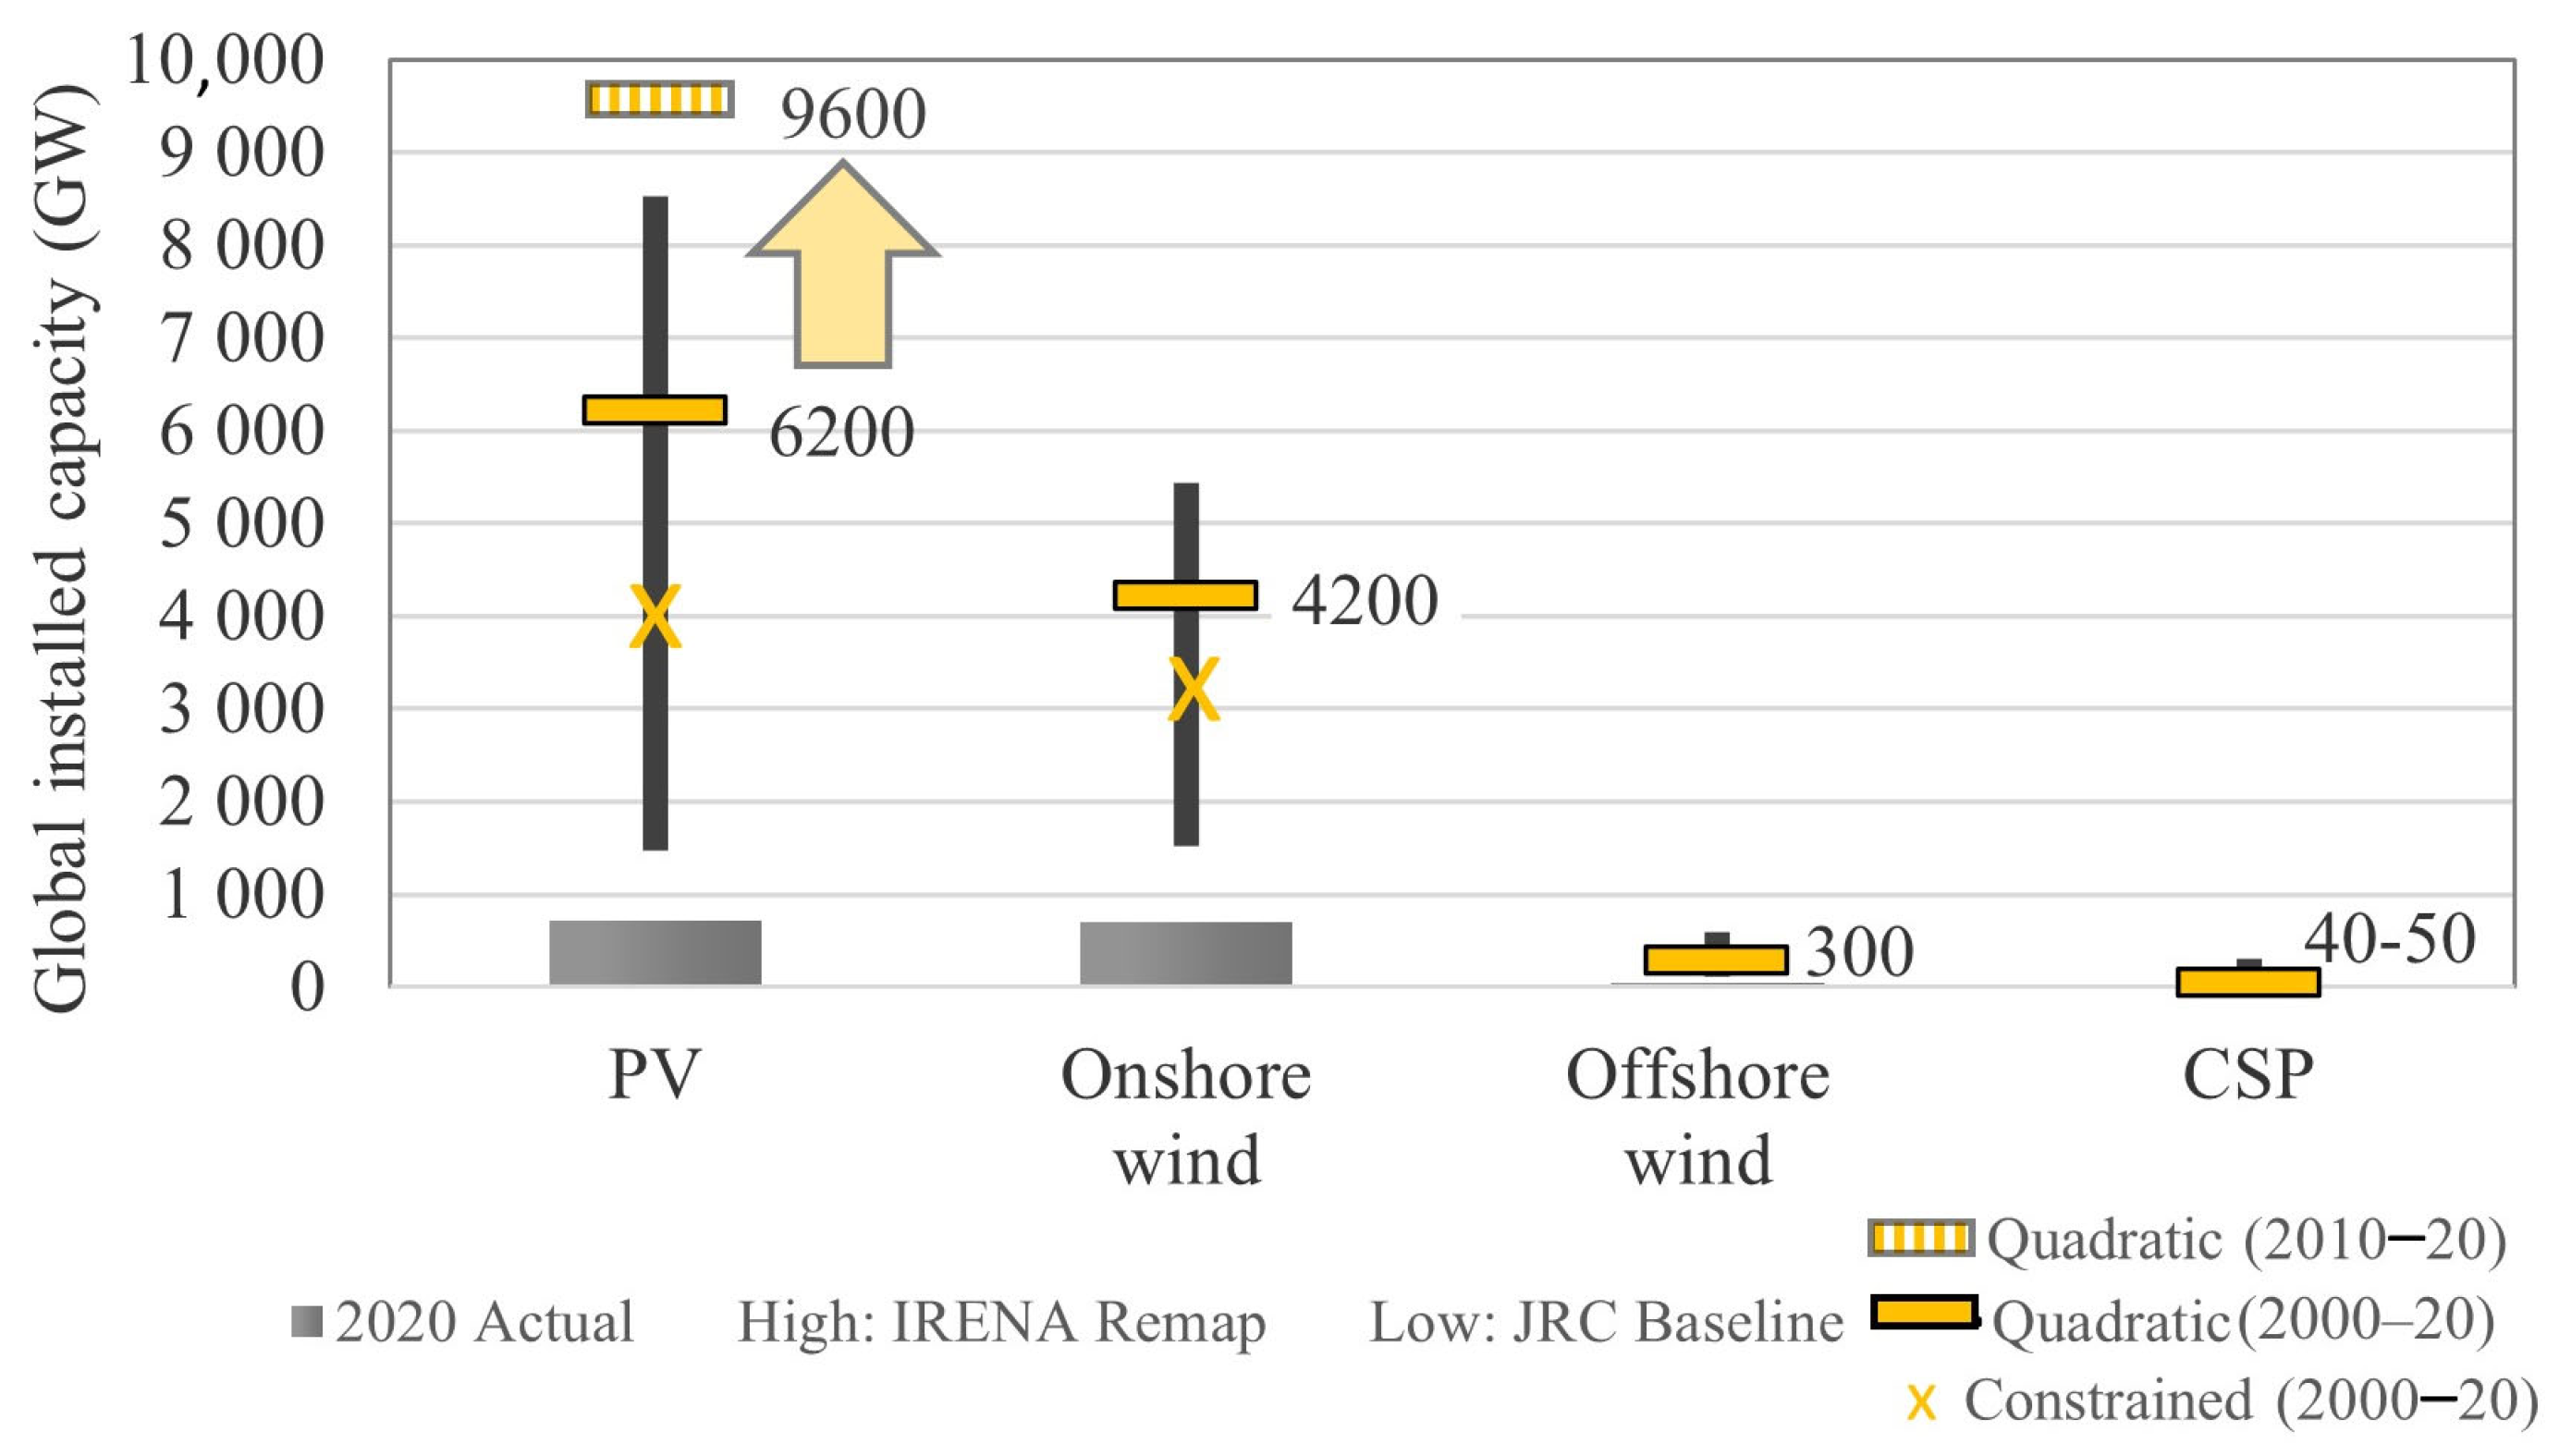
- The more representative forecast using the unconstrained 20-year quadratic extrapolation is the primary marker on the graph (yellow bar). The constrained quadratic provides more conservative extrapolations of generation capacity for PV and onshore wind, reflected in the lower value marked with crosses (yellow X).
- PV estimates using the 2010–2020 ten-year regressions are also shown. The forecasts using the shorter, later time series point to an acceleration in global installations reaching or exceeding the upper end of reviewed ranges, in line with IRENA’s 2050 “REmap” scenario [29]. The 133GW or 19% increase in PV power generation capacity in 2021 [3] aligns with this higher forecast.
- Concentrating solar power with a projected 40–50 GW capacity for 2050 is below published scenarios, at less than half of the JRC’s baseline expectation. The marked reduction in capacity addition in later years drives this lower level of adoption.
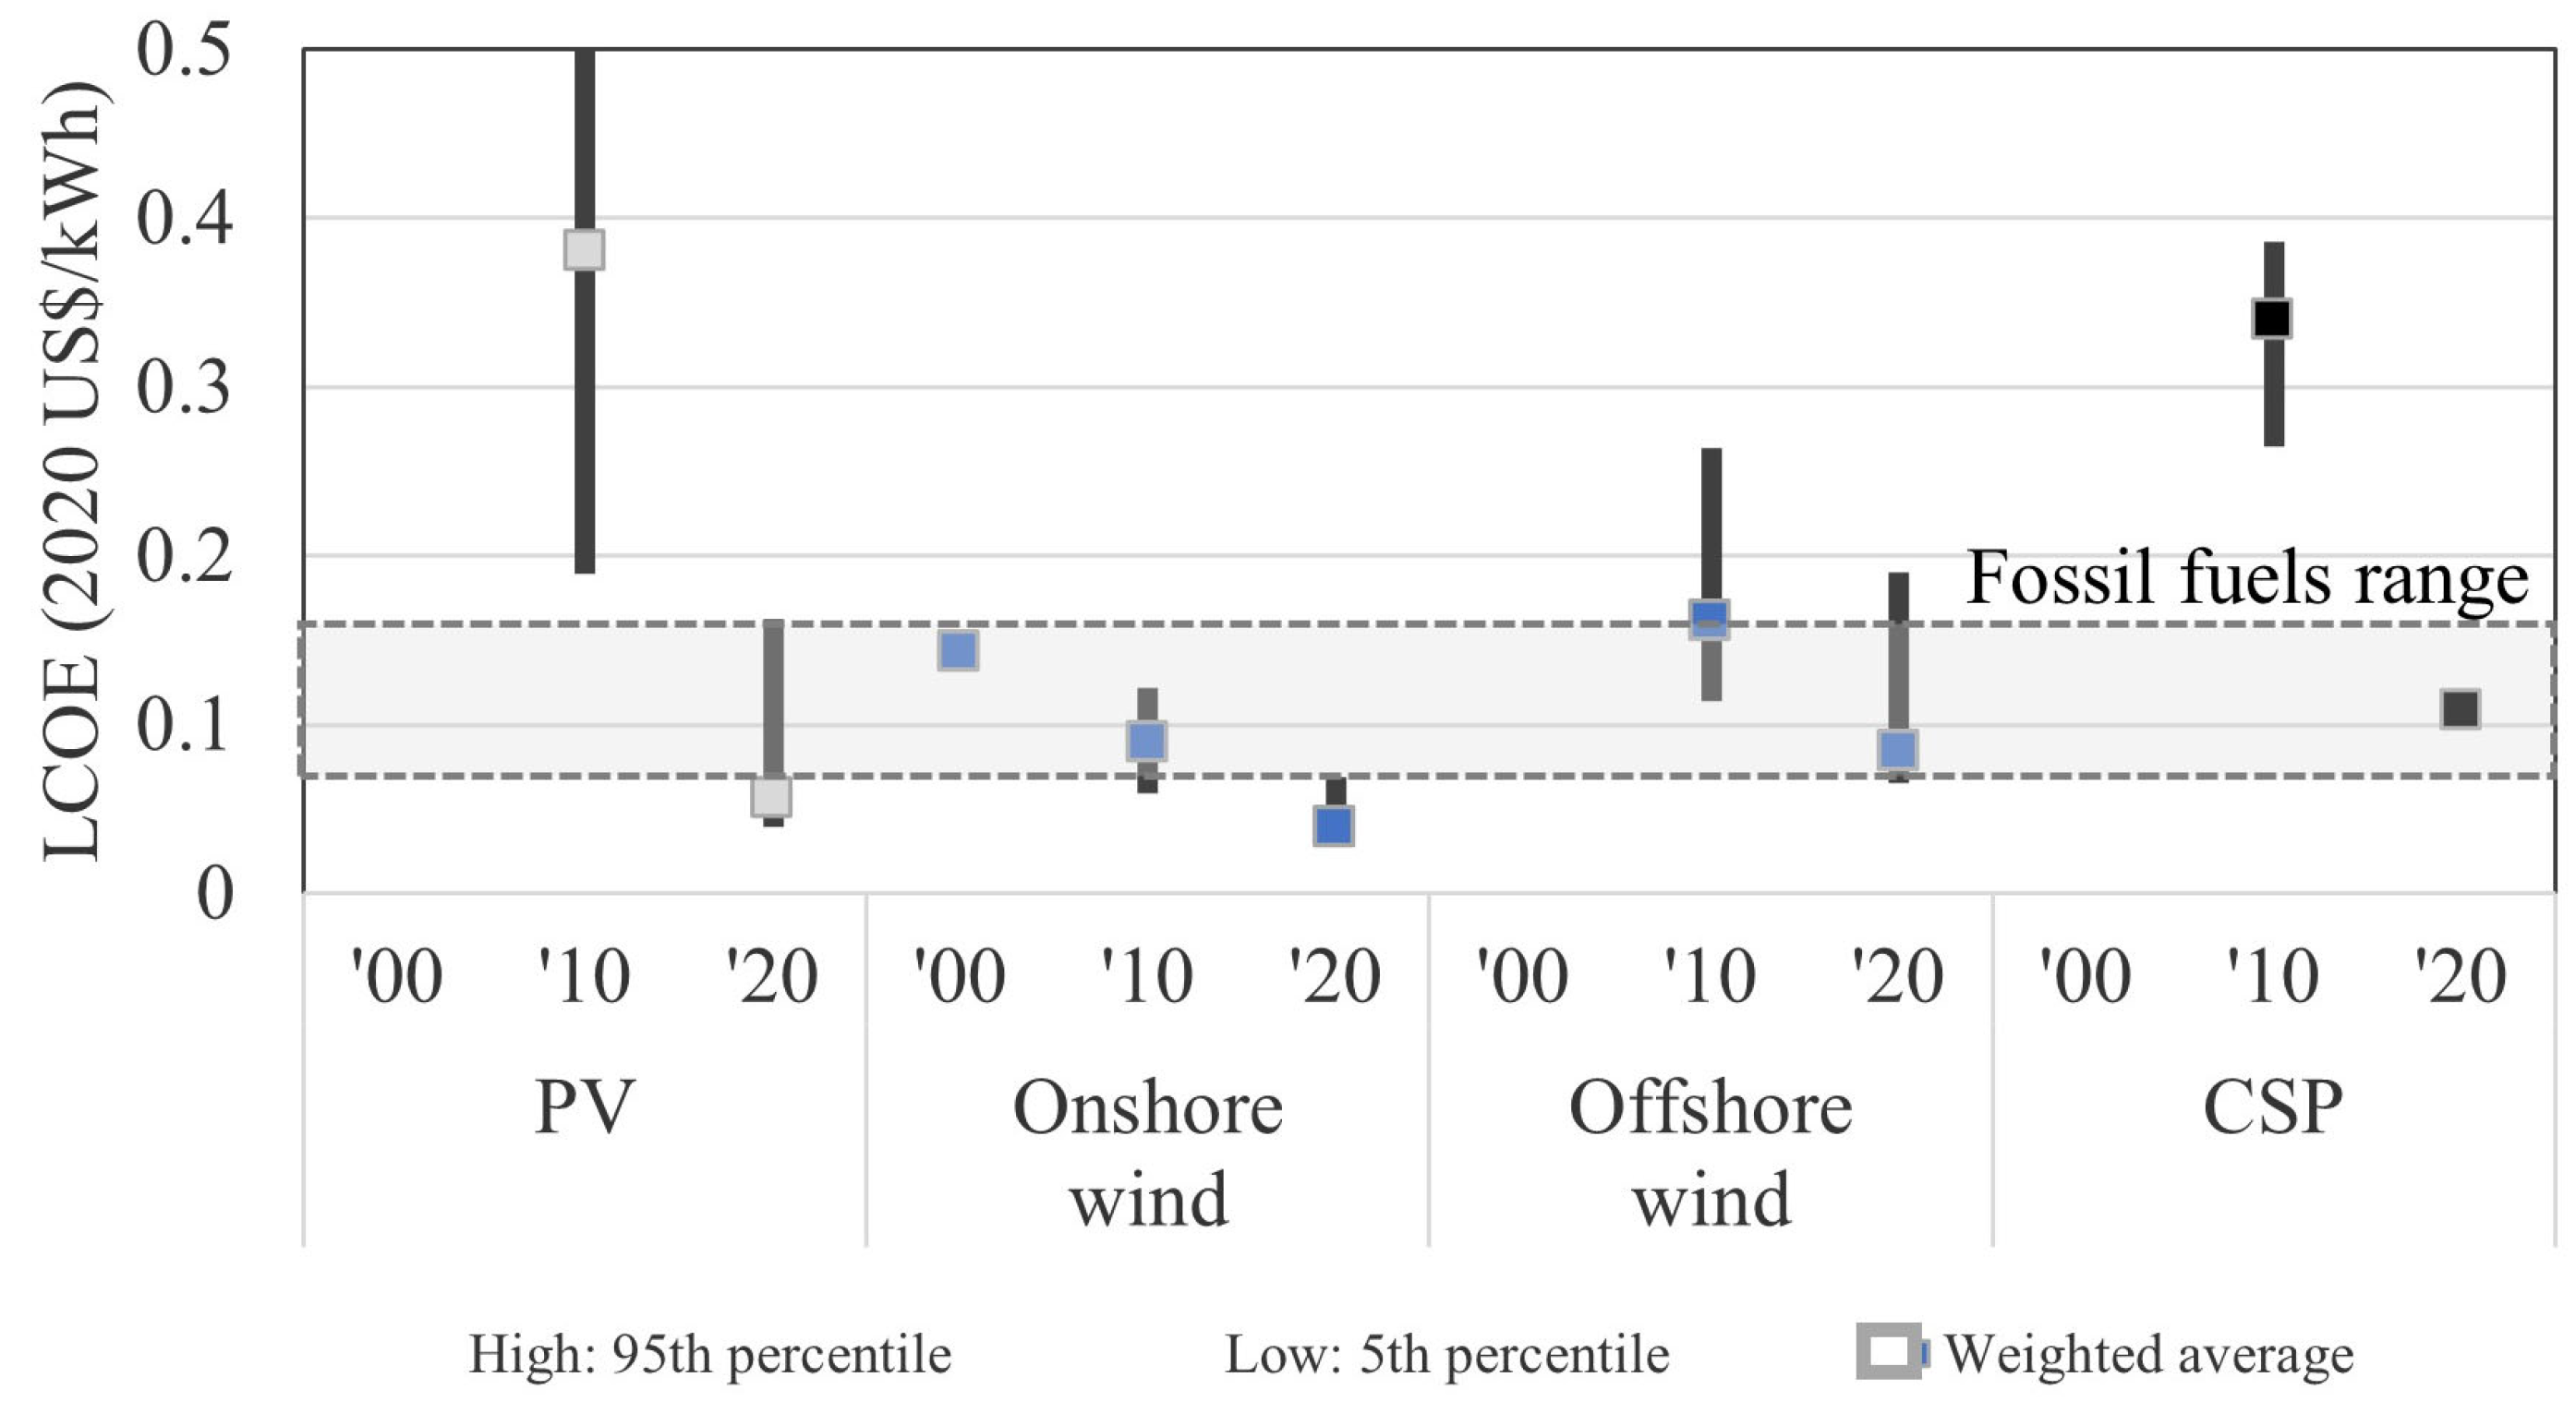
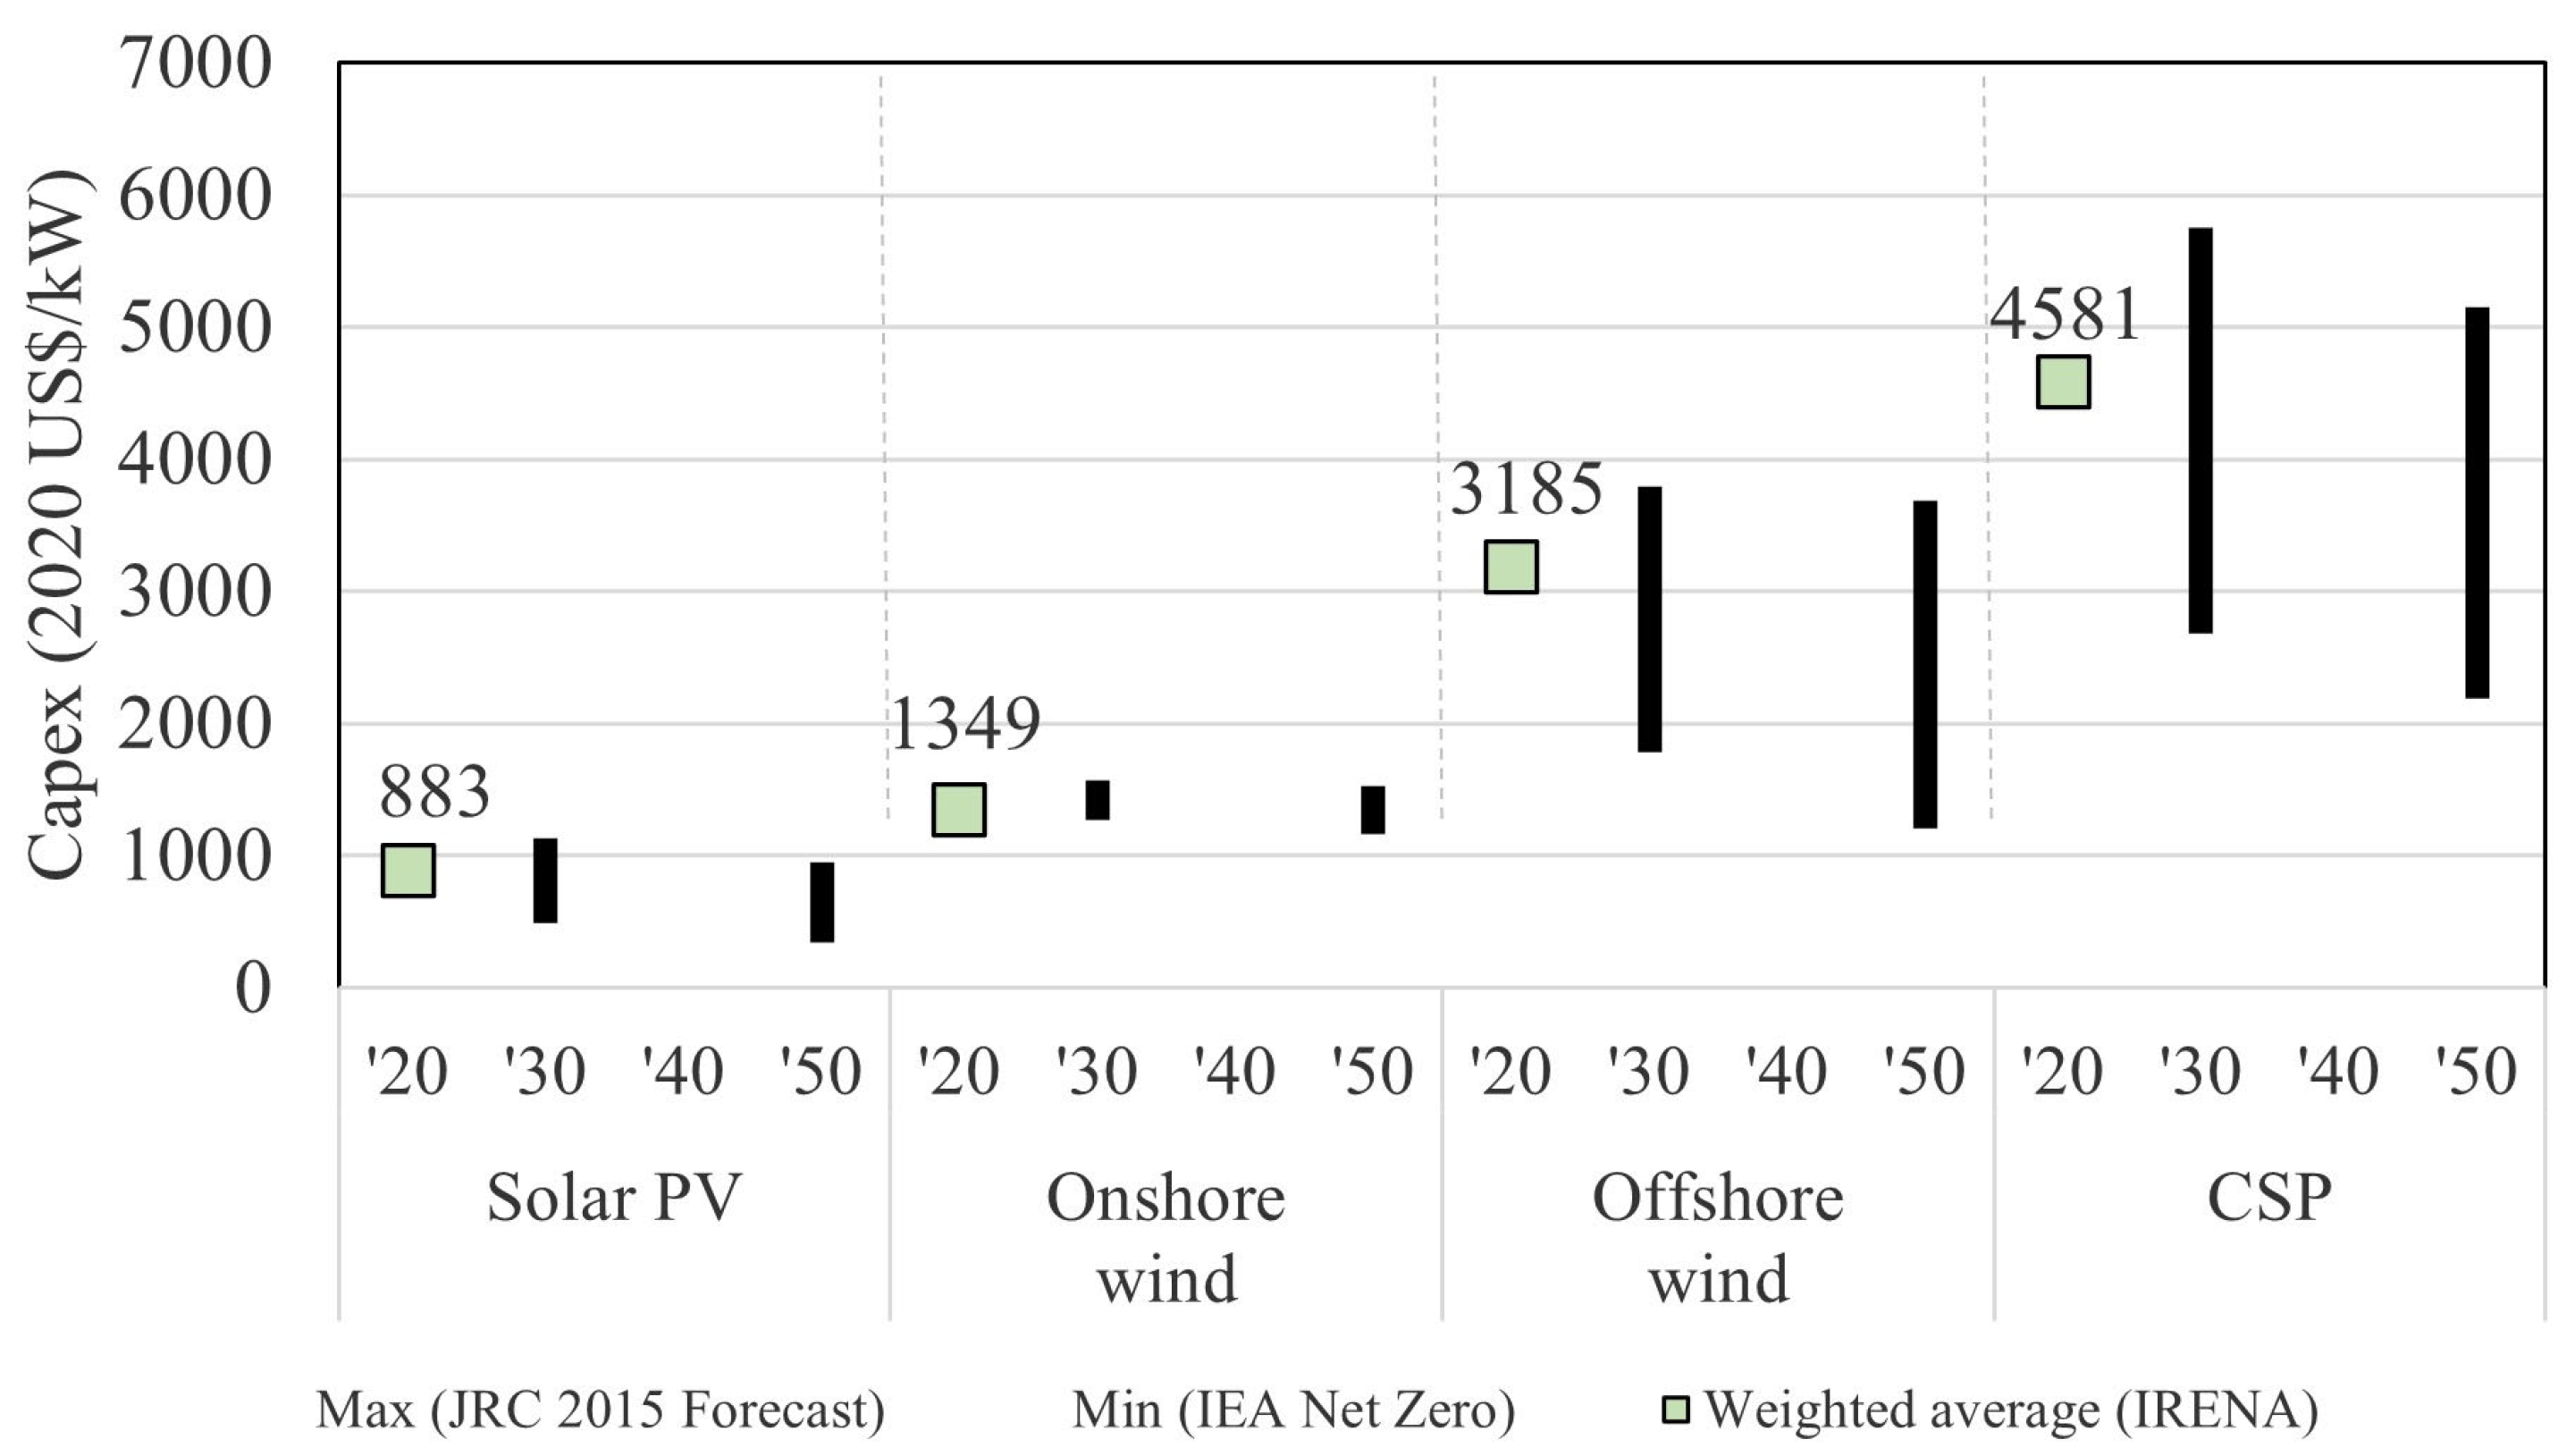
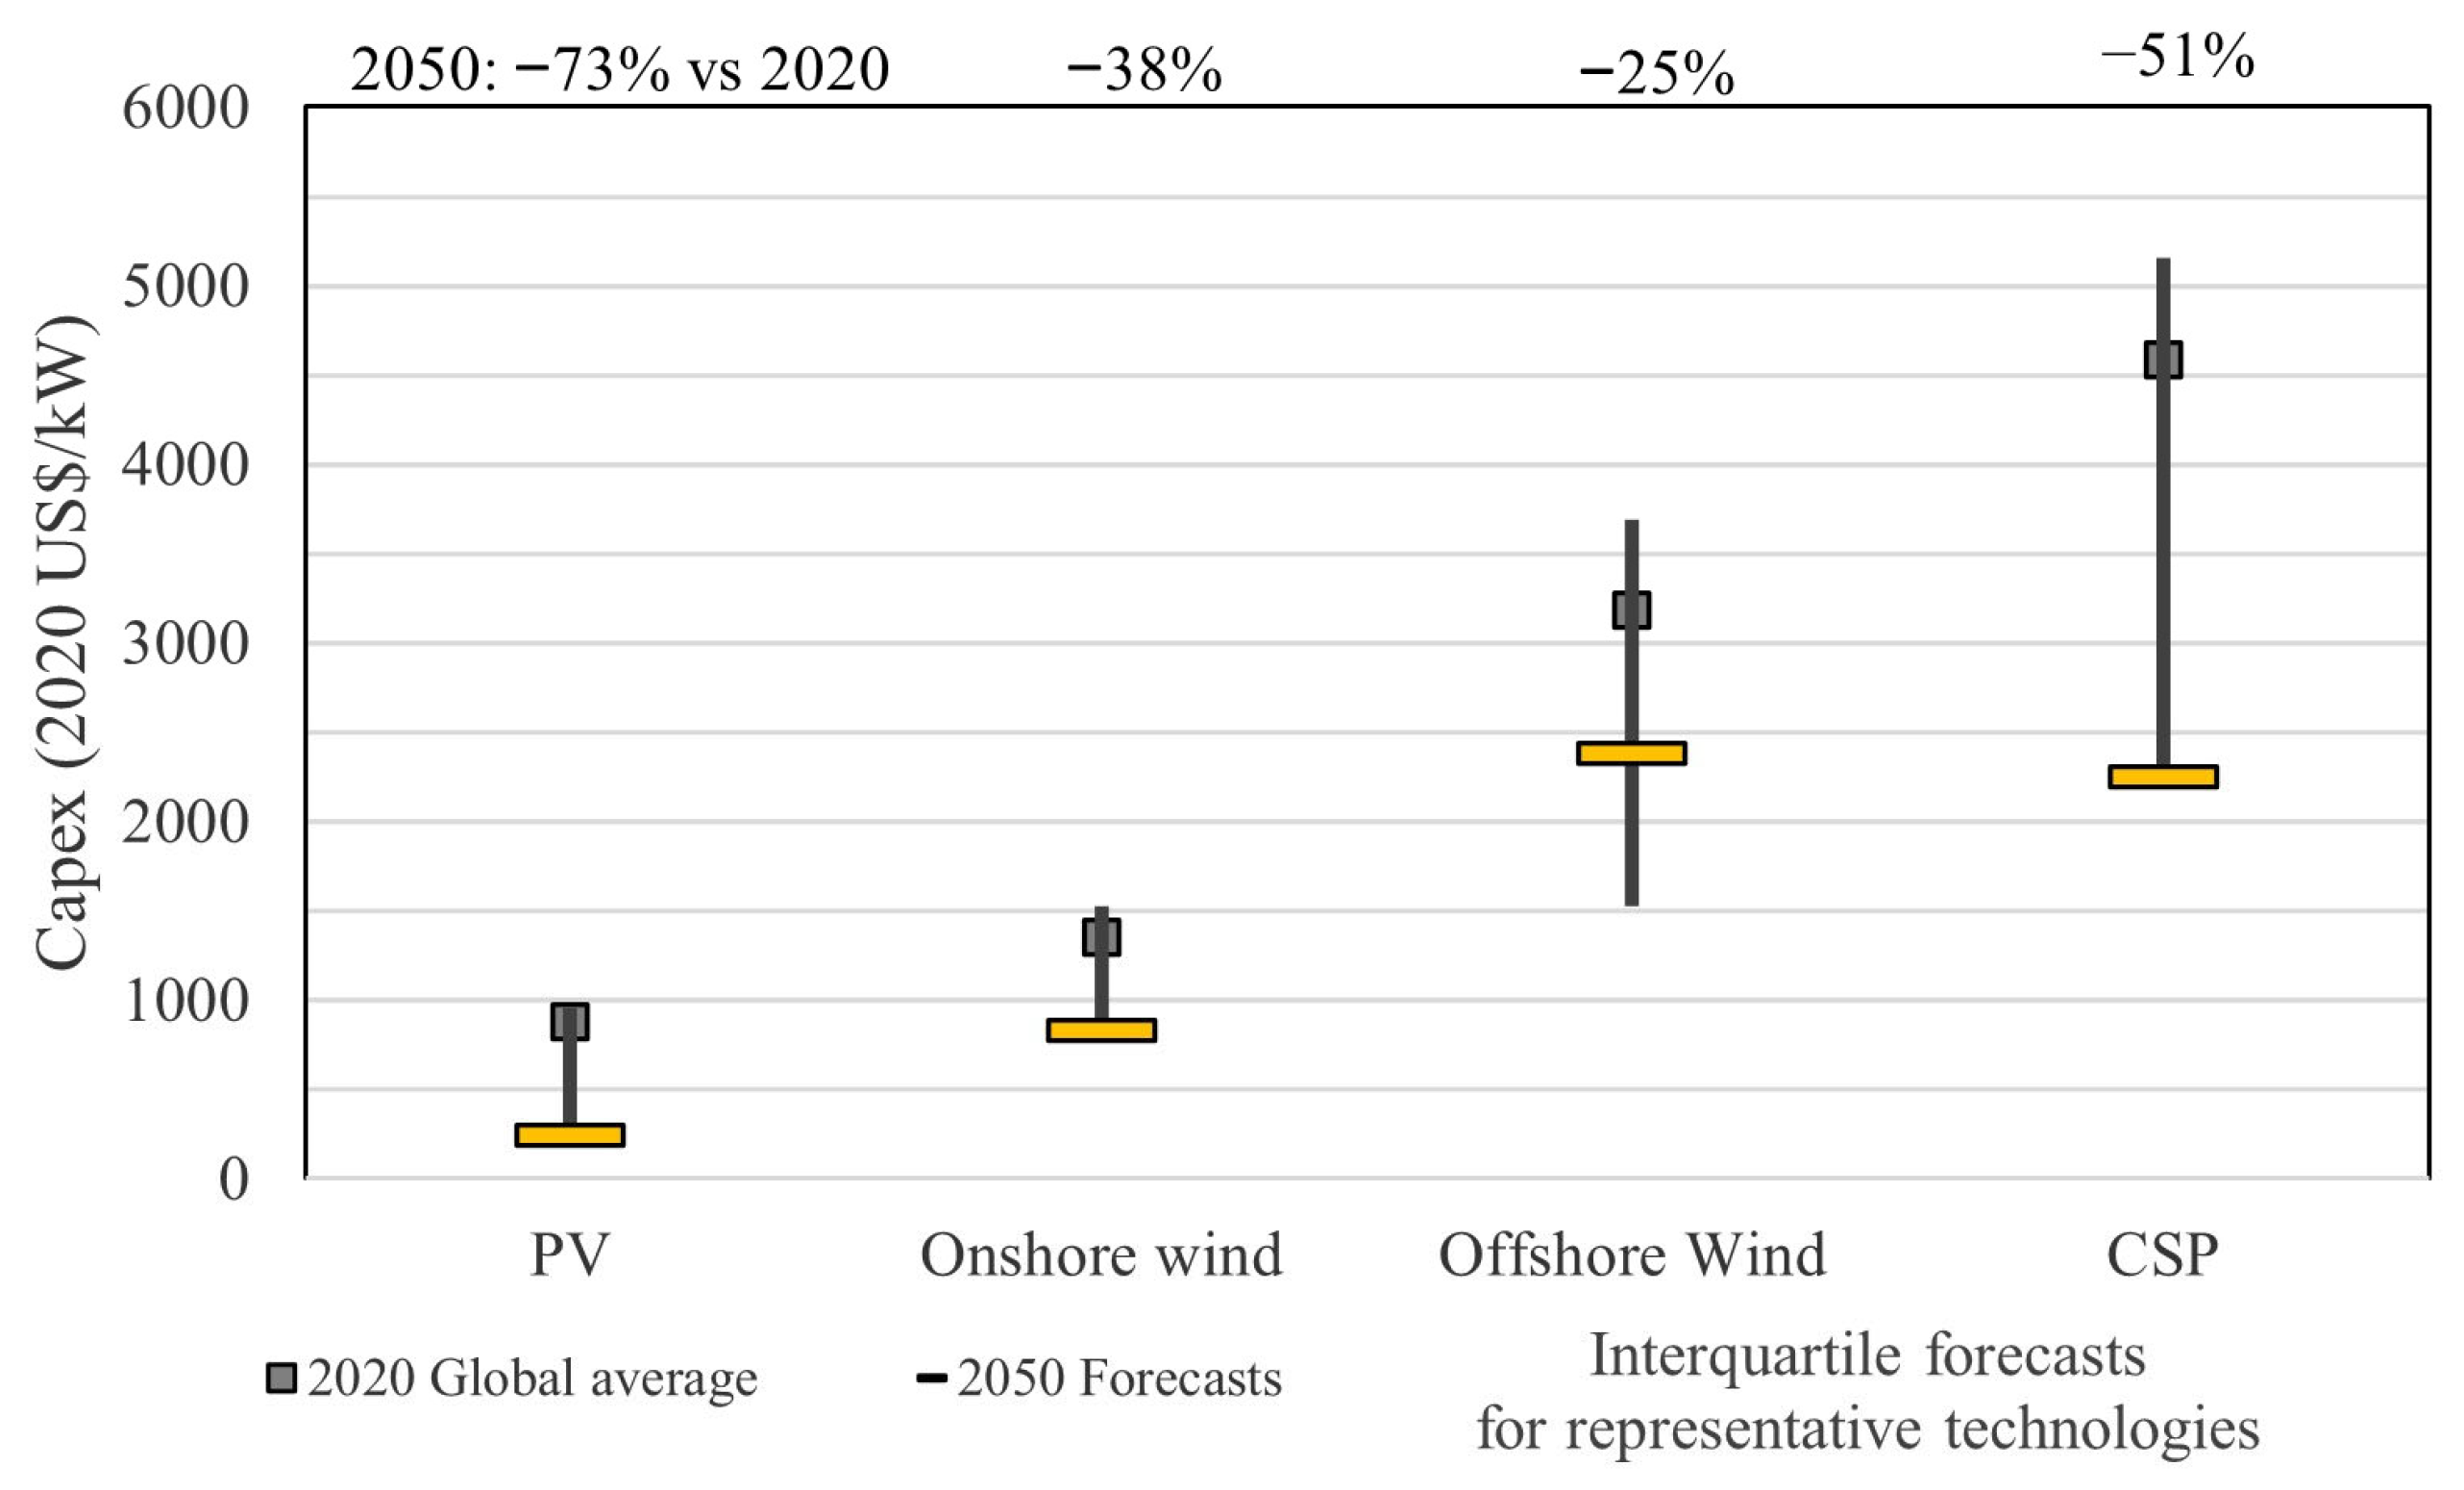
3.2. Cost Forecasts of Established Renewable Energy Technologies
3.3. Cost Forecasts of Nascent Renewable Energy Technologies
3.4. Limitations
4. Discussion
5. Conclusions
- Quadratic best-fit regressions on historical global electricity generation capacity help develop narrower, data-driven growth forecasts.
- The multi-year forecasting approach on global installed capacity was shown to apply to solar and wind renewable energy technologies and high-growth novel technologies such as battery energy storage systems.
- By relying on embedded growth dynamics, shown to be strongly correlated to the manufacturing infrastructure of each technology, the approach helps reduce assumption-driven biases.
Author Contributions
Funding
Data Availability Statement
Conflicts of Interest
References
- International Renewable Energy Agency. Renewable Energy Statistics 2021. Available online: https://www.irena.org/Statistics/Download-query-tools (accessed on 3 November 2021).
- Timilsina, G.R.; Kurdgelashvili, L.; Narbel, P.A. Solar energy: Markets, economics and policies. Renew Sustain. Energy Rev. 2012, 16, 449–465. [Google Scholar] [CrossRef]
- International Renewable Energy Agency. Renewable Power Generation Costs in 2021; International Renewable Energy Agency: Abu Dhabi, United Arab Emirates, 2022. [Google Scholar]
- International Energy Agency. Renewable Energy Market Update—Outlook for 2020 and 2021; International Energy Agency: Paris, France, 2020. [Google Scholar]
- International Renewable Energy Agency. Renewable Power Generation Costs in 2020; International Renewable Energy Agency: Abu Dhabi, United Arab Emirates, 2021. [Google Scholar]
- Antimiani, A.; Costantini, V.; Paglialunga, E. Fossil fuels subsidy removal and the EU carbon neutrality policy. Energy Econ. 2023, 119, 106524. [Google Scholar] [CrossRef]
- Hansen, T.A. Stranded assets and reduced profits: Analyzing the economic underpinnings of the fossil fuel industry’s resistance to climate stabilization. Renew. Sustain. Energy Rev. 2022, 158, 112144. [Google Scholar] [CrossRef]
- Loth, E.; Qin, C.; Simpson, J.G.; Dykes, K. Why we must move beyond LCOE for renewable energy design. Adv. Appl. Energy 2022, 8, 100112. [Google Scholar] [CrossRef]
- Kost, C.; Shammugam, S.; Fluri, V.; Peper, D.; Memar, A.D.; Schlegel, T. Levelized Cost of Electricity—Renewable Energy Technologies; Fraunhofer ISE: Freiburg, Germany, 2021. [Google Scholar]
- Tsiropoulos, I.; Tarvydas, D.; Zucker, A. Cost Development of Low Carbon Energy Technologies—Scenario-Based Cost Trajectories to 2050; Publications Office of the European Union: Luxembourg, 2018. [Google Scholar] [CrossRef]
- Yu, Y.; Guo, S.; Chang, X. Oil prices volatility and economic performance during COVID-19 and financial crises of 2007–2008. Resour. Policy 2022, 75, 102531. [Google Scholar] [CrossRef]
- Kuik, F.; Feveile Adolfsen, J.; Magdalena Lis, E.; Meyler, A. Energy price developments in and out of the COVID-19 pandemic—From commodity prices to consumer prices. Econ. Bull. Artic. 2022, 4. [Google Scholar]
- Sens, L.; Neuling, U.; Kaltschmitt, M. Capital expenditure and levelized cost of electricity of photovoltaic plants and wind turbines—Development by 2050. Renew. Energy 2022, 185, 525–537. [Google Scholar] [CrossRef]
- Bouckaert, S.; Pales, A.F.; McGlade, C.; Remme, U.; Wanner, B.; Varro, L.; D’Ambrosio, D.; Spencer, T. Net Zero by 2050: A Roadmap for the Global Energy Sector; International Energy Agency: Paris, France, 2021. [Google Scholar]
- Mauleón, I. Assessing PV and wind roadmaps: Learning rates, risk, and social discounting. Renew. Sustain. Energy Rev. 2019, 100, 71–89. [Google Scholar] [CrossRef]
- Xiao, M.; Junne, T.; Haas, J.; Klein, M. Plummeting costs of renewables—Are energy scenarios lagging? Energy Strategy Rev. 2021, 35, 100636. [Google Scholar] [CrossRef]
- Metayer, M.; Breyer, C.; Fell, H.-J. The projections for the future and quality in the past of the World Energy Outlook for solar PV and other renewable energy technologies. In Proceedings of the 31st EU PVSEC, Hamburg, Germany, 14–18 September 2015. [Google Scholar]
- United States Energy Information Administration. Wind and Solar Data and Projections; United States Energy Information Administration: Washington, DC, USA, 2016. [Google Scholar]
- Wiser, R.; Rand, J.; Seel, J.; Beiter, P.; Baker, E.; Lantz, E.; Gilman, P. Expert elicitation survey predicts 37% to 49% declines in wind energy costs by 2050. Nat. Energy 2021, 6, 555–565. [Google Scholar] [CrossRef]
- International Energy Agency. World Energy Outlook; International Energy Agency: Paris, France, 2022. [Google Scholar]
- Daim, T.; Harell, G.; Hogabaum, L. Forecasting renewable energy production in the US. Foresight 2012, 14, 225–241. [Google Scholar] [CrossRef]
- Croonenbroeck, C.; Stadtmann, G. Renewable generation forecast studies—Review and good practice guidance. Renew. Sustain. Energy Rev. 2019, 108, 312–322. [Google Scholar] [CrossRef]
- Giannelos, S.; Jain, A.; Borozan, S.; Falugi, P.; Moreira, A.; Bhakar, R.; Mathur, J.; Strbac, G. Long-term expansion planning of the transmission network in India under multi-dimensional uncertainty. Energies 2021, 14, 7813. [Google Scholar] [CrossRef]
- Soman, S.S.; Zareipour, H.; Member, S.; Malik, O.; Fellow, L. A Review of Wind Power and Wind Speed Forecasting Methods with Different Time Horizons. In Proceedings of the North American Power Symposium 2010, Arlington, TX, USA, 26–28 September 2010. [Google Scholar] [CrossRef]
- Dudek, G. Multilayer perceptron for GEFCom2014 probabilistic electricity price forecasting. Int. J. Forecast. 2016, 32, 1057–1060. [Google Scholar] [CrossRef]
- Zhang, Z.; Zhang, Y.; Huang, Q.; Lee, W.-J. Market-oriented optimal dispatching strategy for a wind farm with a multiple stage hybrid energy storage system. CSEE J. Power Energy Syst. 2018, 4, 417–424. [Google Scholar] [CrossRef]
- Ding, S.; Zhang, H.; Tao, Z.; Li, R. Integrating data decomposition and machine learning methods: An empirical proposition and analysis for renewable energy generation forecasting. Expert Syst. Appl. 2022, 204, 117635. [Google Scholar] [CrossRef]
- Giannelos, S.; Moreira, A.; Papadaskalopoulos, D.; Borozan, S.; Pudjianto, D.; Konstantelos, I.; Sun, M.; Strbac, G. A machine learning approach for generating and evaluating forecasts on the environmental impact of the buildings sector. Energies 2023, 16, 2915. [Google Scholar] [CrossRef]
- Wright, T.P. Factors affecting the cost of airplanes. J. Aeronaut Sci. 1936, 3, 122–128. [Google Scholar] [CrossRef]
- International Renewable Energy Agency. Global Energy Transformation: A Roadmap to 2050; International Renewable Energy Agency: Abu Dhabi, United Arab Emirates, 2019. [Google Scholar]
- Nagy, B.; Farmer, J.D.; Bui, Q.M.; Trancik, J.E. Statistical basis for predicting technological progress. PLoS ONE 2013, 8, e52669. [Google Scholar] [CrossRef] [PubMed]
- Farmer, J.D. How predictable is technological progress? Res. Policy 2016, 45, 647–665. [Google Scholar] [CrossRef]
- Rubin, E.S.; Azevedo, I.M.L.; Jaramillo, P.; Yeh, S. A review of learning rates for electricity supply technologies. Energy Policy 2015, 86, 198–218. [Google Scholar] [CrossRef]
- McDonald, A.; Schrattenholzer, L. Learning curves and technology assessment. Int. J. Technol. Manag. 2003, 23, 718–745. [Google Scholar] [CrossRef]
- Yao, Y.; Xu, J.; Sun, D. Untangling global levelised cost of electricity based on multi-factor learning curve for renewable energy: Wind, solar, geothermal, hydropower and bioenergy. J. Clean. Prod. 2021, 285, 124827. [Google Scholar] [CrossRef]
- Wirth, H. Recent facts about photovoltaics in Germany. Fraunhofer Inst. Sol. Energy Syst. 2021, 1, 92. [Google Scholar]
- Vartiainen, E.; Masson, G.; Breyer, C.; Moser, D.; Román Medina, E. Impact of weighted average cost of capital, capital expenditure, and other parameters on future utility-scale PV levelised cost of electricity. Prog. Photovolt. Res. Appl. 2020, 28, 439–453. [Google Scholar] [CrossRef]
- International Renewable Energy Agency. Electricity Storage and Renewables: Costs and Markets to 2030; International Renewable Energy Agency: Abu Dhabi, United Arab Emirates, 2017. [Google Scholar]
- Bloomberg New Energy Finance. Electric Vehicle Outlook 2020; Bloomberg New Energy Finance: New York, NY, USA, 2020. [Google Scholar]
- International Energy Agency. Energy Storage 2021. Available online: https://www.iea.org/reports/energy-storage (accessed on 9 March 2022).
- Schmidt, O.; Hawkes, A.; Gambhir, A. The future cost of electrical energy storage based on experience rates. Nat. Energy 2017, 2, 17110. [Google Scholar] [CrossRef]
- Glenk, G.; Meier, R.; Reichelstein, S. Cost dynamics of clean energy technologies. Schmalenbach J. Bus. Res. 2021, 73, 179–206. [Google Scholar] [CrossRef] [PubMed]
- National Renewable Energy Laboratory. Annual Technology Baseline 2022. Available online: https://atb.nrel.gov/electricity/2022/index (accessed on 21 July 2022).
- Denholm, P.; Eichman, J.; Margolis, R. Evaluating the Technical and Economic Performance of PV Plus Storage Power Plants; National Renewable Energy Lab. (NREL): Golden, CO, USA, 2017. [Google Scholar]
- Lee, J.; Yang, J.S. Government R&D investment decision-making in the energy sector: LCOE foresight model reveals what regression analysis cannot. Energy Strategy Rev. 2018, 21, 1–15. [Google Scholar] [CrossRef]
- Haegel, N.M.; Atwater, H., Jr.; Barnes, T.; Breyer, C.; Burrell, A.; Chiang, Y.M.; De Wolf, S.; Dimmler, B.; Feldman, D.; Glunz, S.; et al. Terawatt-scale photovoltaics: Transform global energy. Science 2019, 364, 836–838. [Google Scholar] [CrossRef] [PubMed]


| Global Installed Electricity Generation Capacity (GW) | ||||||
|---|---|---|---|---|---|---|
| IRENA 2020 Base [5] | EU Joint Research Centre (JRC) 2050 Outlook [10] | IRENA 2050 REmap [30] | IEA 2050 Net Zero [14] | |||
| Actual | Baseline | Diversified | ProRES | <2 °C | <1.5 °C | |
| Hydropower | 1153 | 1656 | 2193 | 1503 | 1500 | 2599 |
| Solar photovoltaic | 707 | 1464 | 4424 | 6745 | 8520 | 14,458 |
| Onshore wind | 698 | 1521 | 3037 | 4444 | 5440 | 7439 |
| Offshore wind | 34 | 108 | 437 | 1131 | 600 | 827 |
| Concentrating solar | 6 | 134 | 939 | 1473 | 300 | 426 |
| R2 from Regressions on Global Installed Electricity Generation Capacity | ||||
|---|---|---|---|---|
| Exponential | Linear c1 (t − t0) + c0 | Quadratic c2 (t − t0)2 + c1 (t − t0) + c0 | Polynomial c3 (t − t0)3 + c2 (t − t0)2 +c1 (t − t0) + c0 | |
| Solar photovoltaic | 0.993 | 0.746 | 0.981 | 0.999 |
| Onshore wind | 0.983 | 0.927 | 0.998 | 0.998 |
| Offshore wind | 0.996 | 0.760 | 0.978 | 0.999 |
| Concentrating solar | 0.916 | 0.880 | 0.956 | 0.976 |
| Period | Regression Coefficients | R2 | 2020 Capacity Extrapolation (GW) | 2020 Deviation |
|---|---|---|---|---|
| 2020 Actual | 698 | |||
| 2000–2015 (15 y) | 1.8 (t − t0)2 − 3.1 (t − t0) + 25 | 0.998 | 707 | 1% |
| 2000–2015 (15 y) | 27 | 0.993 | 1038 | 49% |
| 2000–2010 (10 y) | 1.6 (t − t0)2 − 0.8 (t − t0) + 22 | 0.995 | 650 | −7% |
| 2000–2010 (10 y) | 18.9 | 0.999 | 1713 | 145% |
| 2000–2005 (5 y) | 0.5 (t − t0)2 + 5.6 (t − t0) + 17 | 0.999 | 325 | −54% |
| 2000–2005 (5 y) | 18.9 | 0.994 | 1752 | 151% |
| Total Installed Costs or Capex (USD/kW Improvement) | LCOE (USD/kWh Improvement) | |||
|---|---|---|---|---|
| LR from Compiled Literature Review [10] | IRENA Reported LR [5] | IRENA Reported LR [5] | ||
| Low | High | 2010–2020 | 2010–2020 | |
| Solar photovoltaic | 10% | 35% | 34% | 39% |
| Onshore wind | 8% | 20% | 17% | 32% |
| Offshore wind | 8% | 15% | 9% | 15% |
| Concentrating solar | 5% | 20% | 13–22% | 36% |
| Solar Photovoltaic | Onshore Wind | ||||||||
|---|---|---|---|---|---|---|---|---|---|
| P0 | G0 | R2 | P0 | G0 | R2 | ||||
| (GW) | (GW) | (GW) | (GW) | (GW) | (GW) | ||||
| 20 y 2000–2020 | Unconstrained | 6.2 | −32 | 54 | 0.981 | 3.4 | −1 | 21 | 0.998 |
| P0 and G0 2000 estimates | 3.2 | 0.4 | 0.8 | 0.921 | 2.6 | 7 | 17 | 0.994 | |
| 10 y 2010–2020 | Unconstrained | 11.6 | 7 | 53 | 0.999 | 3.0 | 35 | 181 | 0.995 |
| P0 and G0 2010 estimates | 6.9 | 32 | 40 | 0.989 | 2.3 | 38 | 178 | 0.995 | |
| Offshore wind | Concentrating solar | ||||||||
| P0 | G0 | R2 | P0 | G0 | R2 | ||||
| (GW) | (GW) | (GW) | (GW) | (GW) | (GW) | ||||
| 20 y 2000–2020 | Unconstrained | 0.29 | −1.4 | 2.6 | 0.978 | 0.04 | −0.03 | 0.1 | 0.956 |
| P0 and G0 2000 estimates | 0.14 | 0.15 | 0.07 | 0.917 | 0.02 | 0.12 | 0.4 | 0.946 | |
| 10 y 2010–2020 | Unconstrained | 0.6 | 0.2 | 3.4 | 0.999 | −0.07 | 0.9 | 1.2 | 0.971 |
| P0 and G0 2010 estimates | 0.4 | 1.4 | 3.1 | 0.989 | −0.07 | 0.9 | 1.3 | 0.971 | |
| LCOE Learning Rate | 2050 LCOE Estimates 2000–2020 Capacity Forecasts 20 y Regression | 2050 LCOE Estimates 2010–2020 Capacity Forecasts 10 y Regression | 2050 LCOE Published Forecast and Scenario Range | |||
|---|---|---|---|---|---|---|
| 2020 USD/kWh | Reduction % | 2020 USD/kWh | % of 2020 LCOE | 2020 USD/kWh | ||
| Solar photovoltaic | 35% | 0.015 | −74% | 0.011 | −80% | 0.015–0.025 |
| 39% * | 0.012 | −79% | 0.009 | −84% | ||
| Onshore wind | 32% * | 0.014 | −63% | 10 y regression outcome consistent with 20y | 0.03–0.04 | |
| 35% | 0.013 | −67% | ||||
| Offshore wind | 15% * | 0.051 | −39% | 0.045 | −46% | 0.035–0.040 |
| 20% | 0.042 | −50% | 0.036 | −57% | ||
| Concentrating solar | 25% | 0.069 | −36% | 10 y regression distorted with the slowdown | 0.06 | |
| 36% * | 0.044 | −59% | ||||
| Li-Ion Total | Li-Ion Stationary | ||||||||
|---|---|---|---|---|---|---|---|---|---|
| P0 | G0 | R2 | P0 | G0 | R2 | ||||
| (GW) | (GW) | (GW) | (GW) | (GW) | (GW) | ||||
| 8 y 2011–2019 | Unconstrained | 5.5 | −1.8 | 38 | 0.992 | ||||
| P0 and G0 2011 estimates | 3.6 | 6.5 | 35 | 0.981 | |||||
| 6 y 2014–2020 | Unconstrained | 0.82 | 0.14 | 1.0 | 0.999 | ||||
| P0 and G0 2014 estimates | 0.65 | 0.70 | 0.9 | 0.996 | |||||
| Learning Rate | 2020 | 2030 | 2050 | ||||
|---|---|---|---|---|---|---|---|
| Min | Max | Min | Max | Min | Max | ||
| BESS Capex 2020 USD/kWh | 20% | 15% | 430 | 210 | 290 | 125 | 210 |
| PV + BESS Capex 2020 USD/kW | 30% | 20% | 2044 | 1100 | 1400 | 600 | 950 |
| PV + BESS LCOE 2020 USD/kWh | 30% | 25% | 0.065 | 0.034 | 0.043 | 0.017 | 0.026 |
| Generation Capacity | ||||
|---|---|---|---|---|
| Actual | Forecast | Deviation | ||
| GW | GW | % | ||
| Solar Photovoltaic | 2020 | 714 | 704 | −1.3% |
| 2021 | 855 | 833 | −2.6% | |
| 2022 | 1047 | 974 | −7.0% | |
| Onshore wind | 2020 | 697 | 681 | −2.3% |
| 2021 | 770 | 750 | −2.6% | |
| 2022 | 836 | 822 | −1.7% | |
| Offshore wind | 2020 | 34 | 35 | 0.3% |
| 2021 | 54 | 41 | −24.9% | |
| 2022 | 63 | 48 | −24.6% | |
| Concentrating solar | 2020 | 6.5 | 6.3 | −3.1% |
| 2021 | 6.4 | 6.4 | 0.4% | |
| 2022 | 6.5 | 6.5 | −0.3% | |
Disclaimer/Publisher’s Note: The statements, opinions and data contained in all publications are solely those of the individual author(s) and contributor(s) and not of MDPI and/or the editor(s). MDPI and/or the editor(s) disclaim responsibility for any injury to people or property resulting from any ideas, methods, instructions or products referred to in the content. |
© 2023 by the authors. Licensee MDPI, Basel, Switzerland. This article is an open access article distributed under the terms and conditions of the Creative Commons Attribution (CC BY) license (https://creativecommons.org/licenses/by/4.0/).
Share and Cite
Rozon, F.; McGregor, C.; Owen, M. Long-Term Forecasting Framework for Renewable Energy Technologies’ Installed Capacity and Costs for 2050. Energies 2023, 16, 6874. https://doi.org/10.3390/en16196874
Rozon F, McGregor C, Owen M. Long-Term Forecasting Framework for Renewable Energy Technologies’ Installed Capacity and Costs for 2050. Energies. 2023; 16(19):6874. https://doi.org/10.3390/en16196874
Chicago/Turabian StyleRozon, Francois, Craig McGregor, and Michael Owen. 2023. "Long-Term Forecasting Framework for Renewable Energy Technologies’ Installed Capacity and Costs for 2050" Energies 16, no. 19: 6874. https://doi.org/10.3390/en16196874
APA StyleRozon, F., McGregor, C., & Owen, M. (2023). Long-Term Forecasting Framework for Renewable Energy Technologies’ Installed Capacity and Costs for 2050. Energies, 16(19), 6874. https://doi.org/10.3390/en16196874