Article

Prediction of Battery Return Volumes for 3R: Remanufacturing, Reuse, and Recycling

Chair of Production Engineering of E-Mobility Components, RWTH Aachen University, 52074 Aachen, Germany
*
Author to whom correspondence should be addressed.
Energies 2023, 16(19), 6873; https://doi.org/10.3390/en16196873
Submission received: 16 August 2023 / Revised: 25 September 2023 / Accepted: 27 September 2023 / Published: 28 September 2023
(This article belongs to the Section D2: Electrochem: Batteries, Fuel Cells, Capacitors)

Abstract

:
Life cycle strategies for traction batteries, such as remanufacturing, reuse, and recycling of retired automotive lithium-ion batteries (LIBs), have received growing attention, as large volumes of LIBs will retire in the near future and the demand for LIBs continues to grow. At the same time, the relevance of the sustainability of a battery system over its entire life cycle is increasing as factors such as the EU Battery Regulation provide greater market and product transparency. As a result, research and industry require forecasts in order to assess the future market situation and to make well-founded decisions. Therefore, this paper provides forecasts of the return volumes of battery systems from BEVs and PHEVs up to 2035. Additionally, a representative European battery pack for PHEVs and BEVs was evaluated for each year since 2013, based on the ten vehicles with the largest market share in each year until 2021. In addition, the battery return streams are divided into three different 3R strategies based on expert interviews in order to evaluate the upcoming workload in these areas. The term “3R” refers to the sum of the currently existing pathways around reuse, remanufacturing, and recycling. In 2030, about 38.8 GWh will return and enter the recycling process annually. For battery reuse, about 13 GWh will return every year from 2030 onwards, ready to be used in stationary storage for energy transition. Compared to this, battery remanufacturing is expected to be supplied with a slightly lower volume of approximately 11 GWh per year.

1. Introduction

Lithium-ion batteries (LIBs) have proven to be increasingly popular and are the solution of choice for many business models and companies around the world. The regulations and incentives for phasing out the internal combustion engine observed in recent years are unprecedented [1]. Vehicles powered by electrical energy, more specifically by batteries (i.e., battery electric vehicle [BEV], plug-in hybrid electric vehicle [PHEV], hybrid electric vehicle [HEV]), have seen a tremendous increase in the past few years, especially for passenger vehicles in Germany. As of 2022, the total electric vehicles in circulation have reached over 4 million, about 1 million in the European Union [2]. Battery-powered vehicles are now trending towards becoming the predominant choice, supported by consumers as well as subsidized by governments.
Having a major role in energy storage systems, LIBs, along with green electricity, are the major “actors” contributing to the paradigm shift from fossil fuel power to clean energy. LIBs are well known for their high gravimetric and volumetric energy density, which play an important role in vehicle design in terms of weight, drivetrain design, and the vehicle’s overall space utilization. Furthermore, there are several factors that are required for LIBs to fully replace fossil fuels. Therefore, electric vehicles (EVs) must be equivalent or even more competitive in terms of performance, cost, service life, refueling/charging time, as well as sustainability. The aforementioned conditions are needed to ensure a large market penetration, which is also a prerequisite for the so-called circular economy [3].
Resources are limited. Thus, the sustainability of LIBs technology can be optimized, and the production cost of battery-dependent systems can be offset by following a circular economy model. The German governing body first announced the “Batteriegesetz” (Battery Act) in 2009 pertaining to this [4,5]. The Battery Act dictates, among many other topics, the recycling efficiency of batteries. LIBs require valuable substances for their active materials, of which the rapid change in supply and demand for lithium, cobalt, and nickel (for NMC batteries) is one famous example of how energy cost can be substantially less affordable in a short period of time [6,7]. Bloomberg’s report on the market of LIBs suggests that EUR 135 per kWh is the price expected on pack level for the automotive industry in 2022 [8]. By using the total cost of ownership method, Liu et al. pointed out that when compared with an equivalent internal combustion engine vehicle, battery electric vehicles are expected to reach cost parity from 11 to 14 years of ownership [9]. All the evidence above pointed to the need for a circular economy where the importance lies in sustainability and the complete utilization of the LIB’s potential in its life cycle.
By dividing second-life batteries into reuse and remanufacturing, alongside recycling, this paper employs the use of “3R”, a term coined in previous works [10], to address the semantics within the circular economy rhetoric [11]. We aim to highlight our results in congruence with second-life applications and recycling, which further gives insight into the tangible approaches (reuse, remanufacturing, and recycling) in the related industry and market. Electric vehicle battery offers big opportunities for maximizing the economic value of lithium-ion battery [12]. The economic benefits can only be realized when more research and development efforts are made. This paper focuses on bridging the gap of knowledge by presenting the value proposition through economy of scale and providing an incentive for further development in this field. Examples of this can be drawn from preexisting research. Second-life batteries in an energy storage system (ESS) lie at the heart of its use cases. Zhu et al. [13] presented an economic calculation for the total cost saving of second-life batteries compared with lead-acid batteries for backup power in communication base stations in China. When coupled with solar energy, the paper showed a ~50% total cost savings with the purchase price for second-life batteries at 140 EUR/kWh (after remanufacturing) for units having 1000 equivalent full cycles remaining. It is worth noting that choosing the correct use cases is part of the equation for the success of second-life applications. Within this model, second-life applications and recycling depend on the amount of returning batteries that are expected for electric vehicle fleets. In order to plan and implement appropriate strategies for a circular economy and to gain insight into the market, the number of batteries leaving the first-life application cycle needs to be estimated and forecasted for the upcoming years, which is the main objective of this paper. This can potentially lay the groundwork for many feasibility studies that can help us prepare the logistics and infrastructure for the business models of the future.
We have decided to divide this paper into four main sections: “Weibull distribution-based failure rate for LIBs in commercial vehicles” (Section 2), “Results: Forecast of battery return volumes” (Section 3), “Battery circular economy and 3R strategies” (Section 4), and finally “Discussion” (Section 5). The knowledge given within the scope of this study will provide an overall grasp of the contemporary circular economy for LIBs seen from a reliability engineering point of view.

2. Weibull Distribution-Based Failure Rate for LIBs in Commercial Vehicles

2.1. Failure Rate

In the field of maintenance, “failure” can be defined as the inability of an item to perform the function that it was required to do (definition according to DIN 13306:2018-02). Furthermore, degradation of an item can be defined as a “detrimental change in physical condition, with time, use or due to external cause.” Ref. [10] LIB aging can be understood as analogous to the definition of degradation, which will be demonstrated hereafter—starting off with the closely related concept, the failure rate, which can be used to indicate the reliability of a system, factoring in its failure and aging characteristics. In general, there are three separate phases and six typical progressions for the failure rate that are archetypal during the operational life of a system (Figure 1). This classification was first developed in the aerospace industry and summarized by Moubray [11]. There are three types of failure into which the above phases can be divided:
  • Early failures are characterized by errors in the design and production process owing to the manufacturer or errors in the process of assembly and manual settings. These failures tend to be high at the lifetime beginning but then decrease over time.
  • Random failures are known for their sudden shutdown and error due to causes that are subjective (organizational problems, operator error, faulty maintenance), stress-related (temporary variation in stress exceeding component strength), and stochastic. This is not related to the aging of the component and is largely unpredictable.
  • Aging failures are present when the failure during this period is caused by the deteriorating condition of the component in proportion to its age.
These three types of failures in classical reliability engineering can be further described in the case of the LIB. Early failures of LIBs include problems during production, inadequate quality control, assembly mistakes, etc. Random failures can occur during the operation of the LIB in an EV by means of loose wire connections and the effects of extreme working conditions (environment, unsuitable use cases). Lastly, aging failures of batteries are considered more closely in this section, whereby the effect stemming from the aging of LIB contributing to the aging of the battery pack will be looked at in greater depth because this is an area where we expect a continuous increase of failure rate.

2.2. Faults of Lithium-Ion Battery Systems

Considering a holistic view of an electric vehicle led researchers to look at the battery system and how its hardware and software components fail. Figure 2 shows the battery system decomposition and possible fault types.
Battery systems can be decoupled into three parts, including sensors, batteries, and actuators, where each of the parts is subjected to different types of faults and noise [13]. With this categorization, the fault diagnosis research of battery systems can also mainly focus on these three aspects. Battery faults are abnormal (not intended) behaviors of the storage system. Faults lead to reduced performance and safety of the system. Table 1 summarizes the different faults related to these three interconnected blocks.

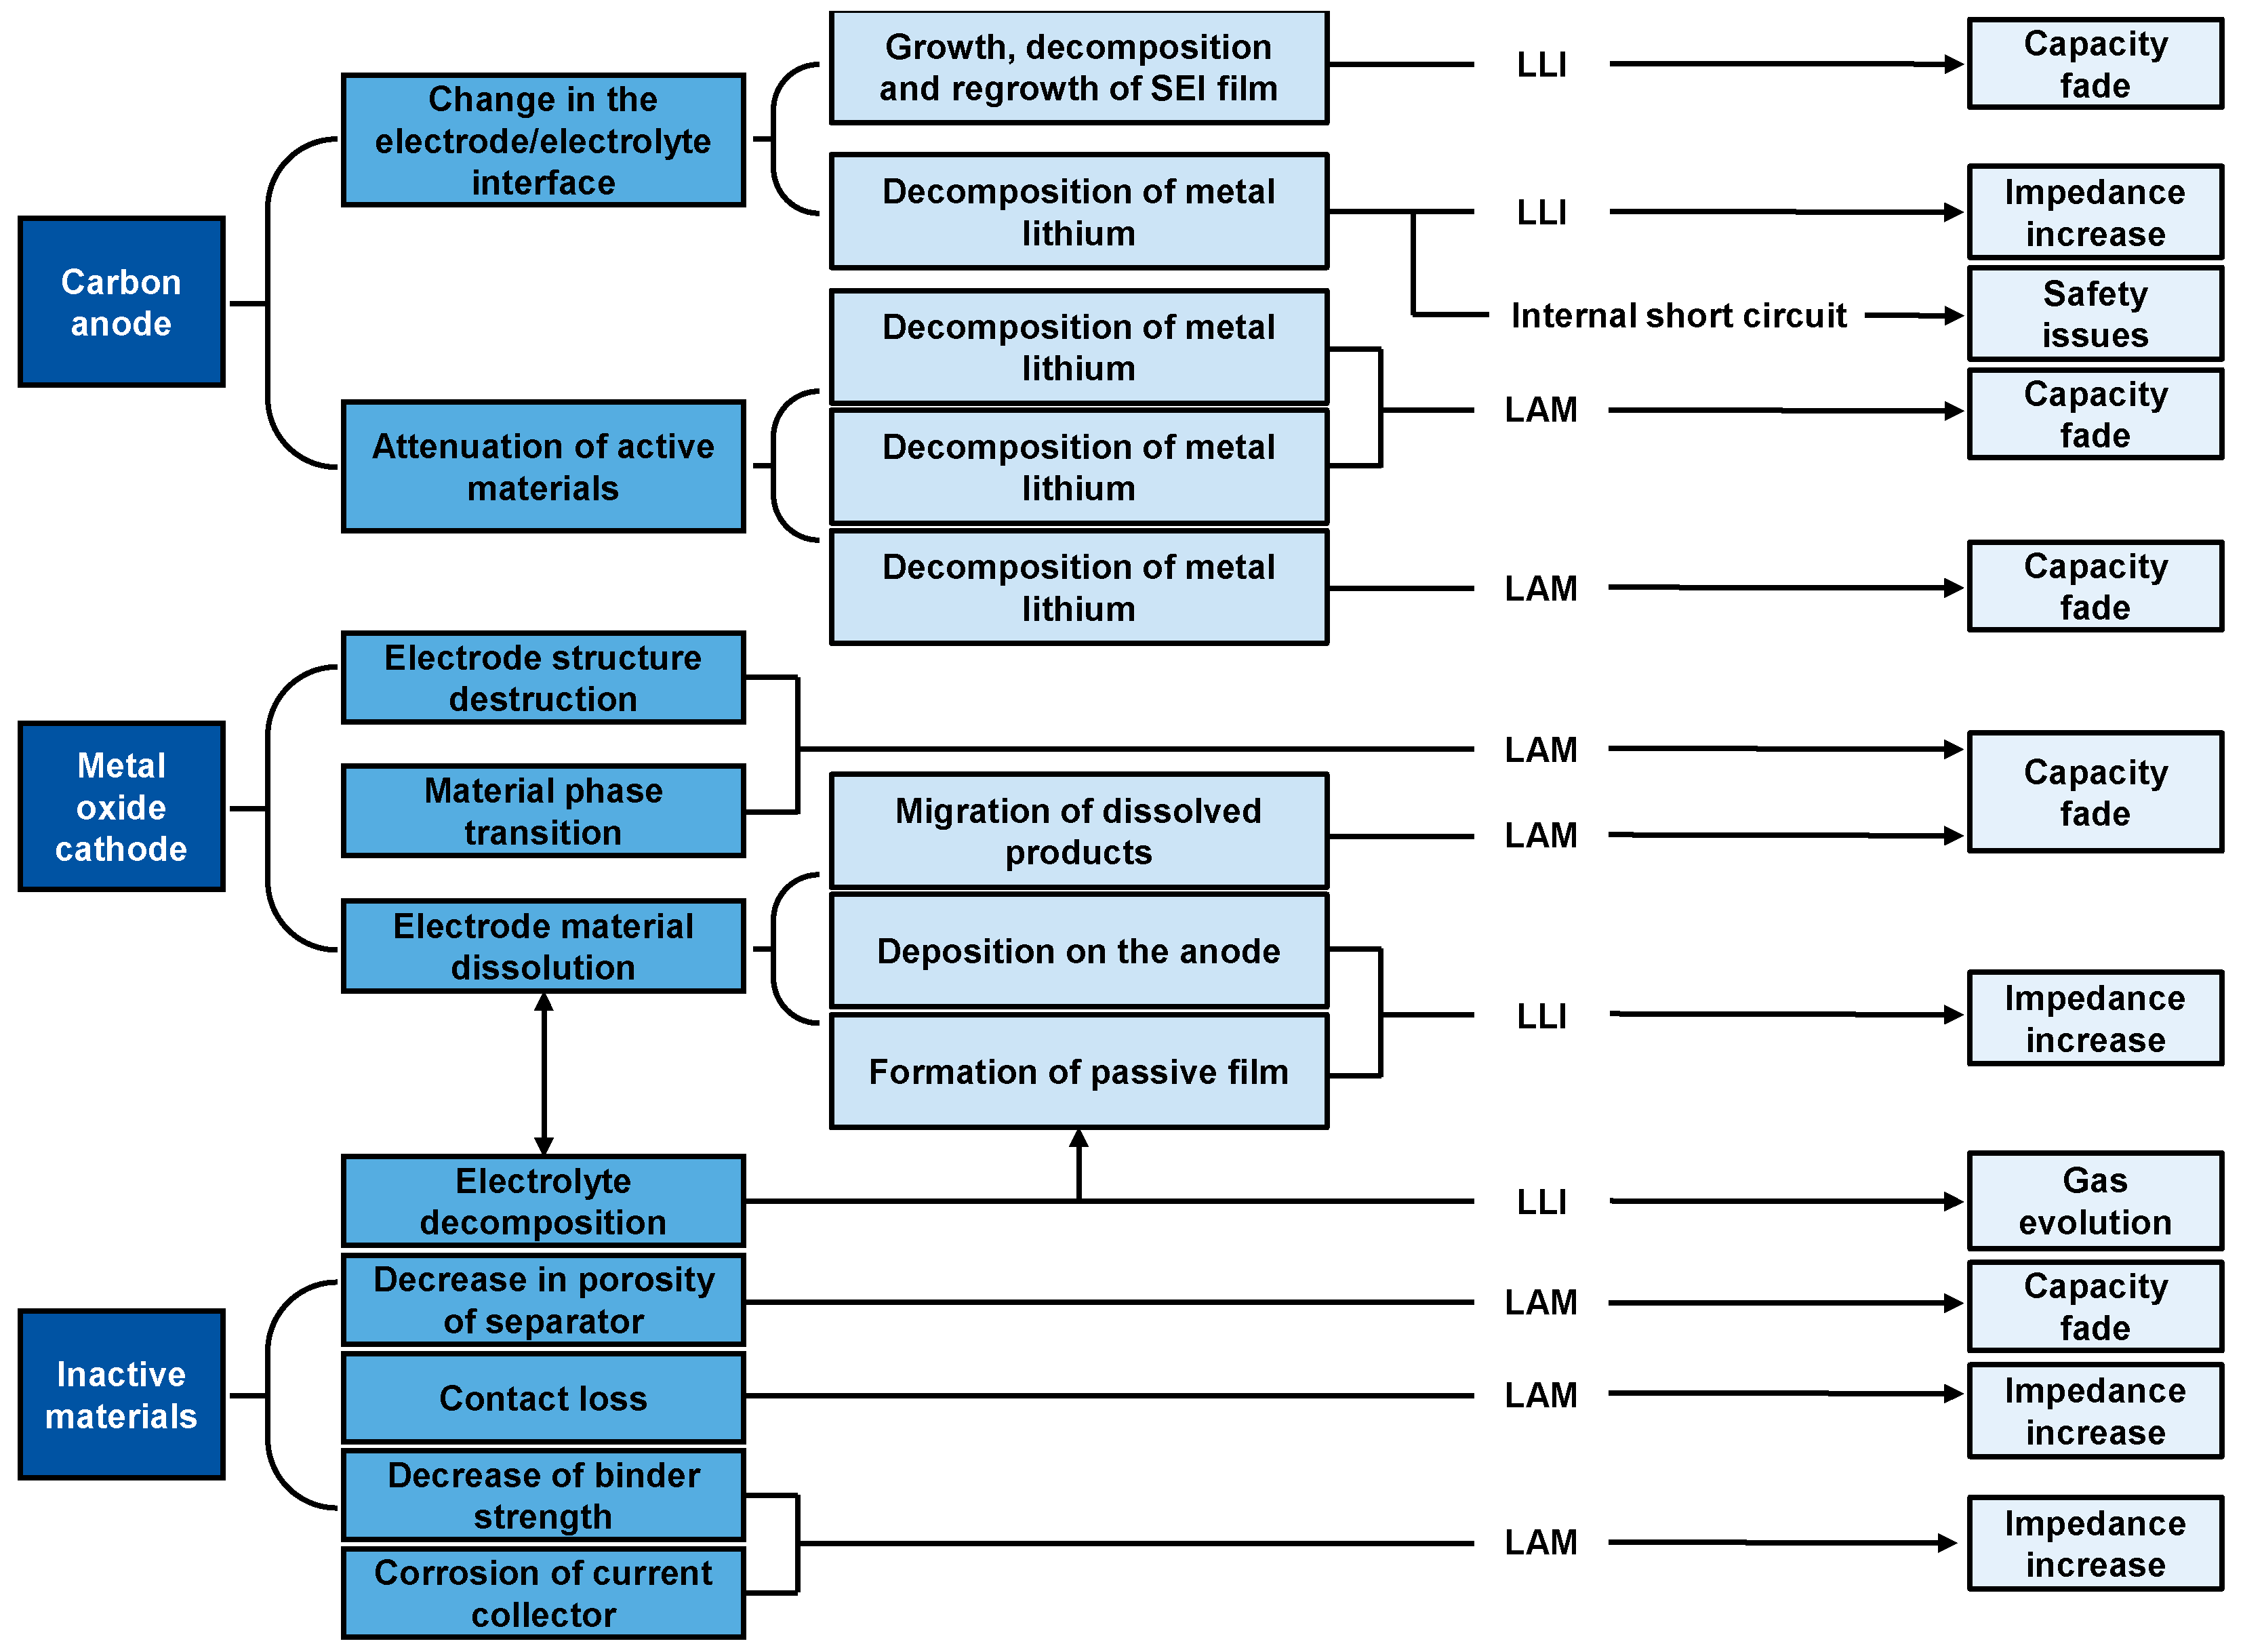
2.3. Overview of Aging Mechanisms for Battery Cells and Systems

LIB cell aging involves mainly impedance growth and capacity loss [14], which relate directly to the performance of the electric vehicle [15]. Many efforts have been devoted to the understanding of battery aging through capacity loss. The capacity loss of the cell can be caused by any of the following degradation modes. There are two commonly reported degradation modes [16], which are loss of lithium inventory (LLI) and loss of active material (LAM) on both the positive and negative electrodes. Figure 3 provides an overview of degradation modes that contribute to capacity fade and impedance increase in LIBs.
A major challenge for LIBs is that different operating conditions and load profiles create individual life cycles that greatly affect the aging of a lithium-ion cell. Due to this, the aging of each LIB cell within a battery pack differs from one another, which then leads to internal inconsistency between the battery cells within one module or pack. This inconsistency is reflected by the parameters of the cells, among which five parameters stood out and are frequently investigated in the literature [18]. Those are initial SOC, SOH, capacity ration, ohmic resistance, and rate capability. Dubarry et al. [18] have shown in their study that the effects of the so-called cell-to-cell variation have an evident impact on the battery pack performance and that this is also cell chemistry-dependent (e.g., NCA, LMO, LFP, etc.)—interestingly only in series-connected batteries. The same conclusion has been found in multiple studies, which pointed out that series-connected cells suffer from the effects of cell-to-cell variation, whereas parallel-connected cells show little to no effects due to the self-balancing capability of the topology [18,19,20,21]. Thus, in a battery pack configuration, m P n S ( m and n being the number of parallel- and series-connected cells respectively) is preferred in automotive applications because of the tolerance towards the effects of single cell failure while still being able to optimize output energy and power such as the n S m P topology [18].
As seen in Table 1, inconsistency in battery cells is one of the many faults that a battery pack may suffer from. The cause of cell-to-cell variation can be traced back to different reasons. Some commonly discussed are the mixing of unmatched cells showing cell-to-cell variations in capacity and impedance, uneven or defective cell contacts, ineffective cooling strategy or external heat source next to the battery module, and battery module errors [22,23]. Cell-to-cell variation can directly affect the capacity of the battery pack. Figure 4 elaborates on this direct relationship between cell capacity and battery pack to show how the capacity of the pack reduces as a result of inconsistent capacities in series-connected cells (or similarly in series-connected modules).
The relationship between cell capacities and pack capacity is given by the sum of the minimum dischargeable electric quantity (cell B, second term) and the minimum chargeable electric quantity (cell A, first term) [15,24]:
C p a c k = min S O C · C | A + min ( 1 S O C · C ) | B
where C p a c k is the pack capacity and S O C [%] and C are the state of charge and capacity vectors (consisting of each cell in the pack). Figure 4 illustrates this cell-to-cell variation effect (also known as the “barrel effect”). Cell A represents the cell with the lowest chargeable electric quantity, while cell B has the lowest dischargeable electric quantity. The line of equal chargeable electric quantity is parallel to the line of fully charged state (100% SOC), and the line of equal dischargeable electric quantity is parallel to the capacity. In turn, the capacity and SOC of the battery pack are the intersection of these two cells that represent the extremes on the electric quantity axis. In conclusion, the battery pack capacity and electric quantity are limited by the two cells, one of which is with the minimum dischargeable and the other with minimum chargeable electric quantity.
Although the equalization capability of the battery management system is capable of reducing the barrel effect and optimizing battery pack capacity, there are limitations in achieving the most effective remedy to cell inconsistency. Lv et al. [25] show results for a SOC equalization strategy with a hybrid approach (passive and active equalization circuit) of series-connected topology during charging and discharging and were ultimately able to achieve the most effective result. Nonetheless, this result still ends up with an inconsistency range from ~8–10%, which is a significant amount in range performance reduction of larger battery packs.

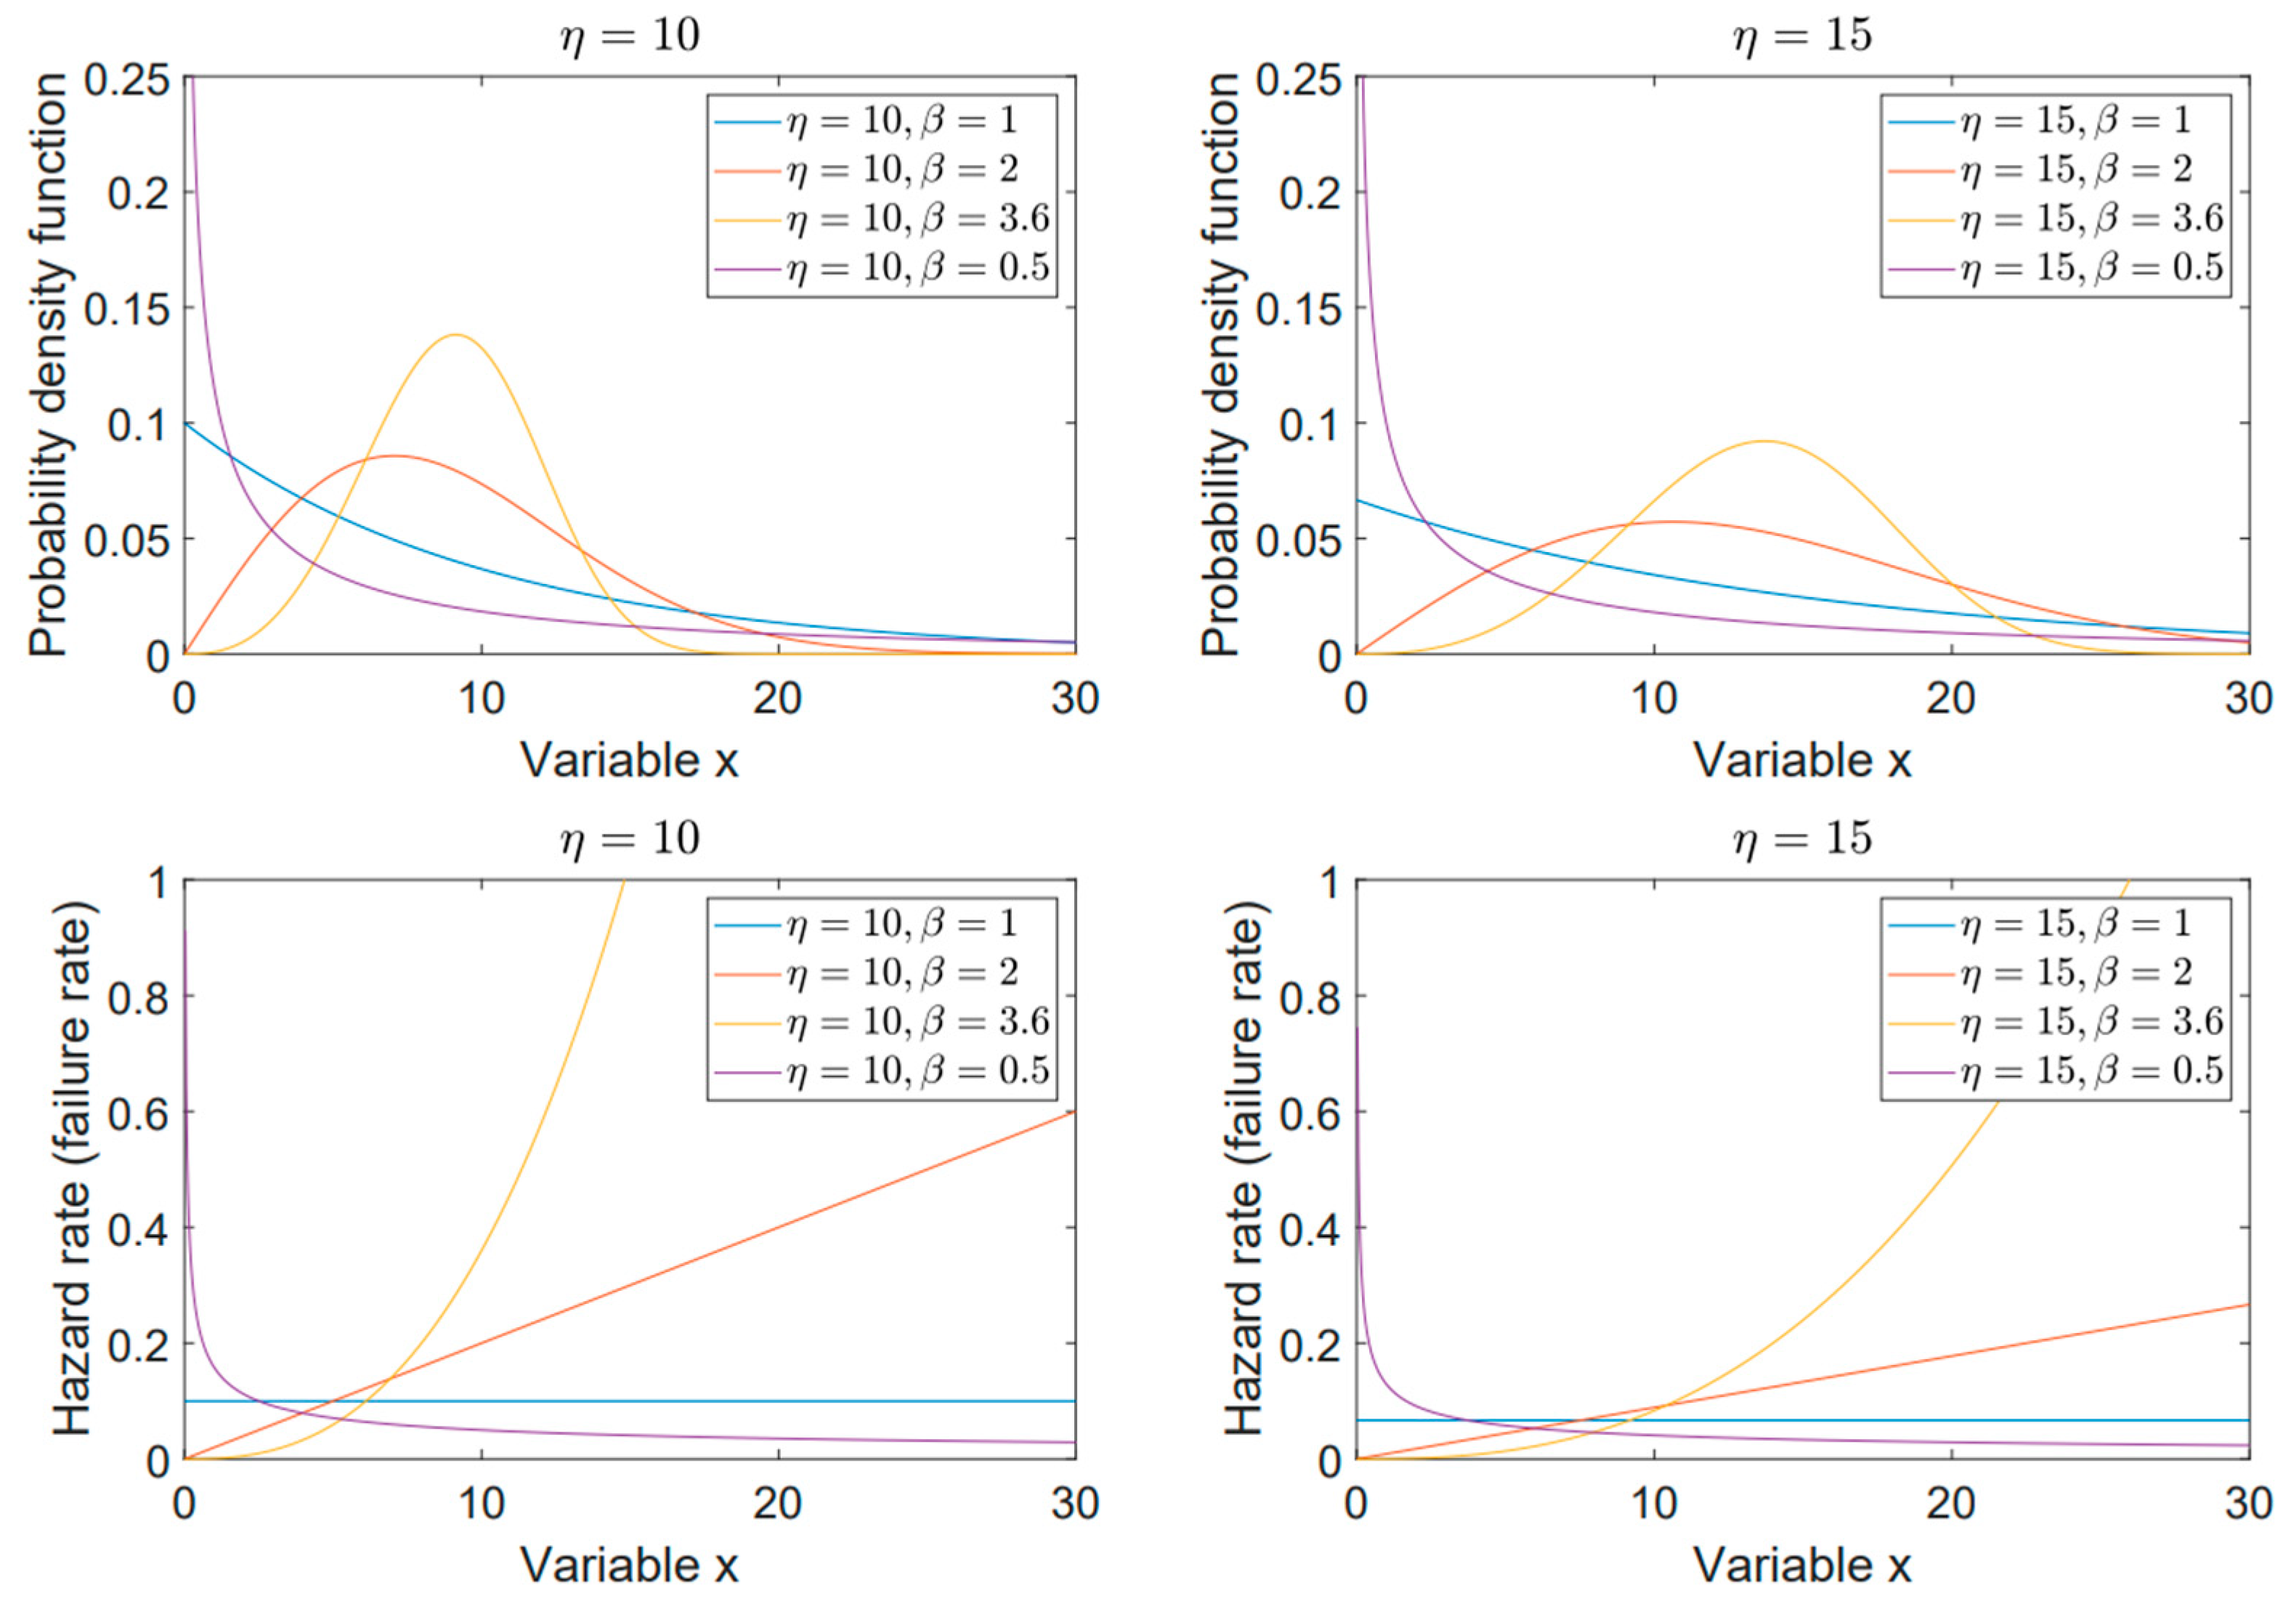
2.4. Weibull Function and Its Relation to Battery Failure Prediction

Waloddi Weibull laid the basis for his Weibull distribution in 1939 and subsequently also expanded it considerably in his much-cited 1951 paper [26]. The Weibull distribution was originally used to describe the strength of materials in relation to the weakest link theory [27]. The Weibull distribution is adopted in a variety of fields, such as material science, engineering, physics, chemistry, medicine, economics, etcetera [28,29,30]. From an engineering point of view, more specifically in reliability analysis, the Weibull distribution is standard when describing failure patterns, an example being the bathtub curve [11]. Analogous to the weakest link theory, capacity fades in LIBs follows a similar behavior whereby the battery unit with borderline characteristics causes the most trouble. In the literature, this is often dubbed the “wooden barrel effect” [31]. When LIBs are considered, the Weibull distribution takes into consideration all different use cases and conditions as unique cases, thus creating many possible solutions for the estimation of failure rate. This has been reported by Barré et al. to decrease the accuracy of prediction when it comes to modeling LIB aging. Similarly, the same applies to other estimation methods, such as electrochemical models and equivalent circuit models [32]. This is due to the non-linear dynamic systems found in EV applications as well as the factors at play for different electrochemical combinations. Nevertheless, the Weibull distribution is a popular distribution used for LIBs in reliability engineering [33], alongside the lognormal, inverse Gaussian and normal distribution [34,35].
It is prudent to point out that implementing battery aging models and predicting failure times can also be performed by using various strategies, i.e., machine learning and health indicators, and there are multiple ways to classify these strategies [36]. Considering the modeling failure time, the Weibull distribution falls into the empirical modeling method, as opposed to theory-based modeling [37], which, to a larger extent, depends on the aging mechanisms and behaviors to create the model [38]. When talking about maintenance and reliability theory, LIBs in EV applications, for the most part, are non-repairable. Blischke and Murthy [38] made a clear distinction between these two concepts and elaborate solutions, as well as their role in modeling different failures. Within this dichotomy, continuous Weibull distribution falls into the category of modeling first failure for non-repairable systems based on a “black box” characterization (without direct consideration of failure mechanisms) for the dynamic case, whereby the probability of failure at timestamp X without initial manufacturing defects P ( X < 0 ) 0 . Without going into many extensions and modifications within the Weibull family, the continuous Weibull distribution can be classified into two types: two-parameter Weibull and three-parameter Weibull distributions [29], with the three-parameter Weibull being the extended distribution of the aforementioned model with a location parameter (shift parameter) [38]. For the two-parameter Weibull distribution, the Weibull probability density function (PDF) is defined as [33,38]:
f x , θ = β η β x β 1 e ( x η ) β f o r   ( x 0 )   0   f o r   ( x < 0 )
Pertain here is x 0 , parameter set θ = { β , η } , with β > 0 and η > 0 . In the case of reliability of LIBs, x is the number of charge/discharge cycles [39]. The Weibull PDF shows the fraction of cells in the population that fail at time x .
The reliability function (survival function) is defined as the fraction of cells that survived until time x . Hazard function (failure rate) is the fraction of cells that survived until—but failed during—time x . These functions are given respectively:
S x , θ = 1 F x , θ = e ( x η ) β
and
                h x , θ = f x , θ S x , θ = β x β 1 η β
β is the shape parameter, and η is the scale parameter, which indicates the time x at which 63.2% of the population would have failed. Table 2 shows how β can be interpreted in terms of the three types of failure introduced in Figure 1. Moreover, the mean time between failures (MTTF) μ is calculated with the following equation:
μ = η Γ ( 1 β + 1 )
MTTF can also be calculated with μ = 1 / λ when we have a constant hazard rate (random failure) with λ denoted for constant hazard rate.
Among other methods, the most common testing approaches to calculate shape parameters and scale parameters are the median rank regression (MRR), maximum likelihood technique, Chi-squared test, Anderson–Darling adjustments, and Kolmogorov–Smirnov model test. Figure 5 shows the influence of scale and shape parameter for Weibull distribution, where one can interpret the parameter as follows: Adjusting the scale parameter, in this case, shifts the “visible hump” to this value and also “delays”/“accelerates” the increase or decrease of hazard rate for higher values depending on if β > 1 or β < 1 , respectively (vice versa for smaller values of scale parameter). As described in Table 2, adjusting the shape parameter will result in different effects.

2.5. Weibull Parameter Selection

The Weibull distribution has been recognized in various publications for its versatility and applicability in fitting aging data of LIBs [40,41]. According to Harris et al., arguments have been made in favor of the two-parameter Weibull distribution compared with the extended counterpart. Three-parameter Weibull has been shown to be biased towards recorded data, which resulted in an unlikely estimation of LIB aging behavior. When dealing with failure time models, it is important to consider the risk of overfitting the recorded data. This undermines other scenarios with different conditions [39]. Despite the “black box” approach, due to the innate characteristic of its mathematical parameters, the Weibull distribution has been shown to exhibit patterns that may lead to predictions of different failure mechanisms. This leads to the use of a so-called mixed Weibull distribution that directly targets various aging mechanisms of lithium-ion cells [42] to create better data fitting for LIBs and can be similarly used for failure estimation on other subsystems [43] of a battery pack in EVs, such as interconnectors, BMS, etc.
The Weibull distribution has proven itself to be very adaptive to many LIB parameters, as various authors used it to approximate their aging data points with the aim of creating a repeatable estimation. Jiang et al. used data measured from a retired battery pack in China, and they then used Weibull and normal distribution to fit capacity and resistance data, respectively [44]. Chiodo et al. found in their accelerated test for an e-bus LIB module that the Weibull distribution also gives a good estimation for peak power and requested energy [45].
When it comes to the lifetime data of LIBs, there is a wide range of data sources that stem from different testing methods with different conditions and specifications of LIBs. The usual EOL threshold for first-application EV batteries is generally assumed as the point when the original capacity of the battery pack drops to 80%. Loss of usable energy is referred to as “capacity fade” [46]—though the capacity fade data, which has a direct relationship to the SOH of batteries, is not consistent across all the experiments, and early-measured capacity data show little predictive power for a remaining useful life (RUL) estimation [39].
Capacity fade data is usually plotted over time to show the SOH of LIBs. Table 3 shows an overview of datasets found in the literature and the associated parameter values of the Weibull distribution calculated within these studies. From these results, the corresponding time x can be observed to have taken the charging/discharging cycles as its unit. According to Table 3, the shape parameter and scale parameter have a value range between 3.55–11.17 and 144.20–1963.00 (equivalent full cycles, EFC), respectively. Merits could be found by deriving a pattern from these datasets because this can be used as a basis to recognize a more general fit with the Weibull distribution if this is the end goal of the investigation. Scale parameters calculated in these studies are assessed with charging/discharging cycles, where some results were obtained from applying accelerated degradation (e.g., with increased discharge rate). The last two datasets from the same investigation show inconsistency, which can be explained by the different active materials of the tested batteries. This shows the variability of results that can manifest itself given different conditions (here, the battery chemistry) and stresses cautiousness when fitting a distribution to recorded data. In all of the studies, different test procedures were used to find the parameter that best fit the data.
Harris et al. pointed out the inconsistency in capacity fade data and that it is rather uncommon to see any replication in the literature. Given this, they have also employed different threshold values (70–90%, 5% increment) and calculated Weibull parameters accordingly. The research group also had their aim set on the warranty data for the batteries instead of trying to predict the SOH or RUL. There has been precedence for the use of the Weibull distribution to set the warranty date for LIBs by calculating MTTF [44].
Table 3. Summary of papers using Weibull distribution with a threshold at 80% SOH (data type being capacity over cycle time. Parameters determined are β, shape parameter, and η, scale parameter (EFC).
ResearchCathode/AnodeTesting MethodParameters for Weibull
[39]LCO, graphite1C charge/
10C discharge,
24 pouch cells
β = 4.6
η = 515
[41]Unknown0.5A charge/
0.5A discharge,
12x pouch cells
β = 3.55
η = 1138
[34]NMC, graphiteVoltage-limited cycling w/4A 48x 18650-type β = 11.03  
η = 1187
[47]1P96S, ternary LIB (module)From BMS after 6 years
of usage
β = 3.606  
η = 1963
[40]LFP, graphite1A charge/
0.5A discharge,
96x 18650-type
β = 8.471  
η = 879
[48,49]LMO, graphite0.33C charge/1.5C discharge β = 5.75
η = 144.2
[48,49]LFO, graphite0.33C charge/1.5C discharge β = 11.17
η = 926.8
A reliable failure model for battery systems needs to be able to consider both aging-induced faults and random faults. As previously discussed, faults in a battery system cause performance reduction and safety issues related to the energy delivery aspects of an electric vehicle and can thus be used to calculate RUL. Typical battery systems in BEVs have been designed to introduce modularity in the battery system, meaning that cells are connected in a module, and modules subsequently are configured to form a battery pack. To provide context, Zhao et al. [47] carried out the analysis on the premise of an electric vehicle battery module. In this paper, the barrel effects of a 1P96S-configurated battery module were analyzed. The analysis was conducted to directly target the “inconsistency of cells/modules” fault that was named in Table 1. The results of the Weibull distribution, therefore, directly cater to this specific fault of the battery system, excluding other factors that may cause the decommission of an electric vehicle in the field.
Calculation of Weibull’s parameters can help to simulate the failure rate of the BEV fleet and predict the return battery flow for a circular economy model. For this study, a suitable parameter calculation from Zhao et al. [47] for the case of “inconsistency of cells/modules” was identified. Under the assumption that a European vehicle completes roughly one EFC every two days (drivers charge their vehicle three times a week on average), using the scale parameter from Zhao et al. [47] ( η = 1963   E F C s ) then translates to twelve years of operation:
η = 2.23   d a y s / E F C 365   d a y s / y e a r · 1963   E F C s = 12   y e a r s
The shape parameter is taken as β = 3.6 . We proceed to use these parameters in this paper due to some identifiable trends of BEVs. Figure 6 demonstrates what the failure rate of the Weibull distribution with these given parameter values would look like. At a 100% failure rate, there can no longer be any chance of survivors in the population, and thus, the failure rate is only considered for values under this threshold.

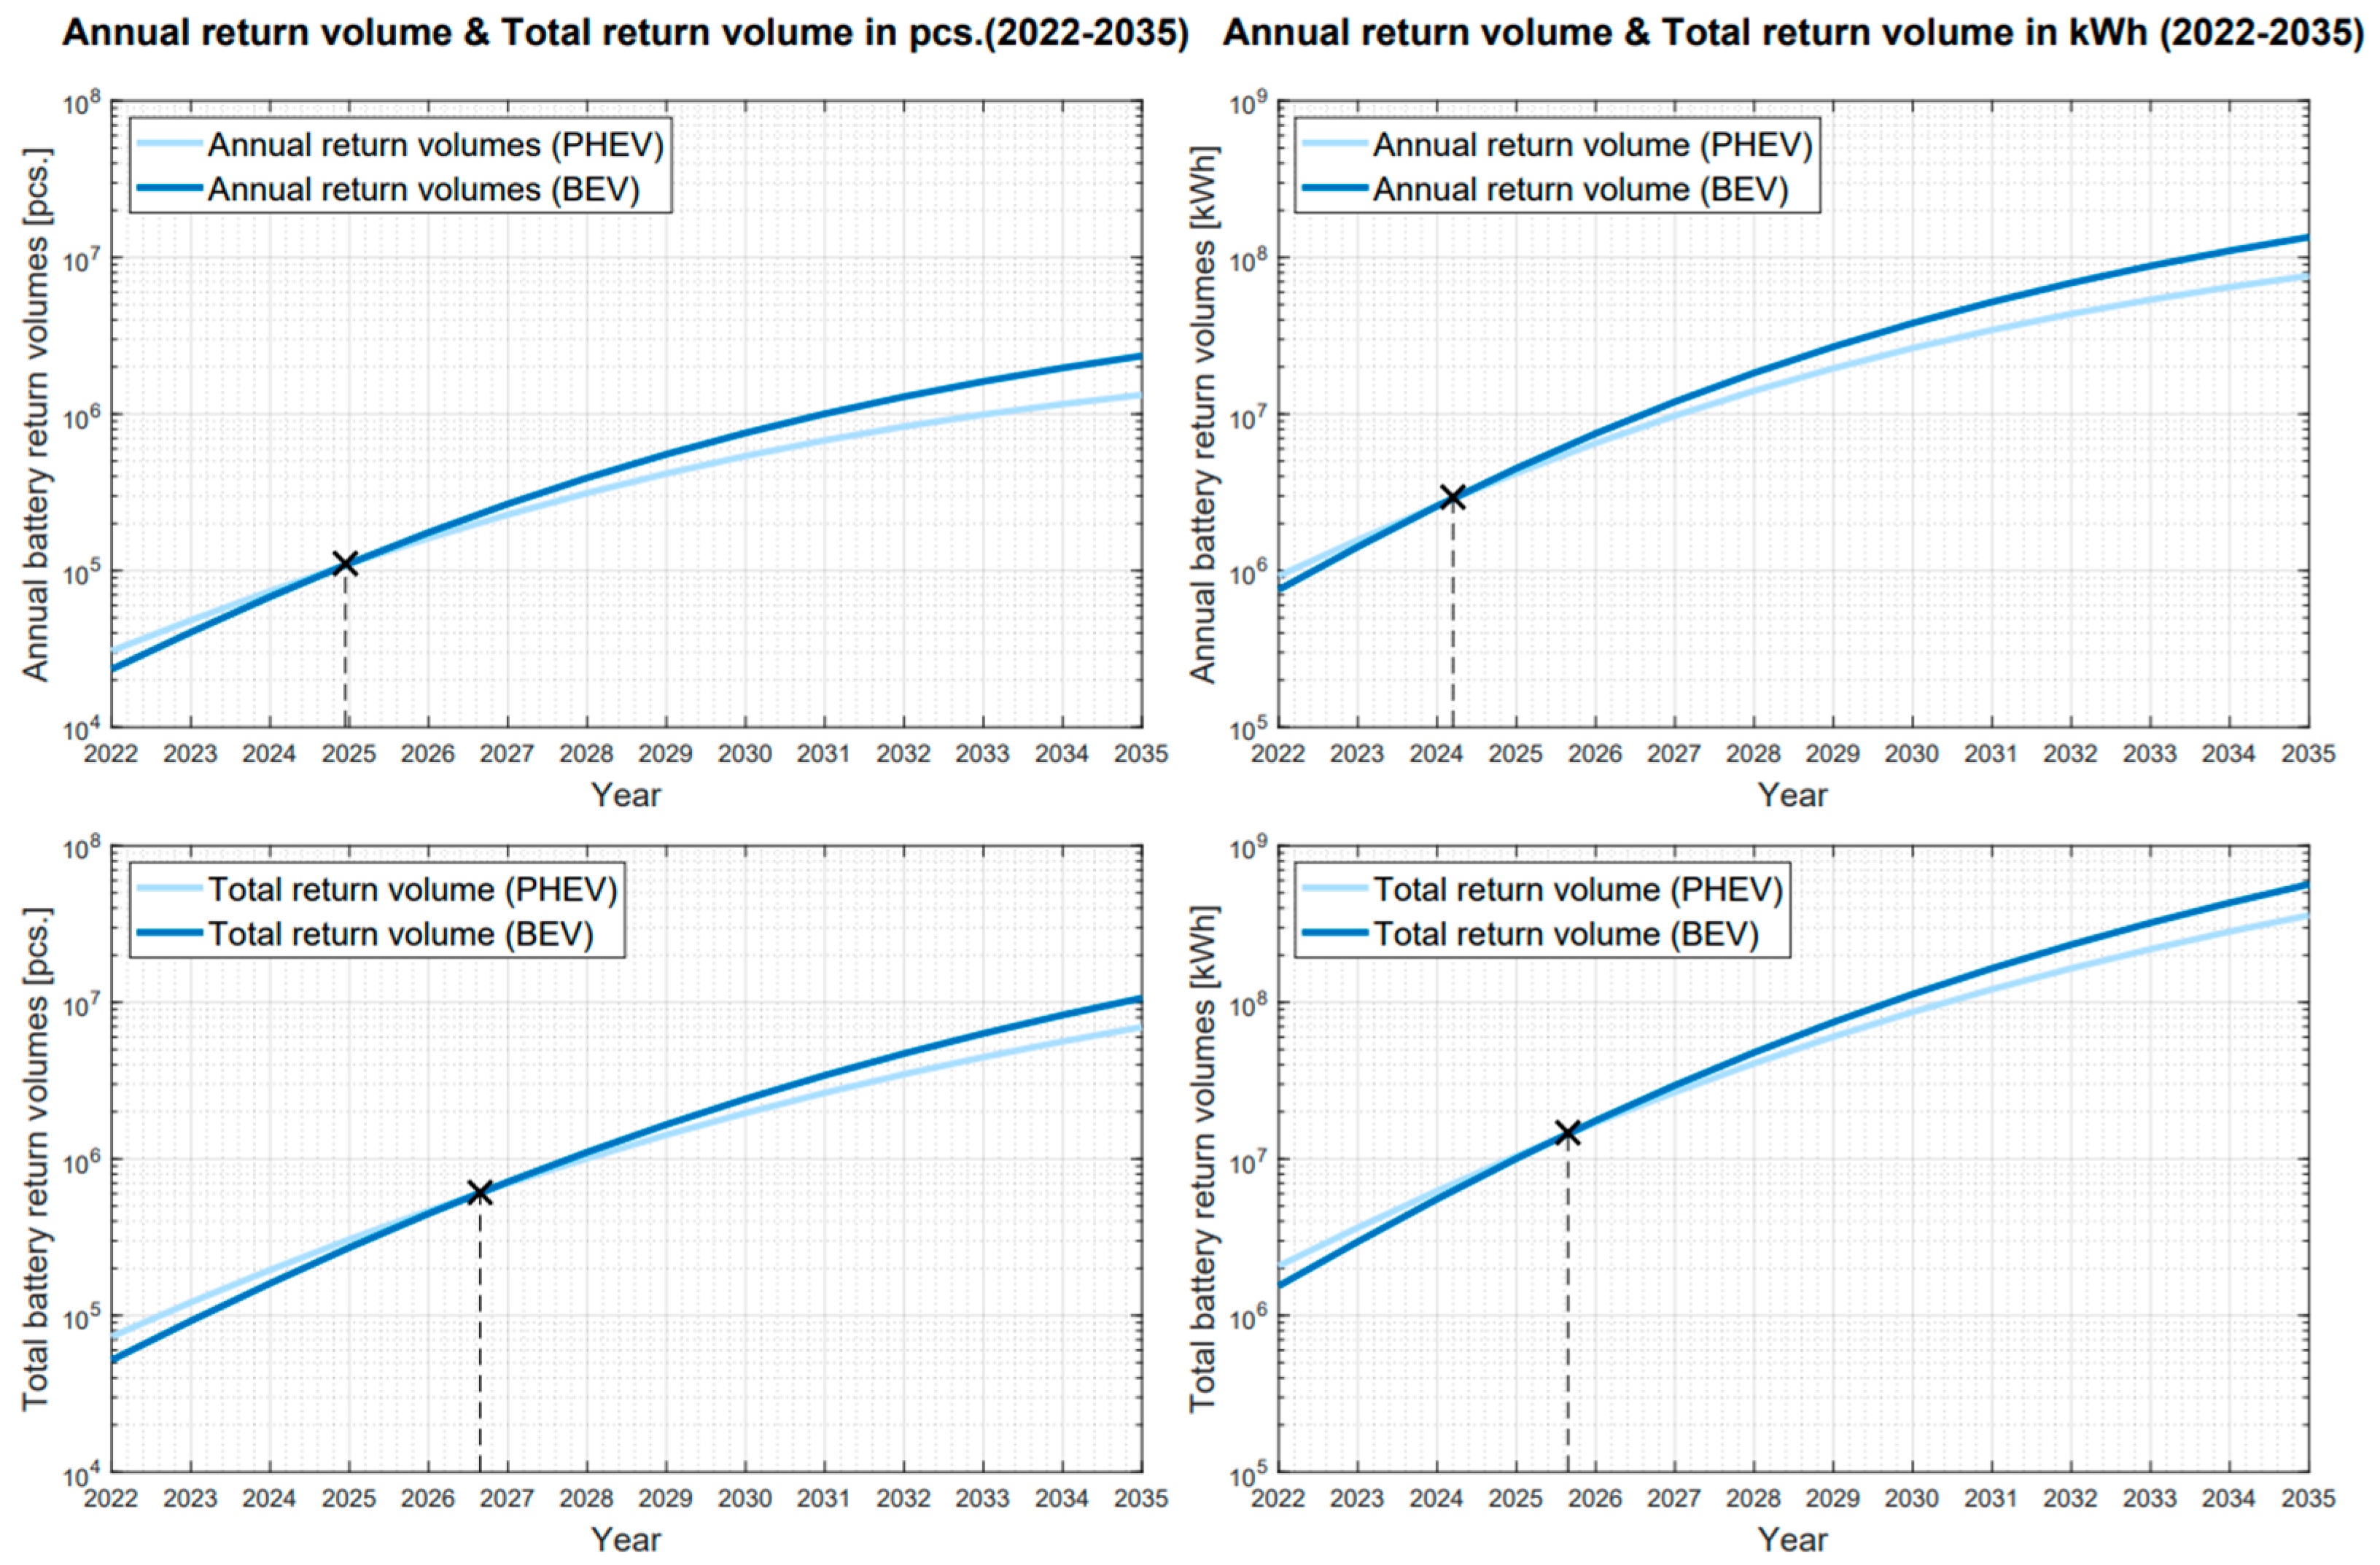
3. Results: Forecast of Battery Return Volumes

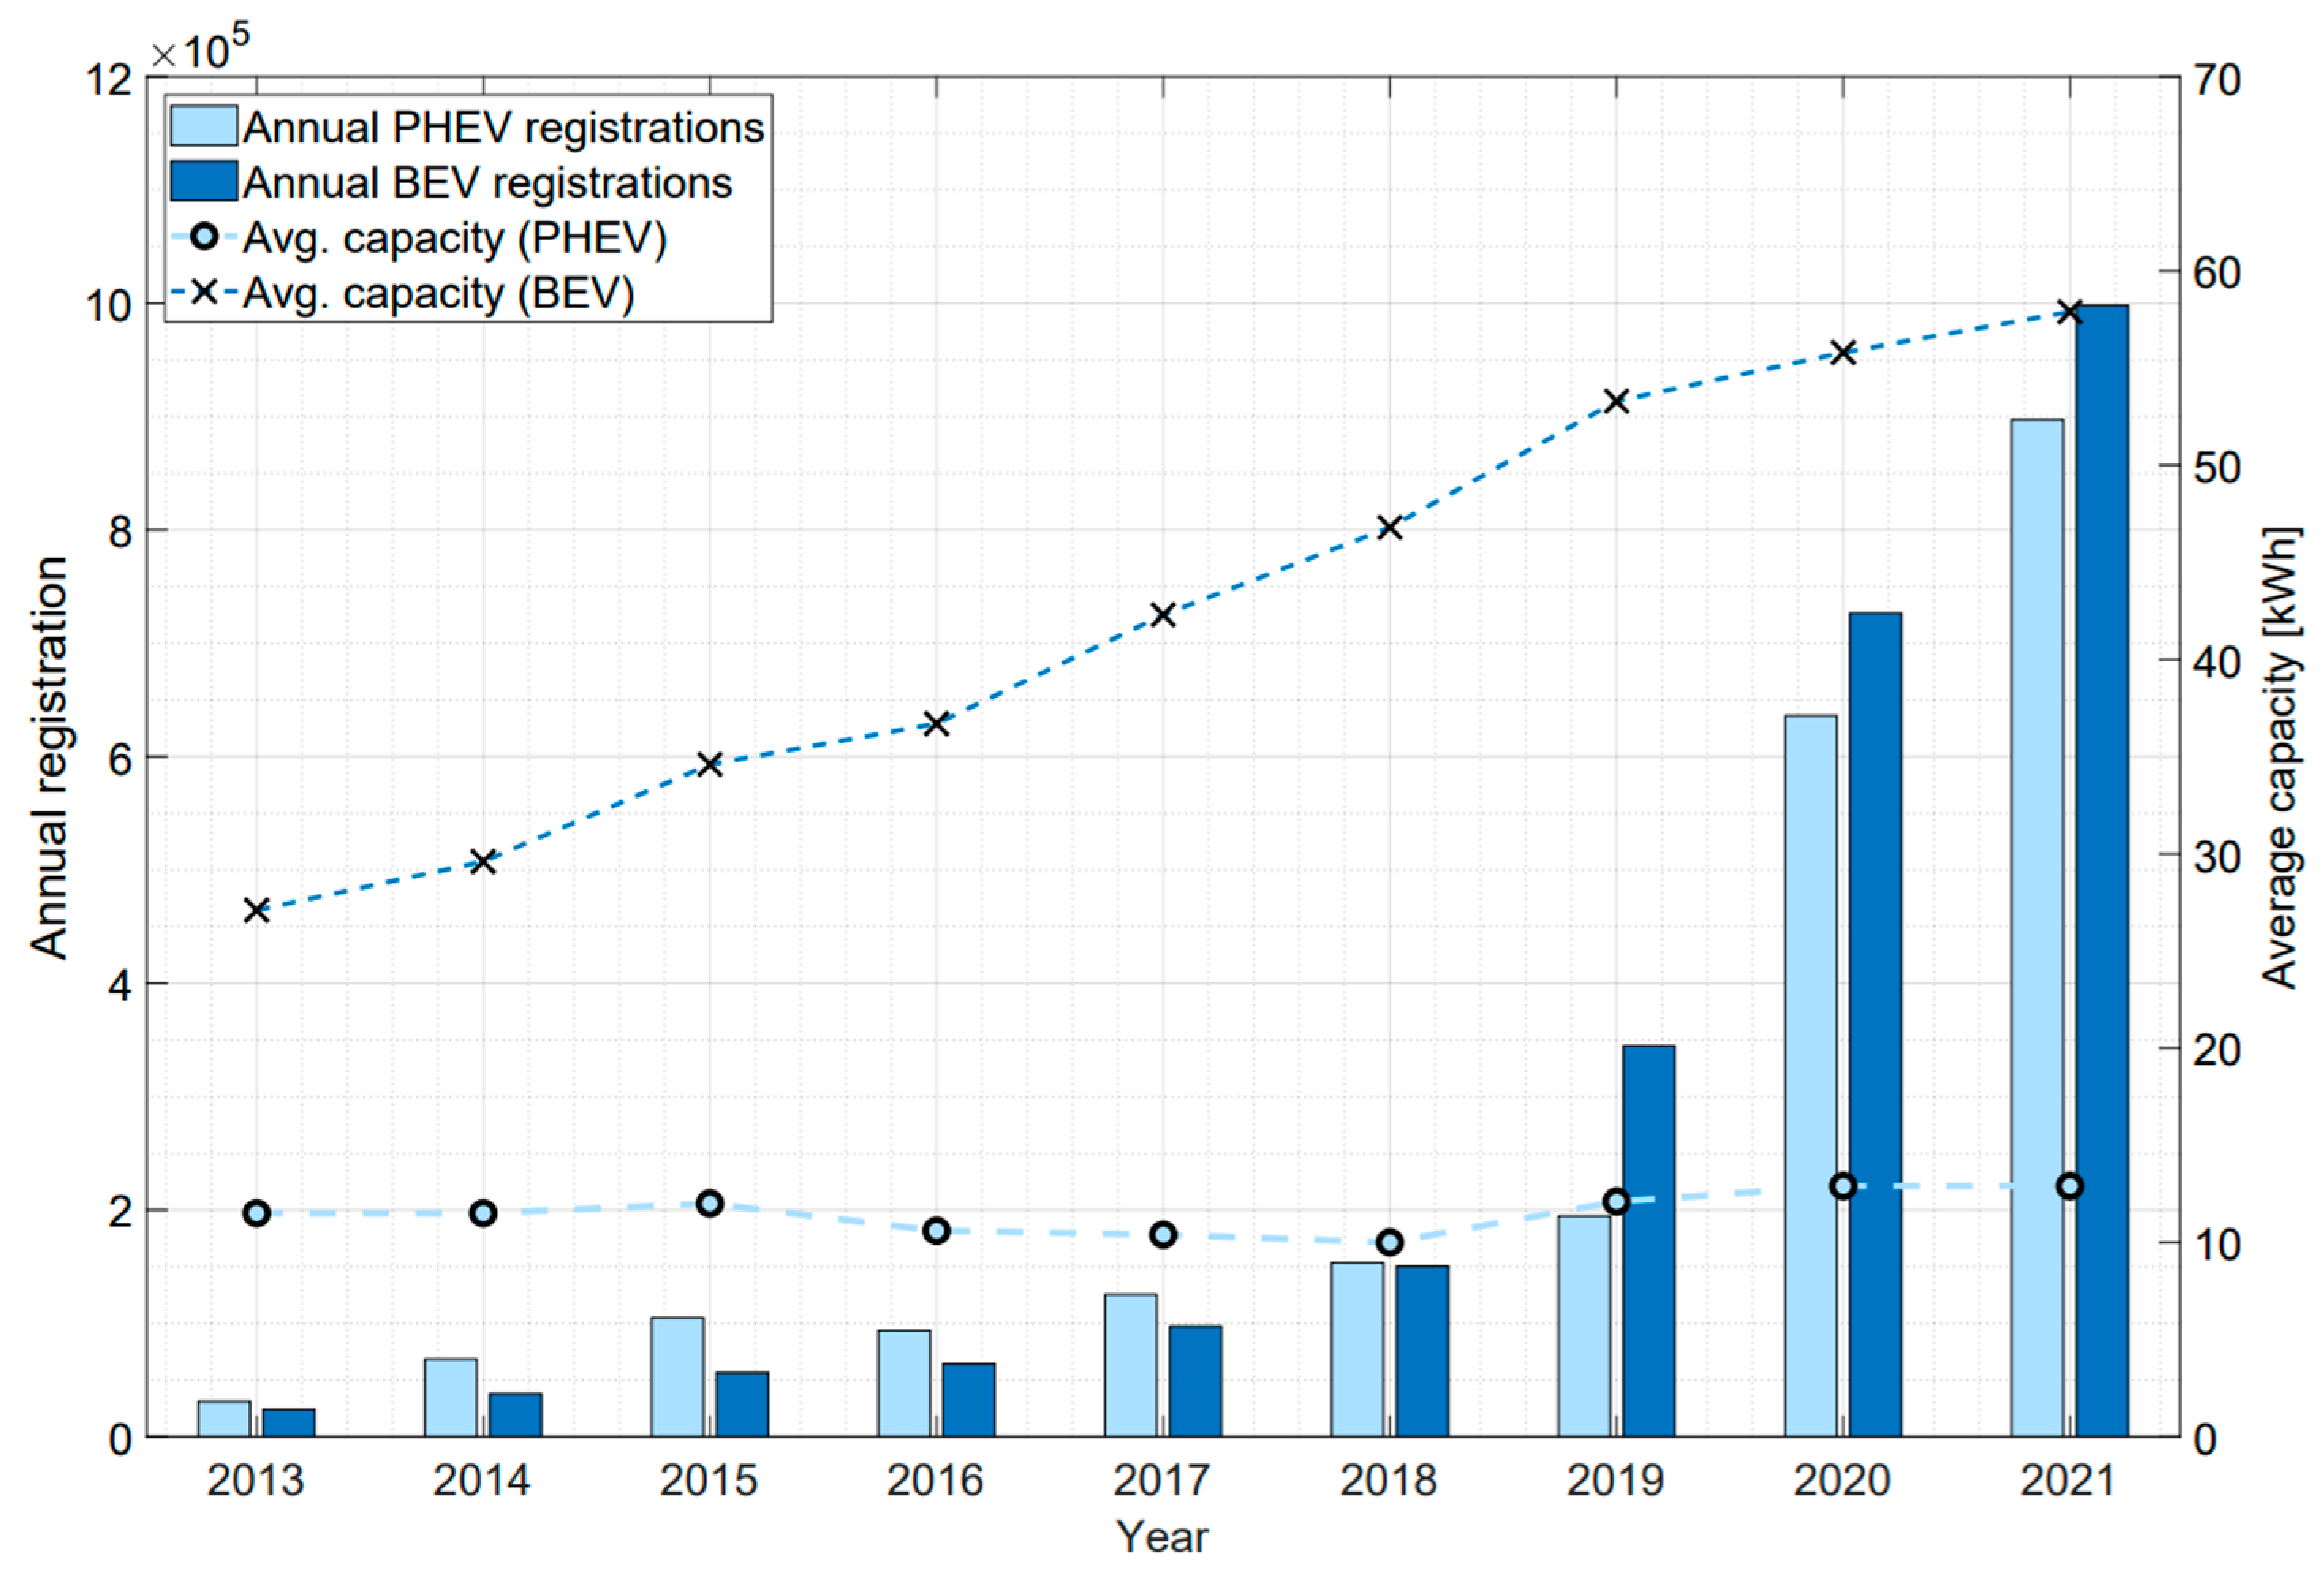
3.1. Battery Data Analytics

We proceed to provide and discuss a quantitative analysis of battery return quantities in the market and their capacitive equivalent in kilowatt-hours. Therefore, the derivation of the annual average values for batteries from fully electric and hybrid vehicles is necessary. These values are then combined with annual vehicle registrations in Europe for M1-type passenger vehicles [according to data from the European Environment Agency, EEA] and the Weibull parameter selected in the previous section to estimate future battery return volumes after first-life usage. Due to the increasing number of different vehicle models with hybrid and fully electric powertrains, a variety of battery systems is also flowing into the market, which are functionally similar but differ in design, size, arrangement of the battery cells, and components installed in the system [50]. In addition to this, vehicle manufacturers often offer their vehicles with different battery capacities [51], where the database for chronological information about a system’s exact capacity over the considered years is not readily available. For these reasons, this publication contains calculated values for average battery sizes for each year between 2013 and 2021 using a market-based average capacity as an effort to converge these results to the correct representation of the vehicle fleet.
The average capacity was calculated by looking at the ten best-selling BEV and PHEV models within Europe in a given year using the accessible manufacturers’ data on their respective battery capacities as values. If a vehicle model was offered with different battery capacities in the considered year, an average value has been calculated for this model based on the offered battery sizes. As a result, the respective model registration numbers were included as weighting parameters in the calculation of the total average capacity for each year. Table 4 lists the calculated annual average capacities for BEVs and PHEVs together with the percentage market share of the respective best-selling vehicles as an indicator.
When looking at the calculated average capacities for BEV batteries, a relatively linear increase can be seen, starting at slightly below 30 kWh. By 2021, this value roughly doubled, reaching an average capacity of around 60 kWh. Over almost the entire period considered, the vehicle market was dominated by the Nissan Leaf and Renault Zoe models, although battery sizes naturally increased significantly towards the end of the period. While at the beginning, only a few models with significantly more than 50 kWh of battery capacity—such as the Tesla Model S—were among the best-selling models in Europe, over the years, further Tesla models and higher-priced vehicle models such as the Jaguar I-Pace and the Audi e-tron entered the market.
The trend is slightly different for PHEVs in this period, whereby only a small increase from 11.5 kWh to 12.9 kWh in average capacity can be seen when comparing 2013 with 2021. Furthermore, the calculated values show a short decline of one to two kilowatt-hours between the years of 2016 and 2018. This can be explained by the fact that within this period, registrations of some models with larger PHEV battery capacities—such as the Volvo V60 or the Porsche Cayenne S—decreased while vehicles with smaller average batteries—such as the Mercedes C350e, GLC350e, or the BMW 225xe Active Tourer and 330e—gained more market share. For a large part of the period under review, the PHEV variant of the Mitsubishi Outlander remained one of the most popular models. The linear battery capacity increase for BEV, as well as the rather stagnating curve for PHEV equivalents, is once again reflected in Figure 7 over the period under consideration from 2013 to 2021, together with the annual new vehicle registrations.
In order to determine the new registrations of electric vehicles (EVs) in Europe between 2022 and 2035, scenario analysis forecasts from the International Energy Agency (IEA) were utilized. According to the IEA’s projections, it is anticipated that 3.7 million EVs will be sold in Europe in the year 2025, with 35% of them being plug-in hybrid electric vehicles (PHEVs) [52]. By 2030, the number of EV sales is expected to increase to 7.1 million, with 33% of them being PHEVs. These forecasts were utilized to calculate a linear gradient factor, allowing us to estimate EV new registrations up to the year 2030.
Because the battery return volumes in this paper aim to estimate values up to 2035, the new EV registrations will also be considered up to this point. Between 2030 and 2035, it is assumed that new registration for BEVs and PHEVs will increase significantly, more specifically, an annual increase of 10%. This assumption is based on various factors. On the one hand, numerous vehicle manufacturers such as Fiat, Volvo, and Ford have announced that they will offer exclusively electrically powered vehicles from 2030 for their operations in Europe. Between 2030 and the next exit point, 2035, other important manufacturers such as Nissan, Renault, and Hyundai have announced the end of their production of internal combustion engines (ICEs) [53]. Based on these statements, an annual increase factor of 10% is assumed to calculate the missing EV new registrations. For simplicity, this value is used for PHEVs and BEVs. However, the mentioned new registration determined from 2030 up to 2035 only has a less drastic influence on the returning battery results because the Weibull distribution assumes very low failure rates in the first years of product lifetime, as opposed to prognosing for longer timelines (e.g., 2040). The results are presented in Figure 8.
Finally, the average battery capacities for BEVs and PHEVs also need to be estimated. For PHEVs, a constant battery capacity was assumed as no trends or innovations indicate a significant increase in battery capacity demand for this vehicle type. This value is fixed at 13 kWh. BEVs, on the other hand, have already shown a favored increase in average battery capacity over the last nine years. It can be assumed that this trend will also continue to a certain extent in the future because the driving range is still one of the main points of concern for potential customers. Eventually, this requires high battery capacities, among other factors, such as efficiency. Based on this, the average capacity of BEV battery systems will linearly increase up to a certain limit in Europe. However, because the average capacity value considers the entirety of the BEV fleet in the European market, vehicles with smaller batteries, such as the e.GO e.wave X or the VW e-Golf, are also considered. As a result, the average value will not permanently increase but will stagnate at a limit. This limit is assumed to reach about 80 kWh for this analysis and is visible as a blue line in Figure 8.

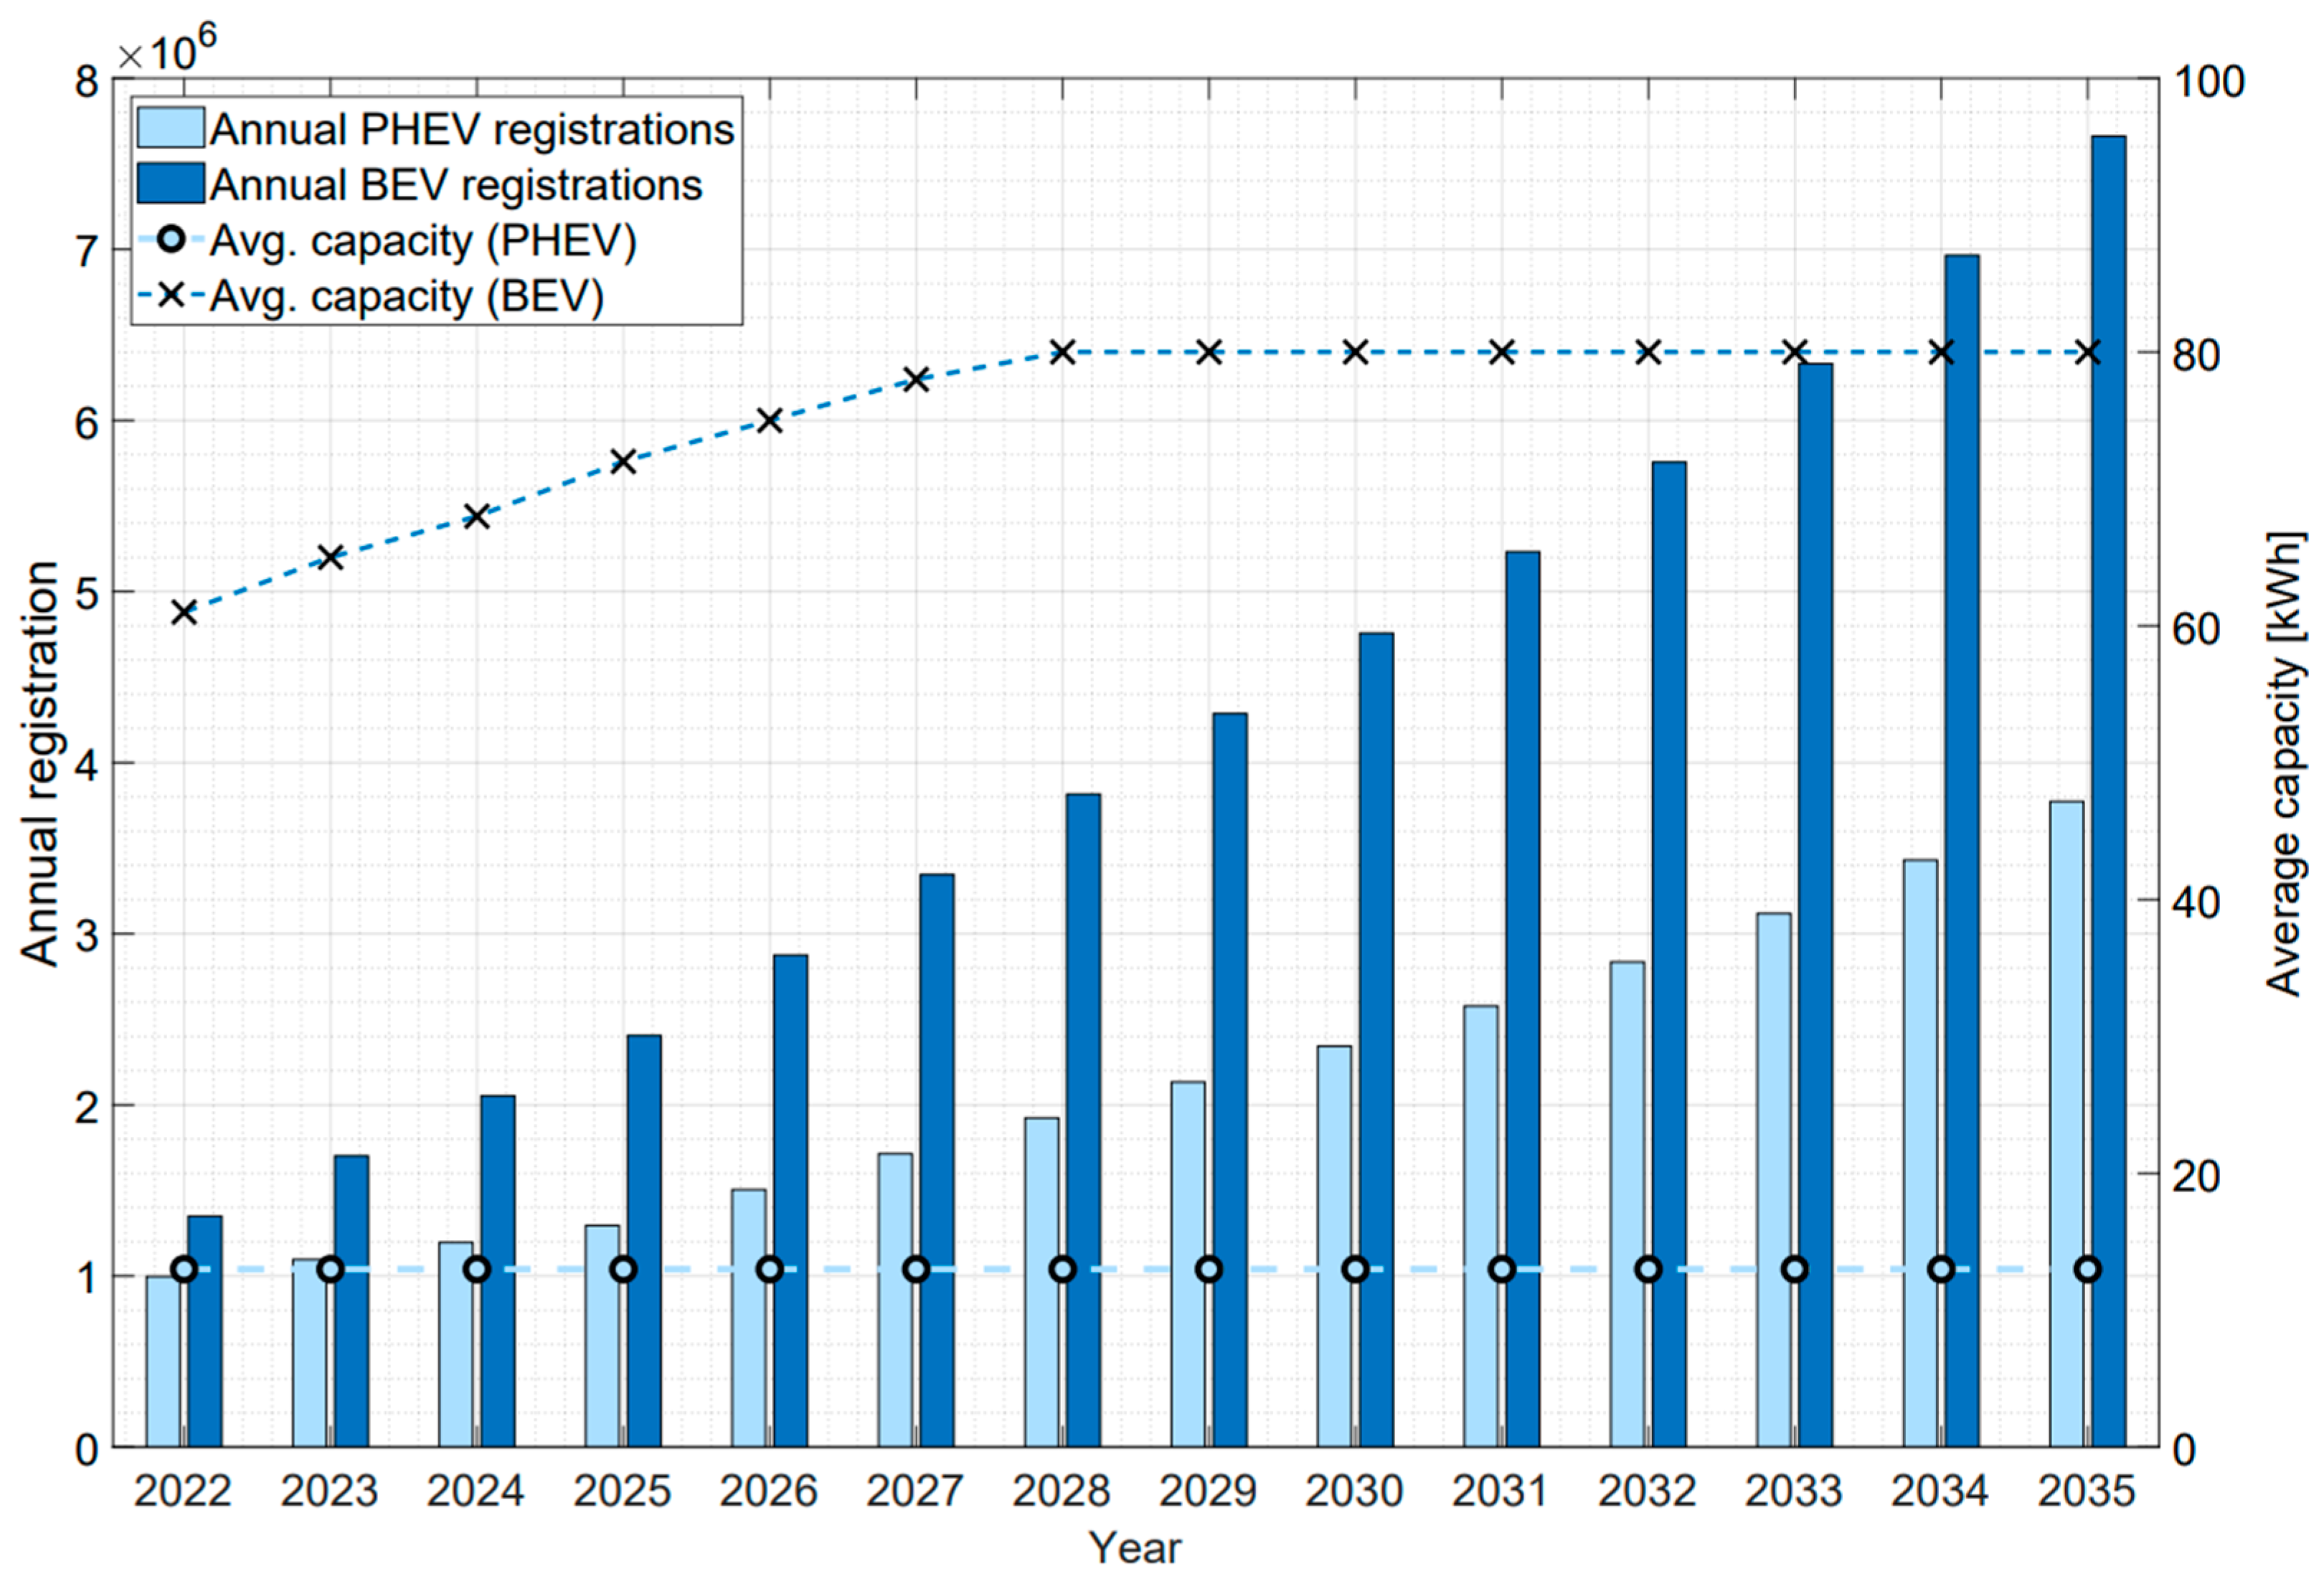
3.2. Implementation of Battery Data in Weibull Prognose Tool for Battery Return Volumes

In the next step, the gathered data are used as input parameters for the Weibull prognosis tool. The goal of this tool is to determine the amount of returning battery systems until 2035, where we are limiting the failure case to battery aging and inconsistency of cells. Therefore, annual new car registrations are combined with the Weibull failure rate, calculating the battery return volume for every year individually before a total sum of returning volume can be said for a specific year. It has to be considered that the battery failure rate is increasing the longer a battery is in the market. For this reason, it is necessary to calculate the return quantities based on the individual failure rate of the annual amount of batteries in the year in which the product was placed on the market. In order to determine the total return volume for a given year ( N x ), the individual return streams from previous years ( i 19 i n x + i 1 ) must be added up considering each failure rate ( a i ). Because the Weibull failure rate is increasing up to a certain maximum (i.e., 99% failure rate at 19 years, see Figure 6), the return volume of a single year increases until then as the forecast progresses. In turn, the total returning battery systems from a particular year is the summation of previous years. The equation can be formulated as follows and is also visualized in Figure 9.
N x = i = 1 19 ( n x + i 1 × a i )
  N 2035 = ( n 2034 × a 1 + n 2033 × a 2 + + n 2016 × a 19 )
The battery return is then also calculated in kilowatt-hours in terms of energy content and can thus be expanded to include the respective annual average capacity denoted by c i . Here also, the typical 80% SOH threshold is used to describe the EOL of EV application and for the case of capacity fade and capacity inconsistency of constituent cells [54]. Thus, it will be reflected in the final calculation for kWh values:
N i , k W h = i = 1 19 ( n x + i 1 × c x + i 1 × a i ) × 0.8
Based on the Weibull parameters ( β = 3.6 , η = 12 ) and the forecasted new registrations and battery capacities performed in the last subsections, the battery return volumes were calculated as laid out above. Figure 10 and Table 5 show the results plotted against a log-scaled y-axis. The units in focus are taken to be individual battery packs in BEVs/PHEVs and kWh. The annual and total battery return volumes are looked at here, whereby both are depicted only from 2022 onwards. Annual battery volume refers to the individual year, whereas total battery volume refers to the span of 19 years up to the year in focus. This can be explained by Figure 6, which clearly shows that after 19 years of first usage, 99% of the batteries introduced in the first year will have already failed. The calculation does not consider the specific time of the year (in the span of twelve months), although it could provide an even more detailed analysis for monthly or quarterly battery return values. However, this is beyond the purpose of this paper, so we can omit this.
The four log-scaled graphs provide some insights into the model and how we can interpret the results. Looking at the two different units of the y-axis (one in pcs. and the other in kWh), we can conclude that they are similar but not identical. In terms of the pure number of battery returns (in pcs.), which can also be equated to the physical process of picking up a defective vehicle and treating the batteries, etc., BEV exceeds that of PHEV around 2025 for annual values and after mid-2026 for total return values. This trend is similar for kWh, except for being one-year shifted, whereby the former can be seen around 2024 and the latter during mid-2025. Knowing that the number of new registrations of BEVs has already surpassed that of PHEVs in 2019, in the context of returning values, this same situation can only be observed about five years later. This shifted trend can be explained by the failure rate of the battery pack, which reaches around 2% at the end of the fourth year and 5% at the end of year 6.
Based on the forecasts, European annual return volumes will reach the milestone of 1,000,000 LIBs in Europe around 2031 for BEVs and 2033 for PHEVs. As seen from the top left log graph, the annual return volumes of BEVs increase exponentially and change slowly to a more linear growth when the market is more saturated, more evidently coming into the year 2028. This can be traced back to the failure rate argument at the end of year 6 and the fact that we are assuming a linear growth of new registrations from 2022 onwards. The one-year offset that can be observed when looking at the crossover point for BEVs and PHEVs previously can also be seen here for the trend of increasing battery return volumes for all graphs of Figure 10. More specifically, the total return volume growth trend lags behind the annual return volumes of BEVs and PHEVs. The gradient on the [kWh] graphs is, however, much sharper than the [pcs.] equivalent due to increasing return volumes and increasing battery capacities in the market.

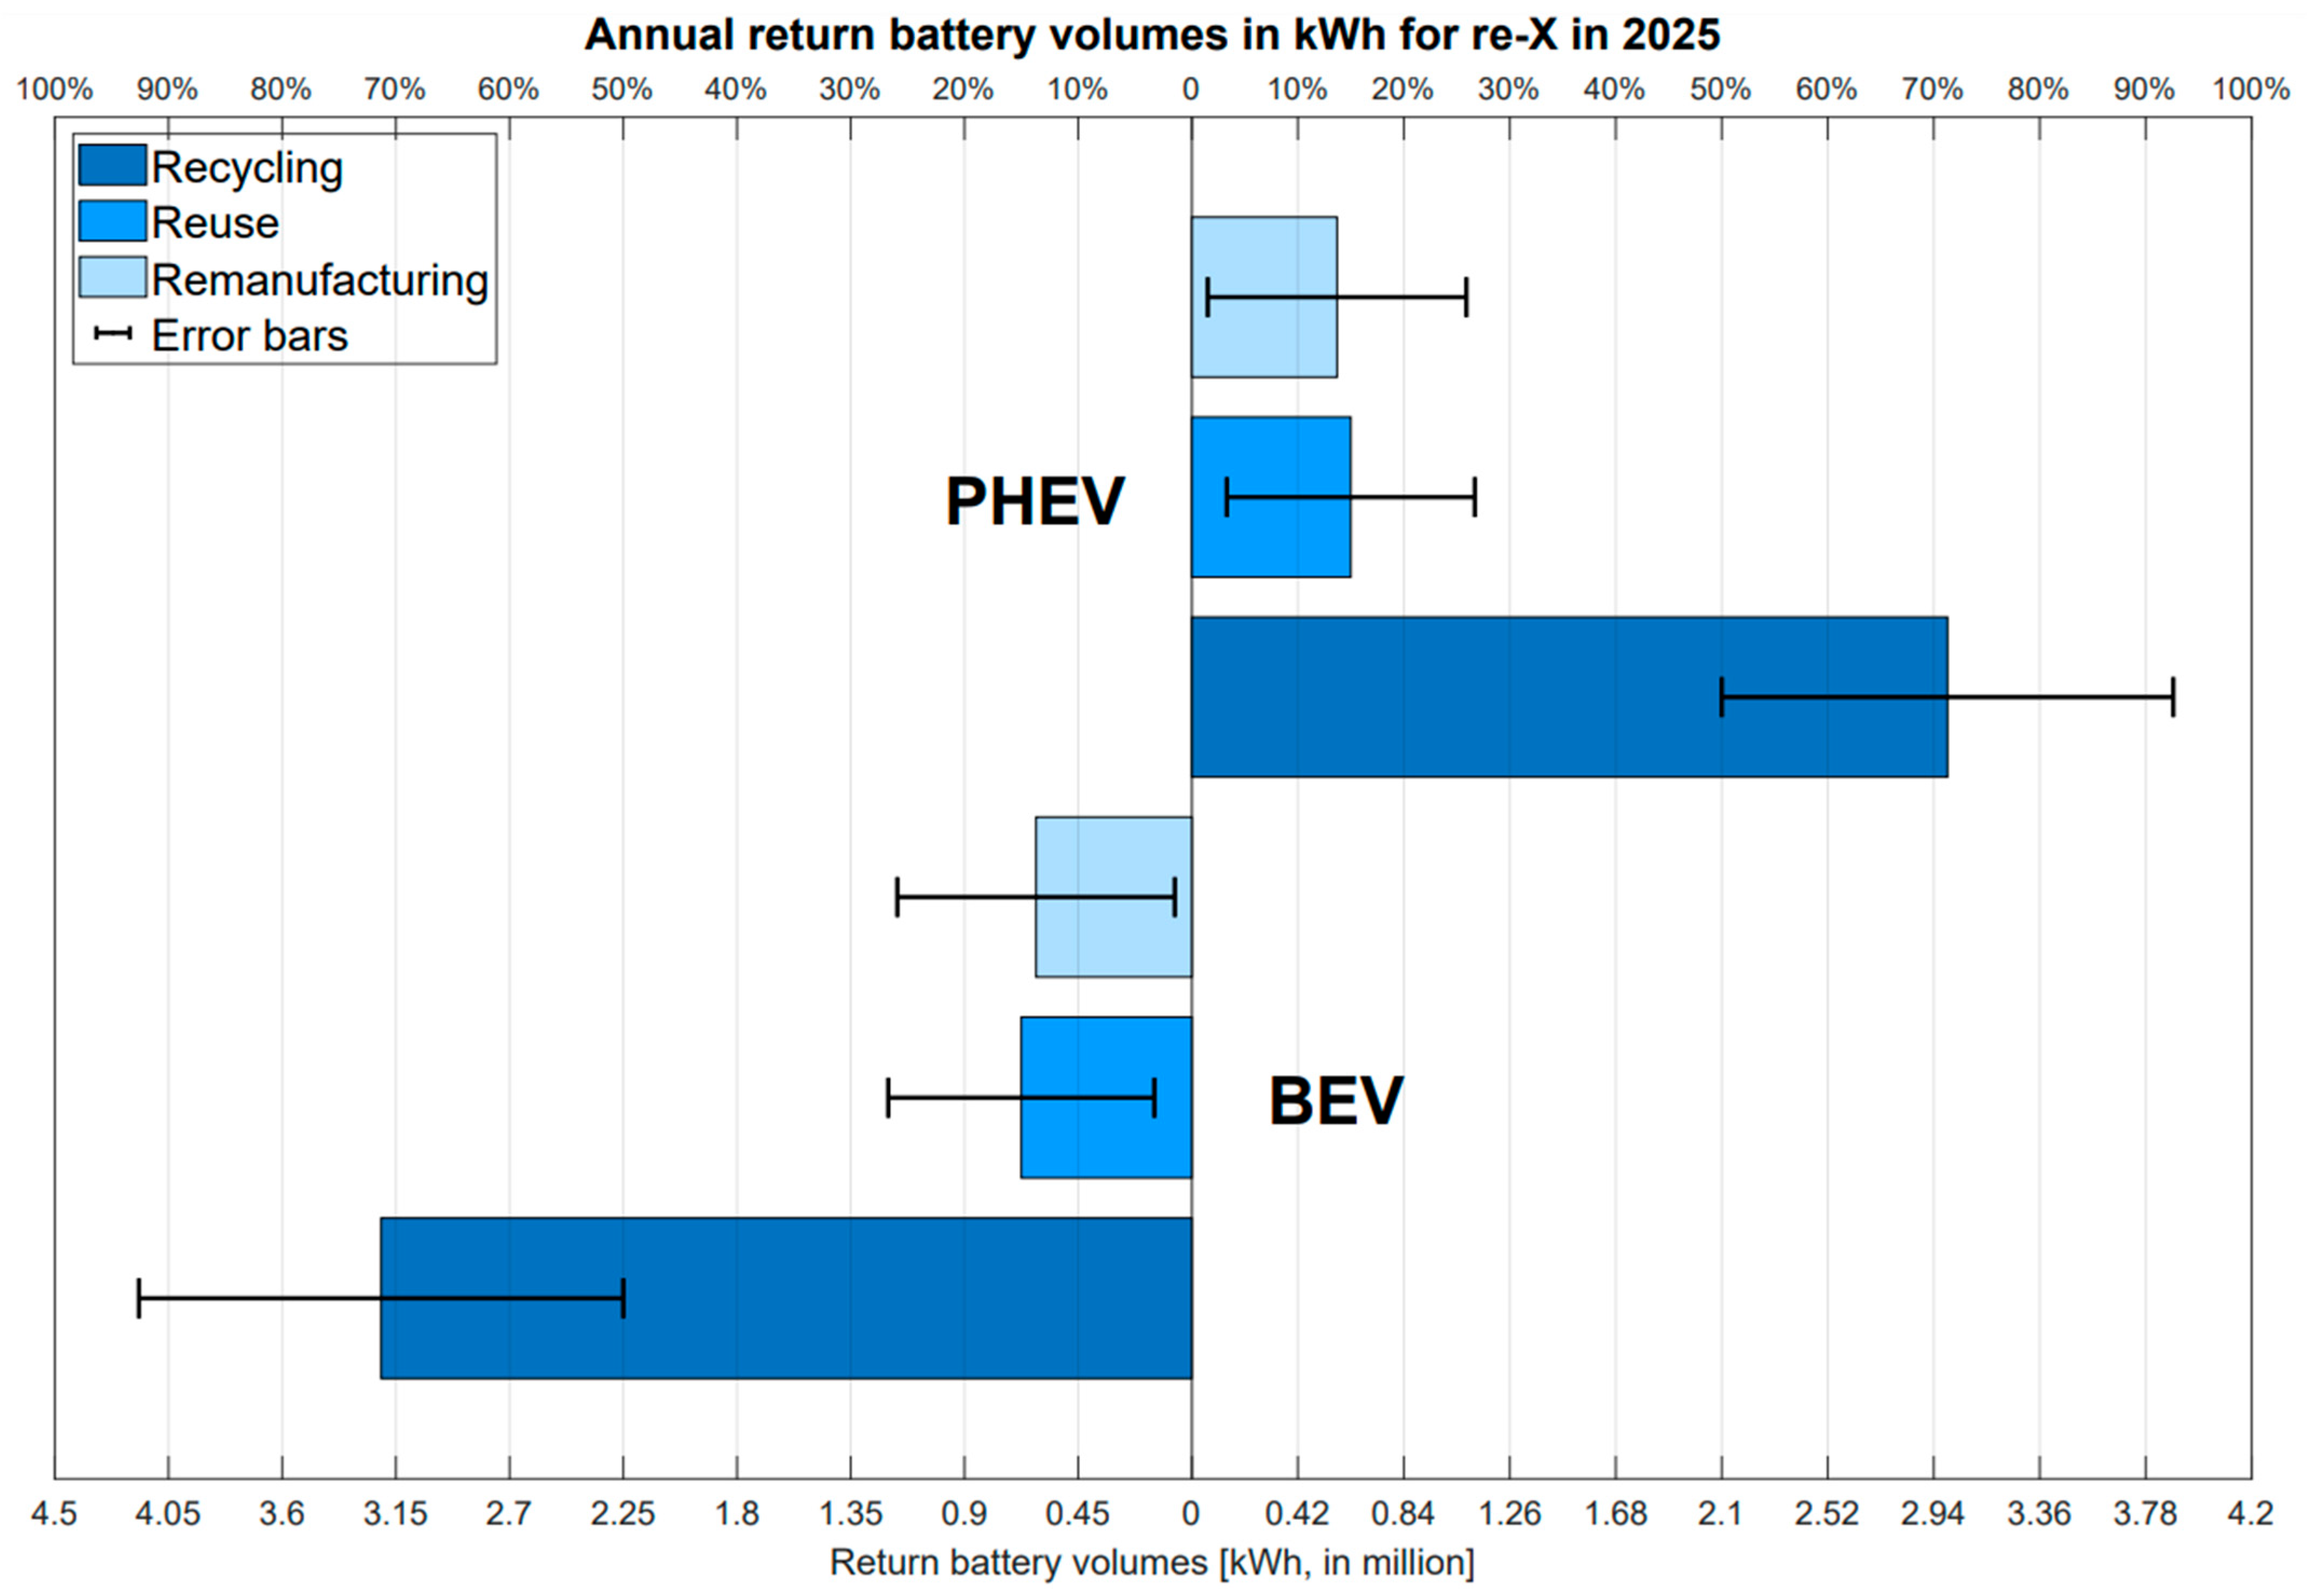
4. Battery Circular Economy and 3R Strategies

A very important issue that has a direct impact on the evaluation of battery return quantities after a useful life in the vehicle is the future distribution of battery return flows among the existing 3R pathways. The term “3R” refers to the sum of the currently existing pathways around reuse, remanufacturing and recycling [55].

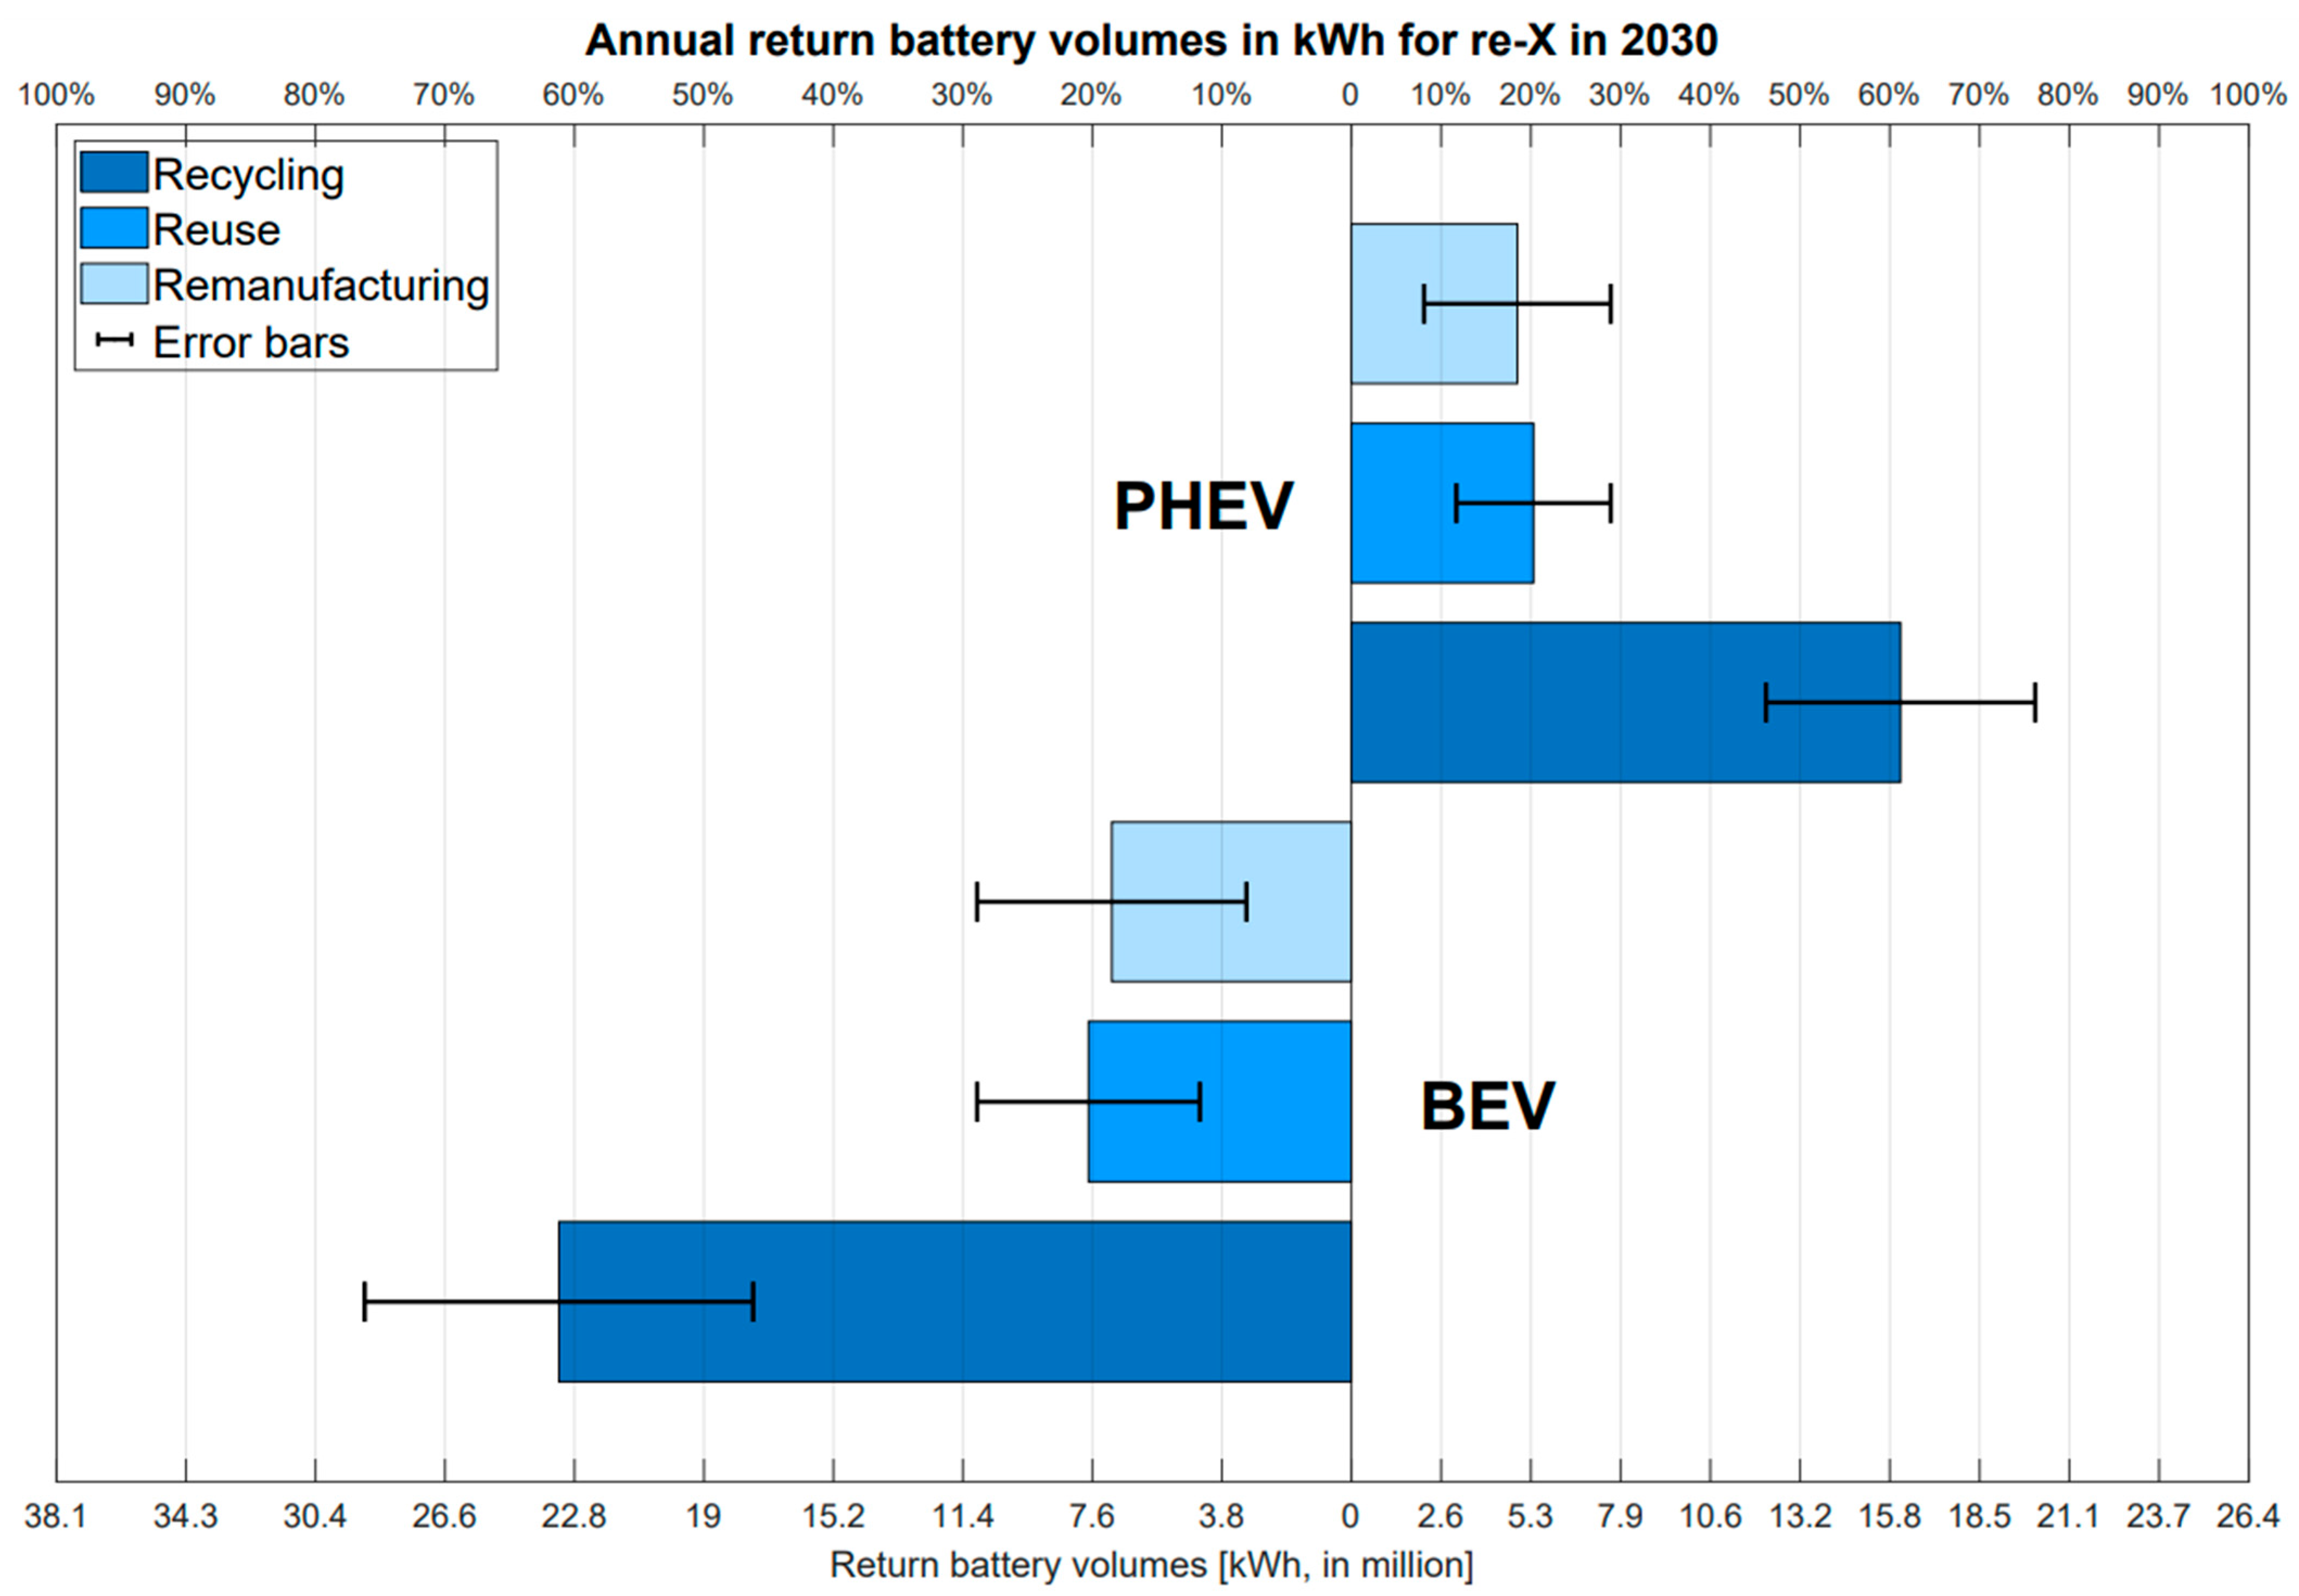
Quantification of Return Volumes for 3R Strategies

The authors conducted twelve expert interviews with battery experts from different sections of the battery value chain in order to quantify the share of 3R streams. The average share and the standard deviation due to the different battery experts are shown in Figure 11. The experts belonged to the areas of research, OEM, automotive aftermarket, battery materials, automation technology, and mechanical engineering, as well as battery recycling. For the simplification of the interview process, the distribution of the batteries available for the 3R paths was considered 100% in serving an ideally fully integrated circular economy framework.
Overall, the experts assume that in 2025, almost three-quarters of all batteries available for these routes will find their way directly into recycling. This is mainly due to the fact that the future EU battery regulation will require certain proportions of recycled active materials to be used in production. Another reason is the ambition of manufacturers to achieve low return times for valuable materials such as copper, nickel, or cobalt [56]. In the future, reuse and remanufacturing will only be served by a smaller proportion of retired batteries, estimated at about 15% for reuse and less than 13.7% for remanufacturing. This picture will shift only marginally by 2030, whereby the number of available batteries will be significantly greater at that time, as our initially presented forecast also suggests (almost a 10x increase across BEVs and PHEVs). Effects such as established regulations on lifetime CO2 footprints, new technological developments, but also design innovations can, of course, have a greater influence on the distribution, which makes the estimation towards 2030, in particular, more volatile, even if the error margin of 2025 is generally higher than 2030 in terms of percentage. Regarding reuse and remanufacturing, the batteries and battery technologies considered in the time frame that goes up to 19 years must, of course, always face a cost and performance comparison with new state-of-the-art batteries coupled with the 3R standards and conventions in the year of interest.
Figure 12 and Figure 13 show the annual return battery volumes in kWh for the years 2025 and 2030. As we can observe, BEV surpasses PHEV by only a small fraction in 2025, but the difference is becoming much clearer with the shifts in 2030, which can be explained by the newly developed battery technologies and 3R regulations.

5. Discussion

This paper focused on concluding a tangible value for a circular economy strategy surrounding 3R propositions in the context of LIBs. Regarding pitfalls and considerations when it comes to working with data that are highly dependent on market research, human factors, and ongoing technological improvements, we will discuss them here in an attempt to provide an accurate interpretation of the results. It is common practice to establish numerous scenarios in service of giving a spectrum of possible outcomes and enabling measures and correct goal setting for the alignment with the predicted values. This, however, is not within the scope of this paper, as we have demonstrated the conceptual methodology behind this vastly complicated subject.
If we look at the battery return volume as a system, this system can prove to be very complex. Analogous to how a yeast model falls short when the goal is to completely model and predict accurately the effect of human population growth due to the complex human-driven variables (e.g., relating to resources, behavioral trends, finance, etc.), the model that we have provided has not covered all aspects of influencing factors such as human, market, and technology trends. This results in an interpretation with bias, upon which we would like to elaborate and lay out future research efforts.
This paper uses the shape parameter and scale parameter according to Zhao et al. [47], and we have since taken assumptions that allow the progression of this paper. By making assumptions, it is possible to narrow down the subject area; at the same time, this also reduces the causes of failure for a battery system to the cause space considered in this analysis. This must be taken into account when using these results.
Here is a list of the mentioned biases:
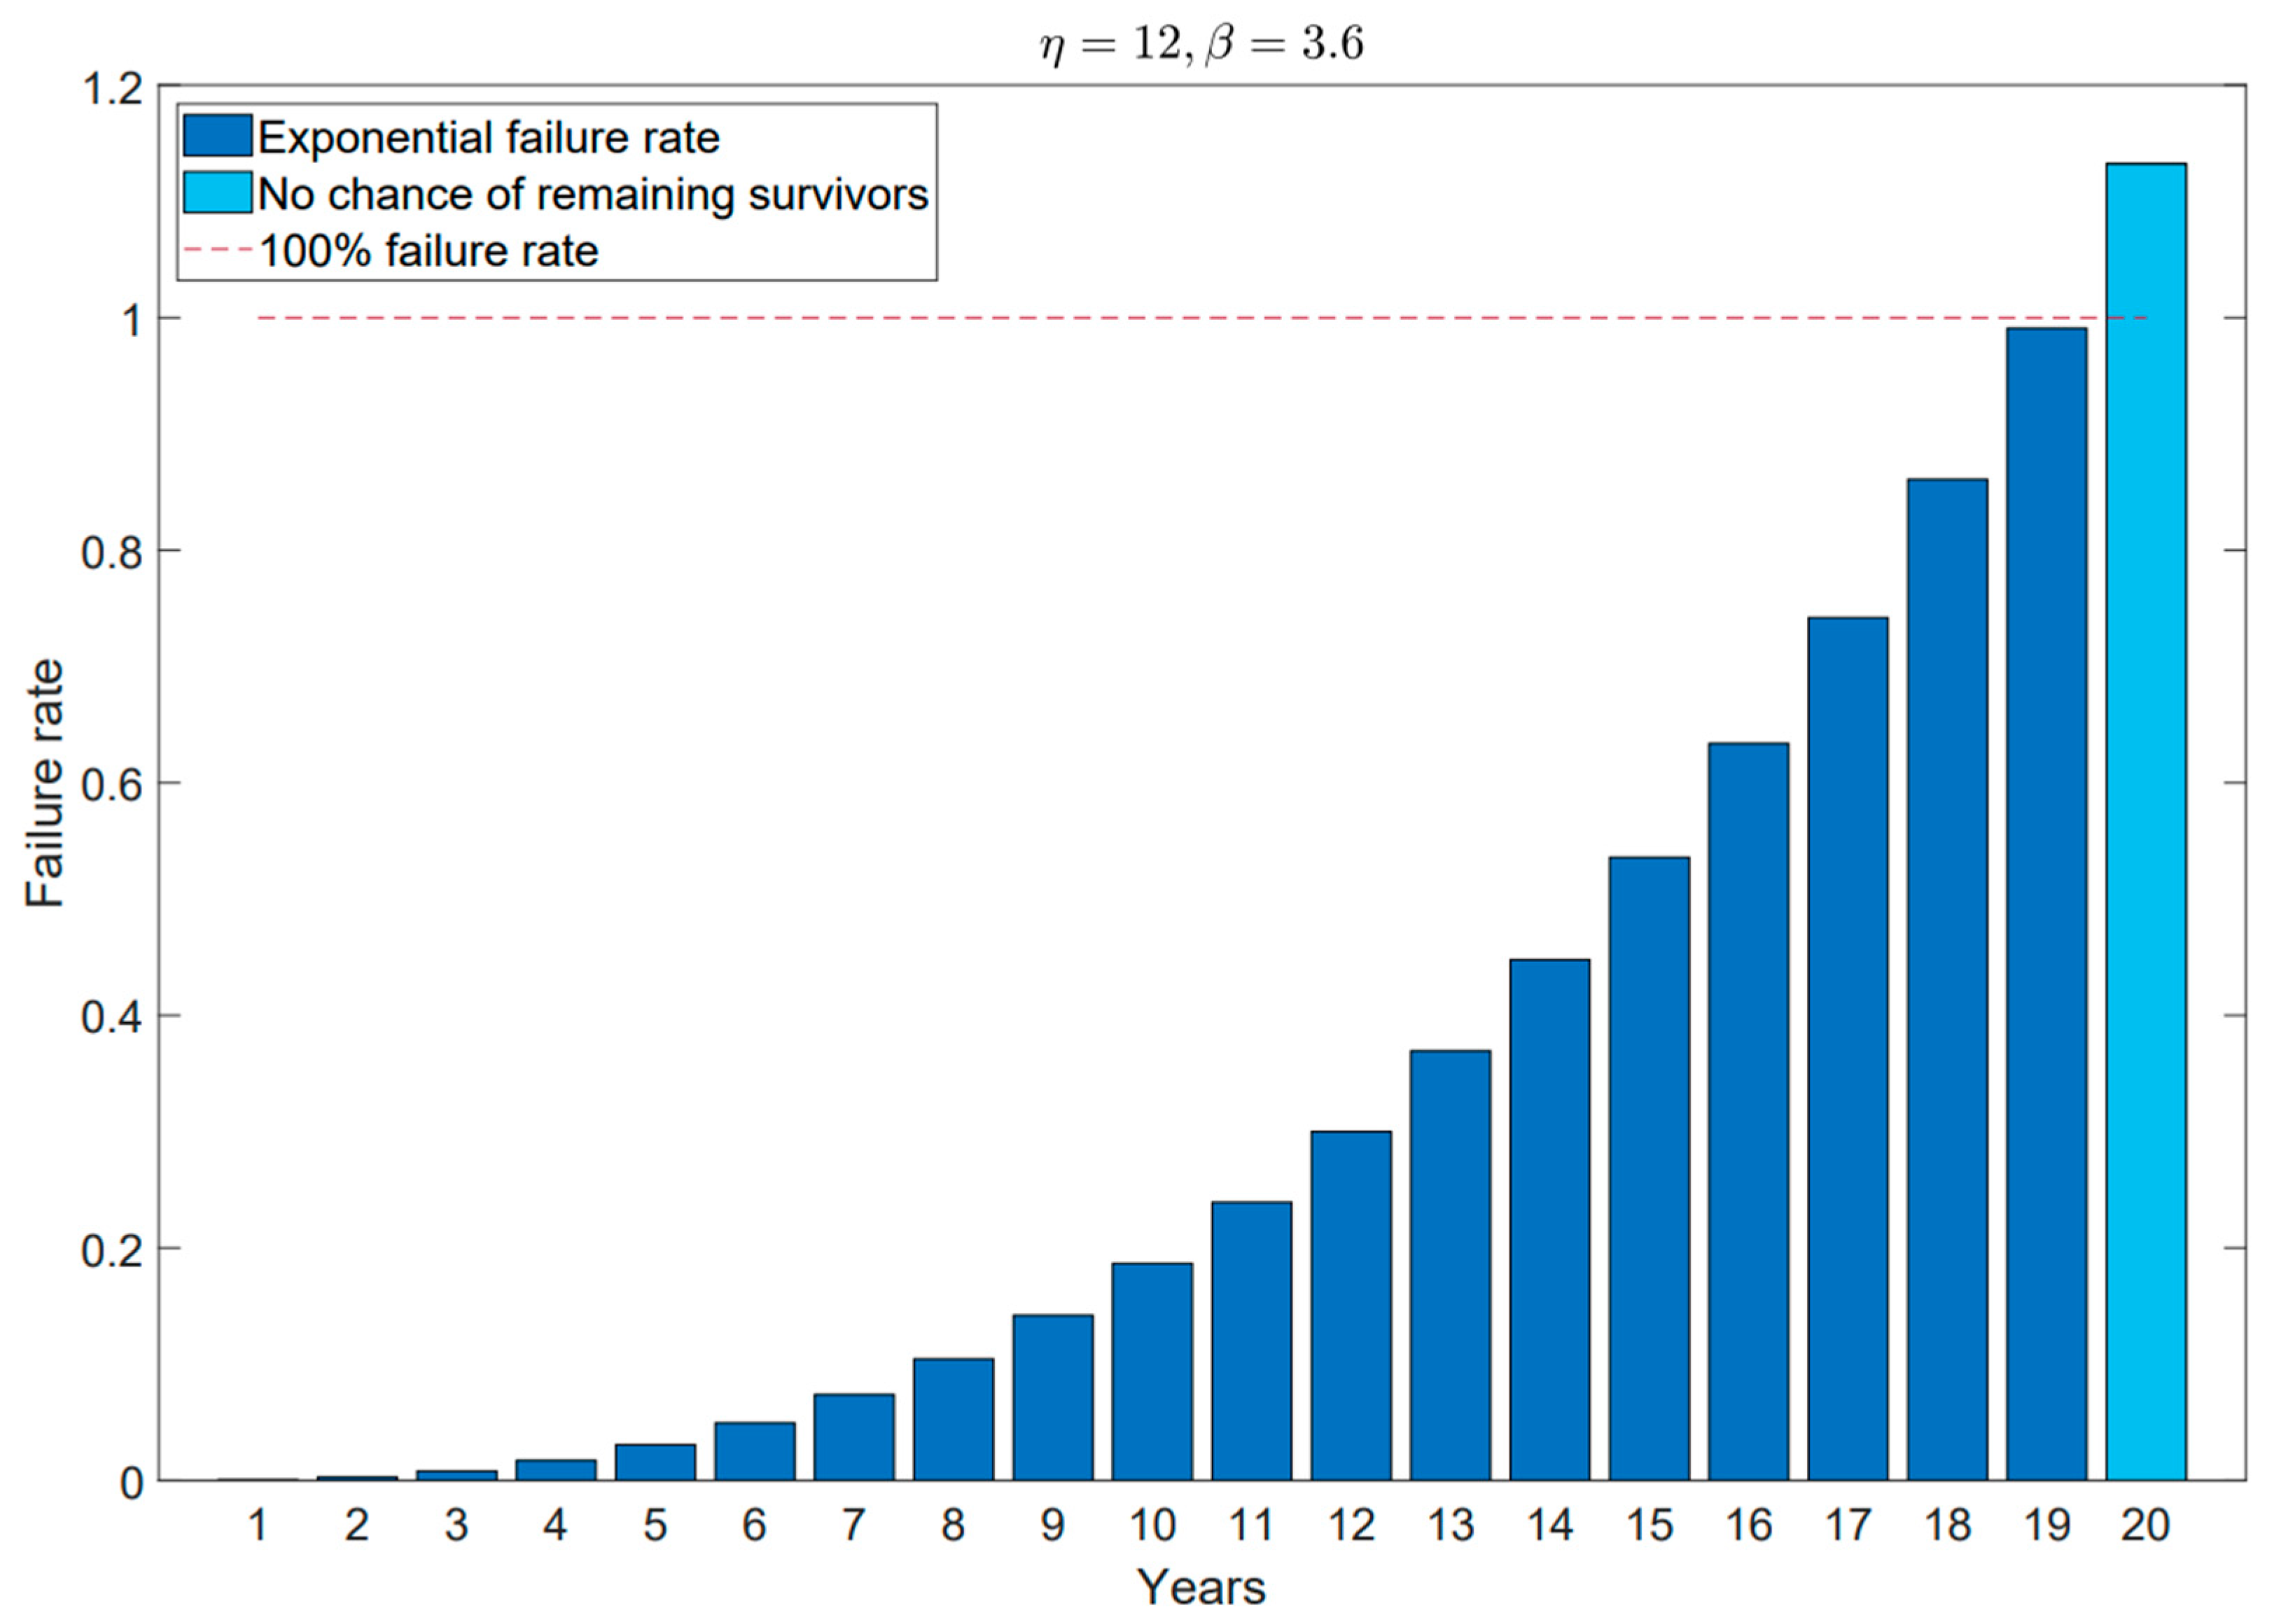
  • Upon reviewing the available literature on fitting LIB degradation data to the Weibull distribution, the paper concludes this by referencing the parameter found in [47]. When looking at the Weibull parameter in the cited research, the result reflects a suitable Weibull distribution that matches the failure data distribution of a series-connected battery module, which is known to be more vulnerable to the barrel effect when compared with a parallel-connected configuration. Along with assumption 3, we came to a scale parameter of twelve years, which reflects a normalized expectation that around 65% of vehicle batteries will need to be serviced or replaced after twelve years of usage for vehicles from 2013 to 2030. In order to obtain a better fitting parameter for a distribution of choice (in this paper, the Weibull distribution), data from battery management systems from multiple BEV and PHEV models have to be assessed.
  • Only one out of many degradation and aging modes is considered; for a better judgment of the actual return battery flow, we need to calculate what is known as the “system failure rate”. As seen in Figure 2, there are different failure modes for a battery system that can lead to different types of degradation, thus causing earlier aging or failure. The scale of complexity can be exponential, and therefore, if this approach is taken, an optimal methodology should include an effort vs. result accuracy analysis. System failure rate can be calculated through simple series or parallel system models and/or by using more advanced methods for the total consideration of many components within the system.
  • The usage trend (user profile) has not been given a separate examination, where we only took the normalized assumption of around one EFC every two days for all vehicles.
  • The threshold of 80% was chosen for the calculation of returning battery volumes in kWh. This is common practice for BEVs. However, for EVs, especially for PHEVs, there could be discrepancies.
  • Technology advancement, LIB technology will get better, and the aging trend might no longer be similar. Other technologies related to BEVs, such as swapping stations and other charging profiles from different charging stations, also affect the aging aspect of battery systems.
  • Methods of replacement of faulty battery packs when a vehicle is being serviced can also differ.

6. Conclusions

This article provides an accurate evaluation of battery return volumes until 2035. It was calculated that about 111,146 BEV batteries and 110,721 PHEV batteries will return annually in 2025 in Europe, rising up to 757,619 (BEV) and 539,636 (PHEV) batteries in 2030, respectively. Considering the average battery capacity of each year for BEV and PHEV, the number of batteries corresponds to a capacity of 4.5 GWh (BEV) and 4.2 GWh (PHEV) in 2025 and 38 GWh (BEV) and 26.3 GWh (PHEV) in 2030. This results in a total capacity of returning battery systems of about 200 GWh in 2030. According to battery expert interviews, these numbers will be divided between the areas of reuse (~15%), remanufacturing (~13%), and recycling (~71%) in 2025. In the future, this distribution will change towards a lower recycling share (~61%), resulting in 20% for reuse and 19% for remanufacturing. The reason for this could be the increasing feasibility of the other 3R strategies, such as reuse and remanufacturing, because they are highly dependent on returning quantities to be economically viable.
In conclusion, numbers for 2025 (~8.7 GWh, annually) and 2030 (~64 GWh, annually) indicate a significant increase in return volumes before the end of this decade. This represents significant market growth and could enable companies in the battery circular economy to have a higher market presence. In turn, this would impact the life of LIBs and potentially make the battery system more sustainable as an overall technology.
The results of this paper are intended to serve as a basis for further analyses in the long term. At the same time, they are to be used as a basis for economic decisions for industry and business.

Author Contributions

Conceptualization, M.F., D.K. and K.N.; methodology, D.K. and M.F.; software, M.F. and K.N.; validation, D.K, M.F., C.O., H.H.H. and A.K.; formal analysis, M.F.; investigation, M.F., D.K. and K.N.; resources, A.K. and H.H.H.; data curation, D.K.; writing—original draft preparation, M.F. and K.N.; writing—review and editing, K.N., D.K., M.F., C.O., H.H.H. and A.K.; visualization, K.N., M.F. and K.N.; supervision, A.K. and H.H.H.; project administration, M.F.; funding acquisition, A.K. and H.H.H. All authors have read and agreed to the published version of the manuscript.

Funding

This research was funded by the German Federal Ministry for Economic Affairs and Climate Action, grant number “01MV21006C”.

Data Availability Statement

Not applicable.

Acknowledgments

The research project “Fluxlicon” (01MV21006C), on which this publication is based, was funded by the German Federal Ministry for Economic Affairs and Climate Action. In Fluxlicon, the project team develops and produces modular energy storage systems based on second-life battery systems with different SOHs, capacities, and cell chemistries.

Conflicts of Interest

The authors declare no conflict of interest.

References

  1. Kurmayer, N.J. German Transport Minister Backs Electric Cars in E-Fuel Debate. 14 January 2022. Available online: https://www.euractiv.com/section/electric-cars/news/german-transport-minister-backs-electric-cars-in-e-fuel-debate/ (accessed on 14 April 2023).
  2. Road|European Alternative Fuels Observatory. Available online: https://alternative-fuels-observatory.ec.europa.eu/transport-mode/road (accessed on 14 April 2023).
  3. Kabir, M.M.; Demirocak, D.E. Degradation mechanisms in Li-ion batteries: A state-of-the-art review. Int. J. Energy Res. 2017, 41, 1963–1986. [Google Scholar] [CrossRef]
  4. BGB I. I S. 1582, Batteriegesetz vom 25.06.2009: Gesetz über das Inverkehrbringen, die Rücknahme und die Umweltverträgliche Entsorgung von Batterien und Akkumulatoren (BattG). Available online: https://www.gesetze-im-internet.de/battg/BJNR158210009.html (accessed on 15 August 2023).
  5. European Comission. Proposal for a REGULATION OF THE EUROPEAN PARLIAMENT AND OF THE COUNCIL Concerning Batteries and Waste Batteries, Repealing Directive 2006/66/EC and Amending Regulation (EU) No 2019/1020; European Comission: Brussels, Belgium, 2020. [Google Scholar]
  6. Gaines, L.; Richa, K.; Spangenberger, J. Key issues for Li-ion battery recycling. MRS Energy Sustain. 2018, 5, 12. [Google Scholar] [CrossRef]
  7. Mossali, E.; Picone, N.; Gentilini, L.; Rodrìguez, O.; Pérez, J.M.; Colledani, M. Lithium-ion batteries towards circular economy: A literature review of opportunities and issues of recycling treatments. J. Environ. Manag. 2020, 264, 110500. [Google Scholar] [CrossRef]
  8. Gillespie, T. Rising Battery Costs Hit Carmakers, Threaten Climate-Change Push. Bloomberg [Online]. 30 November 2021. Available online: https://www.bloomberg.com/news/articles/2021-11-30/even-the-battery-boom-can-t-escape-world-s-supply-chain-woes?leadSource=uverify%20wall (accessed on 14 April 2023).
  9. Liu, Z.; Song, J.; Kubal, J.; Susarla, N.; Knehr, K.W.; Islam, E.; Nelson, P.; Ahmed, S. Comparing total cost of ownership of battery electric vehicles and internal combustion engine vehicles. Energy Policy 2021, 158, 112564. [Google Scholar] [CrossRef]
  10. DIN EN 13306:2018-02; Instandhaltung—Begriffe der Instandhaltung; Dreisprachige Fassung EN_13306:2017. Beuth Verlag GmbH: Berlin, Germany, 2018.
  11. Moubray, J. Reliability-Centered Maintenance, 2nd ed.; [3.rev.]; Industrial Press: New York, NY, USA, 2000; ISBN 9780831131463. [Google Scholar]
  12. Steck-Winter, H.; Stölting, C. Ersatzteilbedarfsplanung für Thermoprozessanlagen: Zeitschrift für gasbeheizte Thermoprozesse. GWI 2016, 65, 55–65. [Google Scholar]
  13. Xiong, R.; Sun, W.; Yu, Q.; Sun, F. Research progress, challenges and prospects of fault diagnosis on battery system of electric vehicles. Appl. Energy 2020, 279, 115855. [Google Scholar] [CrossRef]
  14. Jiang, J.; Zhang, C. Fundamentals and Applications of Lithium-Ion Batteries in Electric Drive Vehicles; Wiley: Singapore, 2015; ISBN 9781118414798. [Google Scholar]
  15. Zheng, Y.; Ouyang, M.; Lu, L.; Li, J. Understanding aging mechanisms in lithium-ion battery packs: From cell capacity loss to pack capacity evolution. J. Power Sources 2015, 278, 287–295. [Google Scholar] [CrossRef]
  16. Birkl, C.R.; Roberts, M.R.; McTurk, E.; Bruce, P.G.; Howey, D.A. Degradation diagnostics for lithium ion cells. J. Power Sources 2017, 341, 373–386. [Google Scholar] [CrossRef]
  17. Xiong, R.; Pan, Y.; Shen, W.; Li, H.; Sun, F. Lithium-ion battery aging mechanisms and diagnosis method for automotive applications: Recent advances and perspectives. Renew. Sustain. Energy Rev. 2020, 131, 110048. [Google Scholar] [CrossRef]
  18. Dubarry, M.; Pastor-Fernández, C.; Baure, G.; Yu, T.F.; Widanage, W.D.; Marco, J. Battery energy storage system modeling: Investigation of intrinsic cell-to-cell variations. J. Energy Storage 2019, 23, 19–28. [Google Scholar] [CrossRef]
  19. Ma, C.; Chang, L.; Cui, N.; Duan, B.; Zhang, Y.; Yu, Z. Statistical relationships between numerous retired lithium-ion cells and packs with random sampling for echelon utilization. Energy 2022, 257, 124692. [Google Scholar] [CrossRef]
  20. Han, X.; Lu, L.; Zheng, Y.; Feng, X.; Li, Z.; Li, J.; Ouyang, M. A review on the key issues of the lithium ion battery degradation among the whole life cycle. eTransportation 2019, 1, 100005. [Google Scholar] [CrossRef]
  21. Wang, X.; Fang, Q.; Dai, H.; Chen, Q.; Wei, X. Investigation on Cell Performance and Inconsistency Evolution of Series and Parallel Lithium-Ion Battery Modules. Energy Technol. 2021, 9, 2170071. [Google Scholar] [CrossRef]
  22. Rumpf, K.; Naumann, M.; Jossen, A. Experimental investigation of parametric cell-to-cell variation and correlation based on 1100 commercial lithium-ion cells. J. Energy Storage 2017, 14, 224–243. [Google Scholar] [CrossRef]
  23. Hua, Y.; Zhou, S.; Cui, H.; Liu, X.; Zhang, C.; Xu, X.; Ling, H.; Yang, S. A comprehensive review on inconsistency and equalization technology of lithium-ion battery for electric vehicles. Int. J. Energy Res. 2020, 44, 11059–11087. [Google Scholar] [CrossRef]
  24. Zhou, Z.; Duan, B.; Kang, Y.; Cui, N.; Shang, Y.; Zhang, C. A low-complexity state of charge estimation method for series-connected lithium-ion battery pack used in electric vehicles. J. Power Sources 2019, 441, 226972. [Google Scholar] [CrossRef]
  25. Lv, J.; Song, W.; Feng, Z.; Li, Y.; Ding, Y. Performance and comparison of equalization methods for lithium ion batteries in series. Int. J. Energy Res. 2021, 45, 4669–4680. [Google Scholar] [CrossRef]
  26. Rausand, M.; Barros, A.; Høyland, A. System Reliability Theory: Models, Statistical Methods, and Applications, 3rd ed.; John Wiley & Sons Inc: Hoboken, NJ, USA, 2020; ISBN 9781119373520. [Google Scholar]
  27. Weibull, W. A Statistical Theory of the Strength of Materials; Generalstabens Litografiska Anstalts Förlag: Stockholm, Sweden, 1939. [Google Scholar]
  28. Zok, F.W. On weakest link theory and Weibull statistics. J. Am. Ceram. Soc. 2017, 100, 1265–1268. [Google Scholar] [CrossRef]
  29. Lai, C.D.; Murthy, D.N.P.; Xie, M. Weibull distributions. WIREs Comp. Stat. 2011, 3, 282–287. [Google Scholar] [CrossRef]
  30. Almalki, S.J.; Nadarajah, S. Modifications of the Weibull distribution: A review. Reliab. Eng. Syst. Saf. 2014, 124, 32–55. [Google Scholar] [CrossRef]
  31. Tan, J.; Yao, Z.; Ye, M.; Shen, J. An optimized combination inspired by the wooden-barrel effect for Li-S pouch cells. Cell Rep. Phys. Sci. 2021, 2, 100659. [Google Scholar] [CrossRef]
  32. Barré, A.; Deguilhem, B.; Grolleau, S.; Gérard, M.; Suard, F.; Riu, D. A review on lithium-ion battery ageing mechanisms and estimations for automotive applications. J. Power Sources 2013, 241, 680–689. [Google Scholar] [CrossRef]
  33. O’Connor, P.D.T.; Kleyner, A. Practical Reliability Engineering, 5th ed.; Wiley: Chicester, UK, 2012; ISBN 9780470979822. [Google Scholar]
  34. Johnen, M.; Schmitz, C.; Kateri, M.; Kamps, U. Fitting lifetime distributions to interval censored cyclic-aging data of lithium-ion batteries. Comput. Ind. Eng. 2020, 143, 106418. [Google Scholar] [CrossRef]
  35. Mouais, T.; Kittaneh, O.A.; Majid, M.A. Choosing the Best Lifetime Model for Commercial Lithium-Ion Batteries. J. Energy Storage 2021, 41, 102827. [Google Scholar] [CrossRef]
  36. Wu, J.; Cui, X.; Zhang, H.; Lin, M. Health Prognosis With Optimized Feature Selection for Lithium-Ion Battery in Electric Vehicle Applications. IEEE Trans. Power Electron. 2021, 36, 12646–12655. [Google Scholar] [CrossRef]
  37. Prabhakar Murthy, D.N.; Bulmer, M.; Eccleston, J.A. Weibull model selection for reliability modelling. Reliab. Eng. Syst. Saf. 2004, 86, 257–267. [Google Scholar] [CrossRef]
  38. Blischke, W.R.; Murthy, D.N.P. Reliability: Modeling, Prediction, and Optimization; Wiley: New York, NY, USA, 2000; ISBN 9780471184508. [Google Scholar]
  39. Harris, S.J.; Harris, D.J.; Li, C. Failure statistics for commercial lithium ion batteries: A study of 24 pouch cells. J. Power Sources 2017, 342, 589–597. [Google Scholar] [CrossRef]
  40. Li, R.; Wu, J.; Wang, H.; Guo, J.; Li, G. Reliability assessment and failure analysis of lithium iron phosphate batteries. Inf. Sci. 2014, 259, 359–368. [Google Scholar] [CrossRef]
  41. Eom, S.-W.; Kim, M.-K.; Kim, I.-J.; Moon, S.-I.; Sun, Y.-K.; Kim, H.-S. Life prediction and reliability assessment of lithium secondary batteries. J. Power Sources 2007, 174, 954–958. [Google Scholar] [CrossRef]
  42. Lehner, S.; Baumhöfer, T.; Sauer, D.U. Disparity in initial and lifetime parameters of lithium-ion cells. IET Electr. Syst. Transp. 2016, 6, 34–40. [Google Scholar] [CrossRef]
  43. Lehner, S.; Baumhöfer, T.; Sauer, D.U. Necessity and methods to improve battery lifetime on system level. In Proceedings of the 28th International Electric Vehicle Symposium and Exhibition 2015, EVS 2015, Goyang, Republic of Korea, 3–6 May 2015. [Google Scholar]
  44. Jiang, Y.; Jiang, J.; Zhang, C.; Zhang, W.; Gao, Y.; Guo, Q. Recognition of battery aging variations for LiFePO4 batteries in 2nd use applications combining incremental capacity analysis and statistical approaches. J. Power Sources 2017, 360, 180–188. [Google Scholar] [CrossRef]
  45. Chiodo, E.; Lauria, D.; Andrenacci, N.; Pede, G. Accelerated life tests of complete lithium-ion battery systems for battery life statistics assessment. In Proceedings of the 2016 International Symposium on Power Electronics, Electrical Drives, Automation and Motion (SPEEDAM), Capri, Italy, 22–24 June 2016; IEEE: Piscataway, NJ, USA, 2016; pp. 1073–1078. [Google Scholar]
  46. Carnovale, A.; Li, X. A modeling and experimental study of capacity fade for lithium-ion batteries. Energy AI 2020, 2, 100032. [Google Scholar] [CrossRef]
  47. Zhao, Q.; Jiang, H.; Chen, B.; Wang, C.; Xu, S.; Zhu, J.; Chang, L. Research on State of Health for the Series Battery Module Based on the Weibull Distribution. J. Electrochem. Soc. 2022, 169, 20523. [Google Scholar] [CrossRef]
  48. Ganjeizadeh, F.; Tapananon, T.; Lei, H. Predicting Reliability of Lithium Ion Batteries. Int. J. Eng. Res. Technol. (IJERT) 2014, 3. [Google Scholar]
  49. Han, X.; Ouyang, M.; Lu, L.; Li, J.; Zheng, Y.; Li, Z. A comparative study of commercial lithium ion battery cycle life in electrical vehicle: Aging mechanism identification. J. Power Sources 2014, 251, 38–54. [Google Scholar] [CrossRef]
  50. Zhu, J.; Mathews, I.; Ren, D.; Li, W.; Cogswell, D.; Xing, B.; Sedlatschek, T.; Kantareddy, S.N.R.; Yi, M.; Gao, T.; et al. End-of-life or second-life options for retired electric vehicle batteries. Cell Rep. Phys. Sci. 2021, 2, 100537. [Google Scholar] [CrossRef]
  51. Thompson, D.L.; Hartley, J.M.; Lambert, S.M.; Shiref, M.; Harper, G.D.J.; Kendrick, E.; Anderson, P.; Ryder, K.S.; Gaines, L.; Abbott, A.P. The importance of design in lithium ion battery recycling—A critical review. Green. Chem. 2020, 22, 7585–7603. [Google Scholar] [CrossRef]
  52. IEA. Global EV Sales by Scenario, 2020–2030. Available online: https://www.iea.org/data-and-statistics/charts/global-ev-sales-by-scenario-2020-2030 (accessed on 28 May 2023).
  53. Köllner, C. Verbrenner-Ausstieg: Die Pläne der Autohersteller. springerprofessional.de. 9 September 2023. Available online: https://www.springerprofessional.de/antriebsstrang/verkehrswende/verbrenner-ausstieg--die-plaene-der-autohersteller/18906344 (accessed on 28 May 2023).
  54. Kampker, A.; Heimes, H.H.; Offermanns, C.; Vienenkötter, J.; Frank, M.; Holz, D. Identification of Challenges for Second-Life Battery Systems—A Literature Review. WEVJ 2023, 14, 80. [Google Scholar] [CrossRef]
  55. PEM Institute. Batteriemonitor 2021: Die Wertschöpfungskette im Spannungsfeld von Ökonomie und Ökologie. Available online: https://www.pem.rwth-aachen.de/global/show_document.asp?id=aaaaaaaabgmfusq (accessed on 28 May 2023).
  56. Kachate, N.; Sharma, D.; Baidya, K. Material recovery in Li-ion battery recycling: Case study. Mater. Today: Proc. 2023, 72, 1498–1502. [Google Scholar] [CrossRef]
Figure 1. Different progression types for components failure rate with A: Early failures, random failures and aging failures; B: random failure, then aging failures; C: Continuously increasing failure rates; D: Early failures, then random failures; E: Only random failures; F: Early failures, then random failures with three different parts of component lifetimes (I, II and III) [12].
Energies 16 06873 g001
Figure 2. Possible failures in a battery system [13].
Energies 16 06873 g002
Figure 3. Degradation modes of LIBs and related effects [17].
Energies 16 06873 g003
Figure 4. Impact of cell-to-cell variation on a battery pack (distance “1”: dischargeable electric quantity; distance “2”: chargeable electric quantity) [15].
Energies 16 06873 g004
Figure 5. Visualization of probability density function (PDF) and hazard rate of the Weibull distribution for different scale parameters and form parameters.
Energies 16 06873 g005
Figure 6. Failure rate of cell-to-cell variation faults (parameter based on [47]).
Energies 16 06873 g006
Figure 7. Annual new registrations and average battery capacities of electric vehicles in Europe (2013 to 2021).
Energies 16 06873 g007
Figure 8. Annual new registrations and average battery capacities of electric vehicles in Europe (2022–2035).
Energies 16 06873 g008
Figure 9. Visualization of the battery return volumes calculation with Weibull parameters.
Energies 16 06873 g009
Figure 10. Annual battery return volume (above) and total battery return volume (below) in battery numbers (left) and in kWh (right).
Energies 16 06873 g010
Figure 11. Distribution of retired battery flows for 2025 and 2030 in Europe, based on expert interviews.
Energies 16 06873 g011
Figure 12. Annual return battery volumes in million kWh for 3R in 2025.
Energies 16 06873 g012
Figure 13. Annual return battery volumes in million kWh for 3R in 2030.
Energies 16 06873 g013
Table 1. Summary of possible failures in a battery system [13].
Actuator Battery PackSensor
  • BMS hardware fault (CAN connections, relays, etc.)
  • Thermal management system fault
  • Contactor fault
  • Aging and inconsistency of cells/modules
  • Overcharge/over-discharge fault
  • Internal and external short circuit
  • Defects
  • Aging
  • Electromagnetic interference
Table 2. Interpretation of shape parameter for Weibull distribution.
Shape ParameterBehavior
β = 1 The exponential reliability function (constant hazard rate) results, with η = 1 / λ , which corresponds with random failures.
β < 1 We obtain a decreasing hazard rate reliability function, which corresponds with early failures.
β > 1 We obtain an increasing hazard rate reliability function, which corresponds with aging failures.
β 3.6 The distribution approximates a normal distribution (PDF), showing that the Weibull distribution can approximate other distributions as well, making it very versatile.
Table 4. Average battery capacities based on the best-selling vehicles and the respective market in Europe.
YearAvg. Capacity (BEV)Share of
Best-Selling Cars
Avg. Capacity (PHEV)Share of Total
201327.1 kWh91%11.5 kWh *80% *
201429.6 kWh97%11.5 kWh99%
201534.6 kWh94%12.0 kWh96%
201636.7 kWh94%10.6 kWh92%
201742.3 kWh90%10.4 kWh68%
201846.8 kWh88%10.0 kWh64%
201953.3 kWh83%12.1 kWh67%
202055.8 kWh62%12.9 kWh38%
202157.9 kWh51%12.9 kWh *26% *
* Only top-5 (2013) and top-7 (2021) data have been available for calculations.
Table 5. Estimated annual and total battery return volumes for BEVs/PHEVs (in 2025 and 2030).
YearBattery Return Volumes
BEVPHEV
2025Annual111,146 pcs.
4,504,121 kWh
110,721 pcs.
4,197,944 kWh
Total271,454 pcs.
10,046,714 kWh
306,036 pcs.
10,442,706 kWh
2030Annual757,619 pcs.
38,056,955 kWh
539,636 pcs.
26,377,840 kWh
Total2,415,738 pcs.
112,795,785 kWh
1,964,189 pcs.
86,754,640 kWh
Disclaimer/Publisher’s Note: The statements, opinions and data contained in all publications are solely those of the individual author(s) and contributor(s) and not of MDPI and/or the editor(s). MDPI and/or the editor(s) disclaim responsibility for any injury to people or property resulting from any ideas, methods, instructions or products referred to in the content.

