1. Introduction
The transportation sector witnessed a substantial growth rate in recent decades and represented approximately 29% of global final energy consumption in 2019 according to [
1], stating also that among all transportation modes, road transportation dominates as the most used, representing approximately three-quarters of both traffic demand and carbon emissions. The accurate measurement and monitoring of fuel consumption in vehicles are crucial for various purposes, including energy efficiency assessment, emission control, and policy formulation. On-board fuel consumption meters have emerged as a promising technology for providing real-time fuel consumption data, enabling drivers, researchers, and policymakers to make informed decisions via regulation [
2] and regulation implementation [
3]. This article aims to contribute to the existing body of knowledge and promote the adoption of OBFCMs as an effective tool for sustainable transportation.
Transportation accounts for a significant portion of energy consumption and carbon emissions in Europe, and requires the development and implementation of effective measures to improve energy efficiency and reduce environmental impacts. Fuel consumption is a key factor in determining the energy efficiency of vehicles, and the accurate measurement and monitoring of this parameter are essential to assess the performance of different vehicle types and optimize energy consumption. OBFCMs are devices integrated into vehicles that enable the reading of vehicle fuel-consumption-related data via OBD; the particular values are described in
Section 2.
The European Union (EU) has recognized the importance of monitoring fuel consumption (FC) and has implemented regulatory directives to standardize the use of OBFCMs. The EU Transport in Figures Statistical Pocketbook [
4] highlights the significance of fuel consumption reduction in achieving sustainable transportation goals. Regulation [
5] emphasizes the approval and market surveillance of motor vehicles, including the implementation of systems such as OBFCMs. Starting in 2021, all newly registered passenger cars within the EU are required to have an on-board fuel and/or energy consumption monitoring (OBFCM) device installed. This device records the amount of fuel or energy consumed by the vehicle, as outlined in a regulation from 2019. According to Regulation 2021/392 (established in 2021), manufacturers are obligated to gather real-world data for new vehicles registered after 1 January 2021. These data can be obtained through direct transfers from the vehicle or during service and repair visits.
Since May 2023, EU member states have been mandated to collect real-world fuel and energy consumption data when vehicles undergo roadworthiness tests, known as periodic technical inspections (PTIs). These data must then be reported to the European Commission on a yearly basis [
3].
Accuracy is one of the crucial factors in the measurement area. The study [
6] analyzed the precision of the measurement of OBFCM fuel consumption simulating real-world conditions. It shows that, for most vehicles, OBFCM fuel consumption was measured with accuracy ±5% (on-road and lab) and that, for most vehicles, OBFCM distance was measured with accuracy ±1.5% (on-road and lab). It is important to note that the accuracy improves for monitoring over longer periods. The data in this paper are obtained only from vehicles from M1 category, for which the accuracy in measuring the fuel consumed is also set by regulation to ±5%.
One can find studies that compare real fuel consumption with the real-world fuel consumption, such as [
7]. One of the primary challenges concerning exhaust emissions and energy consumption tests for cars relates to the discrepancies between laboratory-type approval tests and real road tests [
8,
9,
10]. Typically, the results obtained on the road [
11,
12] exceed those from laboratory tests [
13,
14,
15,
16].
Several factors contribute to these discrepancies, including variations in driving cycles [
17,
18,
19,
20,
21] and traffic resistance encountered during real driving [
22,
23,
24,
25]. Additionally, the car’s performance in urban traffic conditions is heavily influenced by the road infrastructure, such as the type of intersections [
26,
27], energy recovery possibilities during braking [
28], and the driver’s driving style [
29,
30].
OBD, short for on-board diagnostics, serves as an integrated self-diagnostic system integrated within vehicles. The system includes an OBD-II socket and a 16-pin connector typically located near the driver’s wheel, under the dashboard. Its origin traces back to California, where the California Air Resources Board (CARB) enforced stringent emission control regulations and raised awareness regarding emissions control.
Following CARB directives, OBD became mandatory in all cars manufactured after 1991, ensuring the monitoring and regulation of harmful gas emissions [
31]. The significance of OBD-II in the automotive industry lies in its ability to log crucial vehicle parameters, allowing for the analysis and diagnostics of various vehicle systems. Additionally, it facilitates comprehensive fleet management and route optimization [
31].
OBD-II, short for on-board diagnostics version 2, operates on the CAN (controller area network) protocol. This protocol allows vehicles to connect with OBD scanners and scanning tools externally. These scanners, which can be connected to PCs or laptops, provide users with access to valuable information from the vehicle’s onboard computer. This information includes driving speeds, engine speeds, coolant levels, coolant temperature, emission control, idle time of the engine, and other essential engine-related data [
32].
As mentioned in the introduction, according to [
3], the OBFCM data must be read from vehicles as part of PTI. In 1935, the Slovak Republic, which was a part of Czechoslovakia at the time, made its initial effort to implement mandatory periodic technical inspections (PTIs). Today, nearly all vehicles in Slovakia are obligated to undergo these inspections. The article primarily focuses on category M1 vehicles, which are passenger cars with four wheels. Such vehicles must undergo the PTI within four years from their first registration and subsequently every two years thereafter.
However, certain vehicles have specific requirements for PTI. Those used for medical emergency services or mining rescue services, equipped with priority driving rights, along with ambulance vehicles, vehicles used for gas facility maintenance, and vehicles used for taxi services are required to undergo PTI annually. Therefore, taking into account also the date from which the OBFCM device became mandatory in the new cars, most of the vehicle data presented in this paper are from the group of vehicles required to undergo PTI annually.
It is worth noting that PTI intervals are similar among the member states of the European Union, and Slovakia follows this trend.
Furthermore, in Slovakia, emission checks are carried out as a separate and distinct inspection procedure.
The article presents the results obtained by field testing the OBFCM reading feature of the mSTK mobile app available at [
33]. The field testing started in May 2022. Nevertheless, this application has been utilized in PTIs in Slovak Republic for OBD reading since 2021; in other words, it has been mandatory to use this app for OBD reading at all PTIs in Slovak Republic since 2021. The OBFCM data are obtained from the car via the OBD port using a standard diagnostic session by an OBD request defined in [
34], so implementing this feature was an expansion of the well-established feature of the already existing app. The OBFCM device is mandatory for cars in the EU with type approval from 2019. Therefore, there are not many cars that have this device ready for the PTI inspection; usually, these are cars that are being used as a taxi or emergency vehicles, etc. However, over the 9-month period, more than 1000 cars with the OBFCM device have been successfully read at PTI service stations in the Slovak Republic. The goal of this paper is to present the data obtained during OBFCM reading field tests in an engaging and informative way for the reader, such as fuel consumption and reading success, while adhering to all applicable data protection laws.
In
Section 2, we will present how and which OBFCM data were obtained in this study, and we will also provide information on the dataset. In
Section 3, the gathered data are presented in several ways. In
Section 4, the statistical properties of the data are analyzed and extreme values are linked to particular vehicles. Also, the fuel consumption gap is analyzed for hybrid vehicles and internal combustion vehicles. The yearly statistics are provided regarding OBFCM reading success rate. In
Section 5, the results are summarized.
2. Materials and Methods
The OBD reading during the PTIs in Slovakia is made by using a smartphone app and a low-end OBD reader. The utilization of this process, together with its benefits and results, was described in [
35]. The mSTK Android mobile application was developed in Java programming language in partnership with TESTEK a.s., a joint stock company providing vehicle inspection services for the Slovak Ministry of Transportation.
The data required by the European Commission via [
3] to be collected and submitted starting on 20 May 2023 are the following:
Total distance traveled (lifetime);
Total fuel consumed (lifetime);
Total distance traveled in charge-depleting operation with engine off (lifetime);
Total distance traveled in charge-depleting operation with engine running (lifetime);
Total distance traveled in driver-selectable charge-increasing operation (lifetime);
Total fuel consumed in charge-depleting operation (lifetime);
Total fuel consumed in driver-selectable charge-increasing operation (lifetime);
Total grid energy into the battery (lifetime).
Among the other features described in [
35], the application reads the OBFCM data via the ELM327 OBD reader [
36], providing a very cost-effective solution.
The major benefit lies in using this cost-effective yet straightforward, and already proven to be reliable, technology. The OBFCM reading is an expansion of the already existing application by new OBD requests for the OBFCM reading. The only barrier is that it does not use freely available OBD requests. However, the OBD requests for OBFCM are standardized in [
34], so the reading process is the same for each vehicle that has an OBFCM device implemented. After the successful read, the data are sent to national database. Every vehicle of the
category has been requested for OBFCM data during PTIs during the 9-month field testing period [
37].
The necessary OBFCM data are regarded as personal information, thus affording the vehicle owner the choice to opt out of sharing OBFCM readings. Additionally, a switch is incorporated within the mobile application’s reading activity screen, allowing PTI inspectors to deactivate this function while still retrieving other essential OBD data like diagnostic trouble codes. This design ensures that owners have control over their data privacy while enabling the collection of crucial vehicle information. The mobile application refrains from retaining any data on a local basis; instead, it promptly transmits the information to the national PTI database. The OBFCM data are not shown on the display to the inspector either. This approach serves as a safeguard, ensuring that the personal data of car owners remain secure.
3. Results
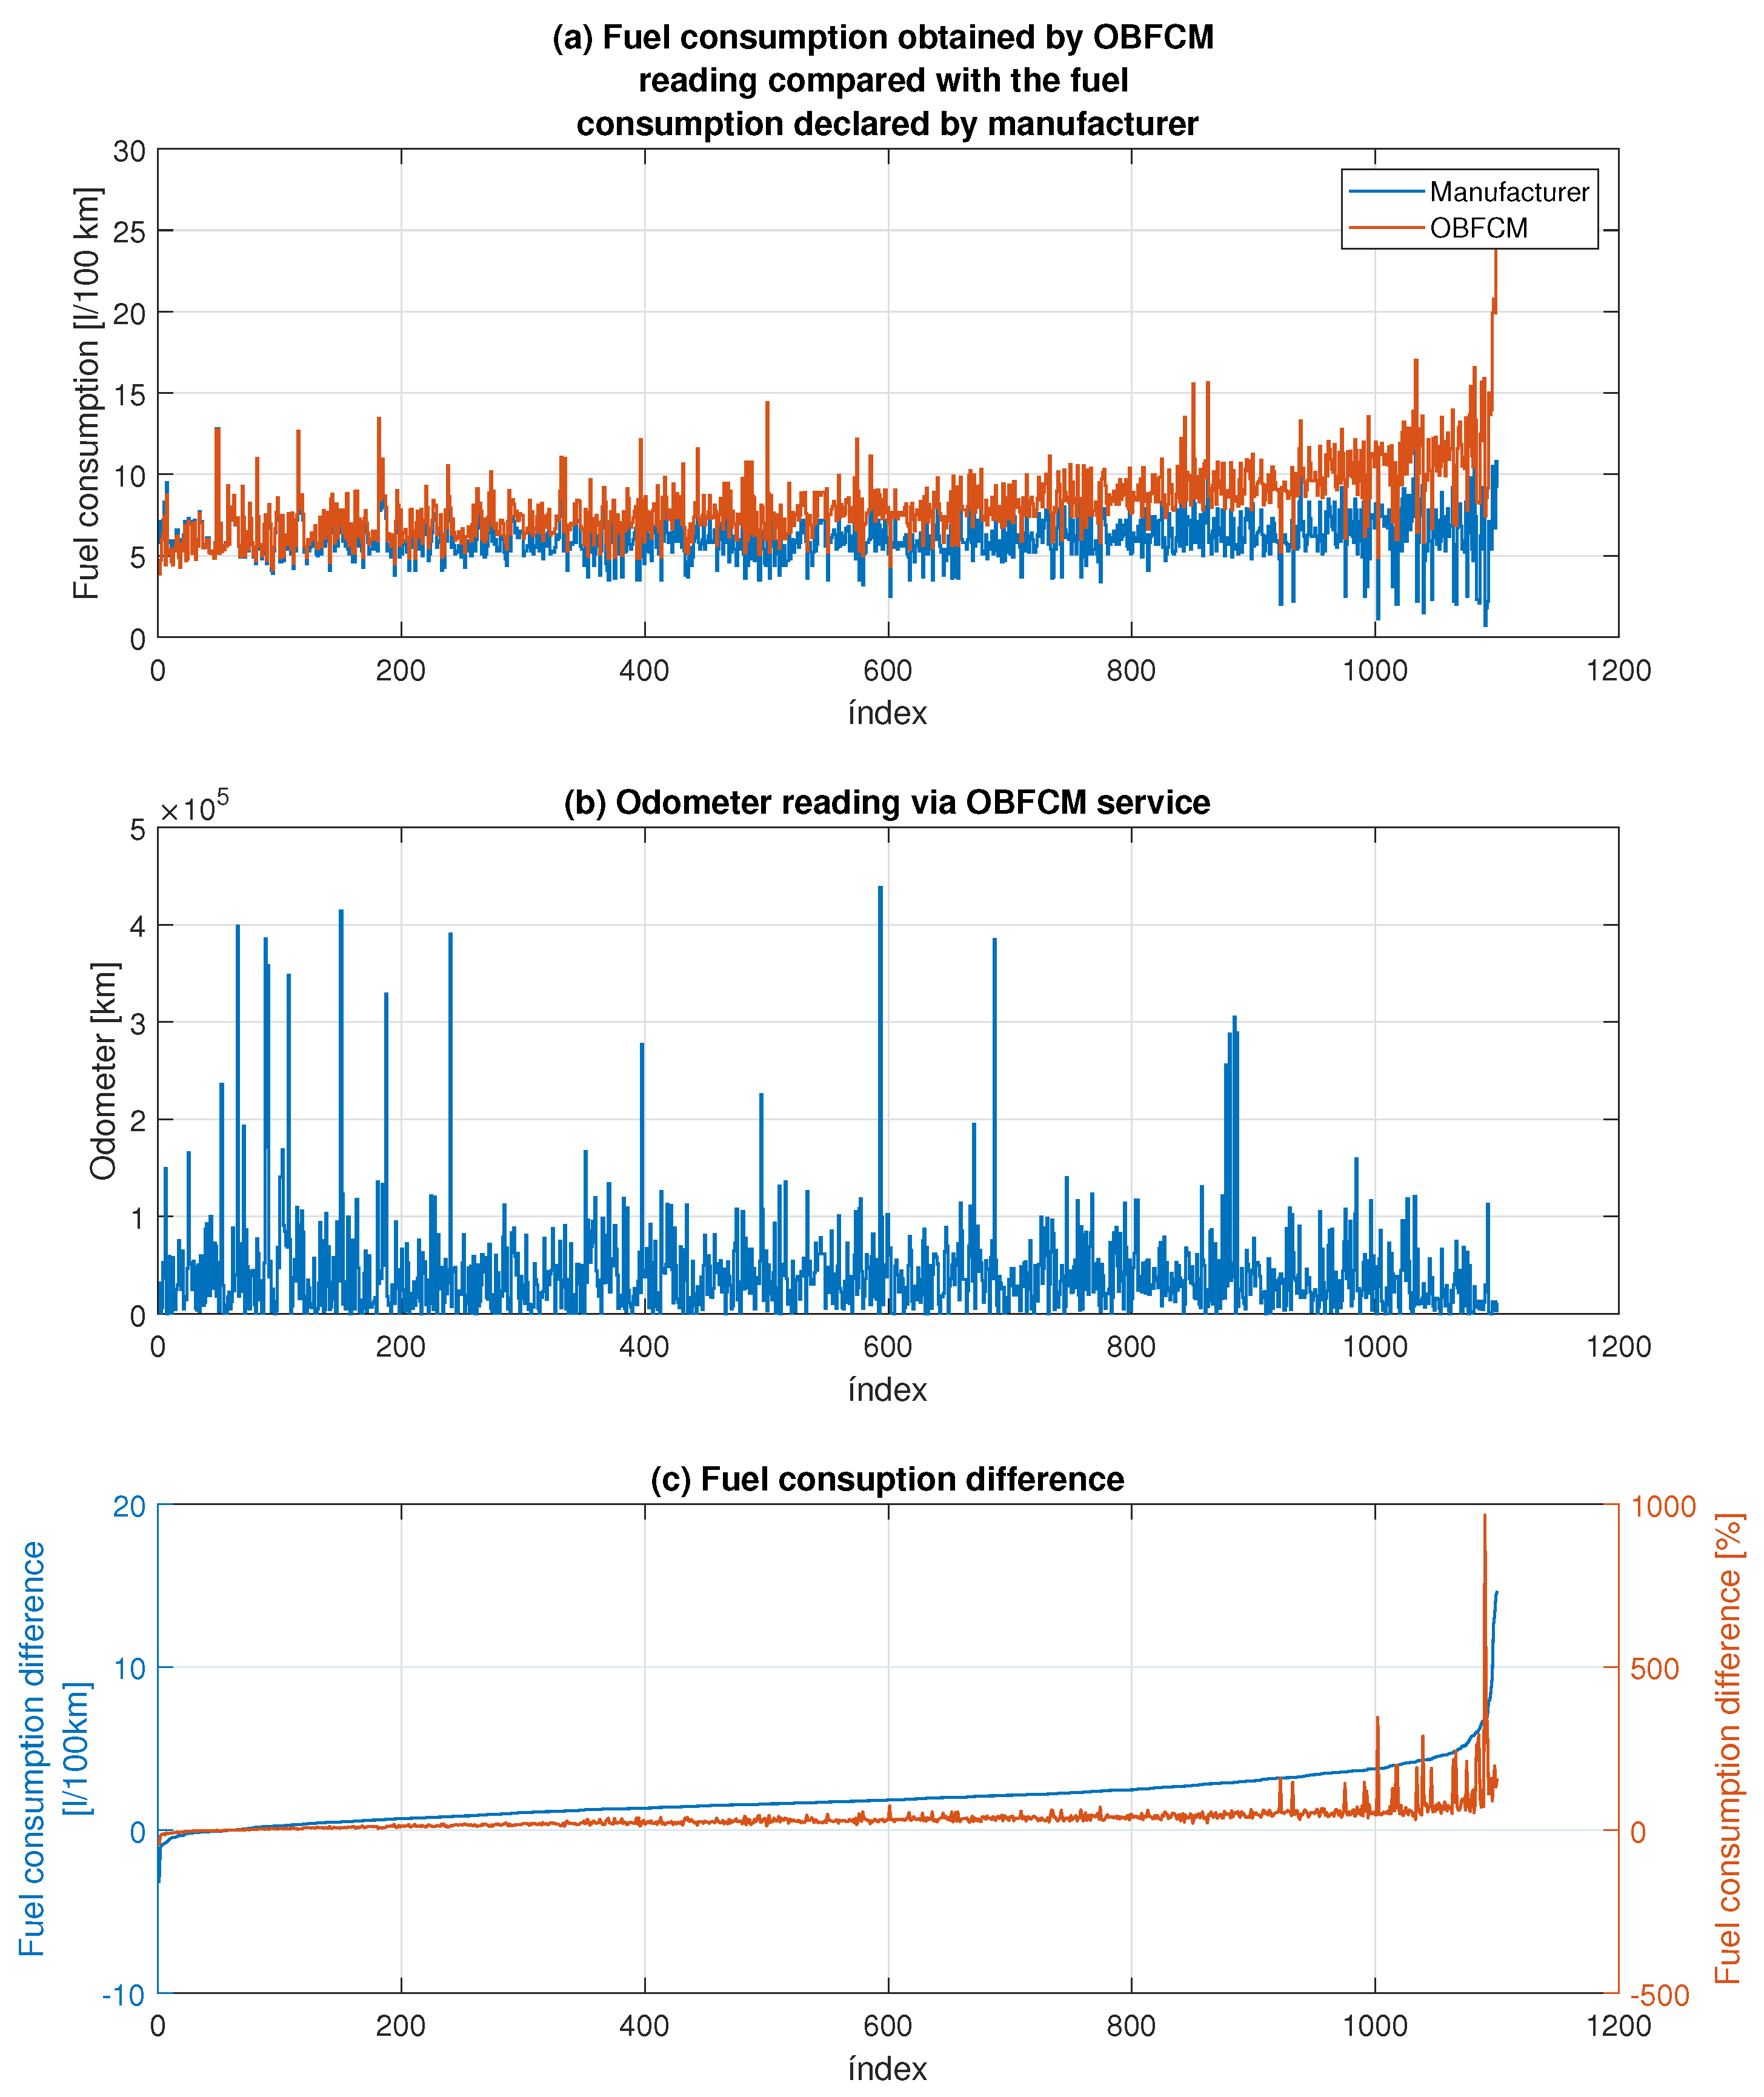
Figure 1 presents chronological readings in three graphs to give the reader an overview on how the data are distributed over time. Panel (a) displays fuel consumption data obtained through the OBFCM reading (depicted by the red line) along with the manufacturer’s declared fuel consumption. Panel (b) illustrates the corresponding odometer values, also gathered from the OBFCM reading request. Lastly, panel (c) showcases the difference between the declared and measured fuel consumption in [L/100 km] (in blue) and relative to the one declared by the manufacturer in [%] (in red).
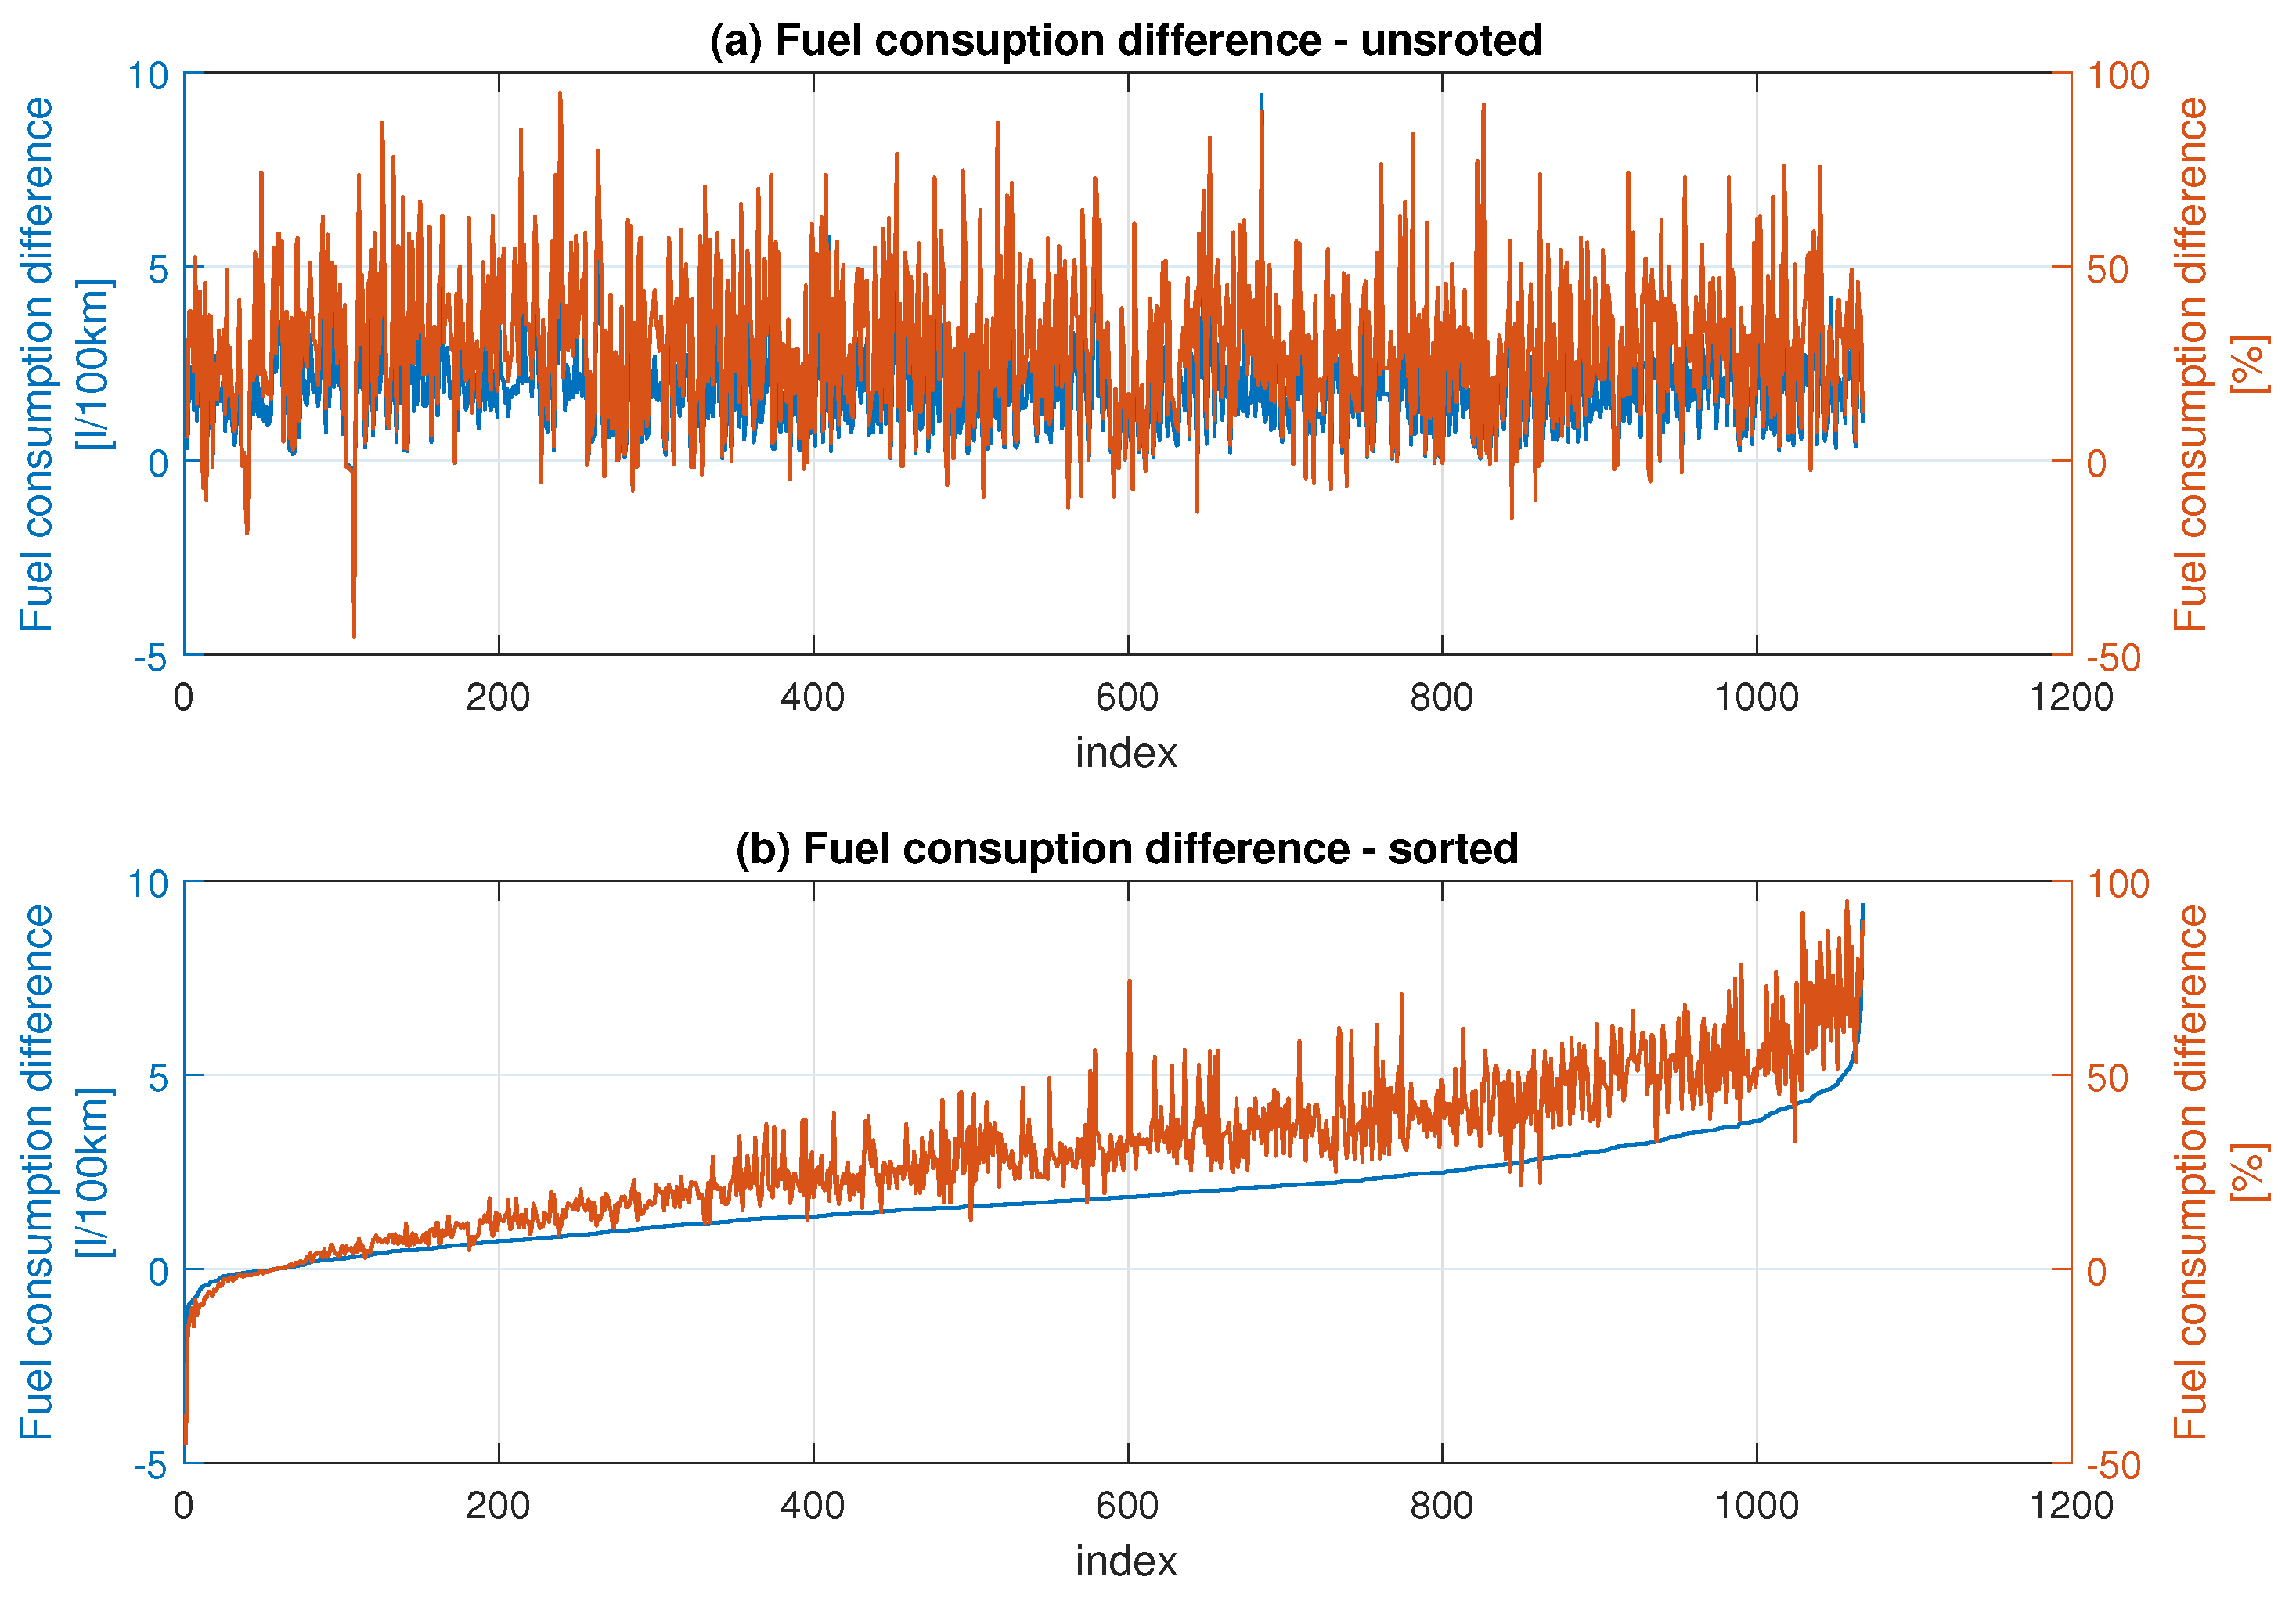
Figure 2 represents the same data as
Figure 1, but the data are sorted by the difference in fuel consumption, with the average value of
[L/100 km]. The study [
38] states that the average fuel consumption gap can be accurately estimated with a sample of less than 0.05% of the fleet. The total number of passenger vehicles registered in Slovakia is 2,627,983 according to [
39], where
of total cars yields 1314 cars. The article presents a dataset containing a substantial total of 1100 car records. Although this figure falls 27% below the established threshold, it remains noteworthy and interesting to the readers. Although the size of the dataset does not reach the threshold, it is still substantial enough to pique the interest of those engaging with the study.
The total number of vehicles in this paper is 1100, and only 57 readings, approximately 5.2%, were below the manufacturer declared values. The highest gap was
[L/100 km] and the lowest gap was
[L/100 km]. In terms of relative gap, the maximum was 966.1867%, while the minimum was −45.3823%. The average relative fuel consumption gap in the study was 35.0474%.
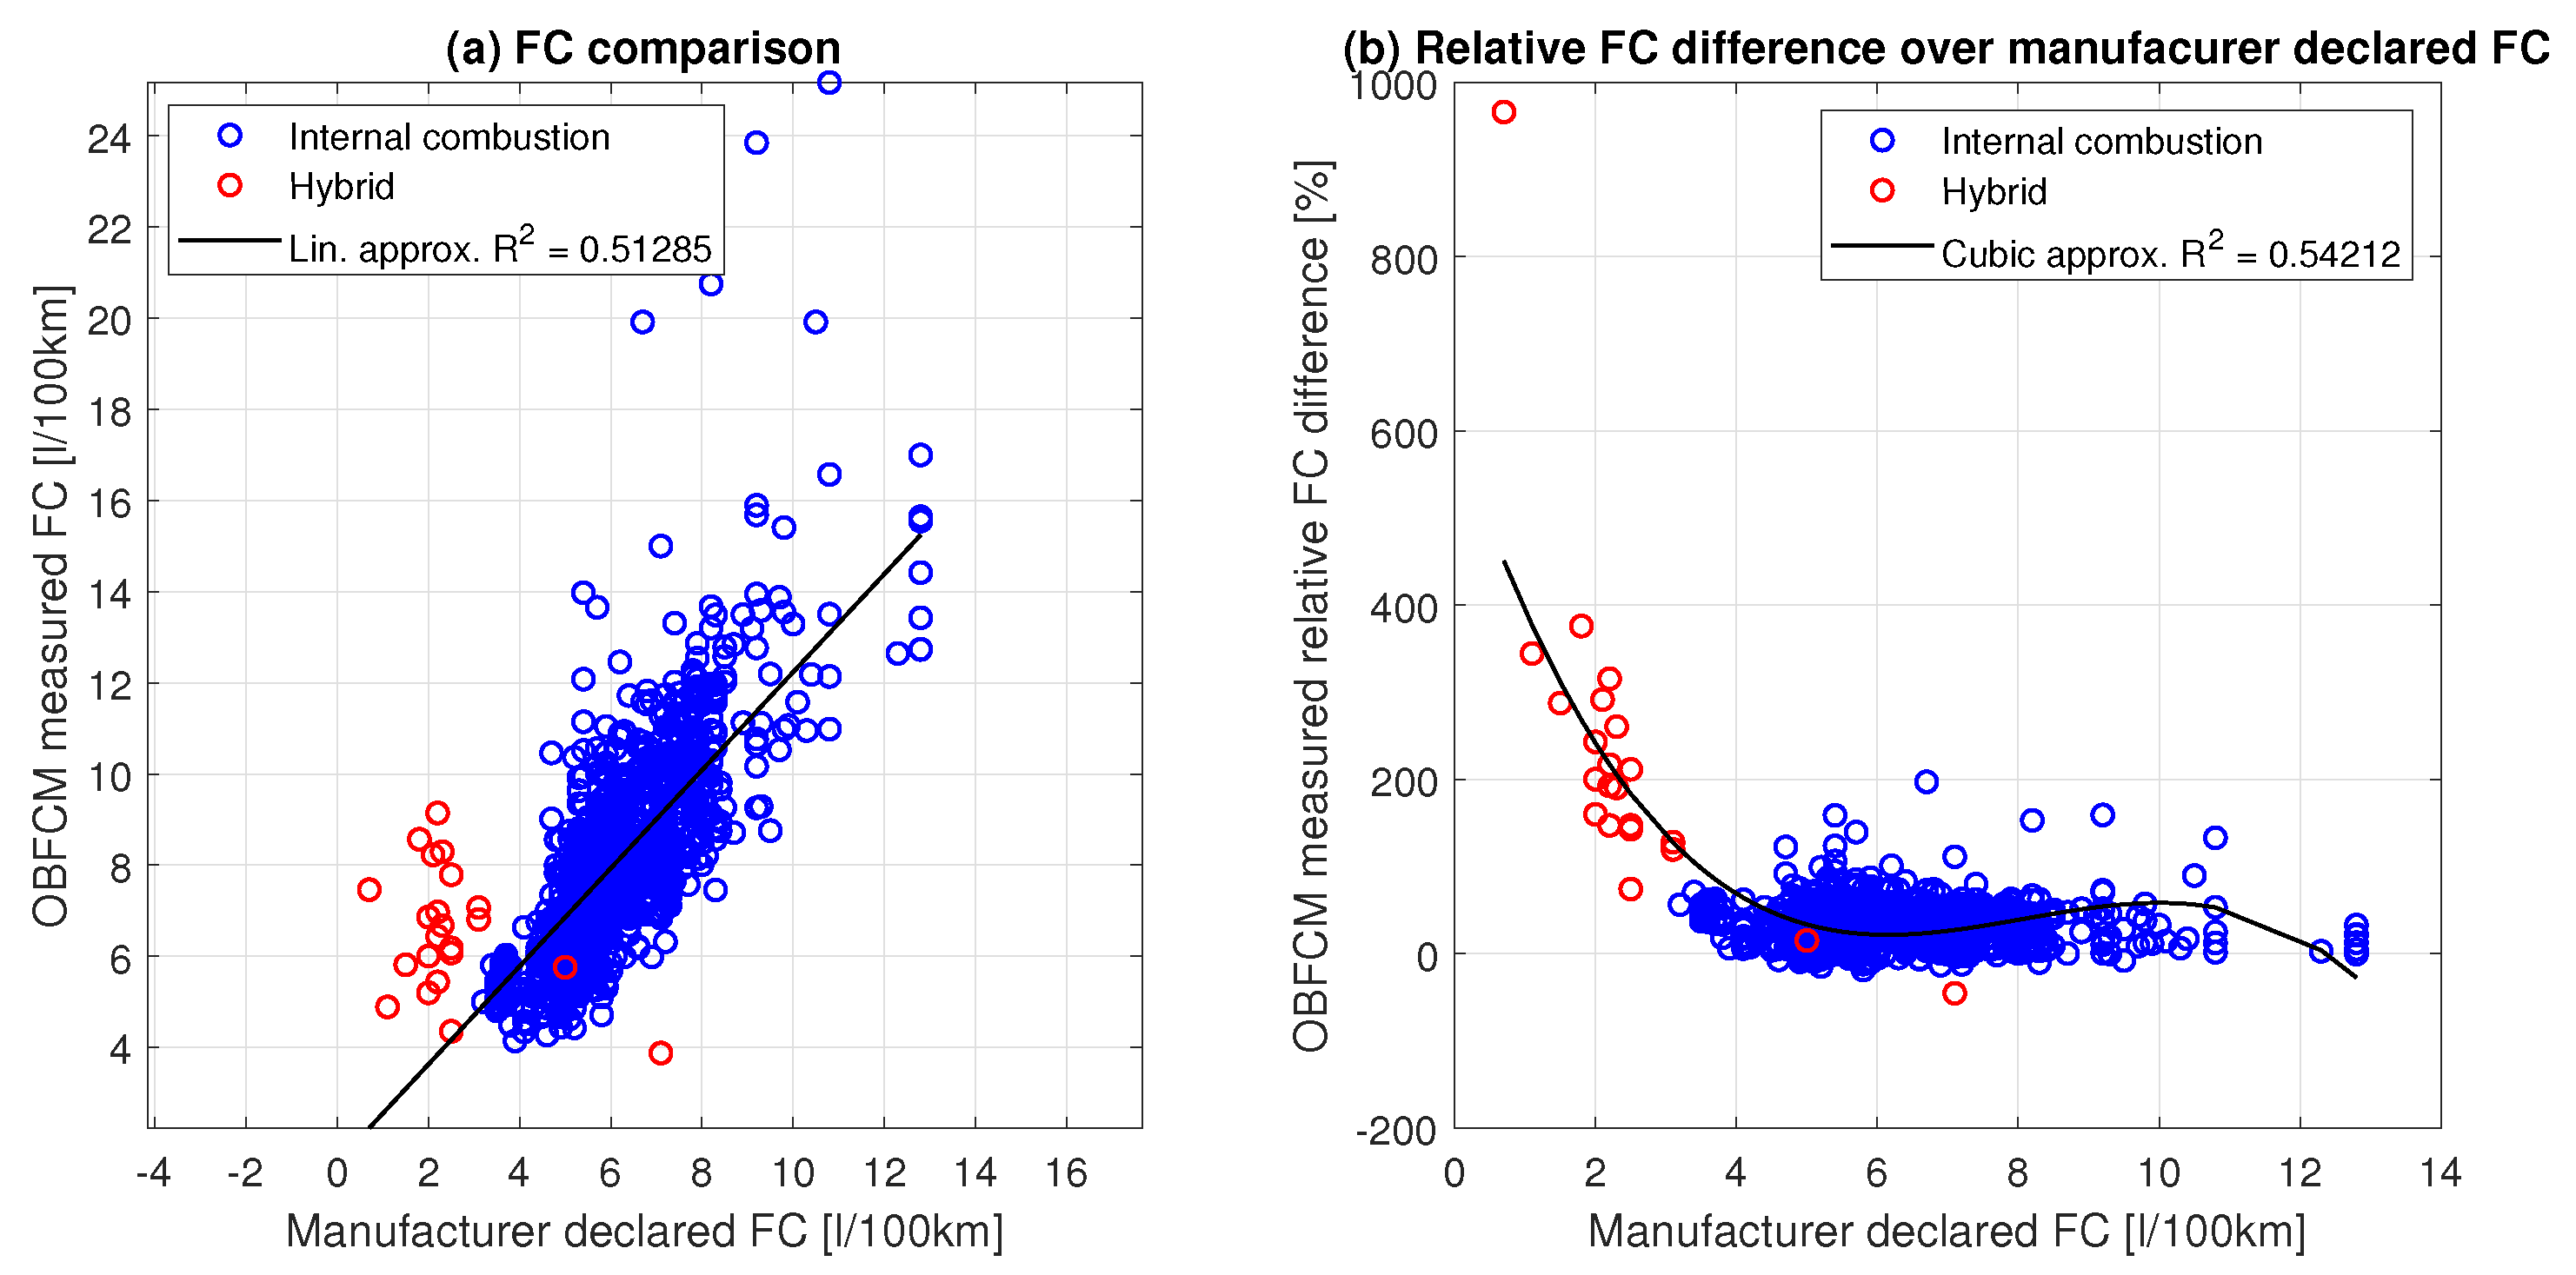
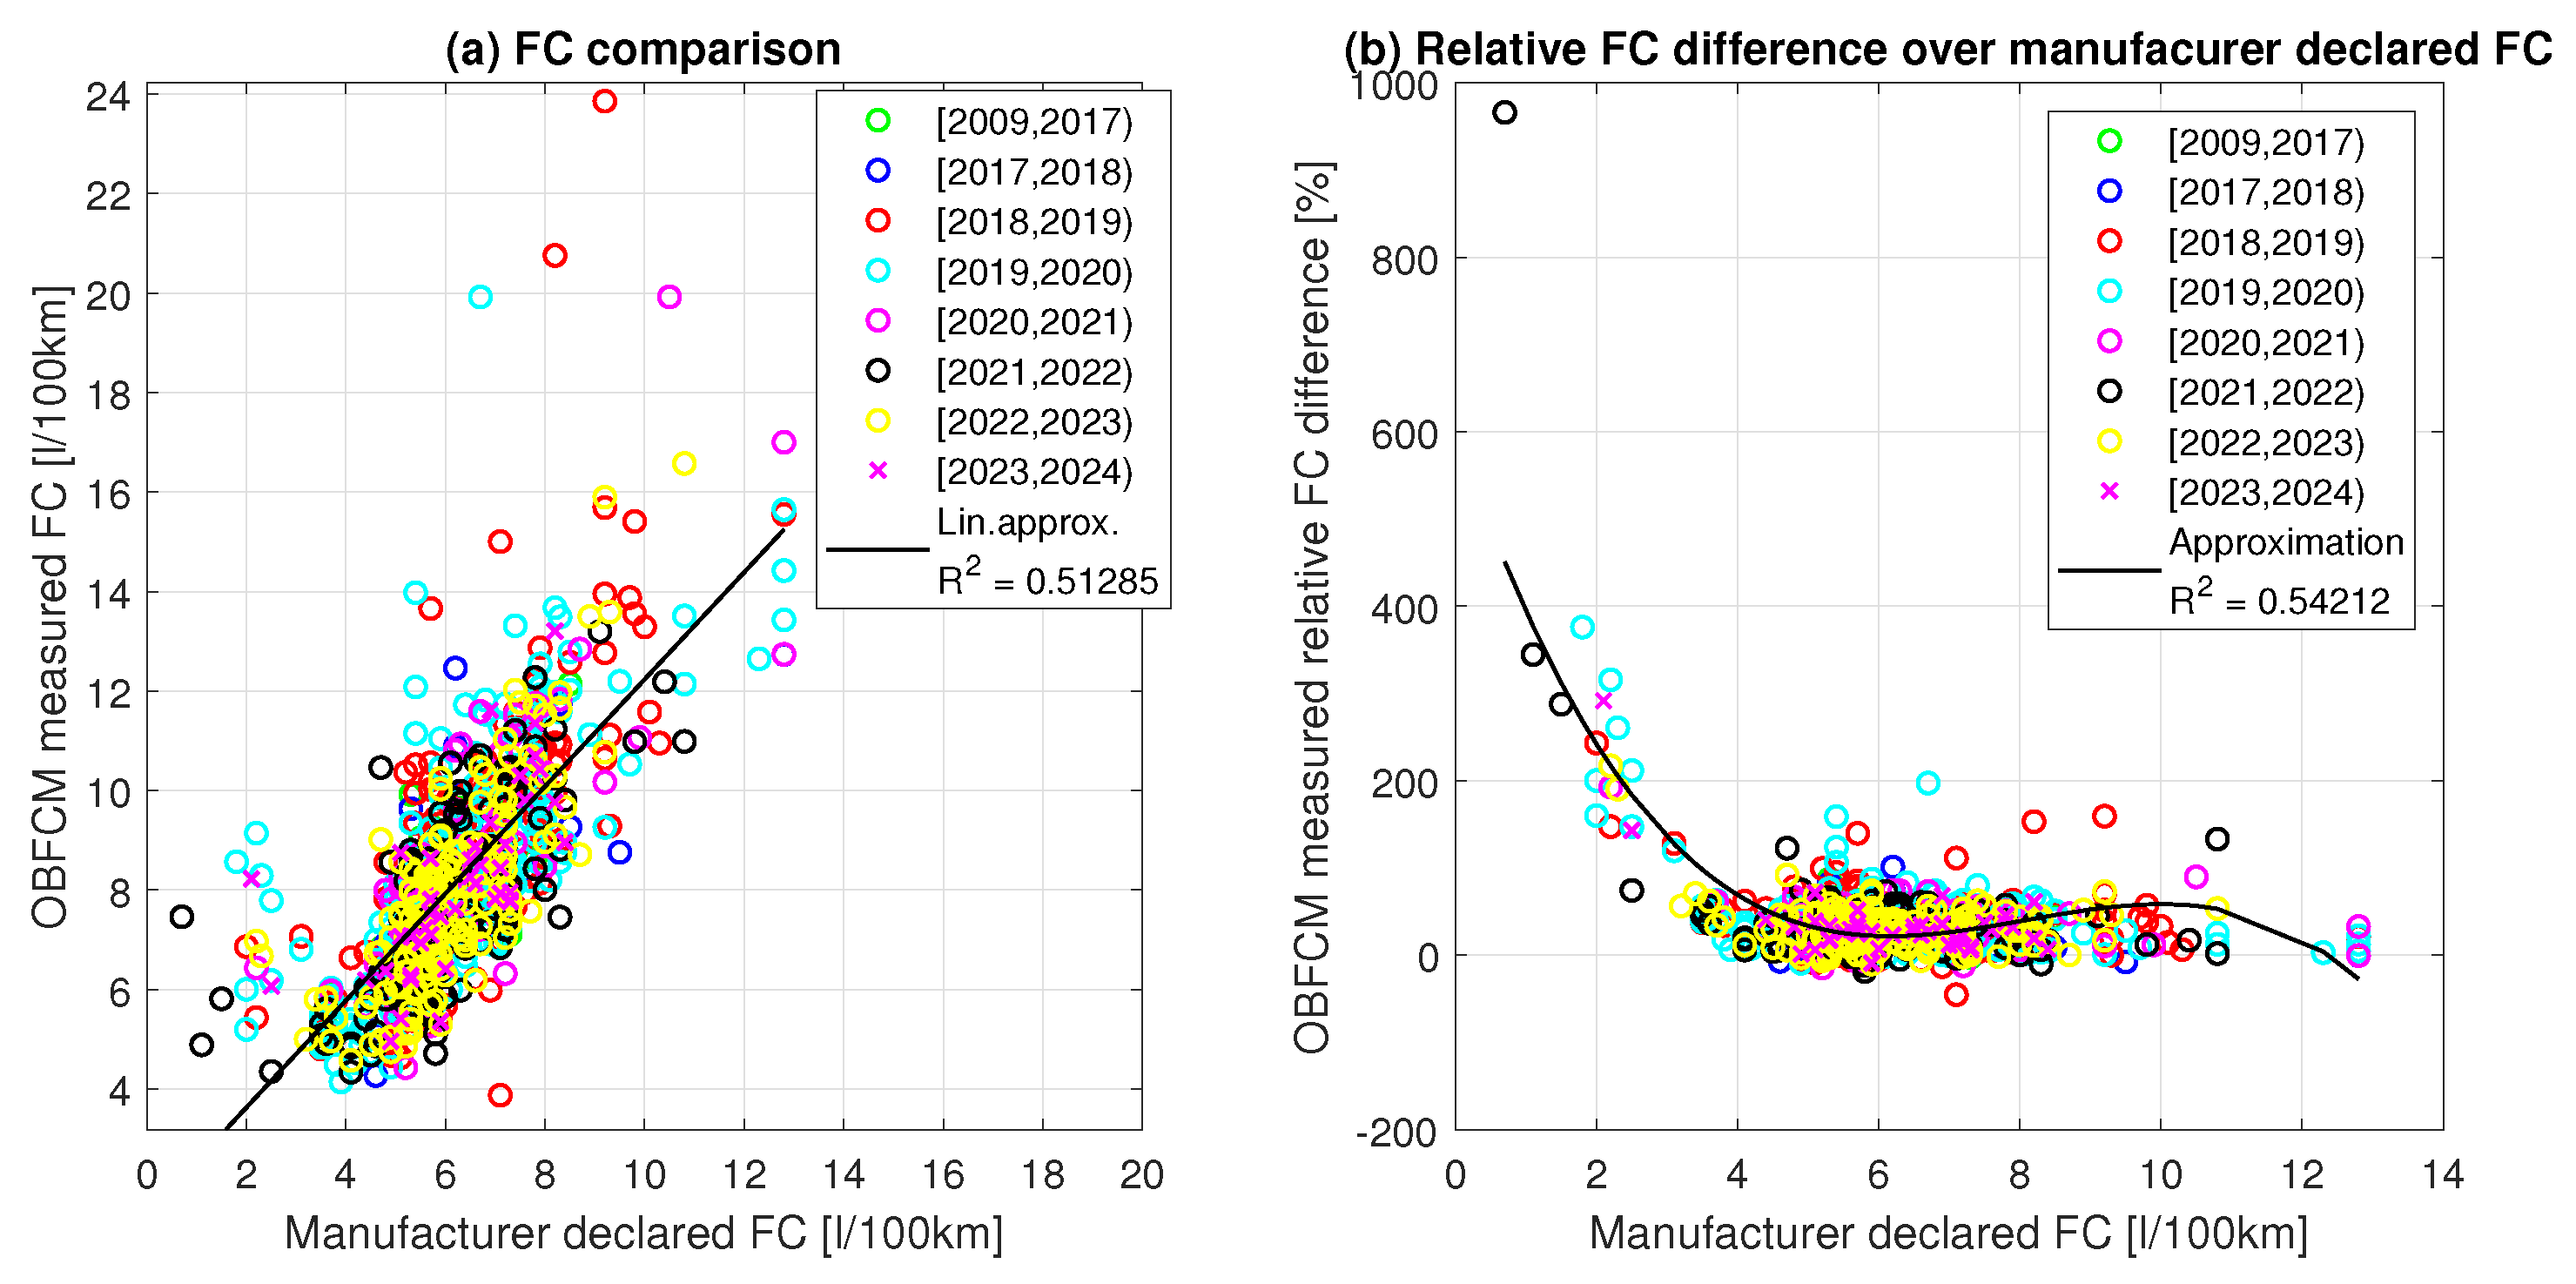
Figure 3 in panel (a) shows the comparison of fuel consumption declared by the manufacturer vs. the fuel consumption obtained via the OBFCM. One can see the hybrid vehicles data mostly in the lower left corner, where almost all of them are above the linear approximation. This indicates that most of the hybrid vehicles presented have a higher fuel consumption than what is declared by the manufacturer. In panel (b) of
Figure 3, one can find the relative fuel consumption difference over the manufacturer-declared fuel consumption. It is obvious that the presented hybrid cars have the most relative difference in real and declared fuel consumption.
The results of the study suggest that there is a significant amount of variation in the manufacturer’s declared fuel consumption and the measured values. This is shown by the linear regression results presented in
Figure 3a, which have a mean value of
and a standard deviation of
.
Figure 4 in panel (a) shows a fuel difference histogram fitted by normal distribution with mean value
and standard deviation
. Panel (b) of
Figure 4 presents a difference histogram fitted by logistic distribution with mean
and scale parameter
. The bottom part of
Figure 4 in panel (c) shows a relative fuel difference histogram fitted by normal distribution with mean value
and standard deviation
, and panel (d) presents a relative fuel consumption difference histogram fitted by logistic distribution with mean
and scale parameter
.
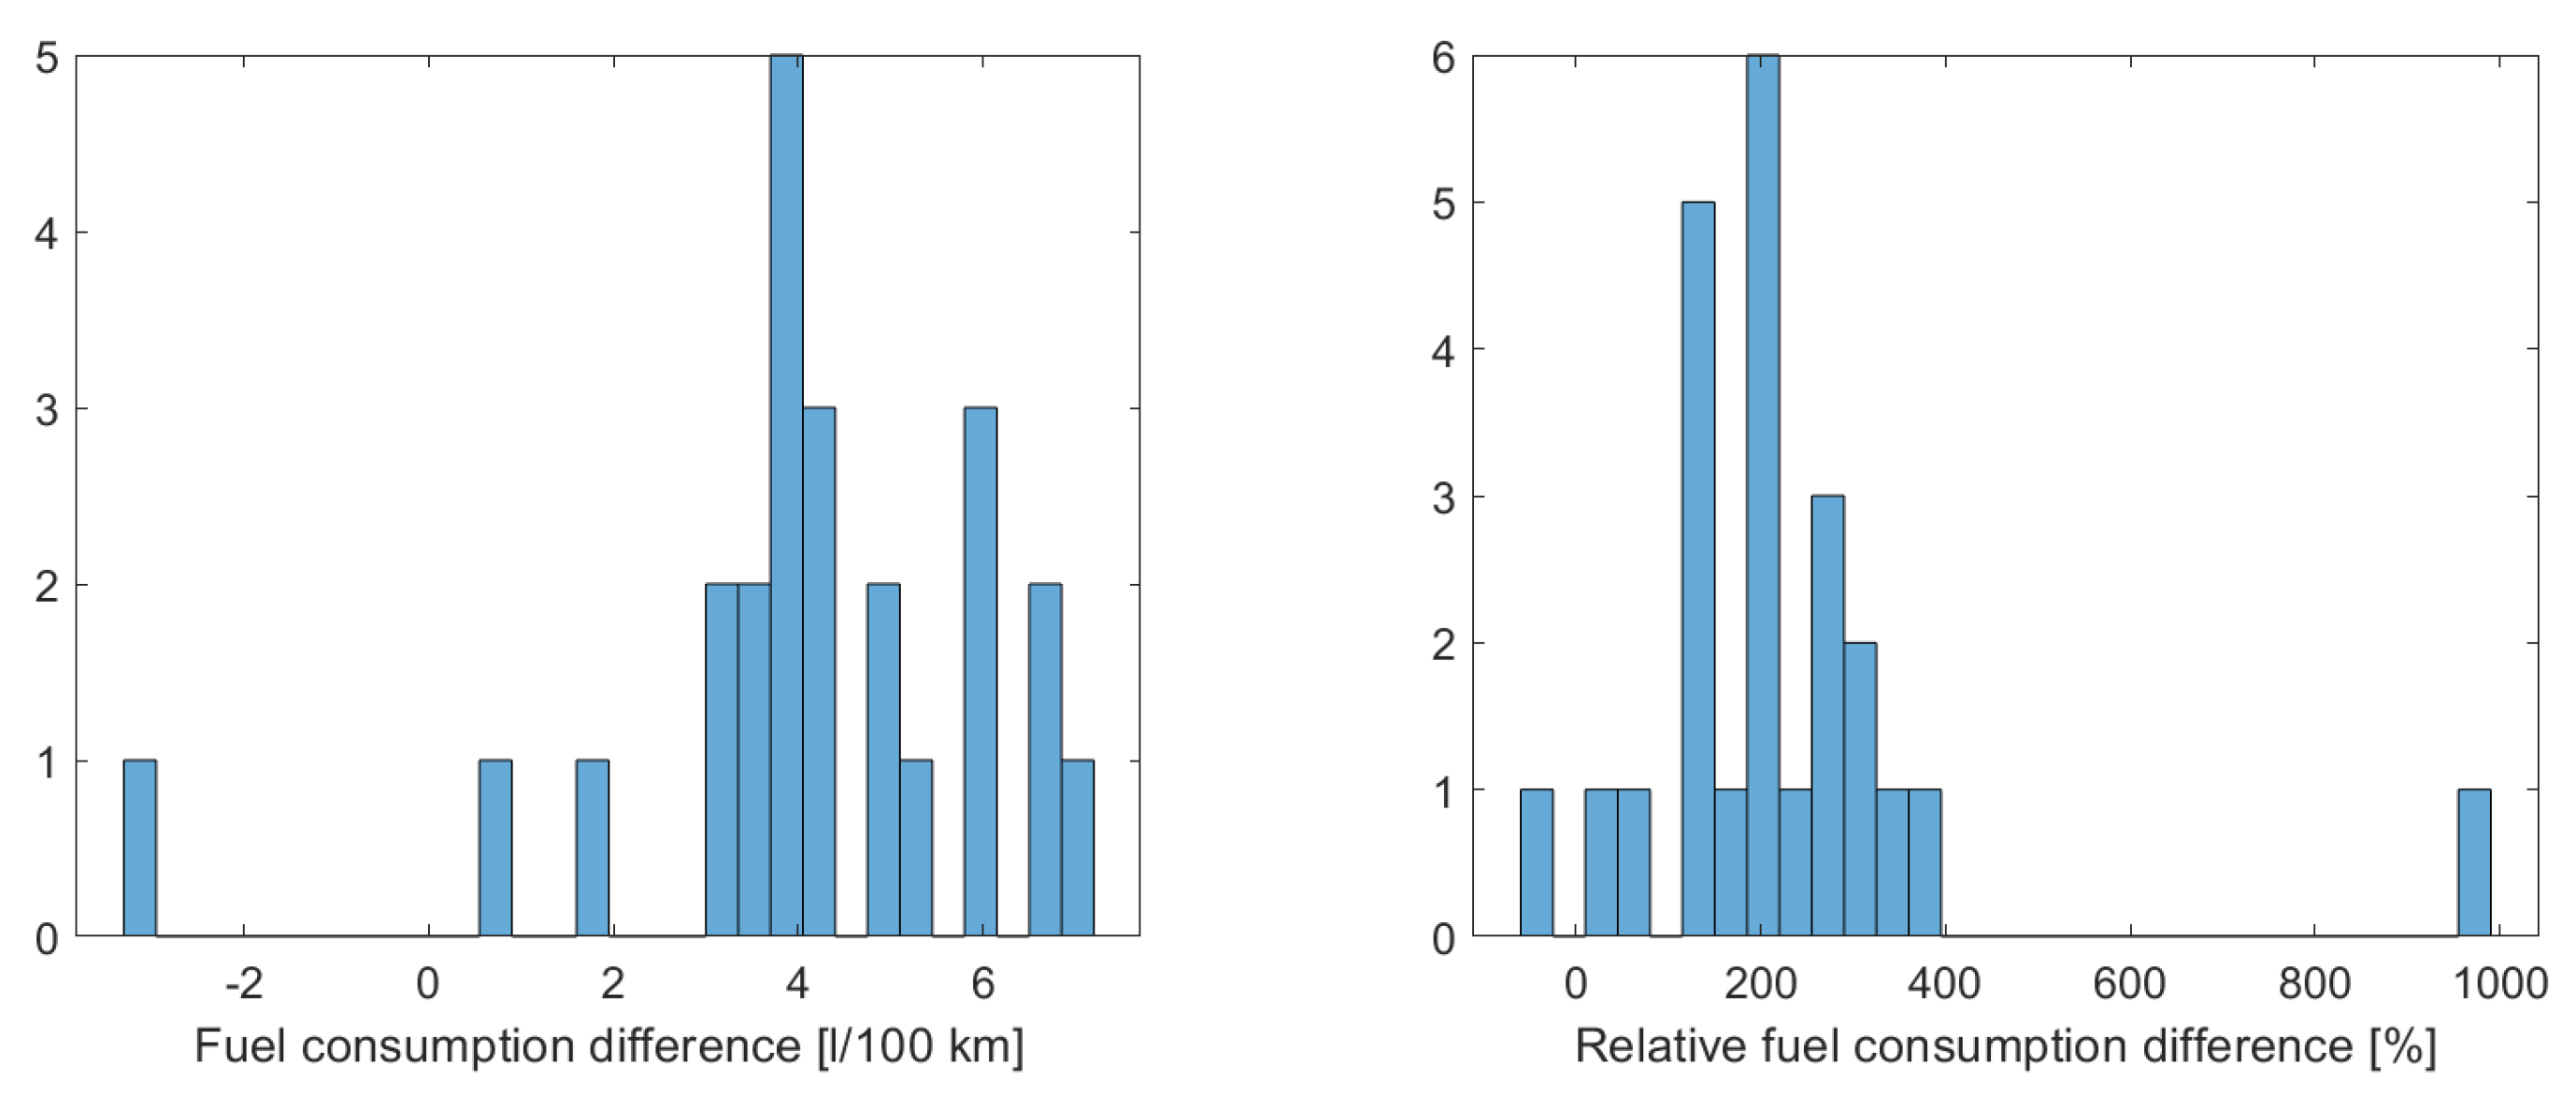
Only 24 of the data presented were from vehicles that had hybrid propulsion. This corresponds to the low penetration of electric cars in the Slovak Republic. The mean gap in fuel consumption with the declared value of the manufacturers of these hybrid vehicles was
[L/100 km]. However, only one hybrid vehicle recorded a lower fuel consumption than the manufacturer declared, as shown in the histogram in
Figure 5.
4. Discussion
The highest fuel consumption gap amongst hybrid vehicles was
[L/100 km], which is about 50% of the average difference in all vehicles group. However, the mean fuel consumption difference amongst hybrids corresponds to 215% of the average of the all-vehicles group’s mean fuel consumption difference.
Table 1 summarizes the comparison of these two groups of vehicles included in our study. The results of laboratory and road tests of vehicles can differ significantly due to a number of factors, including the driving cycle and road load. These parameters also affect the hybrid drive control, which can switch between the combustion engine and electric mode [
40].
Most studies of vehicle emissions and fuel consumption use type approval cycles, such as the NEDC, WLTC, or FTP. These cycles are designed to be repeatable and fair, but they do not always reflect real-world driving conditions. For example, they often do not include stop-and-go traffic or high speeds.
As a result, the results of laboratory tests can be significantly different from the results of road tests. This is because the actual driving cycles on the road are unrepeatable and can vary depending on the driver, the traffic, and the weather [
8].
The maximal relative fuel gap from
Table 1 corresponds to almost nine times the fuel consumption declared by the manufacturer. The corresponding car was a plug-in hybrid sport utility vehicle (SUV) with an approximately 2.0 L diesel engine. The manufacturer-declared fuel consumption is
L/100 km. The odometer of the car reads 29,467.5 km. The data read from the OBFCM of this particular vehicle are in
Table 2.
The only hybrid car with a negative relative fuel difference corresponding to almost one half of fuel consumption declared by the manufacturer was a hybrid small family estate with an approximately 1.6 L petrol engine. The manufacturer-declared fuel consumption is
L/100 km. The data read from the OBFCM of this particular vehicle are in
Table 3.
The car with highest fuel consumption gap in this paper is a 3.0 L petrol sporty compact saloon, with a declared fuel consumption of 9.2 L/100 km. The data read from the OBFCM of this particular vehicle are in
Table 4.
As can be seen, the data contain several cars with an extremely high relative fuel consumption gap. In
Figure 6, the fuel gap is represented without vehicles, where the relative fuel gap is outside the range of
%. Removing these 33 vehicles also shifts the overall statistical values presented in
Table 5, showing a 0.1357 L/100 km decrease in the mean fuel consumption gap, corresponding to −5.4855%; in other words, the new mean relative fuel consumption gap in the dataset is 29.5619%.
Another interesting statistic for the reader can be the yearly percentage of successful OBFCM readings, which is represented in
Table 6. It shows that some of the cars have been equipped with the OBFCM device much earlier than required by the authorities; however, the percentage of successful readings before 2014 is quite low, lower than 50%. The overall percentage of data validity is approximately 76%. In the remaining 24%, the data showed the fuel or energy consumption gap by several orders of magnitude; these data were not taken into account in the paper, and only 1100 records of 1434 were considered in the results presented. The resulting fuel consumption gap around 35% corresponds to similar research based on users’ feedback data collection [
41] or laboratory-measurement-based tests such as [
42].
In
Table 7, the statistics are grouped by the displacement size of the engine. Still, in all groups, the OBFCM-obtained fuel consumption is more than
above the nominal one.
Figure 7 presents the fuel consumption and relative fuel consumption difference represented by the groups from
Table 7. One can see that the vehicles with the largest relative fuel consumption gap are with engine sizes
ccm. The lowest mean relative fuel consumption gap can be found in the group of vehicles with engine sizes from
ccm.
In
Table 8, the statistics are grouped by the year of registration. Vehicles from the interval [2009–2017) are grouped due to the low number of cars per year in that period, as can be seen from
Table 6. However, in all groups, the fuel consumption obtained from the OBFCM is more than
above the nominal one.
Figure 8 presents the fuel consumption and relative fuel consumption difference represented by the groups in
Table 8. There is no significant correlation between the fuel consumption gap and the year of vehicle registration, with a correlation coefficient of
.
There is no significant correlation (correlation coefficient of ) between the fuel consumption gap and the year of vehicle registration.
The analysis of relevant data from 1100 vehicles shows the 35% gap between the fuel consumption declared by the manufacturers and the fuel consumption obtained by the OBFCM, which is similar to consumer-feedback-based studies [
41,
42].
The summary of comparisons with the fuel gap from other studies can be found in
Table 9. The datasets denoted as TC2018, TC2019, TC2020, SM2018, and SM2019 are from a feedback-based study [
38]. The dataset denoted as CH2016 is based on customer feedback in China from 2016. Detailed information about the values in the dataset denoted as E2020 can be found in the study [
14], which is based on one-year measurements using a single vehicle with 20 drivers.
5. Conclusions
This paper highlights the results of an extensive field testing of OBFCM data collection from all PTI stations in the Slovak Republic, which took place from August 2022 to April 2023. Mobile applications with low-cost OBD readers were successfully implemented for this purpose.
One of the goals was to analyze the reading success rate of OBFCM devices, which presents the readiness of the devices. Approximately 1 million vehicles were tested at PTI stations during this period, and approximately 1500 had an OBFCM device. Of these, only 1100 provided consistent data, which were taken into account in the further data analysis.
The study presented a fuel consumption gap of 35%, which is similar to other studies discussed in
Section 4. No correlation between the year of registration and fuel gap has been found in the data obtained by this study.
It is worth noting that the data primarily originated from vehicles with specific purposes, such as taxis and emergency vehicles, potentially influencing driving styles due to the specialized nature of these vehicles’ operations. However, it is important to consider that all vehicles were subjected to genuine real-world conditions under the ownership of their respective drivers, with no synthetic testing employed. This brief report summarizes the findings of a study, but does not draw any definitive conclusions. Further research is needed to confirm the results.


