Article

Mechanical and Acoustic Response of Low-Permeability Sandstone under Multilevel Cyclic Loading-Unloading Stress Paths

1
State Key Laboratory of Coal Mine Disaster and Control, Chongqing University, Chongqing 400044, China
2
State Key Laboratory of Geomechanics and Geotechnical Engineering, Institute of Rock and Soil Mechanics, Chinese Academy of Sciences, Wuhan 430071, China
3
University of Chinese Academy of Sciences, Beijing 100049, China
4
Key Laboratory of Underground Storage of Oil and Gas Engineer of China National Petroleum Corporation, Langfang 065007, China
*
Author to whom correspondence should be addressed.
Energies 2023, 16(19), 6821; https://doi.org/10.3390/en16196821
Submission received: 4 August 2023 / Revised: 13 September 2023 / Accepted: 21 September 2023 / Published: 26 September 2023

Abstract

:
Low-permeability sandstone reservoirs have been widely used as a gas storage medium worldwide. Compared with the high porosity and high permeability of sandstone, low-permeability sandstone may present different mechanical (deformation, damage or failure) and acoustic responses under cyclic loading-unloading processes caused by the high-rate injection–production of underground gas storage. In this paper, multistage triaxial loading–unloading tests with a continuously increased upper limit of stress were carried out on low-permeability sandstone under six different confining pressures. The results showed that the superposition of stress–strain curves become much denser in the process of each level of stress. Based on the variation of the elastic modulus of low-permeability sandstone under alternating loads, the mechanical behavior of low-permeability sandstone under cyclic loading is divided into three stages: cyclic hardening, stability and cyclic softening. According to the evolution of acoustic emission (AE) signal parameters, AE counts appear intensively at the initial stage of each level of stress and then gradually stabilize. The peak frequency presents the zonal distribution, which is divided into low-frequency, intermediate-frequency and high-frequency zones. Low confining pressure leads to a small b-value. The RA–AF distribution implies that the mixed tensile–shear cracks are continuously generated in low-permeability sandstone during the cyclic loading process, and the shear cracks are more obviously developed.

1. Introduction

Sandstone is the main lithology type of depleted natural gas reservoirs converted into underground gas storage (UGSD), accounting for more than 60% of UGSDs [1,2,3]. The operation of UGSDs is characterized by cyclic high-rate injection and production of natural gas and frequent perturbation in the local stress state, which may strengthen the damage to the sandstone structure and affect the operation efficiency of the storage [4,5,6,7,8]. Therefore, it is important to study the effect of cyclic injection and extraction of gas in sandstone reservoirs on the damage evolution and development of fractures [9,10,11,12].
In recent years, extensive work has been carried out to study the mechanical behavior response of sandstone under complex stress paths [13,14,15]. Through a large number of experiments, it was found that the loading frequency [16], amplitude [17], stress level [13] and other factors of cyclic loading will affect the deformation behavior of sandstone. In addition, compared with simple cyclic loading, the current research pays more attention to the influence of multifactor synergy on the rock response, including temperature [18], crack angle [19], dry–wet cycles [20], confining pressure [21], permeability [22], etc. Many researchers have studied the mechanical response of reservoir low-permeability sandstone under complex stress paths [23,24,25,26]. However, research on cyclic loading under multistage constant amplitude cyclic loading at different formation depths (different confining pressures) is still limited.
The deformation characteristics of rocks during cyclic loading are difficult to monitor in real time [27]. The essence of the rock deformation process is the evolution, development, expansion and combination of microcracks [28,29]. In this process, the strain energy stored in the rock will be rapidly released in the form of transient elastic waves to produce acoustic emission (AE) [30]. Therefore, there is a close relationship regarding the deformation mechanism between the rock and AE. As a nondestructive testing method, AE is widely used to monitor the crack propagation and damage fracture process in real-time [31]. AE signals include a series of parameters, such as the number of AE events, energy, frequency and amplitude [32]. At present, most studies have studied the acoustic evolution mechanism in the process of rock deformation by analyzing the above parameters [33,34]. Most of them focus on the AE characteristics of rock failure under a single stress state, and research on the AE characteristics of rock under a complex stress state is limited.
In this paper, a series of triaxial cyclic compression experiments were carried out on low-permeability sandstone under different confining pressures. The loading path was a combination of constant amplitude cyclic loading and increasing amplitude cyclic loading. Macroscopically, the failure and deformation mechanism of low-permeability sandstone is revealed by analyzing the variations in typical mechanical parameters. Microscopically, the damage evolution process of internal cracks in rocks is analyzed based on real-time acoustic emission detection.

2. Materials and Methods

2.1. Low-Permeability Sandstone Samples and Test Equipment

The low-permeability sandstone samples used in this experiment were obtained from Shuanglong Town, ZiZhong County, Neijiang City, Sichuan Province, China. The bulk density of the low-permeability sandstone was 2400 kg/m3. The porosity and permeability were 9.3% and 2.7 mD, respectively. The sandstone was composed mainly of quartz (83%), while clay minerals (e.g., chlorite, illite, kaolinite) accounted for 12.6% and carbonate minerals (calcite and iron dolomite) accounted for 4.4%. The microstructure of the low-permeability sandstone, observed by SEM imaging, is shown in Figure 1.
Fifteen cylindrical samples (50 mm in diameter and 100 mm in height) were used in triaxial compression experiments that were performed on an electrohydraulic servo-controlled rock mechanical rigidity tester (MTS815.04), as shown in Figure 2. It consists of a control system, oil source, loading frame, confining pressure system and various test fixtures and sensors. The cylindrical sample was enclosed in a heat-shrinkable tube, and the top and bottom of the rock sample were clamped by pads. Axial and transverse strains were obtained through strain sensors and extensometers fixed on the surface of the rock sample with chains.

2.2. Experimental Schemes

2.2.1. Experimental Parameters

Low-permeability sandstone reservoirs can also be used to store natural gas in underground gas storage (UGS) projects. Taking the Wen 23 UGS located in the Dongpu depression in the Henan Province of China as an example, the average porosity and permeability of low tertiary sandstone are 12.2% and 3.42 mD, respectively. It is designed as the largest UGS in east-central China, with a storage capacity of 10.4 billion m3 [35].
The depths of UGSs in the world vary greatly. Most of the UGSs in Europe and the United States are constructed at depths of 300–1500 m, while the depths of UGSs in China are often in the range of 1000~5500 m, mostly at depths below 2000 m. It is meaningful to study the mechanical characteristics of low-permeability sandstone at different depths (i.e., different stress states) considering the alternating loading conditions in UGSs [36]. In this paper, confining pressures of 5 MPa, 10 MPa, 15 MPa, 20 MPa, 30 MPa and 40 MPa at a loading rate of 0.05 MPa/min were applied to simulate different buried depths of UGSs. Two types of triaxial compression tests were carried out. Conventional triaxial compression experiments can obtain the peak strength of low-permeability sandstone under different confining pressures. Cyclic loading experiments can be used to simulate the stress-path variation of a low-permeability sandstone reservoir during the gas injection and extraction process. The cyclic loading upper limits of 0.4, 0.6, 0.7, 0.8, 0.9 and 1.0 σm were designed based on the results of Martin et al. [37], considering crack initiation and expansion.

2.2.2. Experimental Procedures

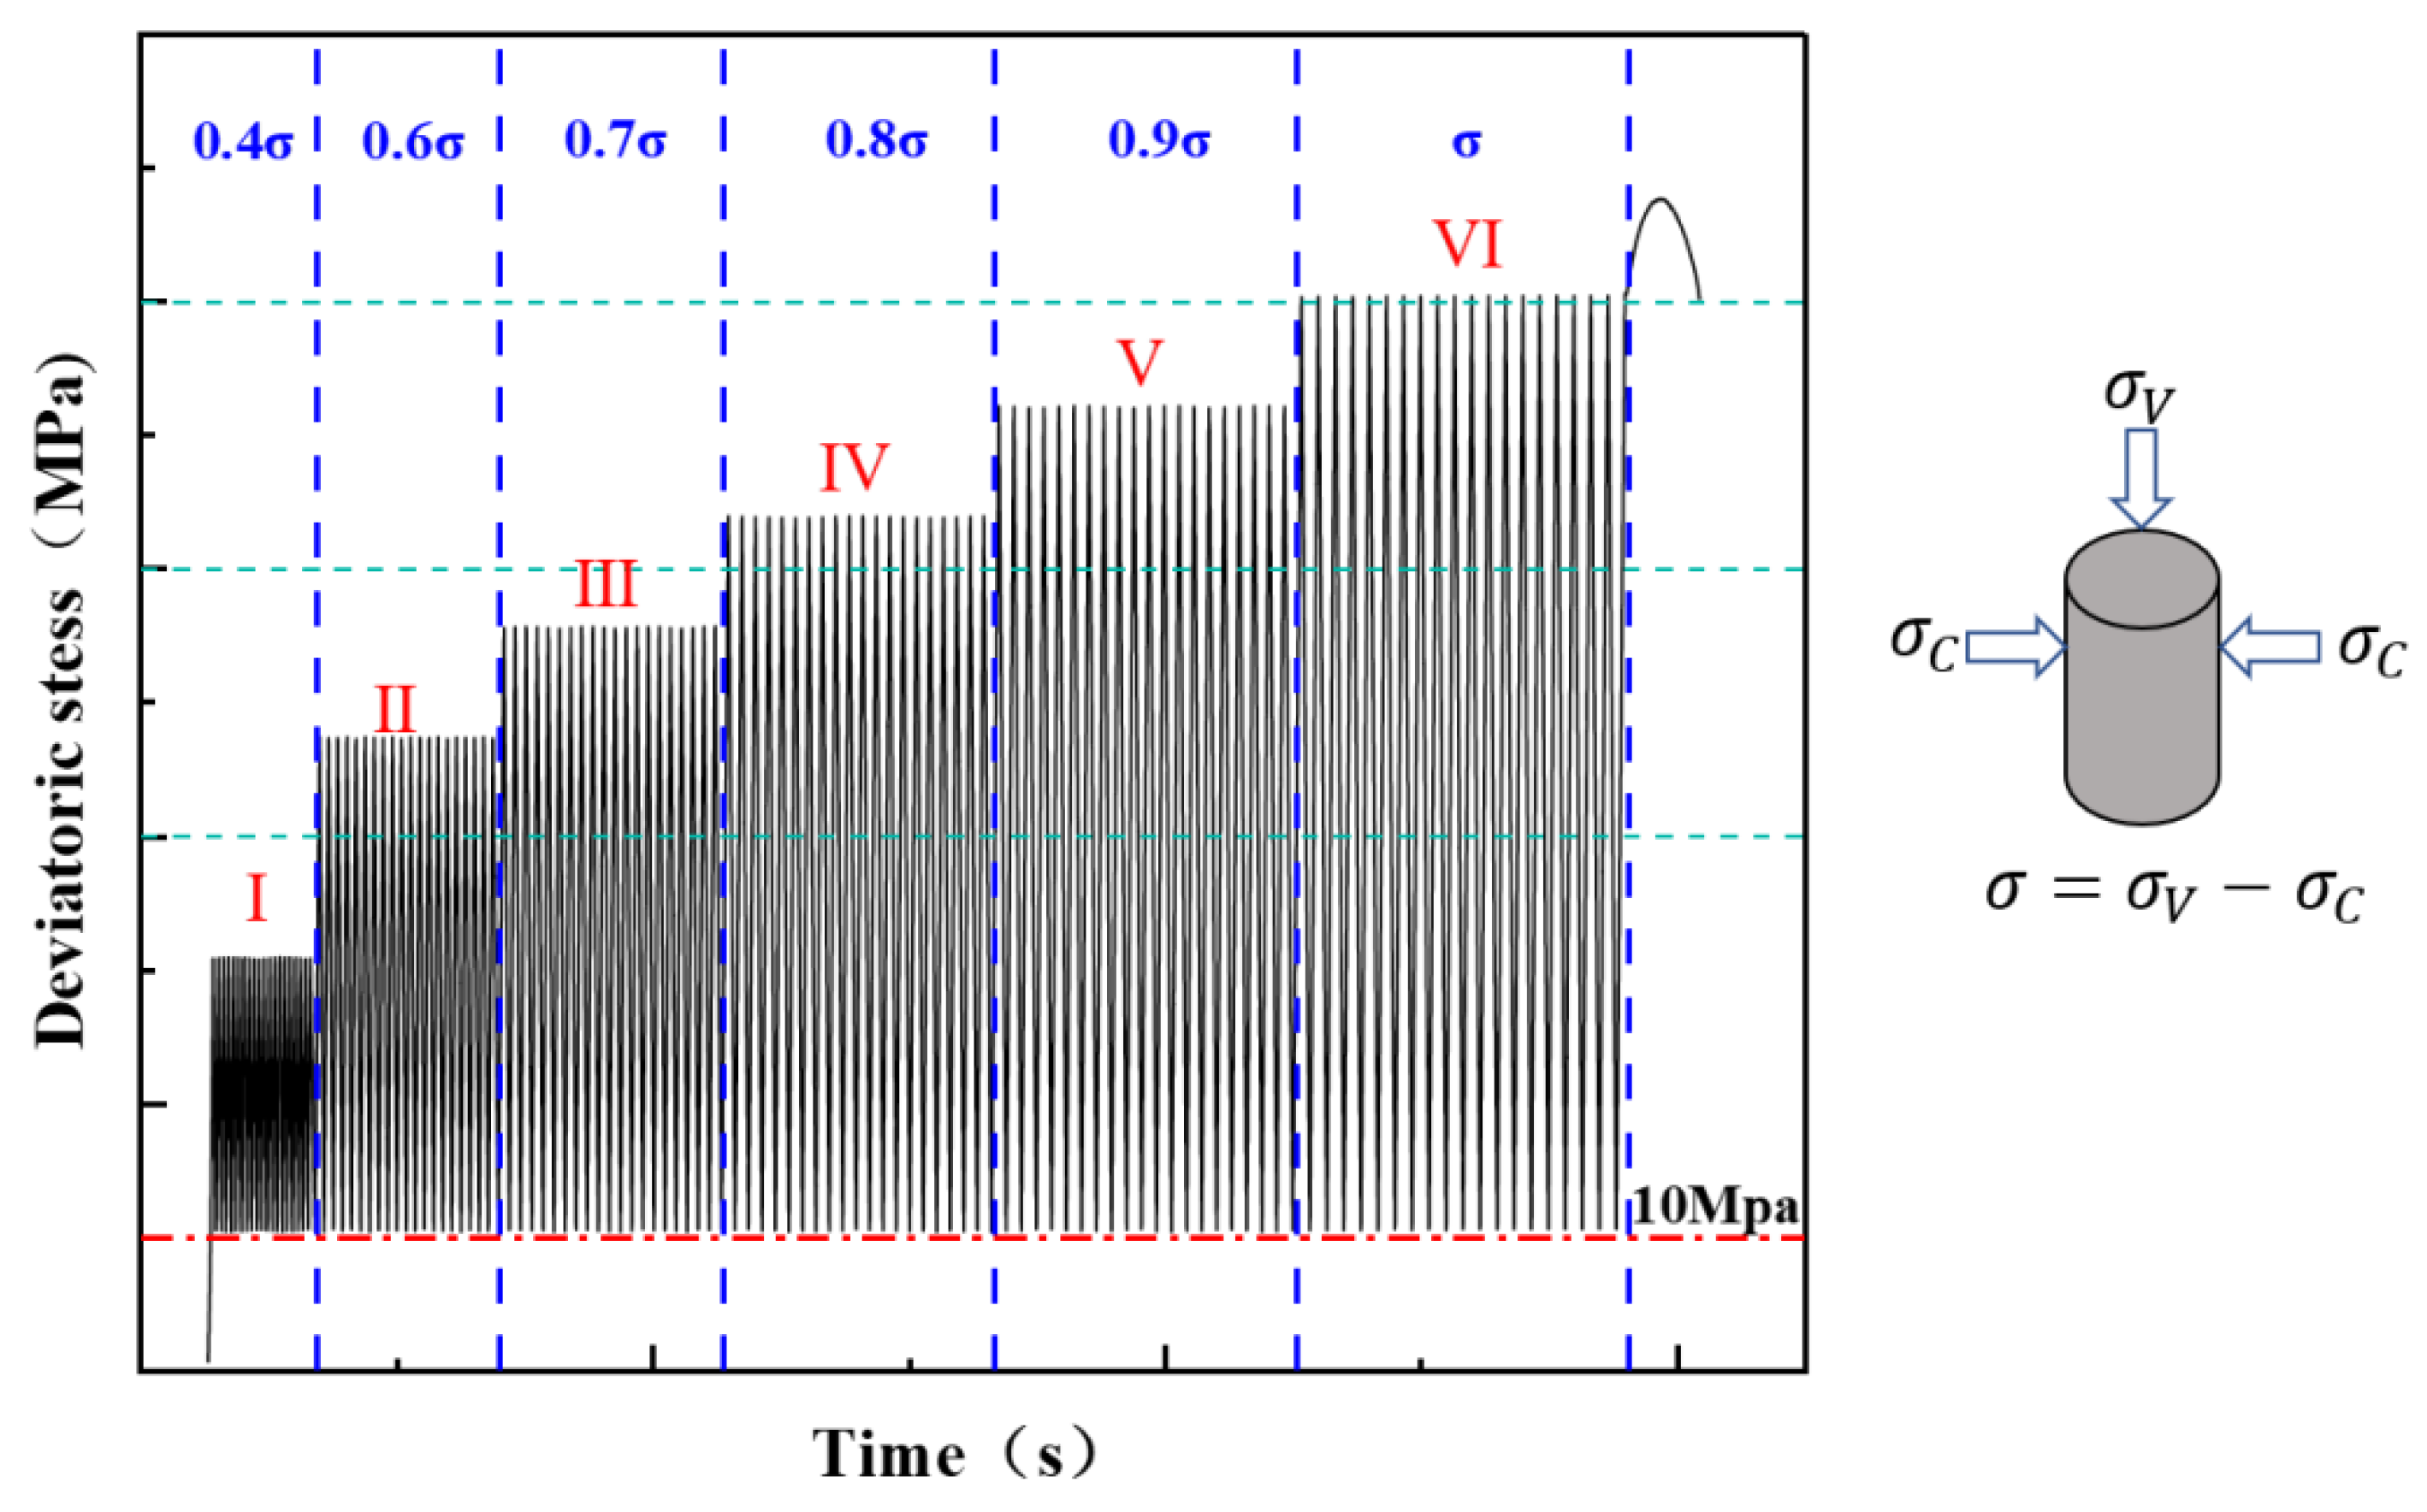
In the conventional triaxial compression tests, the confining pressure was loaded to the desired value at a rate of 0.05 MPa/s, and then the axial stress was applied to the top of the sample at a constant displacement loading rate of 0.06 mm/min until the sample was completely damaged and the peak strength σ was obtained. In the triaxial cyclic compression experiments, six levels of loading stress (defined as the ratio of loading stress to static compressive strength) were set at 0.4, 0.6, 0.7, 0.8, 0.9 and 1.0. The lower limit stress of the cycle was 10 MPa. Each stress level was repeated twenty times. The specimen was loaded at a rate of 4 kN/s. If failure occured for the sample during the cyclic loading-unloading process, the experiment was terminated. If failure did not occur after the designed cyclic loading-unloading experiments, the conventional compression test was performed until the sample was destroyed. As shown in Figure 3, the stress path is a combination of constant-amplitude and incremental-amplitude cyclic loading.

3. Results and Discussion

3.1. Stress-Strain Curves under Different Confining Stresses

3.1.1. Stress-Strain Curves after Conventional Triaxial Compression Tests

Conventional triaxial compression tests were performed to obtain the peak strength of the low-permeability sandstone. Figure 4 shows the deviatoric stress-strain curves under confining pressures of 5 MPa, 10 MPa, 15 MPa, 20 MPa, 30 MPa and 40 MPa. According to the experimental results, the triaxial compressive strength increases with the increase in confining pressure. With the rise of confining pressure, the brittleness of the rock decreases and the plasticity increases. The conventional triaxial compression test results are summarized in Table 1. The elastic modulus of the rocks increases accordingly with the confining pressure, but the Poisson’s ratio has no obvious fluctuation.

3.1.2. Stress-Strain Curves after Cyclic Loading-Unloading Triaxial Compression Tests

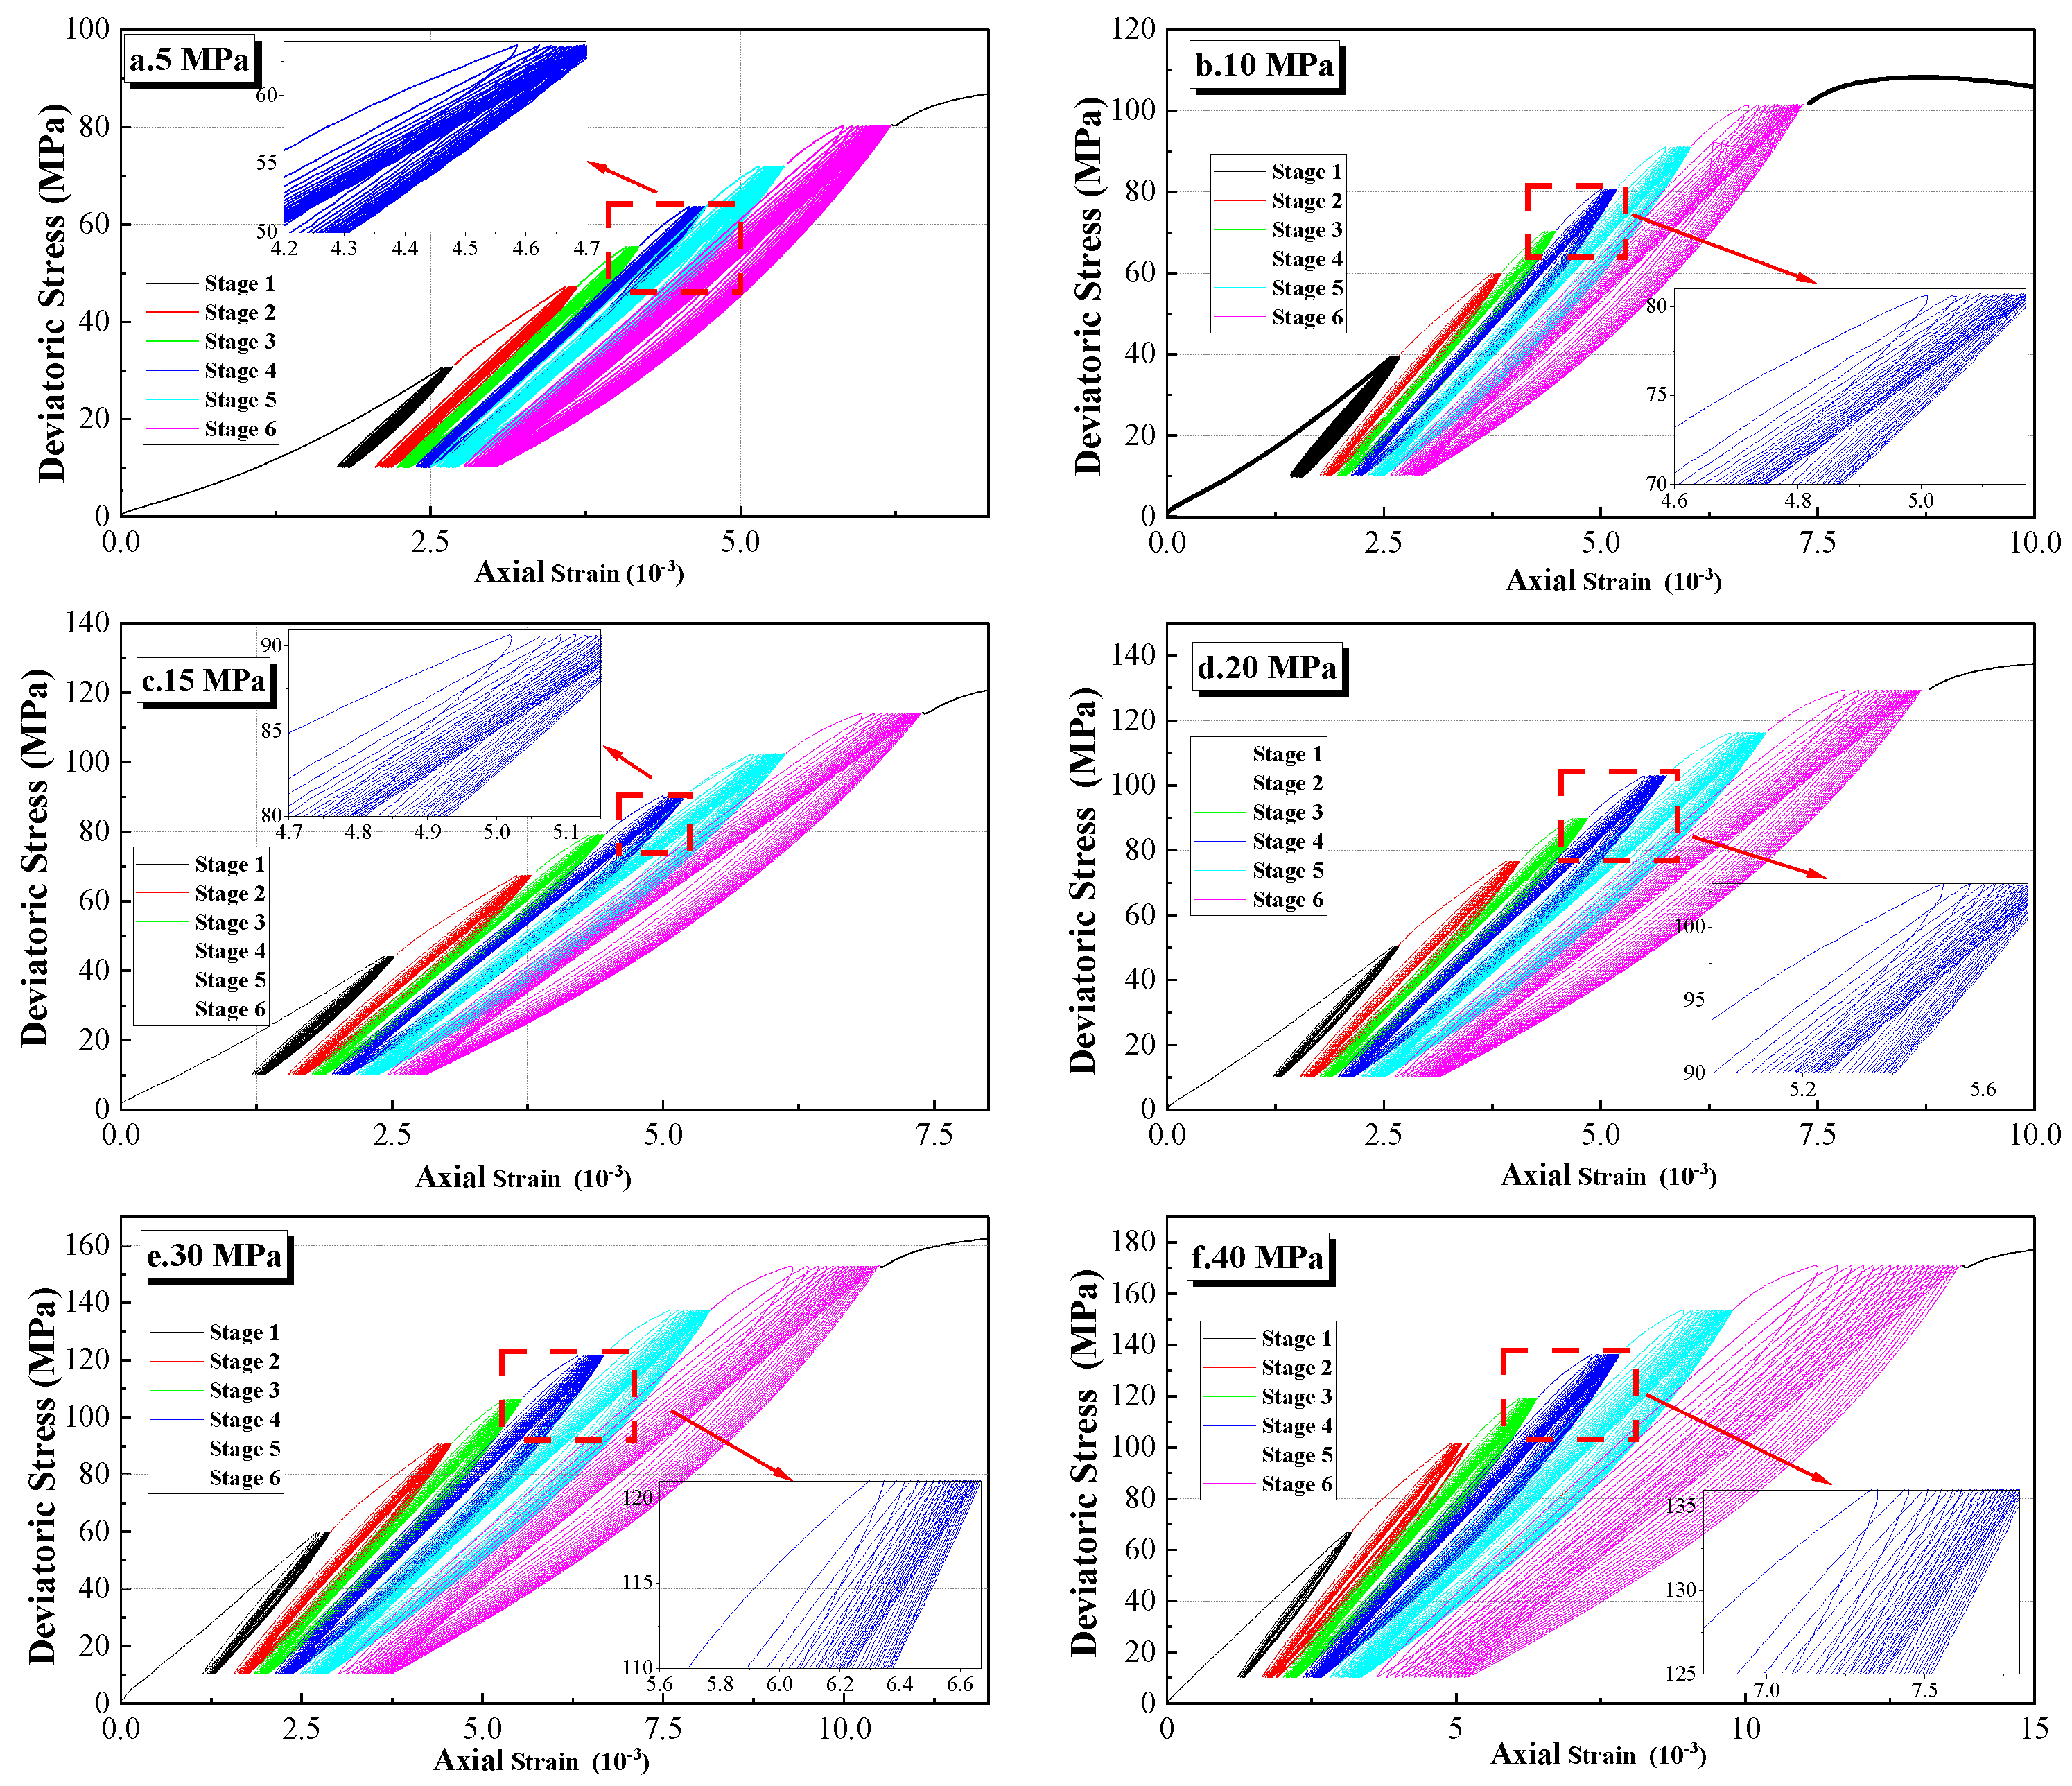
The deviatoric stress-axial strain curves obtained by multistage cyclic loading-unloading experiments are shown in Figure 5. Under cyclic loading-unloading processes, the stress-strain curves of low-permeability sandstone do not overlap, and hysteresis loops appear [38,39]. The strain evolution under different confining pressures presents similar trends, and the hysteresis loops of each level gradually become dense with the increase in the number of loading-unloading cycles. At the beginning of the experiments, large plastic deformation occurred due to the instantaneous increase in the stress, and more plastic strain energy was absorbed due to the mutual friction between the crystals and the extension of microcracks, and then the plastic deformation was limited [14]. The larger area of the plastic hysteresis loop occurred at a high level of the stress state, indicating the accumulation of plastic deformation related to the sprouting, expansion and merging of cracks in low-permeability sandstone. In addition, the peak strength of the low-permeability sandstone after multistage cyclic loading-unloading processes was greater than that of the conventional loading triaxial compression experiments, which can be explained by the hardening phenomenon due to the cyclic loading-unloading process [17].

3.2. Evolution of Deformation Parameters after Cyclic Loading-Unloading Tests

3.2.1. Evolution of the Elastic Modulus

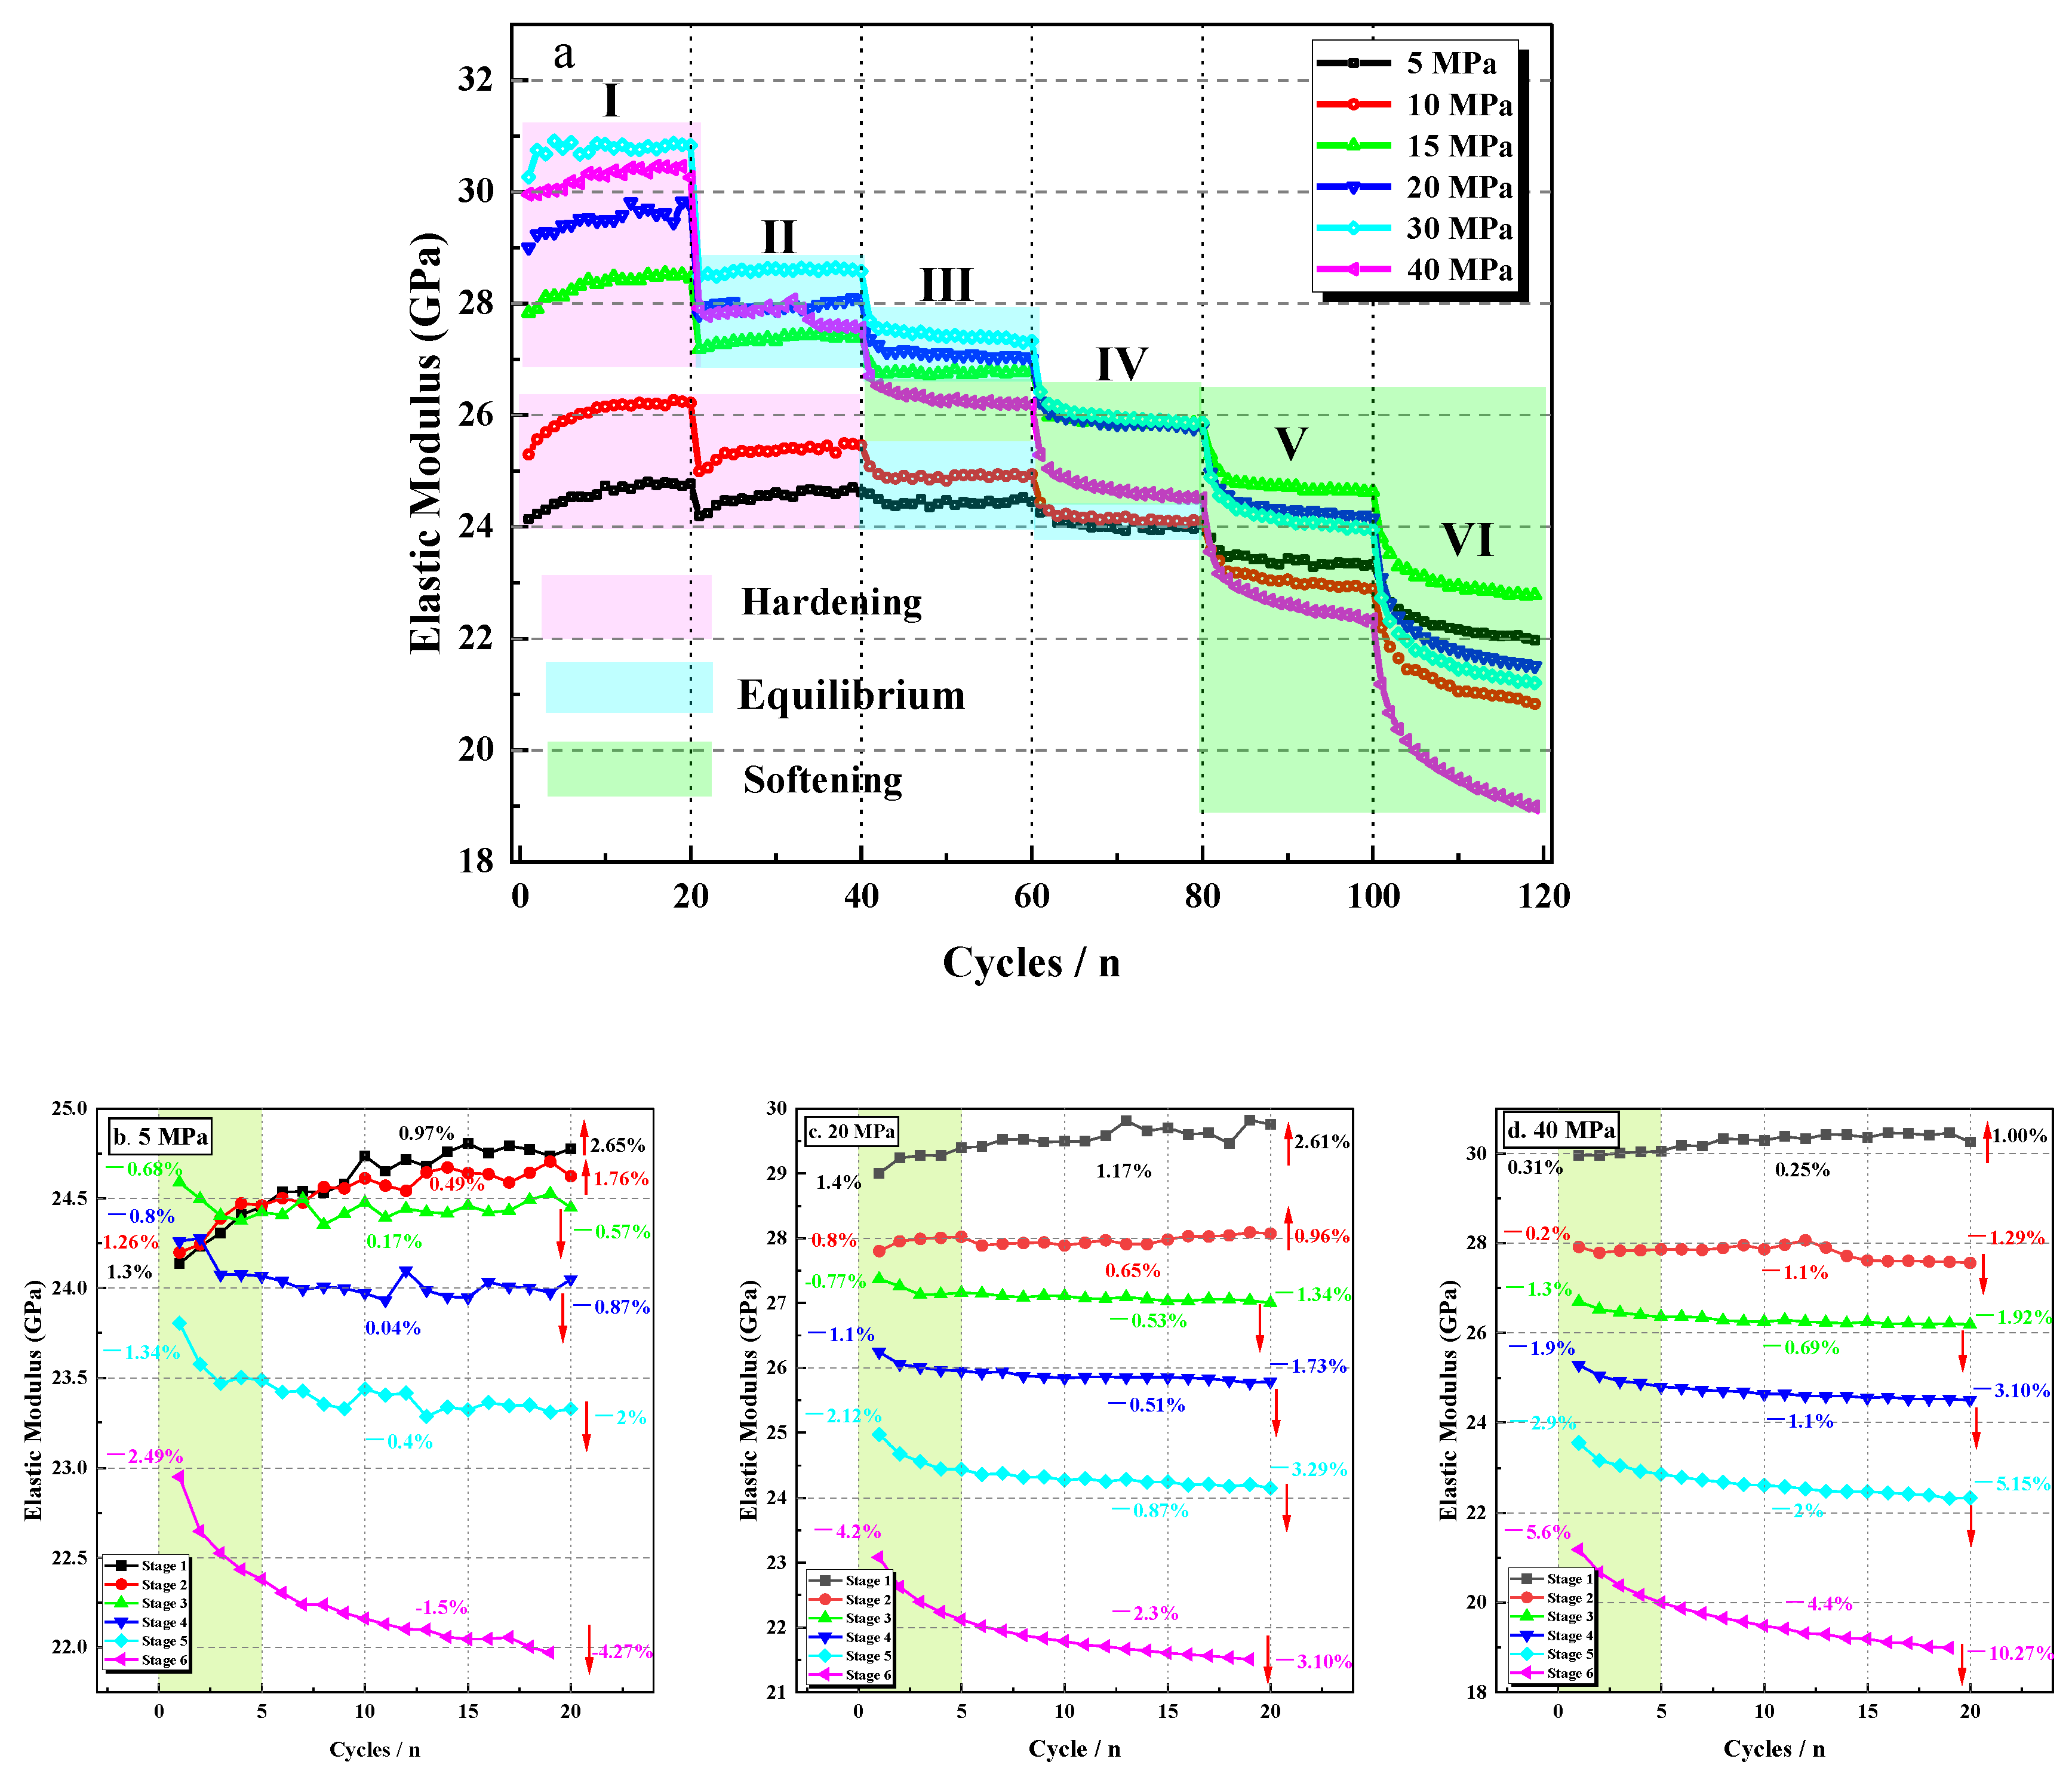
The linear part of the stress-strain curve at each cyclic loading phase was used to calculate the dynamic elastic modulus of low-permeability sandstone [40]. Figure 6a shows the trend of the elastic modulus of low-permeability sandstone samples under different confining pressures with increasing cycles and stress levels. It can be seen that the evolution of the elastic modulus has a strong consistency, presenting an obvious step-down trend with increasing stress level and cycle number, and the decreasing rate is accelerated with increasing confining pressure.
The evolution of the elastic modulus during the cyclic loading-unloading processes can be divided into three stages: (I) The growth stage (or the cyclic hardening stage) occurs when the designed upper limit stress is low. During this stage, the deformation of low-permeability sandstone caused by cyclic loading is small because the rock is compressed and the connection between the particles is strengthened under high confining pressures, which greatly restricts the damage extension [41,42]. (II) The equilibrium stage is represented by a near-stable elastic modulus at intermediate stress levels. The equilibrium section appears earlier under high confining pressure, indicating that a high confining pressure plays a role in suppressing damage. (III) The decline stage (or the cyclic softening stage) occurs when the designed upper limit stress is high. After the equilibrium stage, the high stress level and the increasing number of cycles lead to new cracks and pores, resulting in an obvious damage effect, especially for rocks under high confining pressure, and the decline in the elastic modulus is most obvious. Figure 6b–d, taking 5 MPa, 20 MPa and 40 MPa as examples, shows the elastic modulus increments of the first 5 cycles, the last 15 cycles and each stress level. The elastic modulus change at each stress level can be divided into two modes: (I) a rapid increasing or decreasing trend of the elastic modulus at the beginning of cyclic loading due to obvious deformation under the initiation, connection or closure of microcracks or pores, and (II) gradual stabilization in subsequent cyclic loading-unloading processes.

3.2.2. Evolution of Irreversible Strain

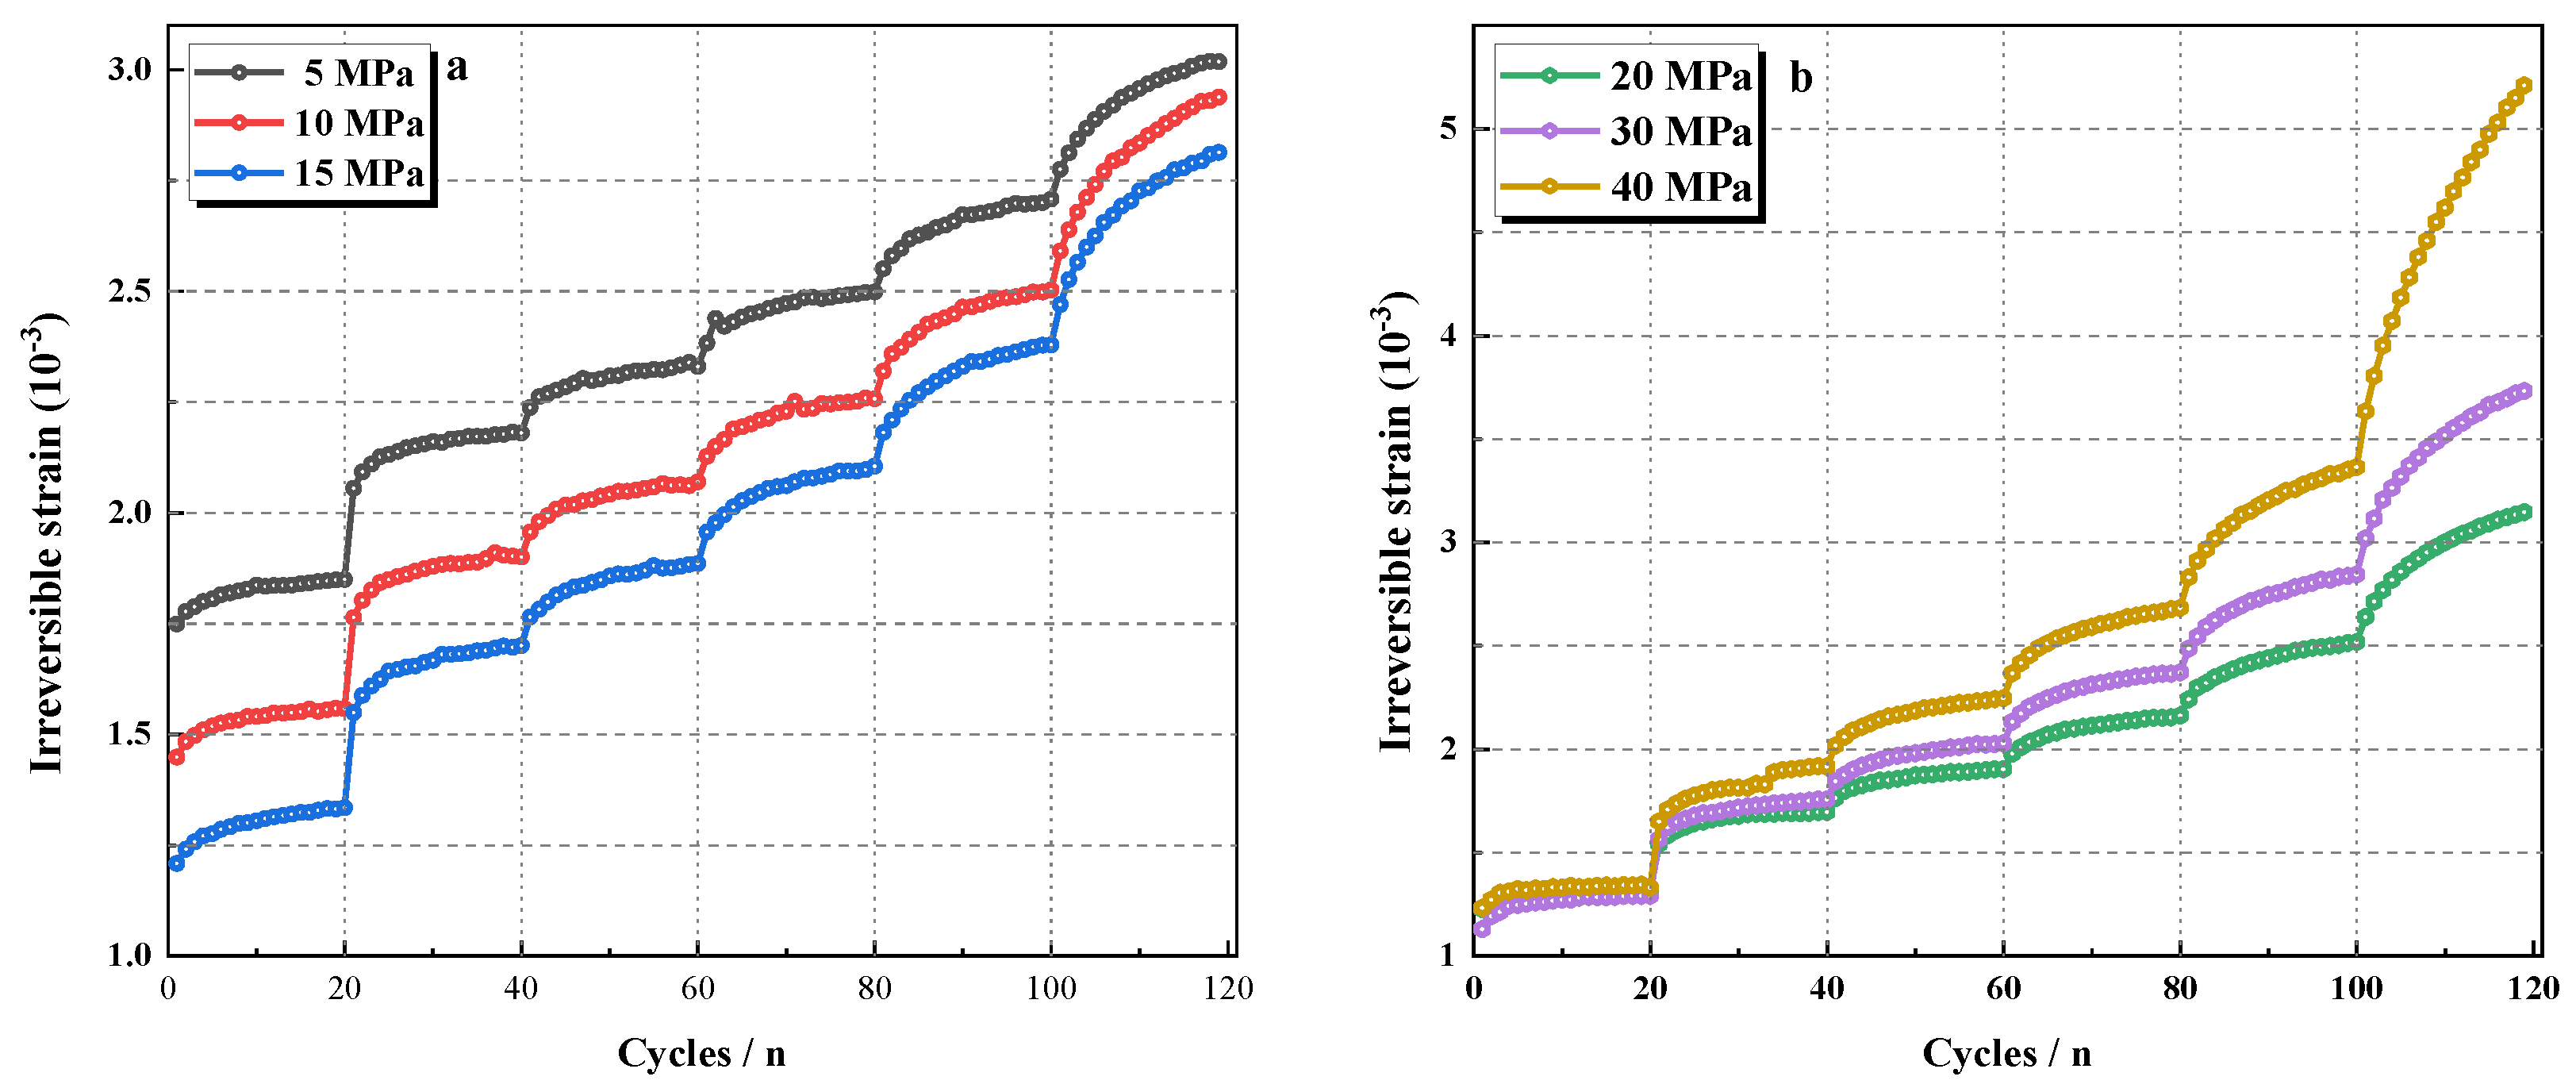
The elastic deformation of rocks is recovered during unloading, but the irreversible deformation, also called residual deformation, remains [42,43]. Figure 7a,b shows the variation in the irreversible axial strain with the number of cycles under different confining pressures. When the confining pressure is low (5 MPa, 10 MPa and 15 MPa), the irreversible axial strain of the low-permeability sandstone decreases with an increase in confining pressure, reflecting that a high confining pressure can inhibit the initiation and development of cracks [14]. However, when the confining pressure is high (20 MPa, 30 MPa and 40 MPa), the plastic strain increases with an increase in confining pressure.

3.3. Acoustic Emission (AE) Characteristics during Cyclic Loading-Unloading on Low-Permeability Sandstone

3.3.1. AE Count Characteristic Analysis

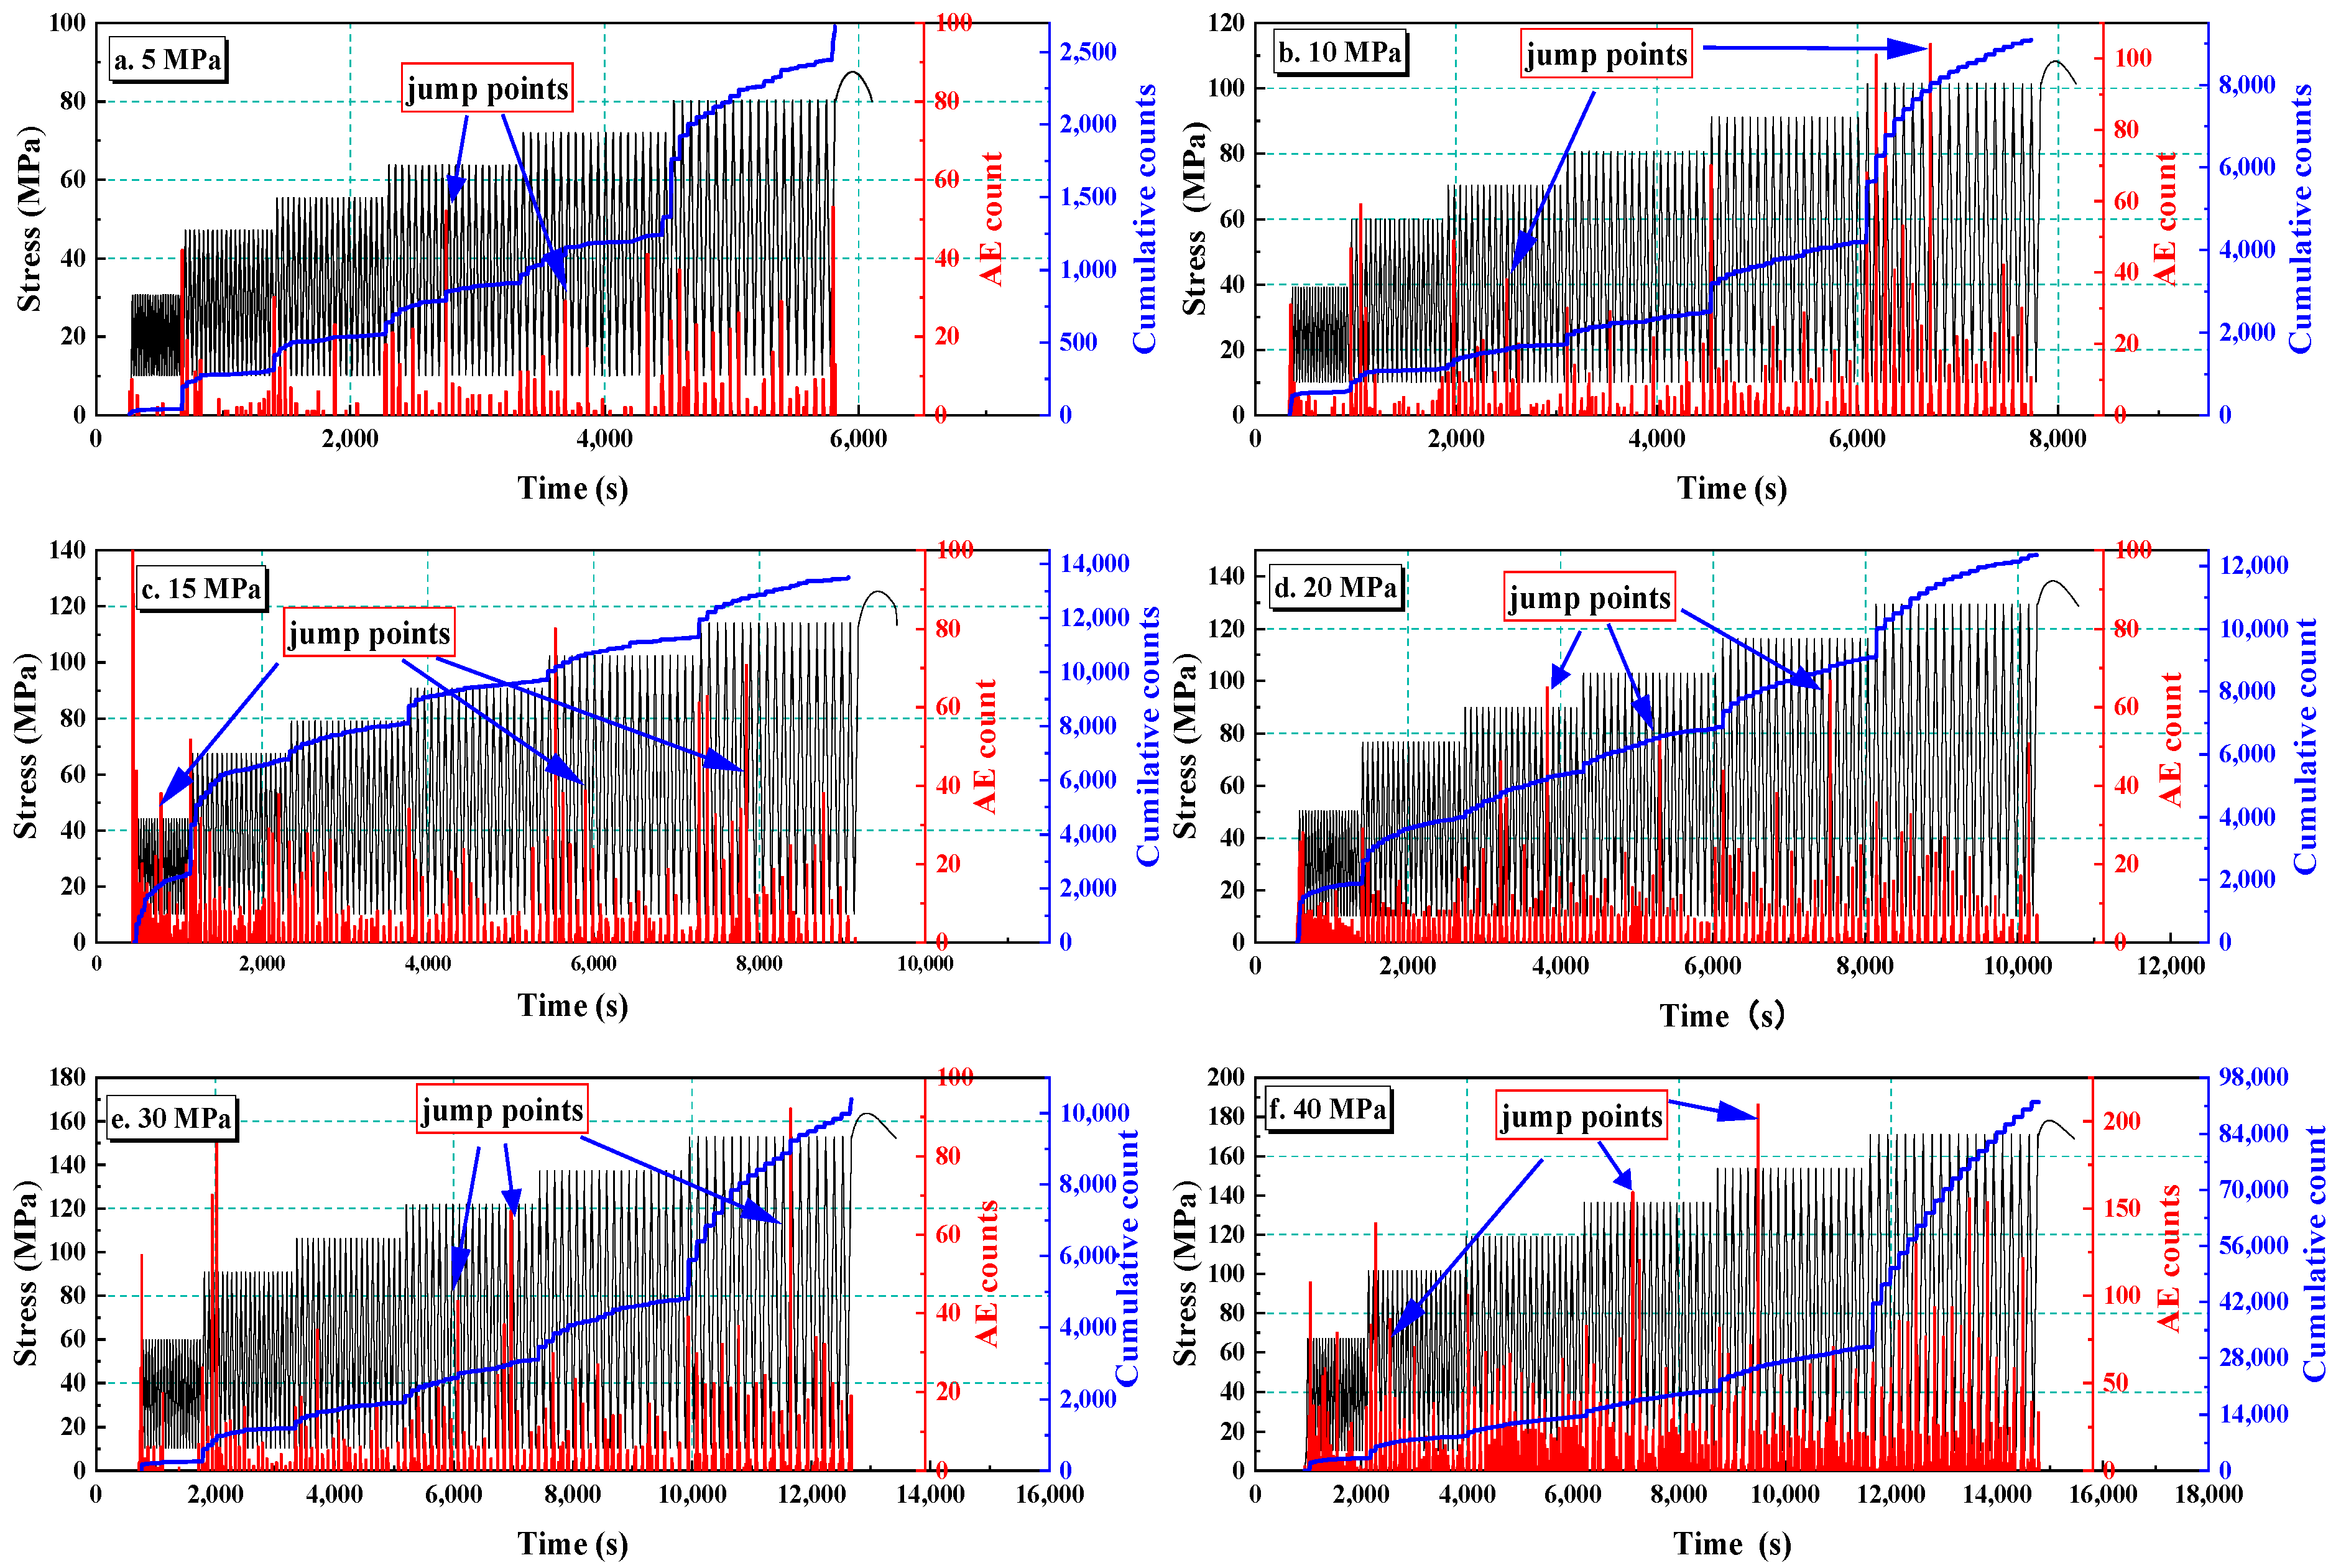
Time domain features such as acoustic emission (AE) count, AE energy, RMS and information entropy can be used to analyze the deformation, damage and failure evolution of rocks [44,45,46]. AE count analysis can reveal the development of internal microcracks during the stress loading-unloading process. Figure 8 shows the relationship between axial stress, AE counts (cumulative counts) and test time under different confining pressures. With increasing stress level, the accumulated AE counts showed a step increase trend, and the increase rate of the accumulated AE counts gradually increased. This indicates that the development rate of cracks and microcracks in the rocks gradually increases with increasing stress level. At the beginning of the loading phase, a large number of intensive AE count signals are generated, and then the count signals are sparse and remain constant. This is because the rock sample is instantaneously compressed in the axial direction at the beginning of each stress level, resulting in the variation in internal structure with the initiation and expansion of microcracks; thus, the AE activity increases accordingly [33]. Afterwards, the cracks develop slowly, and the internal structure does not change, stabilizing AE activity. Several jump points of AE counts occur during the steady deformation of one loading stage, as shown in Figure 8, indicating that the interior structure of the rock samples is damaged, causing the accumulated strain energy to be released and the sudden changes in the AE count.
To further investigate the continuous development of cracks in low-permeability sandstone in a single cycle at different stress levels, Figure 9a–f shows the relationship between AE counts and time at the first five cycles of each stress level stage with a confining pressure of 10 MPa. Frequent and intensive AE count signals appeared in the initial period of each level, and then the activity of AE signals gradually decreases with the increase in the number of cycles. This corresponds to the initial and stable deformation in the rock samples at each level of stress. With increasing stress level (stages 1–6), the peak value and activity of the AE signal gradually increase, indicating that the internal microcracks in the rock sample continue to develop as the stress level increases. Compared with the unloading stage, there are more AE count signals in the loading stage, which indicates that the microcracks in the rock sample are obviously developed in the bearing stage.

3.3.2. Frequency–Amplitude Characteristics Analysis

Frequency is a critical parameter for analyzing the rock failure mechanism and revealing the internal stress state of rocks during loading. Different AE frequencies reflect different source mechanisms and types of cracks. Low-frequency AE signals correspond to large-scale cracks, whereas high-frequency AE signals correlate with small-scale cracks.
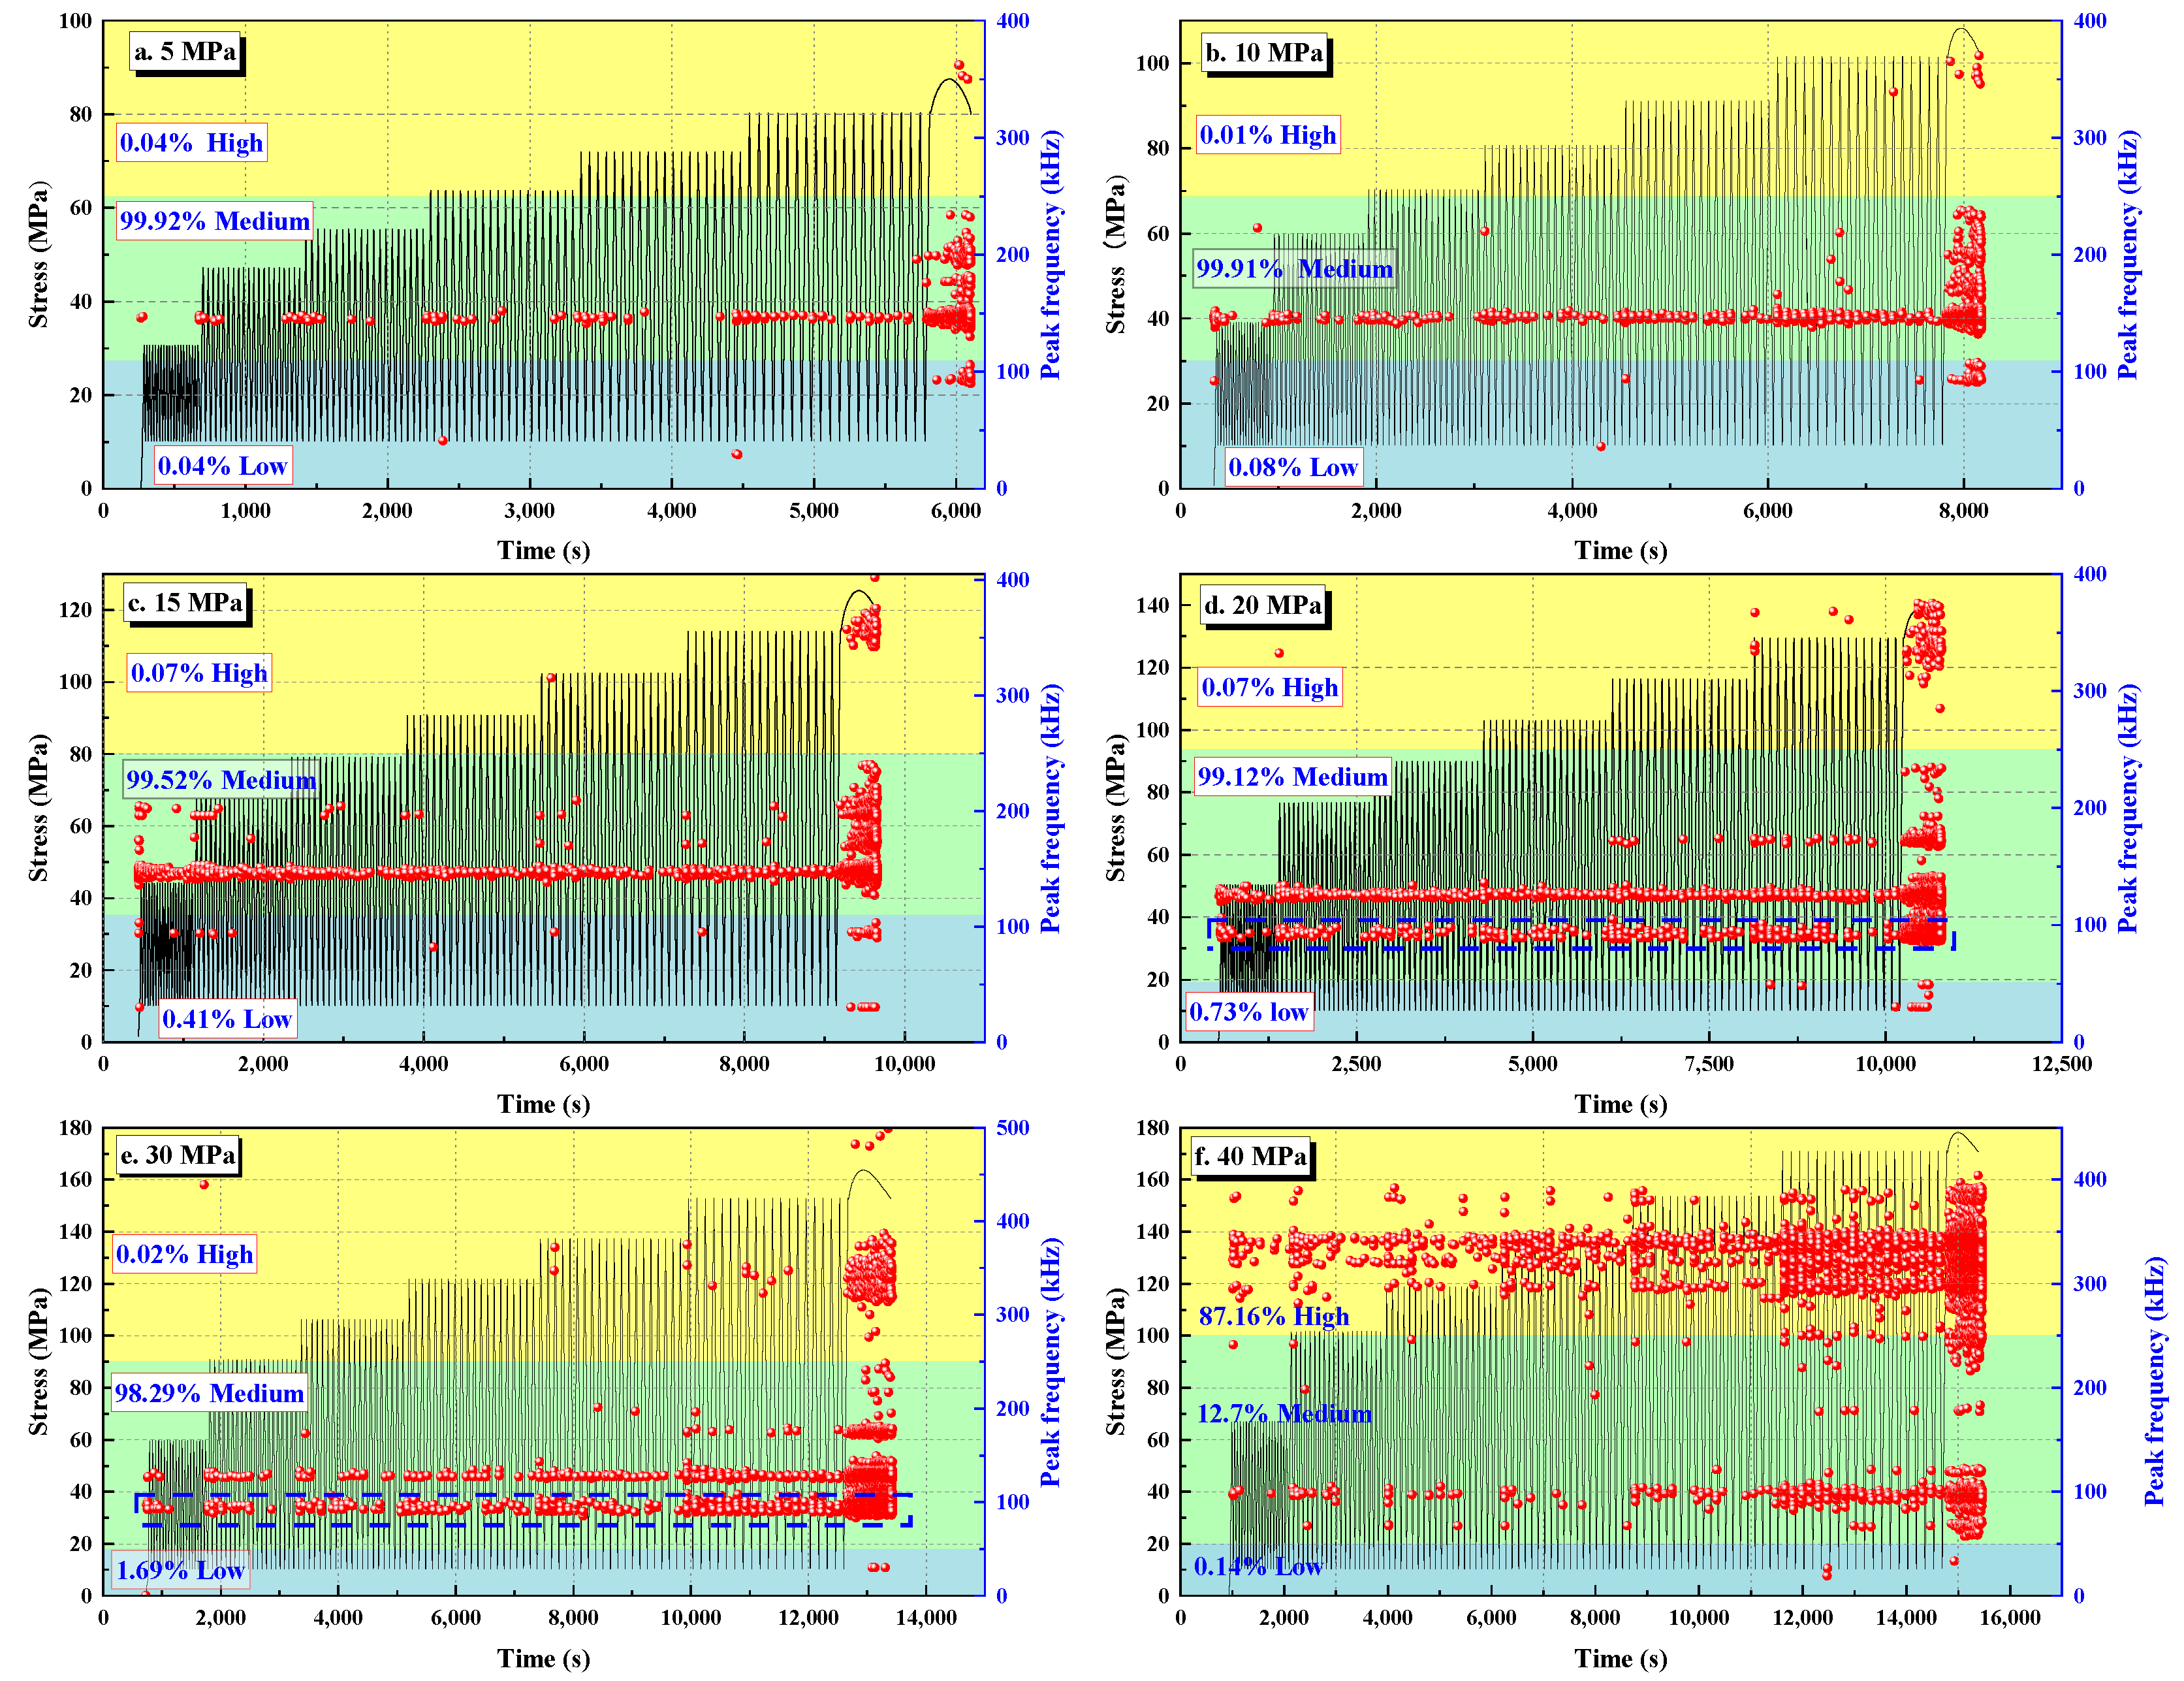
Figure 10 shows the variation in peak frequencies with time during the cyclic loading-unloading process. The peak frequency of rocks under cyclic loading is mainly concentrated in three frequency bands: low frequency, medium frequency and high frequency. Medium-frequency signal events widely exist throughout the cycle, and low-frequency and high-frequency signal events are few. Under low confining pressures (5 MPa, 10 MPa and 15 MPa), low-frequency signals only appear when the stress level increases, and their number is small; a high-frequency signal is concentrated in the final monotonic loading section. Under high confining pressures (20 MPa and 30 MPa), low-frequency signals and high-frequency signals only appear at high stress levels and in the final monotonic loading section; however, some lower-frequency (approximately 100 kHz) signals appear in the intermediate-frequency signal range. When the confining pressure is 40 MPa, the high-frequency signal is continuous and dense. This indicates that a higher stress level and confining pressure tend to cause denser cracks. Under high confining pressure, the intermediate-frequency signal of each stress level gradually decreases with the increase of the number of cycles, which may be because the sudden increase in stress level leads to the formation of cracks, and then the crack development gradually stabilizes. It is worth mentioning that when the number of AE events of low, intermediate and high frequencies increases simultaneously (simultaneous multifrequency response) due to the initiation of cracks, the range of the peak frequency zone becomes wider [47], as shown in Figure 10.
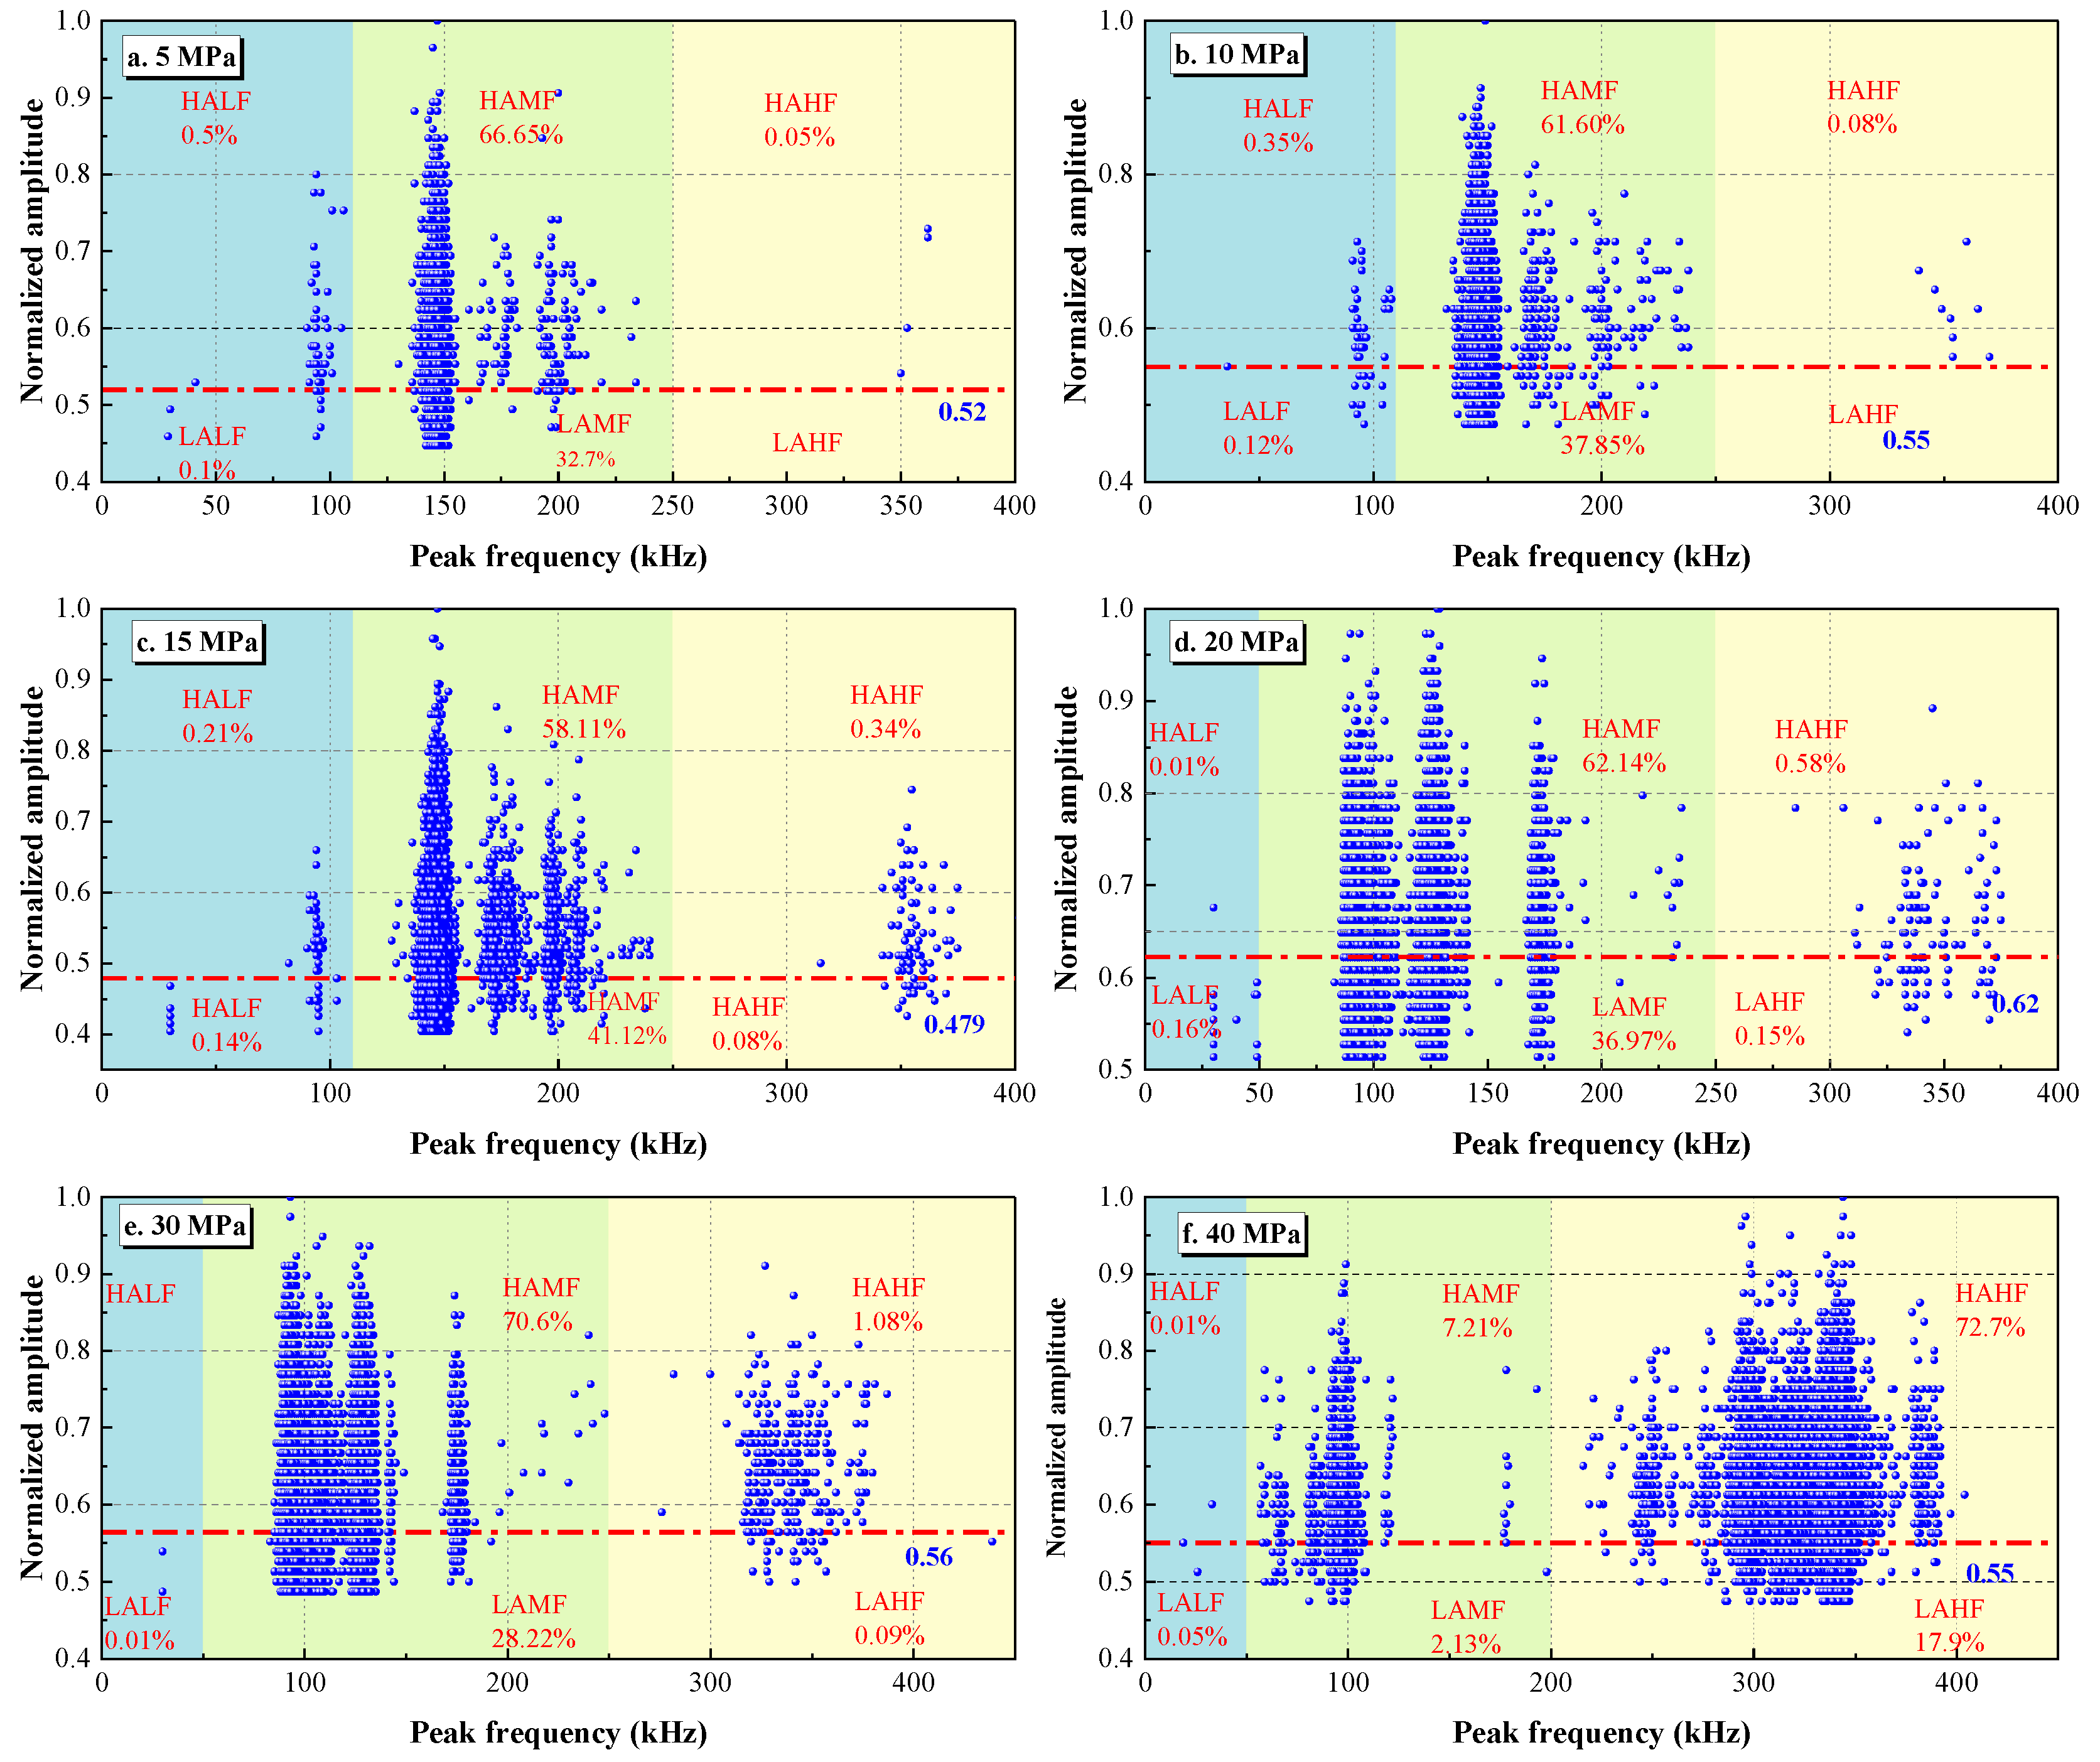
The amplitude signal is also a key factor in describing the damage and failure of rocks [48]. Figure 11a–f show the relationship between the peak frequency and the normalized peak amplitude of AE. The medians after the peak amplitudes were normalized are 0.518 at 5 MPa, 0.55 at 10 MPa, 0.479 at 15 MPa, 0.62 at 20 MPa, 0.56 at 30 MPa and 0.55 at 40 MPa, respectively. The peak amplitude is accordingly divided into low and high components. AE signals with median and high-peak frequencies are generally characterized by high-peak amplitude, and different confining pressures present similar trends. The higher the confining pressure is, the denser the high-frequency signal is, which indicates that the internal cracks of the high confining pressure rock sample develop actively.
To better analyze the spectral frequency characteristics, the AE signals are classified into six types according to the peak frequency (low, intermediate and high) and amplitude (low and high) [33], as shown in Figure 12, which shows the variation in peak frequency, amplitude and stress with time under different confining pressures. Overall, the high-amplitude medium-frequency (HAMF) signal and the low-amplitude medium-frequency (LAMF) signal always existed throughout the experiment, and the initial appearance time of the other signals are described in Table 2. High-amplitude high-frequency (HAHF) signals appear sparsely when the low permeability sandstone is damaged under low confining pressures (5, 10 and 15 MPa). HAHF signals appear densely when the cyclic stress is close to peak strength and the sandstone samples are at failure under high confining pressures (20, 30 and 40 MPa). This means that the appearance of HAHF signals represents a drastic change in the upper limit of the cyclic stress on the sandstone or that the sandstone samples are damaged. The appearance of low-amplitude low-frequency (LALF) signals and low-amplitude high-frequency (LAHF) signals indicates that samples have begun to rupture.

3.3.3. b-Value Analysis

The b-value is widely used to describe the evolution of crack initiation and development to distinguish between macroscopic and microscopic cracks [49]. The well-known “G-R” law can describe the relationship between frequency and amplitude [50]:
M = A d B 20
log 10 N = a b M
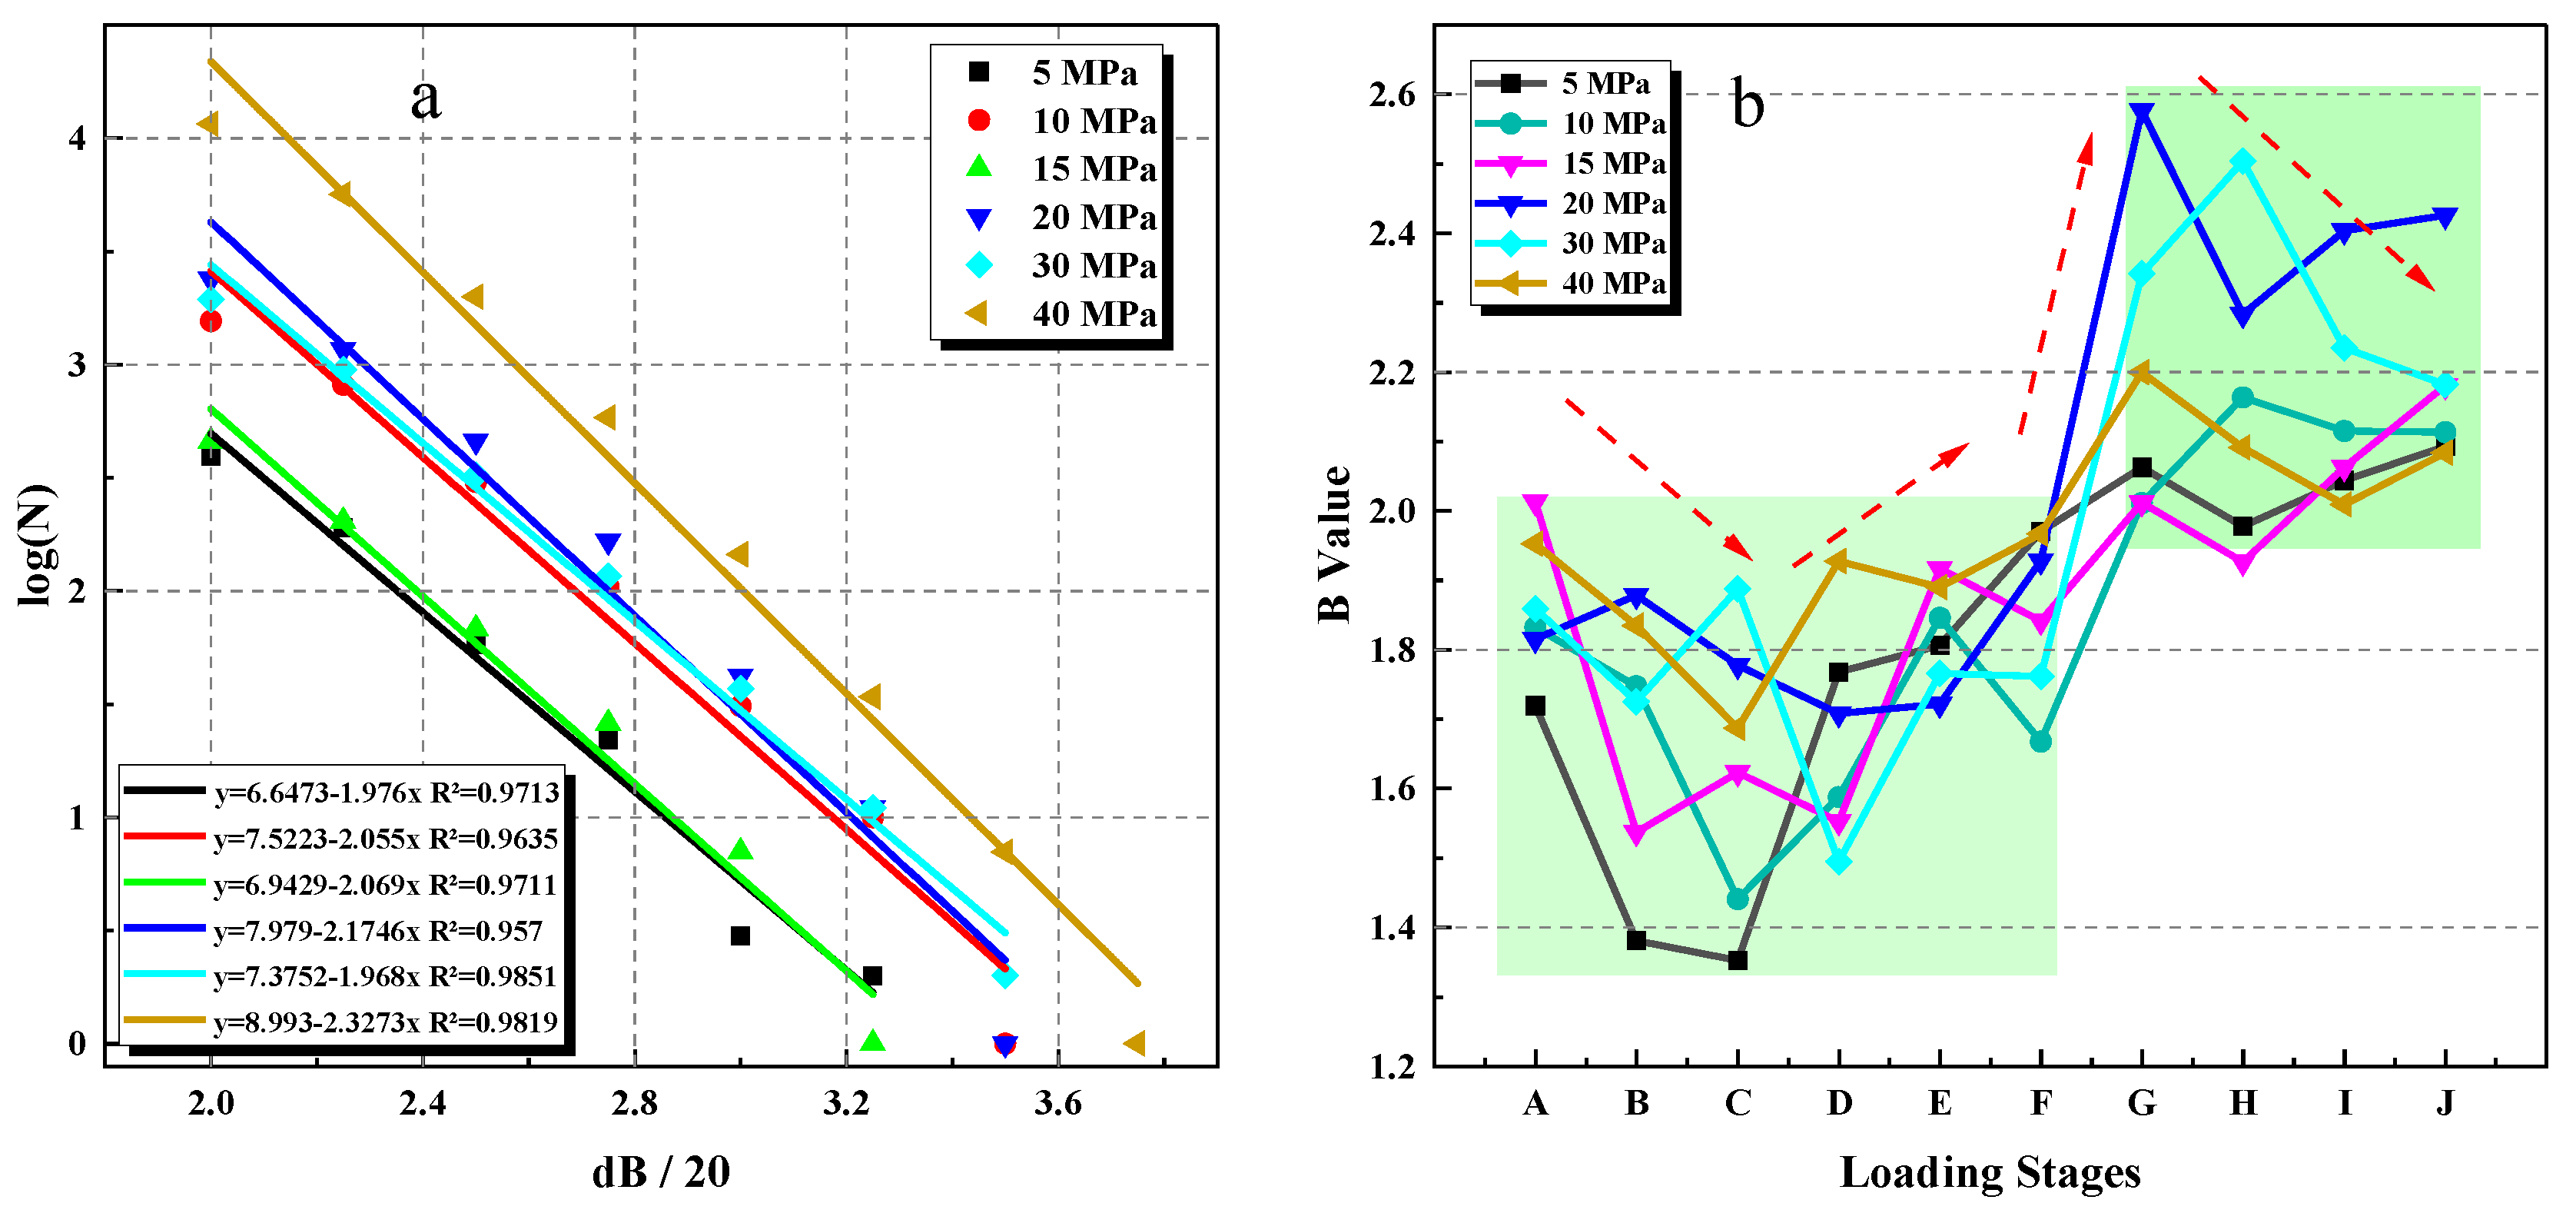
where M denotes the AE magnitude, A d B is the peak amplitude of the AE event, N is the number of AE signals with amplitudes greater than A d B , a is the fitting parameter and b is the b-value. According to the acquisition frequency of the acoustic emission experiment, every 5 A d B is set as a calculation period to prevent a large error due to a small calculation interval; that is, the magnitude M increases sequentially by 0.25.
The overall magnitude and variation trend of the b-value are closely related to the development of cracks in the rocks. A high b-value indicates slow initiation and expansion of microcracks and an increased proportion of small-amplitude AE events. Conversely, a low b-value indicates rapid or unstable crack initiation and an increased proportion of large-amplitude AE events [51,52].
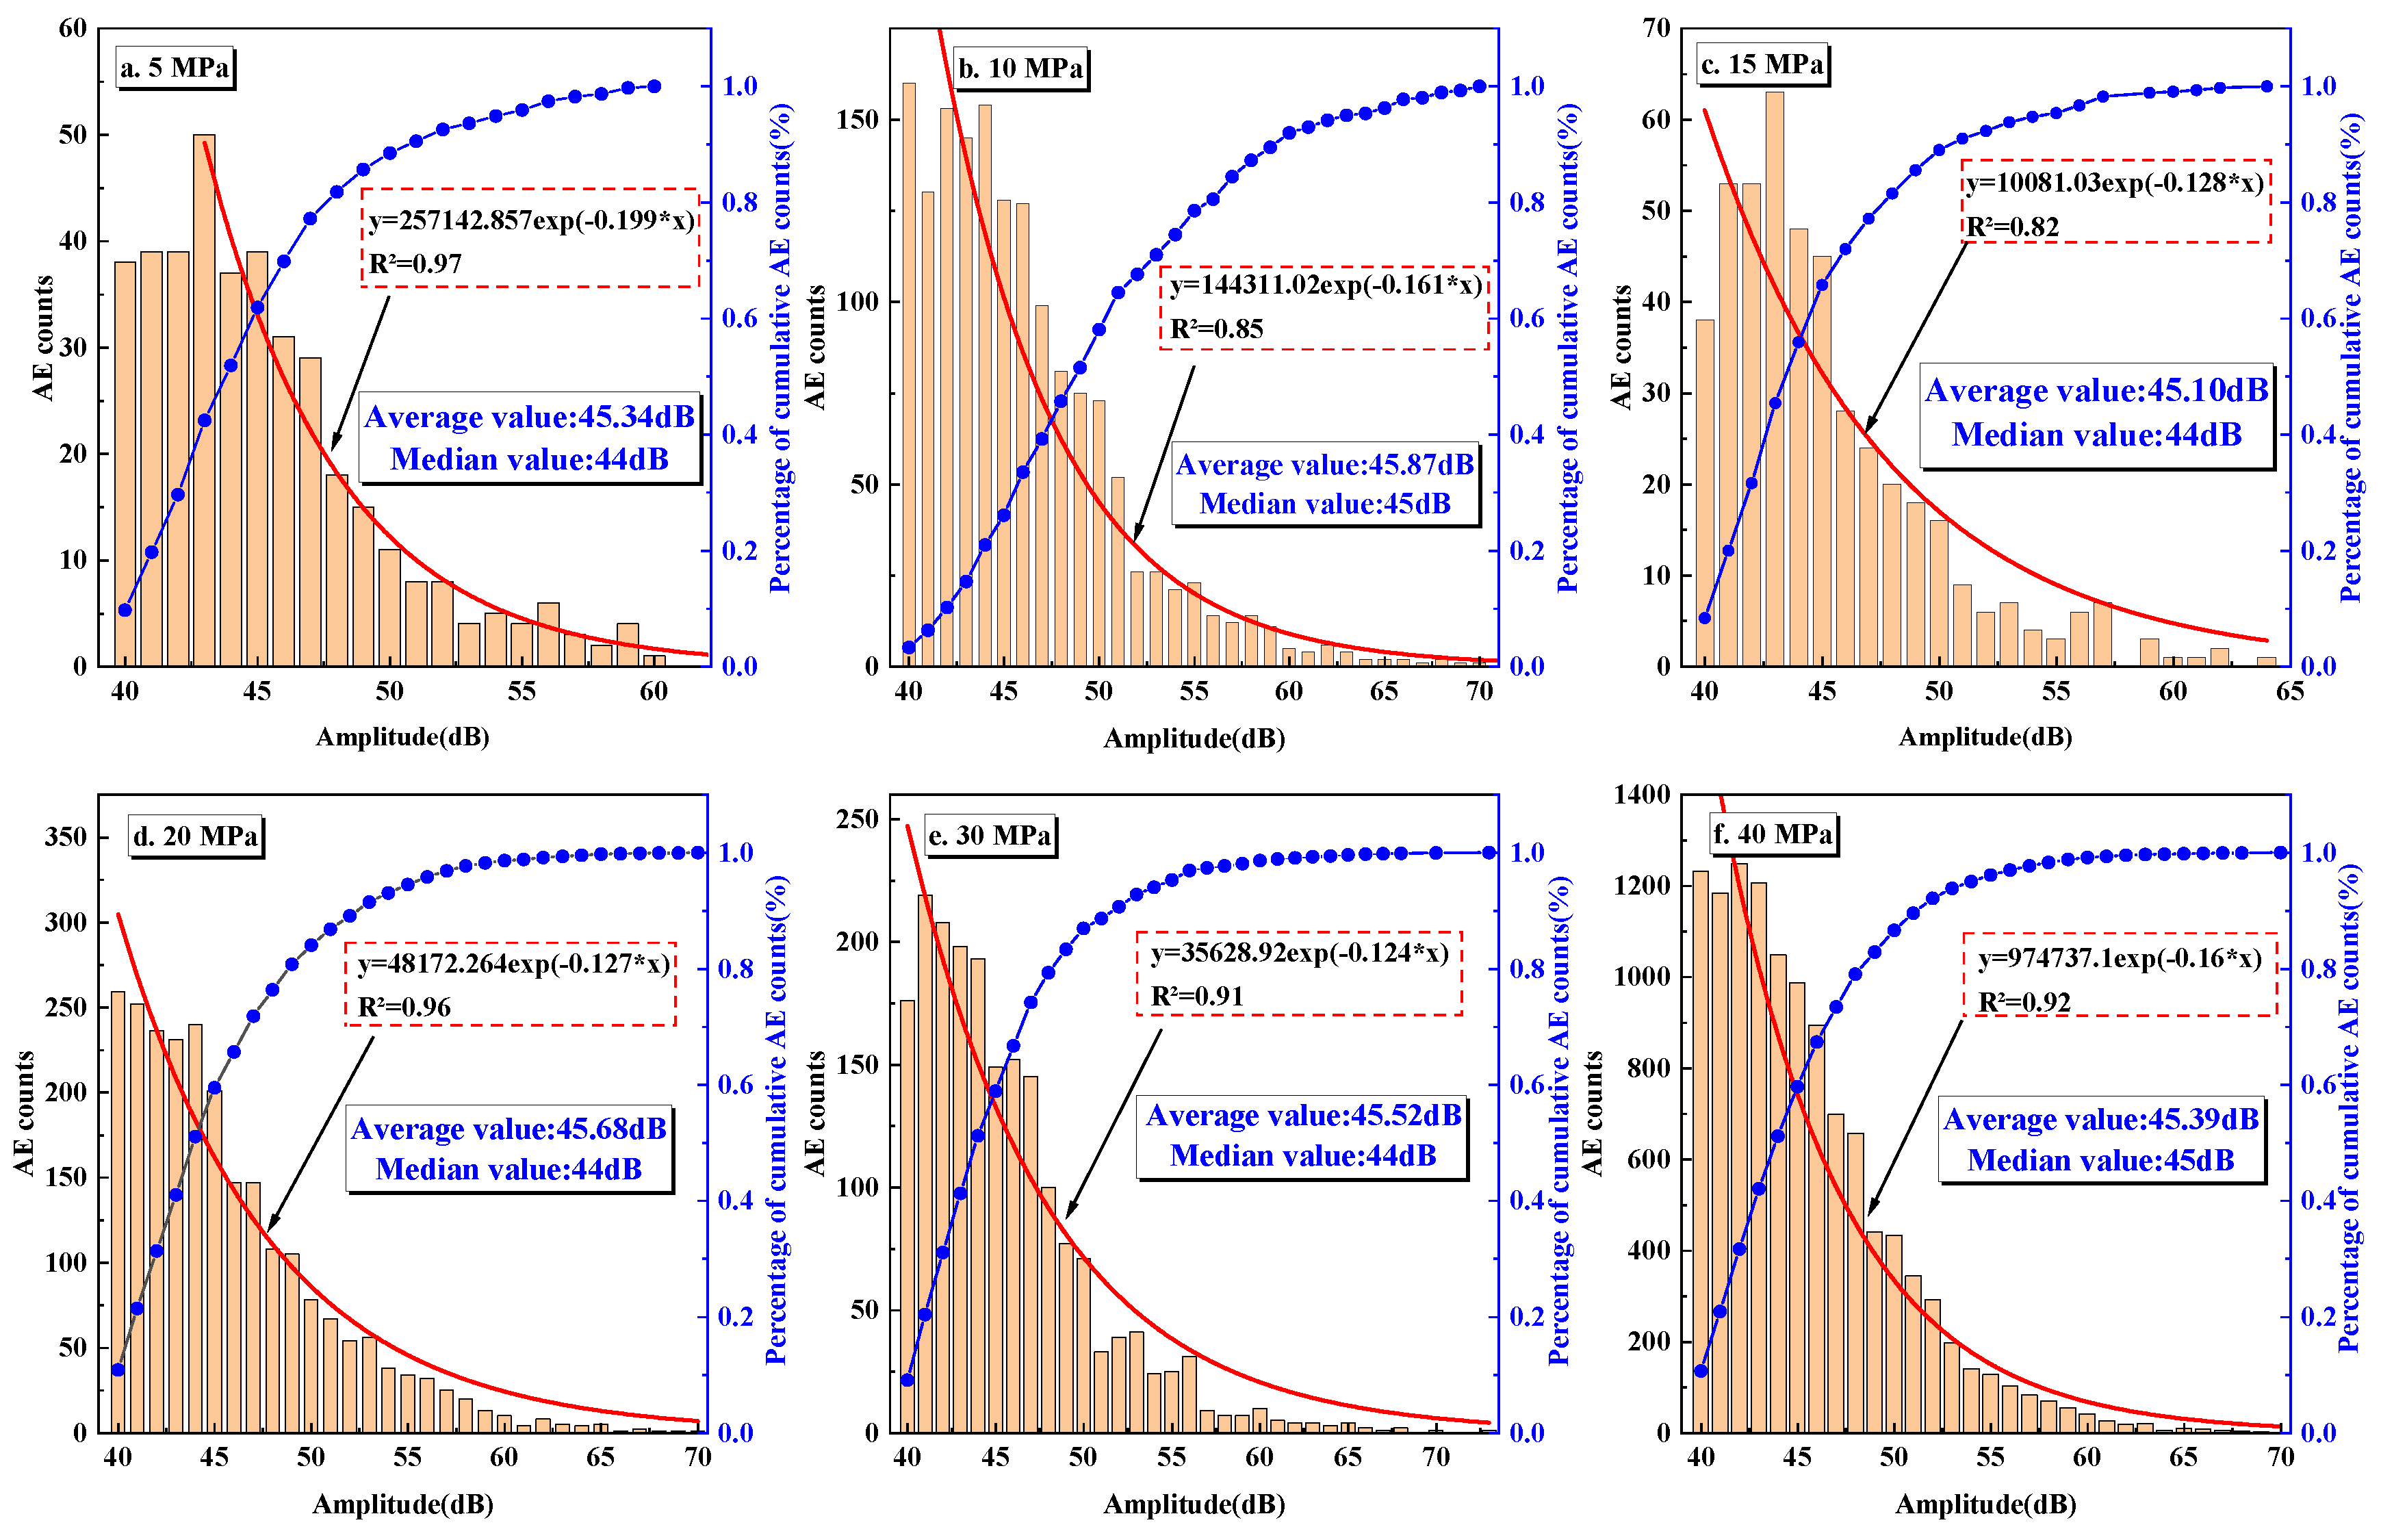
To quantitatively study the amplitude characteristics of the AE signal during cyclic loading, Figure 13a–f show the statistical distribution of the peak amplitude of low-permeability sandstone during cyclic loading under different confining pressures. With an increase in confining pressure, the amplitude range of AE has no obvious change. The AE amplitude of low-permeability sandstone under different confining pressures is mainly in the range of 40–45 dB, the average value of AE amplitude is approximately 45 dB, and the median value is 44–45 dB. With the increase in AE amplitude, the AE count and amplitude under different confining pressures show similar variation trends. The AE counts in each amplitude range gradually decrease. The relationship between AE count and amplitude can be described by an exponential function, and the coefficients of determination (R2) are 0.97, 0.85, 0.82, 0.96, 0.91 and 0.92 under confining pressures from 5 MPa to 40 MPa (Figure 13).
By fitting the straight-line part of the accumulated magnitude distribution curve, the slope of the fitted line is b, and the intercept is a. Figure 14a shows the b-value of the AE signal and the fitting curve used to determine the b-value. The fitting coefficient is high, which shows that the b-value obtained by using the AE data is relatively accurate [53]. The b-values at confining pressures of 5, 10, 15, 20, 30 and 40 MPa are 1.976, 2.055, 2.069, 2.1746, 1.968 and 2.3273, respectively. This indicates that the b-value shows an increasing trend with increasing confining pressure, indicating that crack initiation is faster and more unstable at low confining pressure than under high confining pressure.
To better reflect the damage mechanisms of low-permeability sandstone during cyclic loading and unloading, Figure 14b shows the evolution of the b-value under different confining pressures with increasing cycle number and stress level. It can be divided into the fluctuation stage of cyclic loading (first to sixth stress level) and the decreasing stage of monotonic loading. At the beginning of the cyclic phase, the b-value fluctuates slightly, showing a decreasing trend at first, and gradually increasing as the stress level increases. In the monotonic loading phase, the b-value is greater than that of the cyclic loading phase, and it shows a declining trend. Larger b-values indicate relatively larger fractures in rocks [53], and decreasing b-values indicate that the rocks are approaching the damage state [54,55]. Thus, a decreasing and then increasing b-value implies that internal damage gradually occurs in rocks during the cyclic loading-unloading process, followed by unstable extension and coalescence of fractures. Larger-scale cracks occurred in the monotonic loading process compared with those of the cyclic phase. The b-value underwent a drastic fluctuation throughout the loading process, which indicates that the damage behavior of the rocks is more complex during the experiment and should be further analyzed.

3.3.4. RA–AF Distribution Analysis

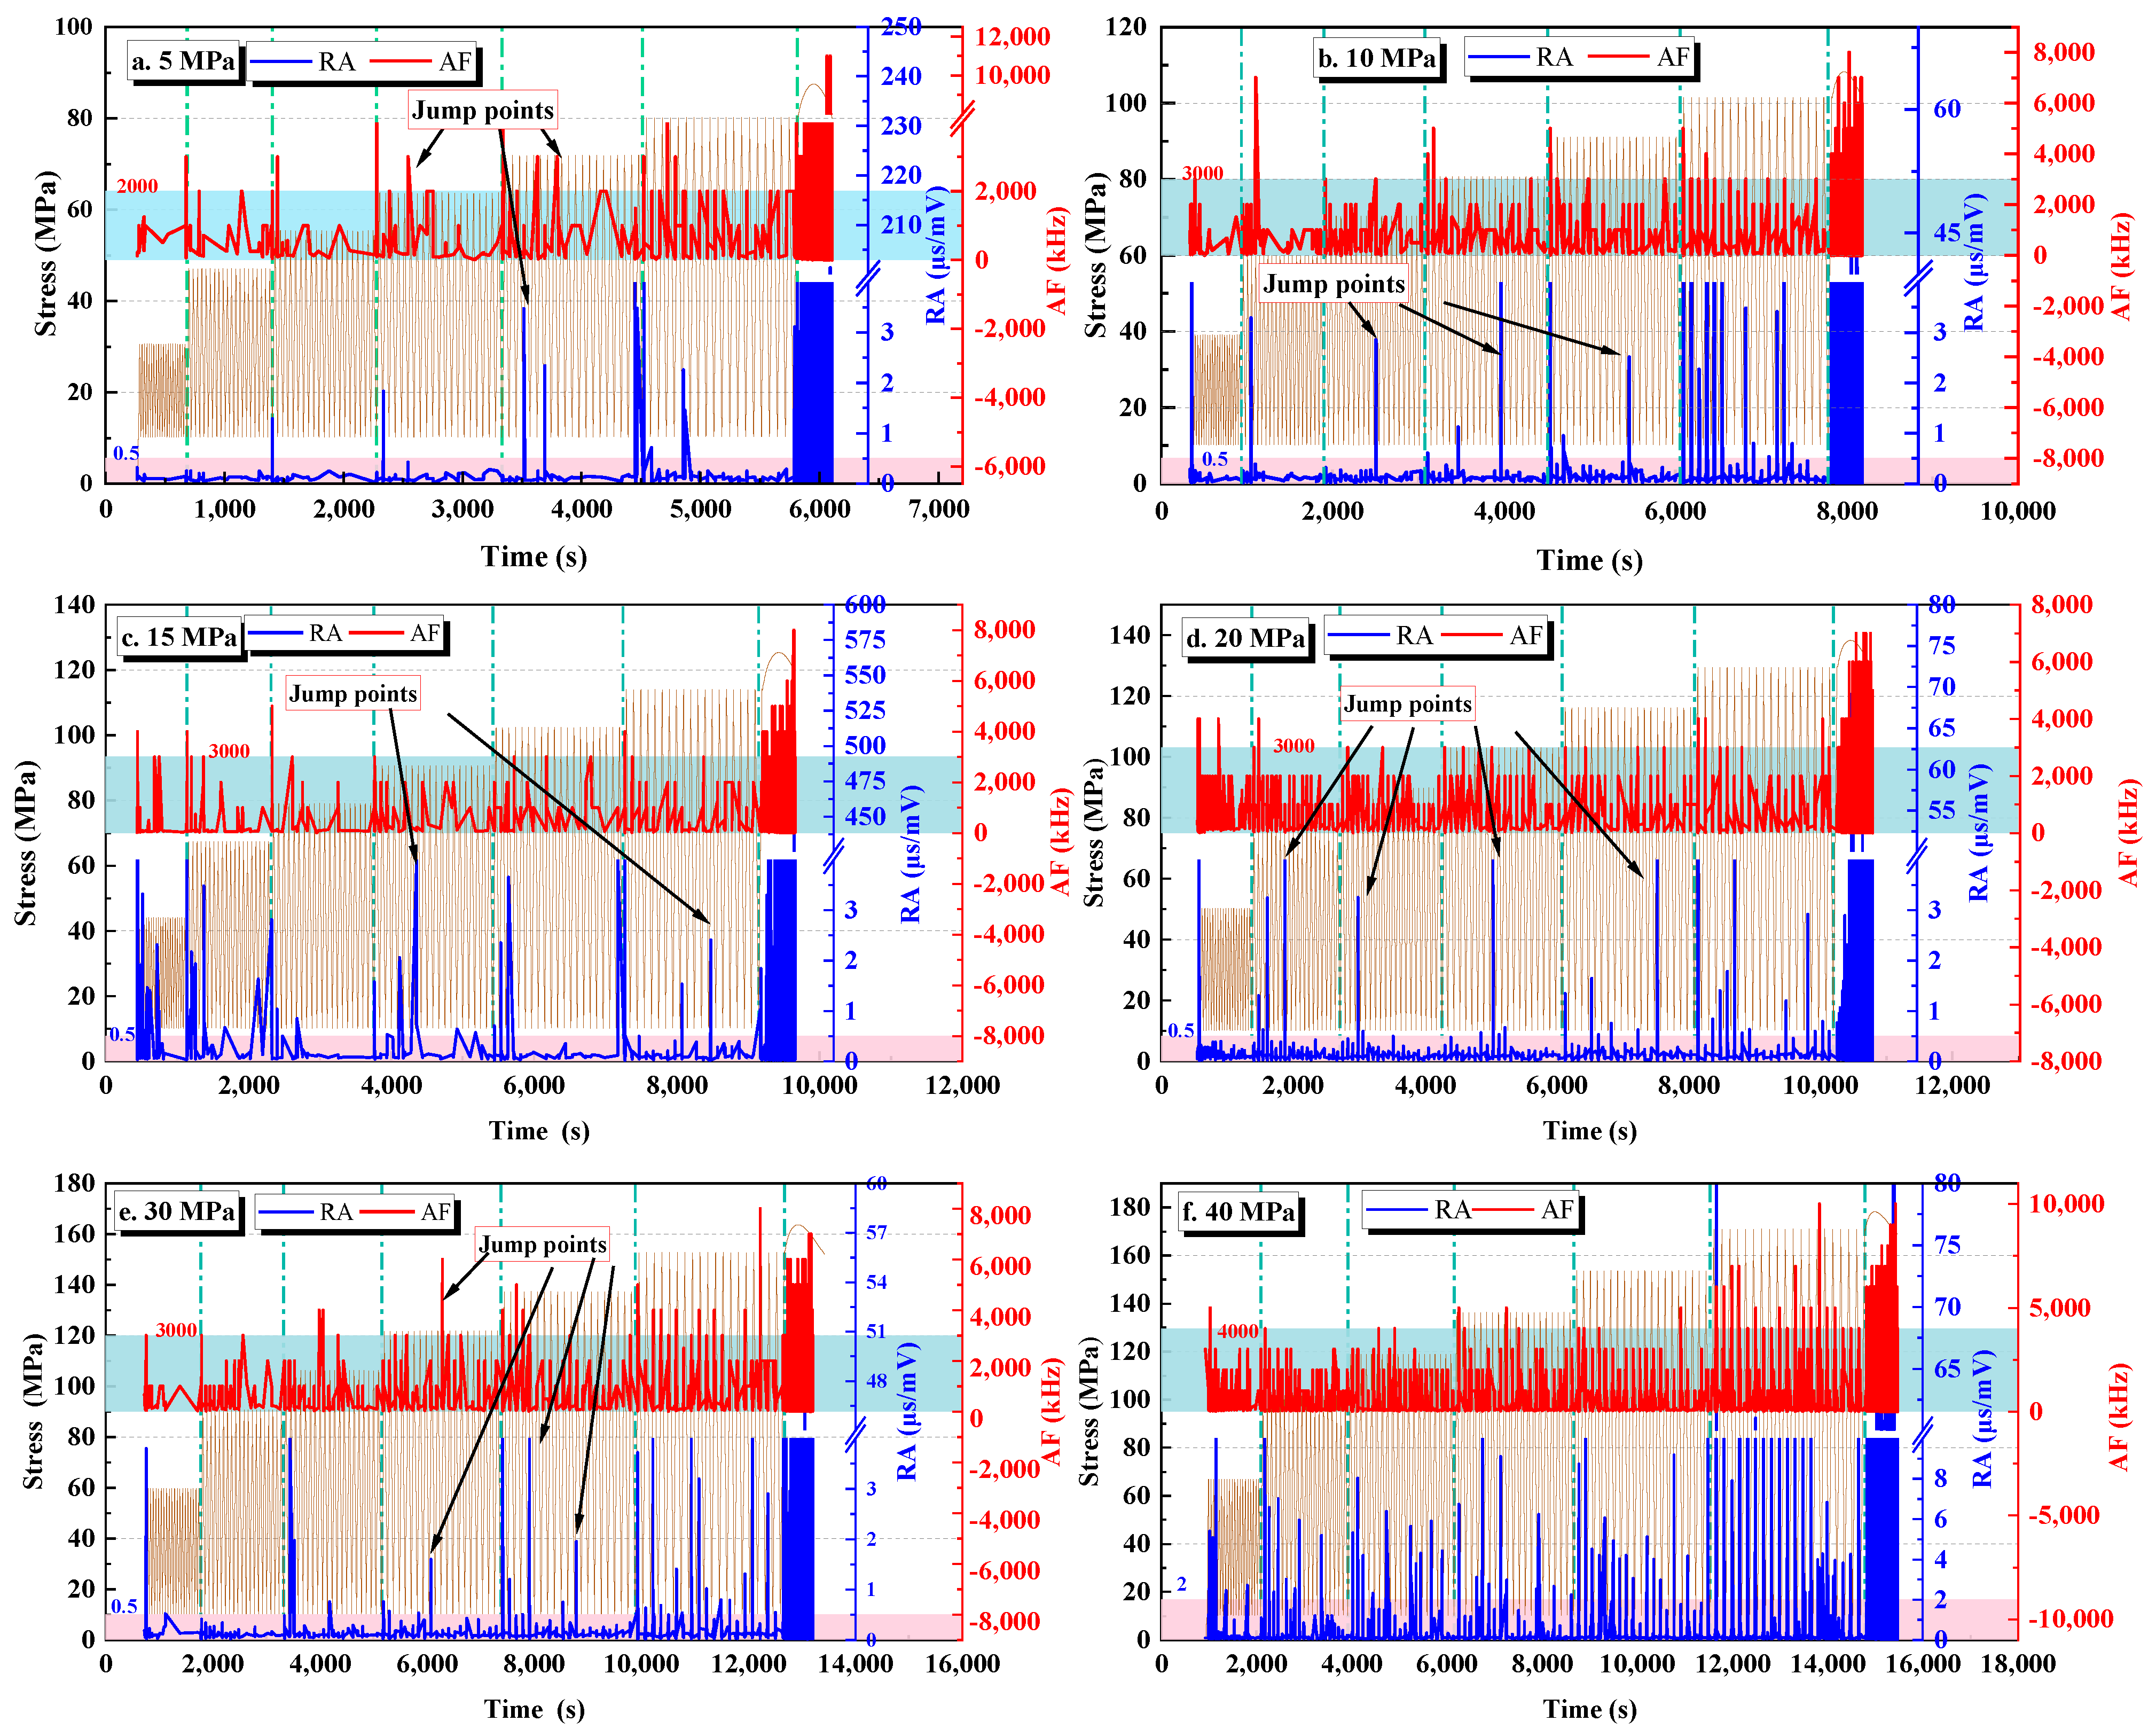
The RA (ratio of the rise time to the amplitude)–AF (ratio of the number of hits to the duration) distribution of AE events is widely used to determine the failure modes of various materials [36,49,50,51,52]. Generally, AE signals due to tensile damage of rocks are characterized by high AF and low RA, while AE signals obtained from shear damage exhibit the opposite characteristics [34,56,57]. Therefore, the damage pattern and evolution of damage in low-permeability sandstone under a complex stress state can be analyzed by the RA–AF value.
Figure 15 shows the trend of the RA–AF distribution during cyclic loading and unloading of low-permeability sandstone under different confining pressures and the range of distribution of RA and AF (90% of the values are within the general value range). The RA and AF values of samples with different confining pressures (5–30 MPa) exhibited similar variation trends. At a low stress level (stage 1–5), the RA–AF value only rises when the stress level increases, and then the fluctuation gradually stabilizes. As the stress level gradually reaches the peak strength of low-permeability sandstone, the RA–AF value gradually increases. This indicates that the abrupt increase in stress causes obvious initiation and propagation of cracks in rocks. The AF value increases slightly at the beginning of each stress level and then fluctuates steadily. The RA value not only increases significantly at the initial stage of each stress level, but also has multiple jump points that increase sharply by several times in the constant amplitude period. This may imply that the tensile and shear cracks are continuously generated in rocks, and shear cracks develop distinctly. At high stress levels (stage 6), the RA–AF values are continuous and intensive. In addition, the RA–AF value under a high confining pressure (40 MPa) is generally larger than that under other confining pressures.

4. Conclusions

Low-permeability sandstone reservoirs of depleted gas fields can also be used to store natural gas. In this paper, both conventional triaxial compression tests and multistage constant and incremental amplitude cyclic loading-unloading experiments were carried out on low-permeability sandstone specimens under different confining pressures. The mechanical properties of low-permeability sandstone were systematically studied considering the impacts of confining pressure, number of cycles and cyclic stress level, and the analysis of acoustic emission signals was used to indirectly reflect the initiation and propagation of microcracks in rocks. Some main conclusions are drawn as follows:
  • Compared with conventional triaxial compression experiments, the peak strength of the low-permeability sandstone increased slightly (less than 10%) after multi-stage constant-amplitude cyclic loading and unloading processes. Based on the variation characteristics of the elastic modulus, the mechanical behavior of low-permeability sandstone under cyclic loading is divided into three stages: the cyclic hardening stage, the mechanical stability stage and the cyclic softening stage.
  • The evolution of AE counts implies that microcracks in rocks develop actively and then gradually stabilize at the initial stage of each level of stress. The evolution of the AE cumulative count shows that the internal cracks of low-permeability sandstone develop obviously with an increase in confining pressure and stress level.
  • The AE frequency signals show a zonal distribution, and they present the same trends under different confining pressures. The intermediate-frequency signals are the dominant type, and the low-frequency and high-frequency signals only appear under high stress, indicating that large cracks appeared under high-stress conditions.
  • The variation of the AE b-value reflects that the internal cracks of rocks initiate faster under low confining pressure than under high confining pressure. The decrease in the b-value in the cyclic loading and unloading stage indicates that damage occurs in the rocks, while the increase in the b-value in the monotonic compression stage indicates that larger cracks initiate in the rocks. The distribution of the RA–AF value shows that the mixed tensile–shear cracks are continuously generated in low-permeability sandstone during the cyclic loading process, and the development of shear cracks is more obvious.

Author Contributions

H.T.: Writing—original draft, Investigation, Methodology. H.L.: Investigation, Visualization, Conceptualization, Review and editing. X.S.: Conceptualization, Funding acquisition. H.M.: Data curation, Review and editing. X.Q.: Project administration. Y.G.: Formal analysis. S.B.: Visualization. All authors have read and agreed to the published version of the manuscript.

Funding

The authors would gratefully like to acknowledge the financial support from the CAS Pioneer Hundred Talents Program (Y826031C01), National Natural Science Foundation (U22A20166), Key Research and Development Program of Hubei Province (Nos. 2022BAA093, 2022BAD163), Major Science and Technology Research and Development Special Program of Jiangxi Provincial (2023ACG01004).

Data Availability Statement

Data will be made available on request.

Conflicts of Interest

The authors declare that they have no known competing financial interest or personal relationships that could have appeared to influence the work reported in this paper.

References

  1. Yang, X.; Cheng, L.; He, X.; Geng, T.; Li, C. A Prediction Method for Multi-Stage Injection and Recovery Capacity of Underground Gas Storage. Nat. Gas Ind. 2013, 33, 96–99. [Google Scholar] [CrossRef]
  2. Matos, C.R.; Carneiro, J.F.; Silva, P.P. Overview of Large-Scale Underground Energy Storage Technologies for Integration of Renewable Energies and Criteria for Reservoir Identification. J. Energy Storage 2019, 21, 241–258. [Google Scholar] [CrossRef]
  3. Liu, H.; Yang, C.; Liu, J.; Hou, Z.; Xie, Y.; Shi, X. An Overview of Underground Energy Storage in Porous Media and Development in China. Gas Sci. Eng. 2023, 117, 205079. [Google Scholar] [CrossRef]
  4. Qiu, X.; Liu, H.; Liu, M.; Mao, H.; Wang, D.; Ying, Q.; Ban, S. Pore Structure Evolution in Sandstone of Underground Gas Storage during Cyclic Injection and Production Based on Nuclear Magnetic Resonance Technology. Energies 2023, 16, 2096. [Google Scholar] [CrossRef]
  5. Molíková, A.; Vítězová, M.; Vítěz, T.; Buriánková, I.; Huber, H.; Dengler, L.; Hanišáková, N.; Onderka, V.; Urbanová, I. Underground Gas Storage as a Promising Natural Methane Bioreactor and Reservoir? J. Energy Storage 2022, 47, 103631. [Google Scholar] [CrossRef]
  6. Tang, Y.; Hu, S.; He, Y.; Wang, Y.; Wan, X.; Cui, S.; Long, K. Experiment on CO2-Brine-Rock Interaction during CO2 Injection and Storage in Gas Reservoirs with Aquifer. Chem. Eng. J. 2021, 413, 127567. [Google Scholar] [CrossRef]
  7. Song, R.; Wang, Y.; Tang, Y.; Peng, J.; Liu, J.; Yang, C. 3D Printing of Natural Sandstone at Pore Scale and Comparative Analysis on Micro-Structure and Single/Two-Phase Flow Properties. Energy 2022, 261, 125226. [Google Scholar] [CrossRef]
  8. Liu, H.; Hou, Z.; Were, P.; Gou, Y.; Sun, X. Numerical Investigation of the Formation Displacement and Caprock Integrity in the Ordos Basin (China) during CO2 Injection Operation. J. Pet. Sci. Eng. 2016, 147, 168–180. [Google Scholar] [CrossRef]
  9. Song, R.; Liu, J.; Yang, C.; Sun, S. Study on the Multiphase Heat and Mass Transfer Mechanism in the Dissociation of Methane Hydrate in Reconstructed Real-Shape Porous Sediments. Energy 2022, 254, 124421. [Google Scholar] [CrossRef]
  10. Mahmoodpour, S.; Singh, M.; Bär, K.; Sass, I. Thermo-Hydro-Mechanical Modeling of an Enhanced Geothermal System in a Fractured Reservoir Using Carbon Dioxide as Heat Transmission Fluid—A Sensitivity Investigation. Energy 2022, 254, 124266. [Google Scholar] [CrossRef]
  11. Mahmoodpour, S.; Singh, M.; Turan, A.; Bär, K.; Sass, I. Simulations and Global Sensitivity Analysis of the Thermo-Hydraulic-Mechanical Processes in a Fractured Geothermal Reservoir. Energy 2022, 247, 123511. [Google Scholar] [CrossRef]
  12. Shaibu, R.; Sambo, C.; Guo, B.; Dudun, A. An Assessment of Methane Gas Production from Natural Gas Hydrates: Challenges, Technology and Market Outlook. Adv. Geo-Energy Res. 2021, 5, 318–332. [Google Scholar] [CrossRef]
  13. Hu, M.; Xu, W.; Wang, H.; Ning, Y.; Wang, R.; Lyu, C.; Zhang, T. Deformation Characteristics of Muddy Sandstones during Cyclic Loading and Unloading with Different Stress Lower Limits under Pore Pressure. Int. J. Fatigue 2023, 172, 107606. [Google Scholar] [CrossRef]
  14. Jia, C.; Xu, W.; Wang, R.; Wang, W.; Zhang, J.; Yu, J. Characterization of the Deformation Behavior of Fine-Grained Sandstone by Triaxial Cyclic Loading. Constr. Build. Mater. 2018, 162, 113–123. [Google Scholar] [CrossRef]
  15. Xu, T.; Tian, H.; Zhu, H.; Cai, J. China Actively Promotes CO2 Capture, Utilization and Storage Research to Achieve Carbon Peak and Carbon Neutrality. Adv. Geo-Energy Res. 2022, 6, 1–3. [Google Scholar] [CrossRef]
  16. Liu, E.; Huang, R.; He, S. Effects of Frequency on the Dynamic Properties of Intact Rock Samples Subjected to Cyclic Loading under Confining Pressure Conditions. Rock Mech. Rock Eng. 2012, 45, 89–102. [Google Scholar] [CrossRef]
  17. Bagde, M.N.; Petroš, V. Fatigue Properties of Intact Sandstone Samples Subjected to Dynamic Uniaxial Cyclical Loading. Int. J. Rock Mech. Min. Sci. 2005, 42, 237–250. [Google Scholar] [CrossRef]
  18. Wang, M.; Li, J.; Tan, H.; Wang, J.; Shi, Z.; Li, K. Study on Fatigue Characteristics and Thermal Damage Mechanism of Red Sandstone under High Temperature-Cyclic Load Coupling. Int. J. Fatigue 2023, 168, 107405. [Google Scholar] [CrossRef]
  19. Wang, J.; Li, J.; Shi, Z.; Chen, J. Fatigue Damage and Fracture Evolution Characteristics of Sandstone under Multistage Intermittent Cyclic Loading. Theor. Appl. Fract. Mech. 2022, 119, 103375. [Google Scholar] [CrossRef]
  20. Tan, H.; Li, J.; Shi, Z.; Wang, M.; Wang, J.; Li, J. Damage Evolution and Failure Characteristics of Red Sandstone with Prefabricated Crack under Coupled Dry–Wet Cycle-Fatigue Loading. Int. J. Fatigue 2023, 175, 107751. [Google Scholar] [CrossRef]
  21. Yang, S.-Q.; Ranjith, P.G.; Huang, Y.-H.; Yin, P.-F.; Jing, H.-W.; Gui, Y.-L.; Yu, Q.-L. Experimental Investigation on Mechanical Damage Characteristics of Sandstone under Triaxial Cyclic Loading. Geophys. J. Int. 2015, 201, 662–682. [Google Scholar] [CrossRef]
  22. Zhou, J.; Deng, G.; Tian, S.; Xian, X.; Yang, K.; Zhang, C.; Dong, Z. Experimental Study on the Permeability Variation of Sandstone at Cyclic Stress: Implication for Underground Gas Storage. J. Energy Storage 2023, 60, 106677. [Google Scholar] [CrossRef]
  23. Bagde, M.N.; Petroš, V. Waveform Effect on Fatigue Properties of Intact Sandstone in Uniaxial Cyclical Loading. Rock Mech. Rock Eng. 2005, 38, 169–196. [Google Scholar] [CrossRef]
  24. Ray, S.K.; Sarkar, M.; Singh, T.N. Effect of Cyclic Loading and Strain Rate on the Mechanical Behaviour of Sandstone. Int. J. Rock Mech. Min. Sci. 1999, 36, 543–549. [Google Scholar] [CrossRef]
  25. Shirani Faradonbeh, R.; Taheri, A.; Karakus, M. Failure Behaviour of a Sandstone Subjected to the Systematic Cyclic Loading: Insights from the Double-Criteria Damage-Controlled Test Method. Rock Mech. Rock Eng. 2021, 54, 5555–5575. [Google Scholar] [CrossRef]
  26. Yang, C.; Liu, J. Petroleum Rock Mechanics: An Area Worthy of Focus in Geo-Energy Research. Adv. Geo-Energy Res. 2021, 5, 351–352. [Google Scholar] [CrossRef]
  27. Li, H.; Ma, H.; Yang, C.; Zhao, K.; Hu, Z.; Daemen, J.J.K. Acoustic Emission Characteristics of Rock Salt under Multi-Stage Cyclic Loading. Int. J. Fatigue 2023, 176, 107911. [Google Scholar] [CrossRef]
  28. Rodríguez, P.; Celestino, T.B. Application of Acoustic Emission Monitoring and Signal Analysis to the Qualitative and Quantitative Characterization of the Fracturing Process in Rocks. Eng. Fract. Mech. 2019, 210, 54–69. [Google Scholar] [CrossRef]
  29. Zhao, K.; Yang, D.; Zeng, P.; Huang, Z.; Wu, W.; Li, B.; Teng, T. Effect of Water Content on the Failure Pattern and Acoustic Emission Characteristics of Red Sandstone. Int. J. Rock Mech. Min. Sci. 2021, 142, 104709. [Google Scholar] [CrossRef]
  30. Li, S.; Yang, D.; Huang, Z.; Gu, Q.; Zhao, K. Acoustic Emission Characteristics and Failure Mode Analysis of Rock Failure under Complex Stress State. Theor. Appl. Fract. Mech. 2022, 122, 103666. [Google Scholar] [CrossRef]
  31. Fan, J.; Chen, J.; Jiang, D.; Chemenda, A.; Chen, J.; Ambre, J. Discontinuous Cyclic Loading Tests of Salt with Acoustic Emission Monitoring. Int. J. Fatigue 2017, 94, 140–144. [Google Scholar] [CrossRef]
  32. Zhao, K.; Ma, H.; Liang, X.; Li, X.; Liu, Y.; Cai, R.; Ye, L.; Yang, C. Damage Evaluation of Rock Salt under Multilevel Cyclic Loading with Constant Stress Intervals Using AE Monitoring and CT Scanning. J. Pet. Sci. Eng. 2022, 208, 109517. [Google Scholar] [CrossRef]
  33. Zhao, K.; Ma, H.; Yang, C.; Daemen, J.J.K. The Role of Prior Creep Duration on the Acoustic Emission Characteristics of Rock Salt under Cyclic Loading. Int. J. Rock Mech. Min. Sci. 2022, 157, 105166. [Google Scholar] [CrossRef]
  34. Li, Z.; Suo, J.; Fan, J.; Fourmeau, M.; Jiang, D.; Nelias, D. Damage Evolution of Rock Salt under Multilevel Amplitude Creep–Fatigue Loading with Acoustic Emission Monitoring. Int. J. Rock Mech. Min. Sci. 2023, 164, 105346. [Google Scholar] [CrossRef]
  35. Chang, D.; Hu, J.; Guo, H.; Duo, T.; Yang, J.; Cheng, F. Dynamic Analysis of Wen 23 Gas Storage. Highlights Sci. Eng. Technol. 2022, 25, 175–180. [Google Scholar] [CrossRef]
  36. Ma, X.; Zheng, D.; Wei, G.; Ding, G.; Zheng, S. Development directions of major scientific theories and technologies for underground gas storage. Nat. Gas Ind. 2022, 42, 93–99. [Google Scholar]
  37. Martin, C.D.; Chandler, N.A. The Progressive Fracture of Lac Du Bonnet Granite. Int. J. Rock Mech. Min. Sci. Geomech. Abstr. 1994, 31, 643–659. [Google Scholar] [CrossRef]
  38. Jaeger, J.; Cook, N.; Zimmerman, R. Fundamental of Rock Mechanics; Wiley: Hoboken, NJ, USA, 2007. [Google Scholar]
  39. Zhao, G.; Guo, Y.; Chang, X.; Jin, P.; Hu, Y. Effects of Temperature and Increasing Amplitude Cyclic Loading on the Mechanical Properties and Energy Characteristics of Granite. Bull. Eng. Geol. Environ. 2022, 81, 155. [Google Scholar] [CrossRef]
  40. Lin, H.; Liu, J.; Yang, J.; Ran, L.; Ding, G.; Wu, Z.; Lyu, C.; Bian, Y. Analysis of Damage Characteristics and Energy Evolution of Salt Rock under Triaxial Cyclic Loading and Unloading. J. Energy Storage 2022, 56, 106145. [Google Scholar] [CrossRef]
  41. Xie, H.; Gao, F.; Ju, Y. Research and development of rock mechanics in deep ground engineering. Chin. J. Rock Mech. Eng. 2015, 34, 2161–2178. [Google Scholar] [CrossRef]
  42. Zhao, G.; Chang, X.; Guo, Y.; Yang, H.; Guo, W.; Hu, Y. Fatigue of Granite Subjected to Cyclic Loading at Various Temperatures: Experimental Insights from Deformation and Energy Conversion. Geomech. Geophys. Geo-Energy Geo-Resour. 2022, 8, 64. [Google Scholar] [CrossRef]
  43. Liu, Y.; Ma, T.; Wu, H.; Chen, P. Investigation on Mechanical Behaviors of Shale Cap Rock for Geological Energy Storage by Linking Macroscopic to Mesoscopic Failures. J. Energy Storage 2020, 29, 101326. [Google Scholar] [CrossRef]
  44. Du, K.; Li, X.; Tao, M.; Wang, S. Experimental Study on Acoustic Emission (AE) Characteristics and Crack Classification during Rock Fracture in Several Basic Lab Tests. Int. J. Rock Mech. Min. Sci. 2020, 133, 104411. [Google Scholar] [CrossRef]
  45. Barile, C.; Casavola, C.; Pappalettera, G.; Kannan, V.P. Application of Different Acoustic Emission Descriptors in Damage Assessment of Fiber Reinforced Plastics: A Comprehensive Review. Eng. Fract. Mech. 2020, 235, 107083. [Google Scholar] [CrossRef]
  46. Chai, M.; Hou, X.; Zhang, Z.; Duan, Q. Identification and Prediction of Fatigue Crack Growth under Different Stress Ratios Using Acoustic Emission Data. Int. J. Fatigue 2022, 160, 106860. [Google Scholar] [CrossRef]
  47. Jiang, Z.; Li, Q.; Hu, Q.; Liang, Y.; Xu, Y.; Liu, L.; Wu, X.; Li, X.; Wang, X.; Hu, L.; et al. Acoustic Emission Characteristics in Hydraulic Fracturing of Stratified Rocks: A Laboratory Study. Powder Technol. 2020, 371, 267–276. [Google Scholar] [CrossRef]
  48. Scholz, C.H. Microfracturing and the Inelastic Deformation of Rock in Compression. J. Geophys. Res. 1968, 73, 1417–1432. [Google Scholar] [CrossRef]
  49. Liu, M.; Lu, J.; Ming, P.; Song, J. AE-Based Damage Identification of Concrete Structures under Monotonic and Fatigue Loading. Constr. Build. Mater. 2023, 377, 131112. [Google Scholar] [CrossRef]
  50. Shi, Z.; Li, J.; Wang, J. Effect of Creep Load on Fatigue Behavior and Acoustic Emission Characteristics of Sandstone Containing Pre-Existing Crack during Fatigue Loading. Theor. Appl. Fract. Mech. 2022, 119, 103296. [Google Scholar] [CrossRef]
  51. Zhang, Q.; Zhang, X.-P. A Numerical Study on Cracking Processes in Limestone by the B-Value Analysis of Acoustic Emissions. Comput. Geotech. 2017, 92, 1–10. [Google Scholar] [CrossRef]
  52. Sagasta, F.; Zitto, M.E.; Piotrkowski, R.; Benavent-Climent, A.; Suarez, E.; Gallego, A. Acoustic Emission Energy B-Value for Local Damage Evaluation in Reinforced Concrete Structures Subjected to Seismic Loadings. Mech. Syst. Signal Process. 2018, 102, 262–277. [Google Scholar] [CrossRef]
  53. Wang, Y.; Han, J.Q.; Song, Z.Y.; Zhu, C. Macro-Meso Failure Behavior of Pre-Flawed Hollow-Cylinder Granite under Multi-Level Cyclic Loads: Insights from Acoustic Emission and Post-Test CT Scanning. Eng. Fract. Mech. 2021, 258, 108074. [Google Scholar] [CrossRef]
  54. Lockner, D. The Role of Acoustic Emission in the Study of Rock Fracture. Int. J. Rock Mech. Min. Sci. Geomech. Abstr. 1993, 30, 883–899. [Google Scholar] [CrossRef]
  55. Song, D.; Wang, E.; Song, X.; Jin, P.; Qiu, L. Changes in Frequency of Electromagnetic Radiation from Loaded Coal Rock. Rock Mech. Rock Eng. 2016, 49, 291–302. Available online: https://link.springer.com/article/10.1007/s00603-015-0738-6 (accessed on 21 June 2023). [CrossRef]
  56. Soulioti, D.; Barkoula, N.M.; Paipetis, A.; Matikas, T.E.; Shiotani, T.; Aggelis, D.G. Acoustic Emission Behavior of Steel Fibre Reinforced Concrete under Bending. Constr. Build. Mater. 2009, 23, 3532–3536. [Google Scholar] [CrossRef]
  57. Aggelis, D.G. Classification of Cracking Mode in Concrete by Acoustic Emission Parameters. Mech. Res. Commun. 2011, 38, 153–157. [Google Scholar] [CrossRef]
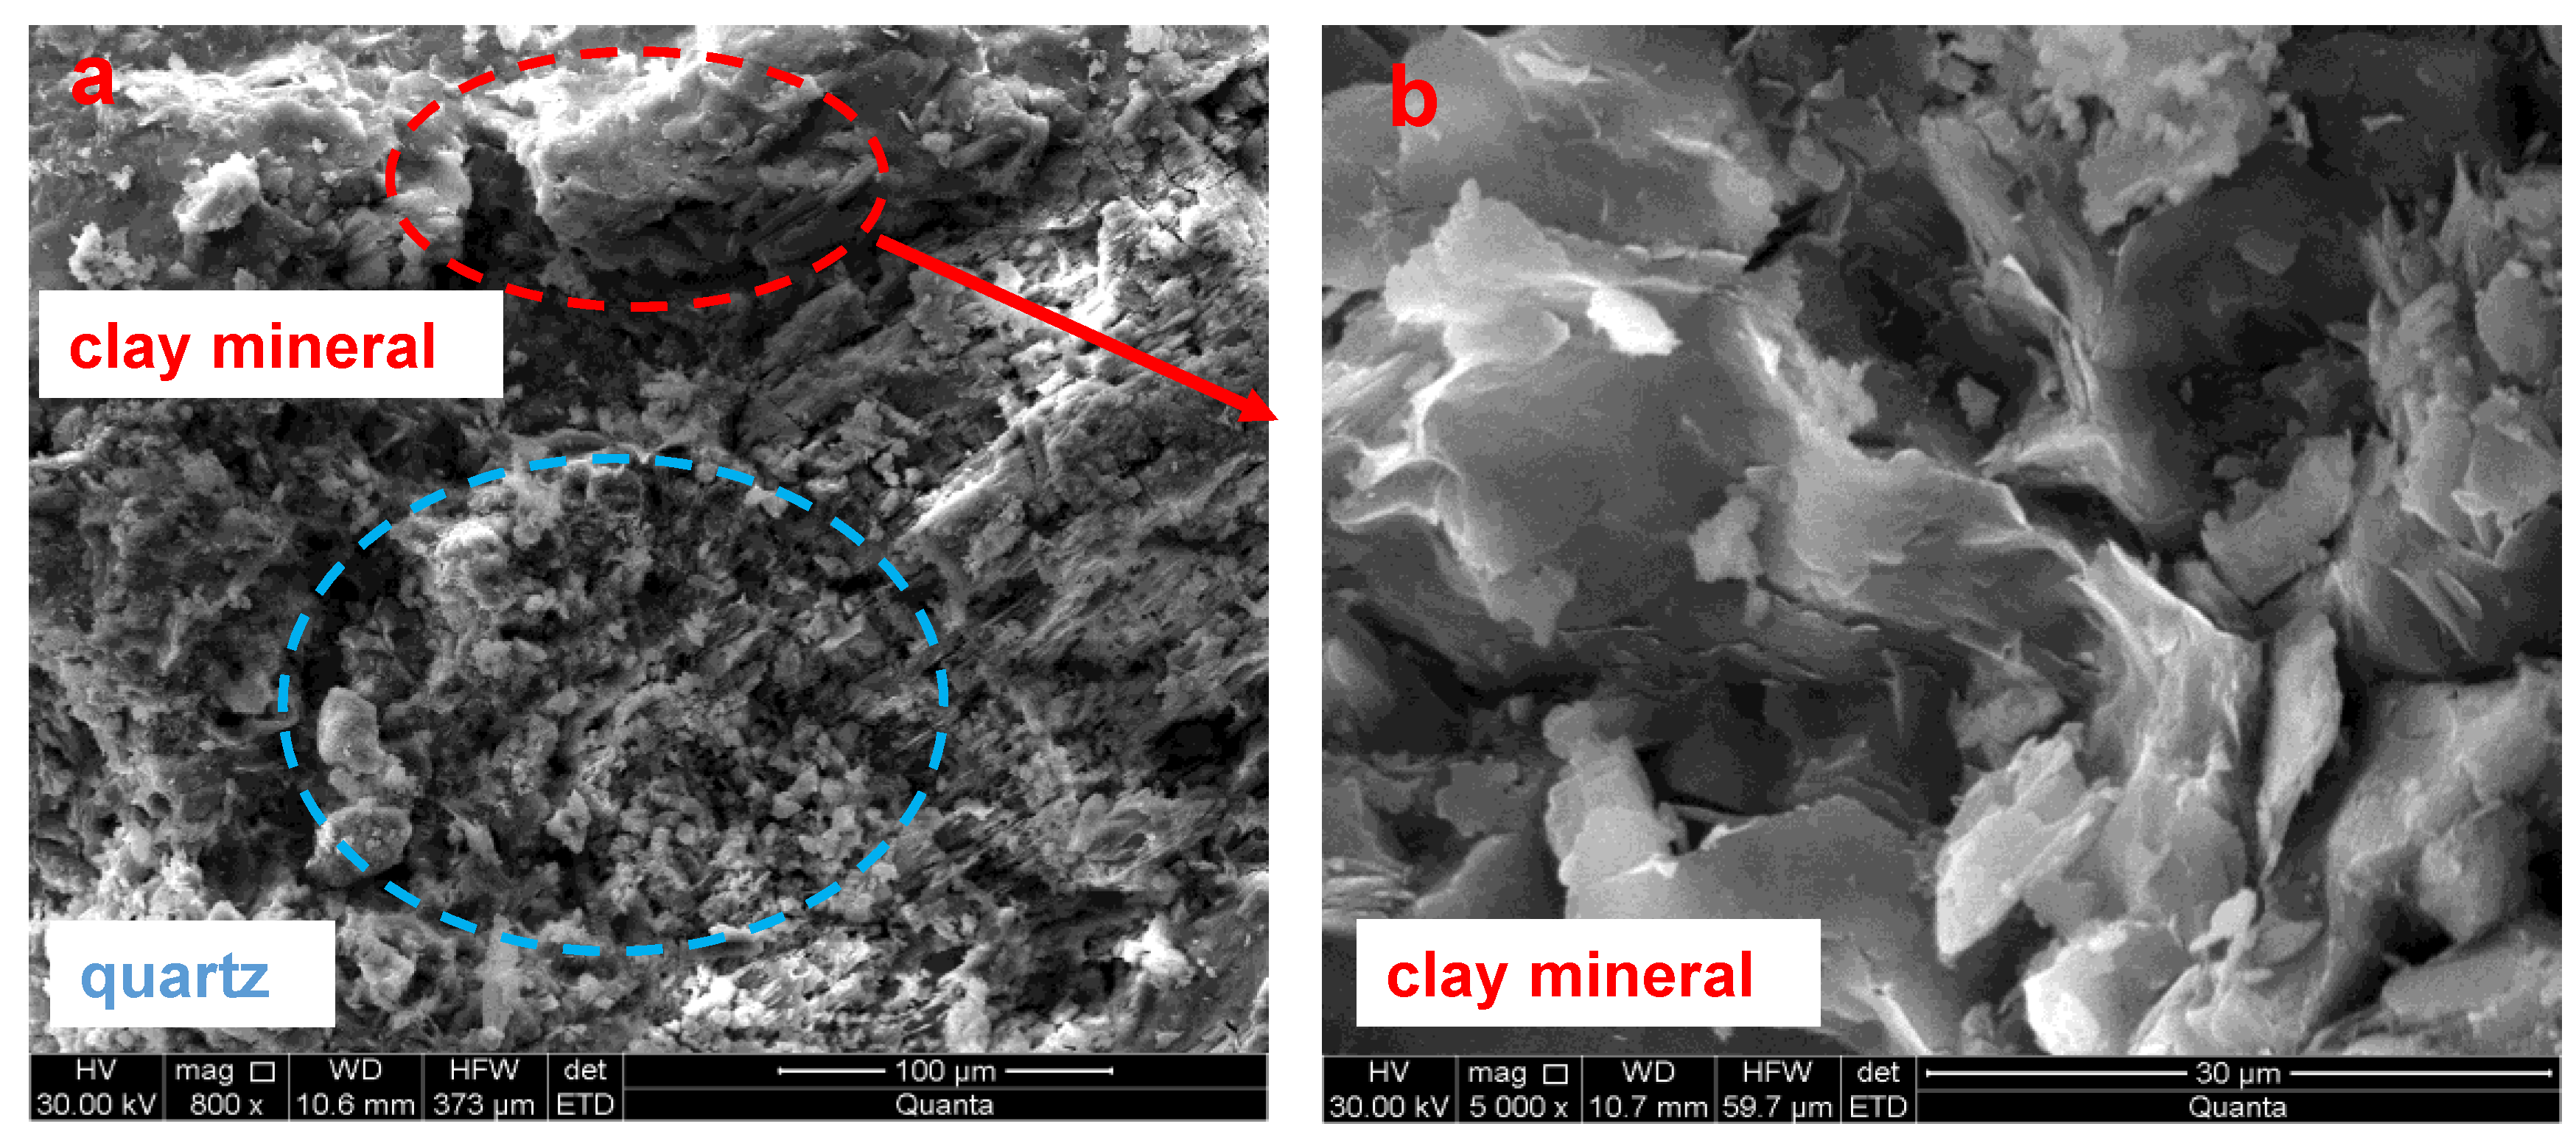
Figure 1. Microstructure of low-permeability sandstone observed by scanning electron microscopy (a), and partial enlarged view of clay minerals (b).
Energies 16 06821 g001
Figure 2. MTS815 experimental equipment and low-permeability sandstone samples.
Energies 16 06821 g002
Figure 3. Schematic diagram of multilevel and multicycle loading paths (I–VI represent six maximum axial stress levels 0.4σc, 0.6σc, 0.7σc, 0.8σc, 0.9σc, σc).
Energies 16 06821 g003
Figure 4. Stress-strain curve of low-permeability sandstone under different confining pressures (The dotted line represents the radial strain curve, and the solid line represent the axial strain curve).
Energies 16 06821 g004
Figure 5. Deviatoric stress-axial strain curves after cyclic loading-unloading experiments with different confining pressures. ((af): 5 MPa, 10 MPa, 15 MPa, 20 MPa, 30 MPa and 40 MPa).
Energies 16 06821 g005
Figure 6. Evolution of the elastic modulus: (a) under different confining pressures (I–VI represent six maximum axial stress levels 0.4σc, 0.6σc, 0.7σc, 0.8σc, 0.9σc, σc); (bd) under confining pressures of 5, 20 and 40 MPa, respectively.
Energies 16 06821 g006
Figure 7. Variation in the axial irreversible strain with the number of cycles under the cyclic loading process: (a) with confining pressures of 5, 10 and 15 MPa; (b) with confining pressures of 20, 30 and 40 MPa.
Energies 16 06821 g007
Figure 8. Relationship between axial stress, AE count (cumulative count) and time under different confining pressures: (af) represent 5 MPa, 10 MPa, 15 MPa, 20 MPa, 30 MPa and 40 MPa, respectively. (Red: AE count; Blue: AE Cumulative Count; Black: Axial Stress).
Energies 16 06821 g008
Figure 9. The evolution of AE counts with time in the first 5 cycles of axial stress loading and unloading process under a confining pressure of 10 MPa. (stage 1~stage 6 represent six different maximum axial stress levels 0.4σc, 0.6σc, 0.7σc, 0.8σc, 0.9σc, σc).
Energies 16 06821 g009
Figure 10. Variations in peak frequency with time during cyclic loading: (af) represent 5, 10, 15, 20, 30 and 40 MPa confining pressure. (Blue part is low frequency, green part is intermediate frequency and yellow part is high frequency).
Energies 16 06821 g010
Figure 11. Relationship between peak frequency and normalized amplitude under different confining pressures ((af): 5 MPa, 10 MPa, 15 MPa, 20 MPa, 30 MPa and 40 MPa; the red line is the median after normalization of the amplitude).
Energies 16 06821 g011
Figure 12. Variations in peak frequency, amplitude and axial stress with time under different confining pressures ((af): 5 MPa, 10 MPa, 15 MPa, 20 MPa, 30 MPa and 40 MPa).
Energies 16 06821 g012
Figure 13. Statistical distribution of macroscopic AE counts under cyclic loading ((af) represent the confining pressures of 5 MPa, 10 MPa, 15 MPa, 20 MPa, 30 MPa and 40 MPa; blue line is the cumulative curve of macroscopic AE counts, and the red line is the fitting curve of amplitude and macroscopic AE counts).
Energies 16 06821 g013
Figure 14. Changes in the b-value in the process of cyclic loading: (a) equation fitting to obtain the b-value; (b) the relationship between the b-value and loading stages. A–F refer to the first to sixth stages, respectively, and G–J refer to 1/4, 1/2, 3/4 and 1 of the monotonous loading stage, respectively.
Energies 16 06821 g014
Figure 15. Variation in RA and AF during cyclic loading under different confining pressures (red and blue lines represent RA and AF, respectively, and brown lines represent stress paths).
Energies 16 06821 g015
Table 1. Basic geometric and mechanical parameters of low-permeability sandstone samples.
Confining Pressure
(MPa)
Length
(mm)
Diameter
(mm)
Peak
Strength
(MPa)
Peak Strength under Cyclic Load
(MPa)
Increment
(%)
Elastic Modulus
(GPa)
Poisson’s Ratio
(-)
5100.4449.7783.1487.515.2616.390.29
10100.4549.80104.51108.273.6418.310.32
15100.6549.86116.99125.387.1717.860.29
20100.5649.80132.24138.314.5919.740.24
30100.5749.83155.87163.634.9819.630.24
40100.4249.97173.43178.162.7322.070.29
Table 2. Statistics of the initial occurrence time of different signals.
SamplesHAHFLAHFHALFLALF
TS-5Failure--Stage4-No.2Stage6-No.1
TS-10Stage1-No.1----Stage4-No.17
TS-15Stage4-No.2FailureStage1-No.1Stage1-No.1
TS-20Stage2-No.1Stage6-No.1
(More at Failure)
FailureStage1-No.3
(More at Failure)
TS-30Stage5-No.1Failure--Failure
TS-40Stage1-No.1Stage1-No.1--Stage6-No.6
Disclaimer/Publisher’s Note: The statements, opinions and data contained in all publications are solely those of the individual author(s) and contributor(s) and not of MDPI and/or the editor(s). MDPI and/or the editor(s) disclaim responsibility for any injury to people or property resulting from any ideas, methods, instructions or products referred to in the content.