Article

Optimal Location and Size of Static Var Compensators (SVC) to Enhance the Voltage Profile on the Main Interconnected System in Oman

Department of Electrical and Computer Engineering, College of Engineering, Sultan Qaboos University, P.O. Box 33, Muscat 123, Oman
*
Author to whom correspondence should be addressed.
Energies 2023, 16(19), 6802; https://doi.org/10.3390/en16196802
Submission received: 29 June 2023 / Revised: 5 September 2023 / Accepted: 22 September 2023 / Published: 25 September 2023
(This article belongs to the Topic Modeling, Optimization, and Control of Energy Systems)

Abstract

:
This study aimed to optimize the incorporation of static var compensators (SVCs) into Oman’s main interconnected system (MIS) using real 2023 MIS data. Leveraging the particle swarm optimization (PSO) algorithm within MATLAB, substantial enhancements were achieved in voltage profiles, with associated losses reducing by roughly 2%. A multi-objective strategy effectively managed costs while preserving improved voltage profiles and controlled losses. Validation through DigSILENT showcased the dynamic advantages of optimal SVC placement through consistently elevating voltage profiles and mitigating losses, notably within the Muscat region. Analyses encompassing harmonics, transient stability, and load distribution indicated that harmonics remained within acceptable thresholds, and overall system stability was enhanced. Optimal SVC deployment expedited the attainment of steady-state conditions, as illustrated via the QV curve, demonstrating increased stability as the buses loaded from 18% to 96%. These findings underscore the robust and efficient nature of SVC integration as a viable solution within Oman’s MIS system, addressing voltage profile enhancement, loss minimization, and fortified system stability.

1. Introduction

During the last three decades, electricity demand has risen dramatically. However, the generating units’ development has been delayed because of rising energy prices, environmental considerations, right-of-way limitations, and other logistical and financial challenges. As a result, power plants operate at the full capacity of transmission lines (TL) in order to meet electrical demand [1]. The transmission network connects power plants and load centers to reduce the total power producing capacity and fuel costs [2]. Therefore, transmission lines are run at maximum capacity near to their thermal limits [3]. Consequently, electrical utilities are more focused on controlling and regulating the power-flow via the main transmission lines without compromising system reliability as the need for higher electrical energy transfer across existing transmission lines grows. On the other hand, the capacity of transmission lines is limited by some factors. Issues such as transmission network stability, thermal limits, safety, and efficiency may be highlighted as the top restricting factors [4]. The effect of system stability in terms of voltage or poor voltage regulation is one of the key issues in the transmission system. Controlling reactive power in transmission lines will increase the voltage stability of the power system network [5]. Utilizing flexible alternating current transmission systems (FACTS) is one of the most popular ways to improve transient stability. FACTS devices are based on power electronics technology, which can control the angle and amplitude of the voltage and current allowing for more flexibility and control of the system operation. The most frequently used FACTS devices are static VAR compensators (SVC) and static synchronous compensators (STATCOM), which control the flow of reactive power in the system and are used to maintain the voltage magnitude at its point of connection [2,6,7]. STATCOM is superior to SVC in terms of a better voltage profile, yet STATCOM is more expensive than SVC in terms of cost [8,9,10,11,12,13]. This work investigated the optimal location, size, and dynamic behavior of SVC.
The power system in Oman is partially integrated. The MIS (main interconnected system), which spans the northern section of the Sultanate, is the main part of the system. Oman Electricity Transmission Company (OETC) is responsible for the transmission system, while Nama Electricity Distribution Company is responsible for the distribution systems [14]. The main interconnected transmission system (MIS) includes three operating voltages: 400 kV, 220 kV, and 132 kV. The MIS demand is growing yearly, and the generation of utilities should meet the system’s requirements [14]. Furthermore, OETC plans to install new 400 kV, 220 kV, and 132 kV systems, as well as accompanying grid stations to permit the transfer of energy from centralized power plants and future renewable energy resources. Moreover, large customers with large loads will be directly connected to 220 kV and 132 kV busbars. Therefore, integrating many sources of renewable energy into the system, vast transmission networks, and different demand patterns is affecting the voltage profile of the system. Voltage regulation necessitates careful control of both active and reactive power flows across the transmission system. Regulation of reactive power, which generation units can provide with transformer tap-changers, capacitor banks at 33 kV or below, shunt reactors, series capacitors, or a static var compensator, is required for voltage regulation. OETC has installed shunt reactors on the 400 kV lines to address the overvoltage problem during a light load [
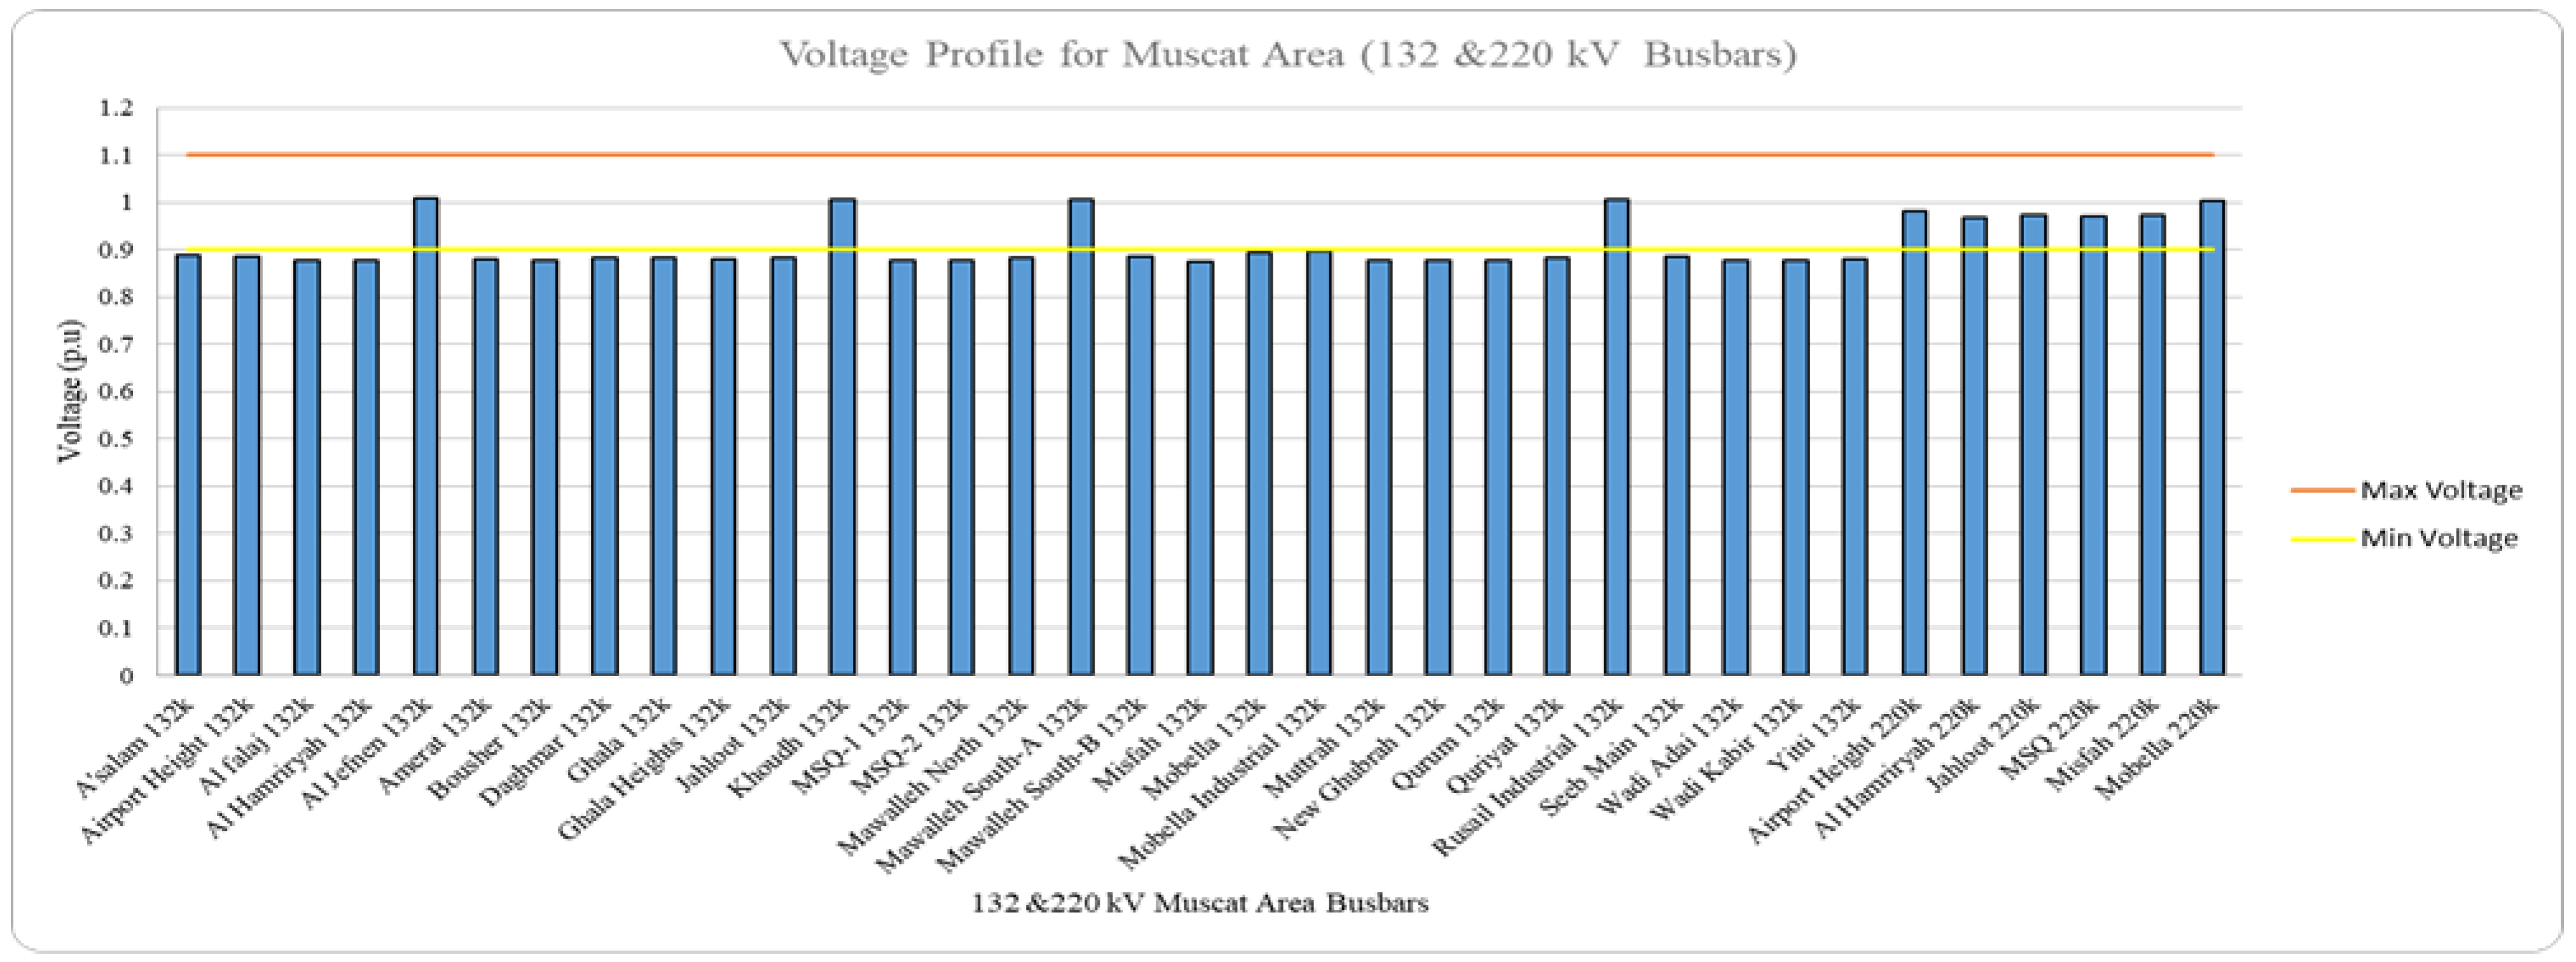
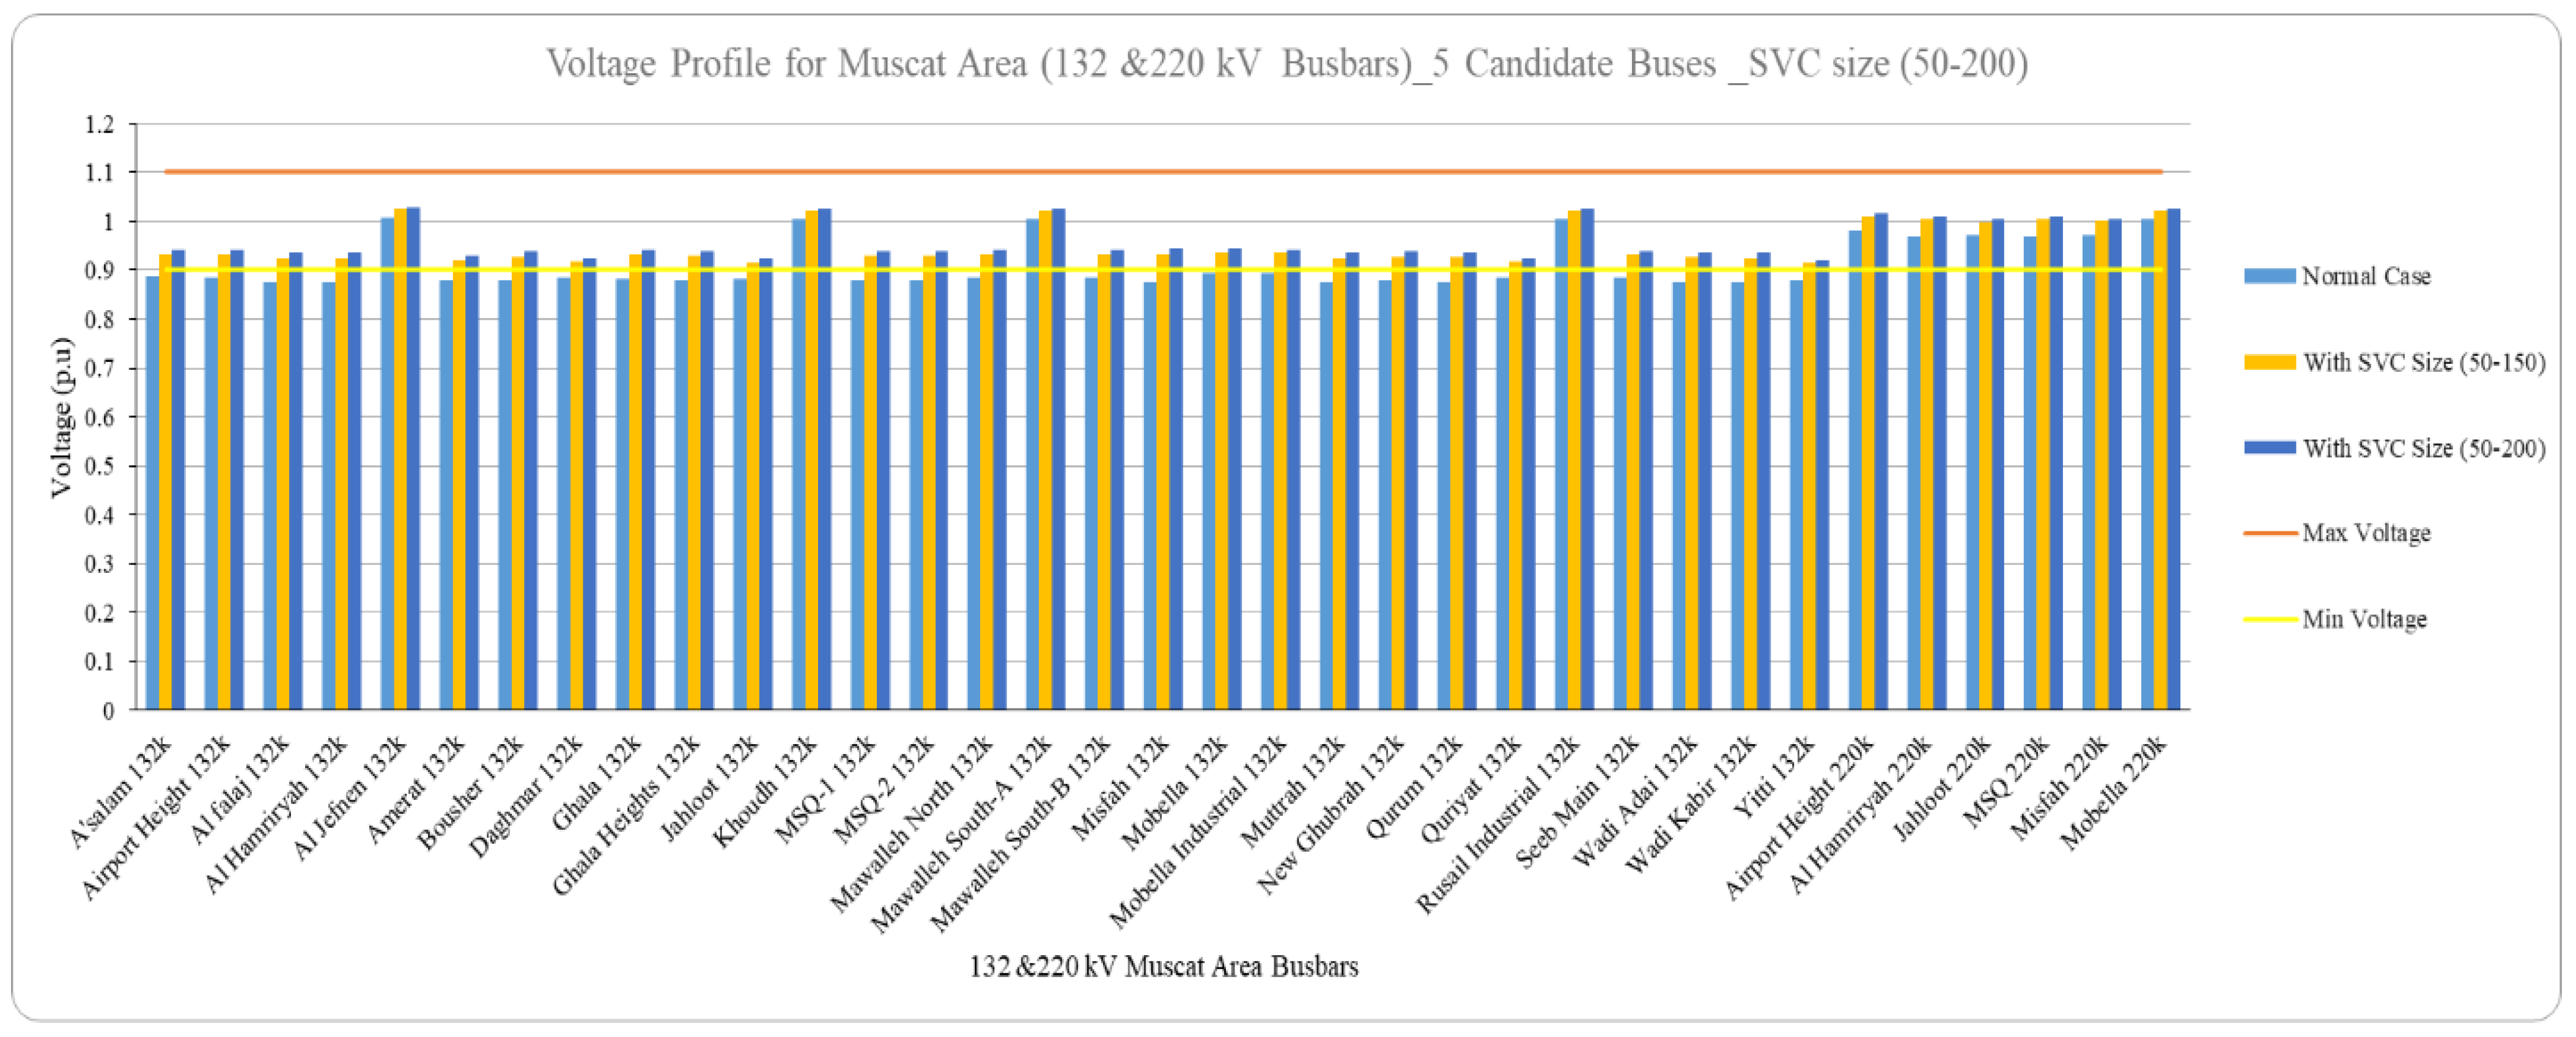
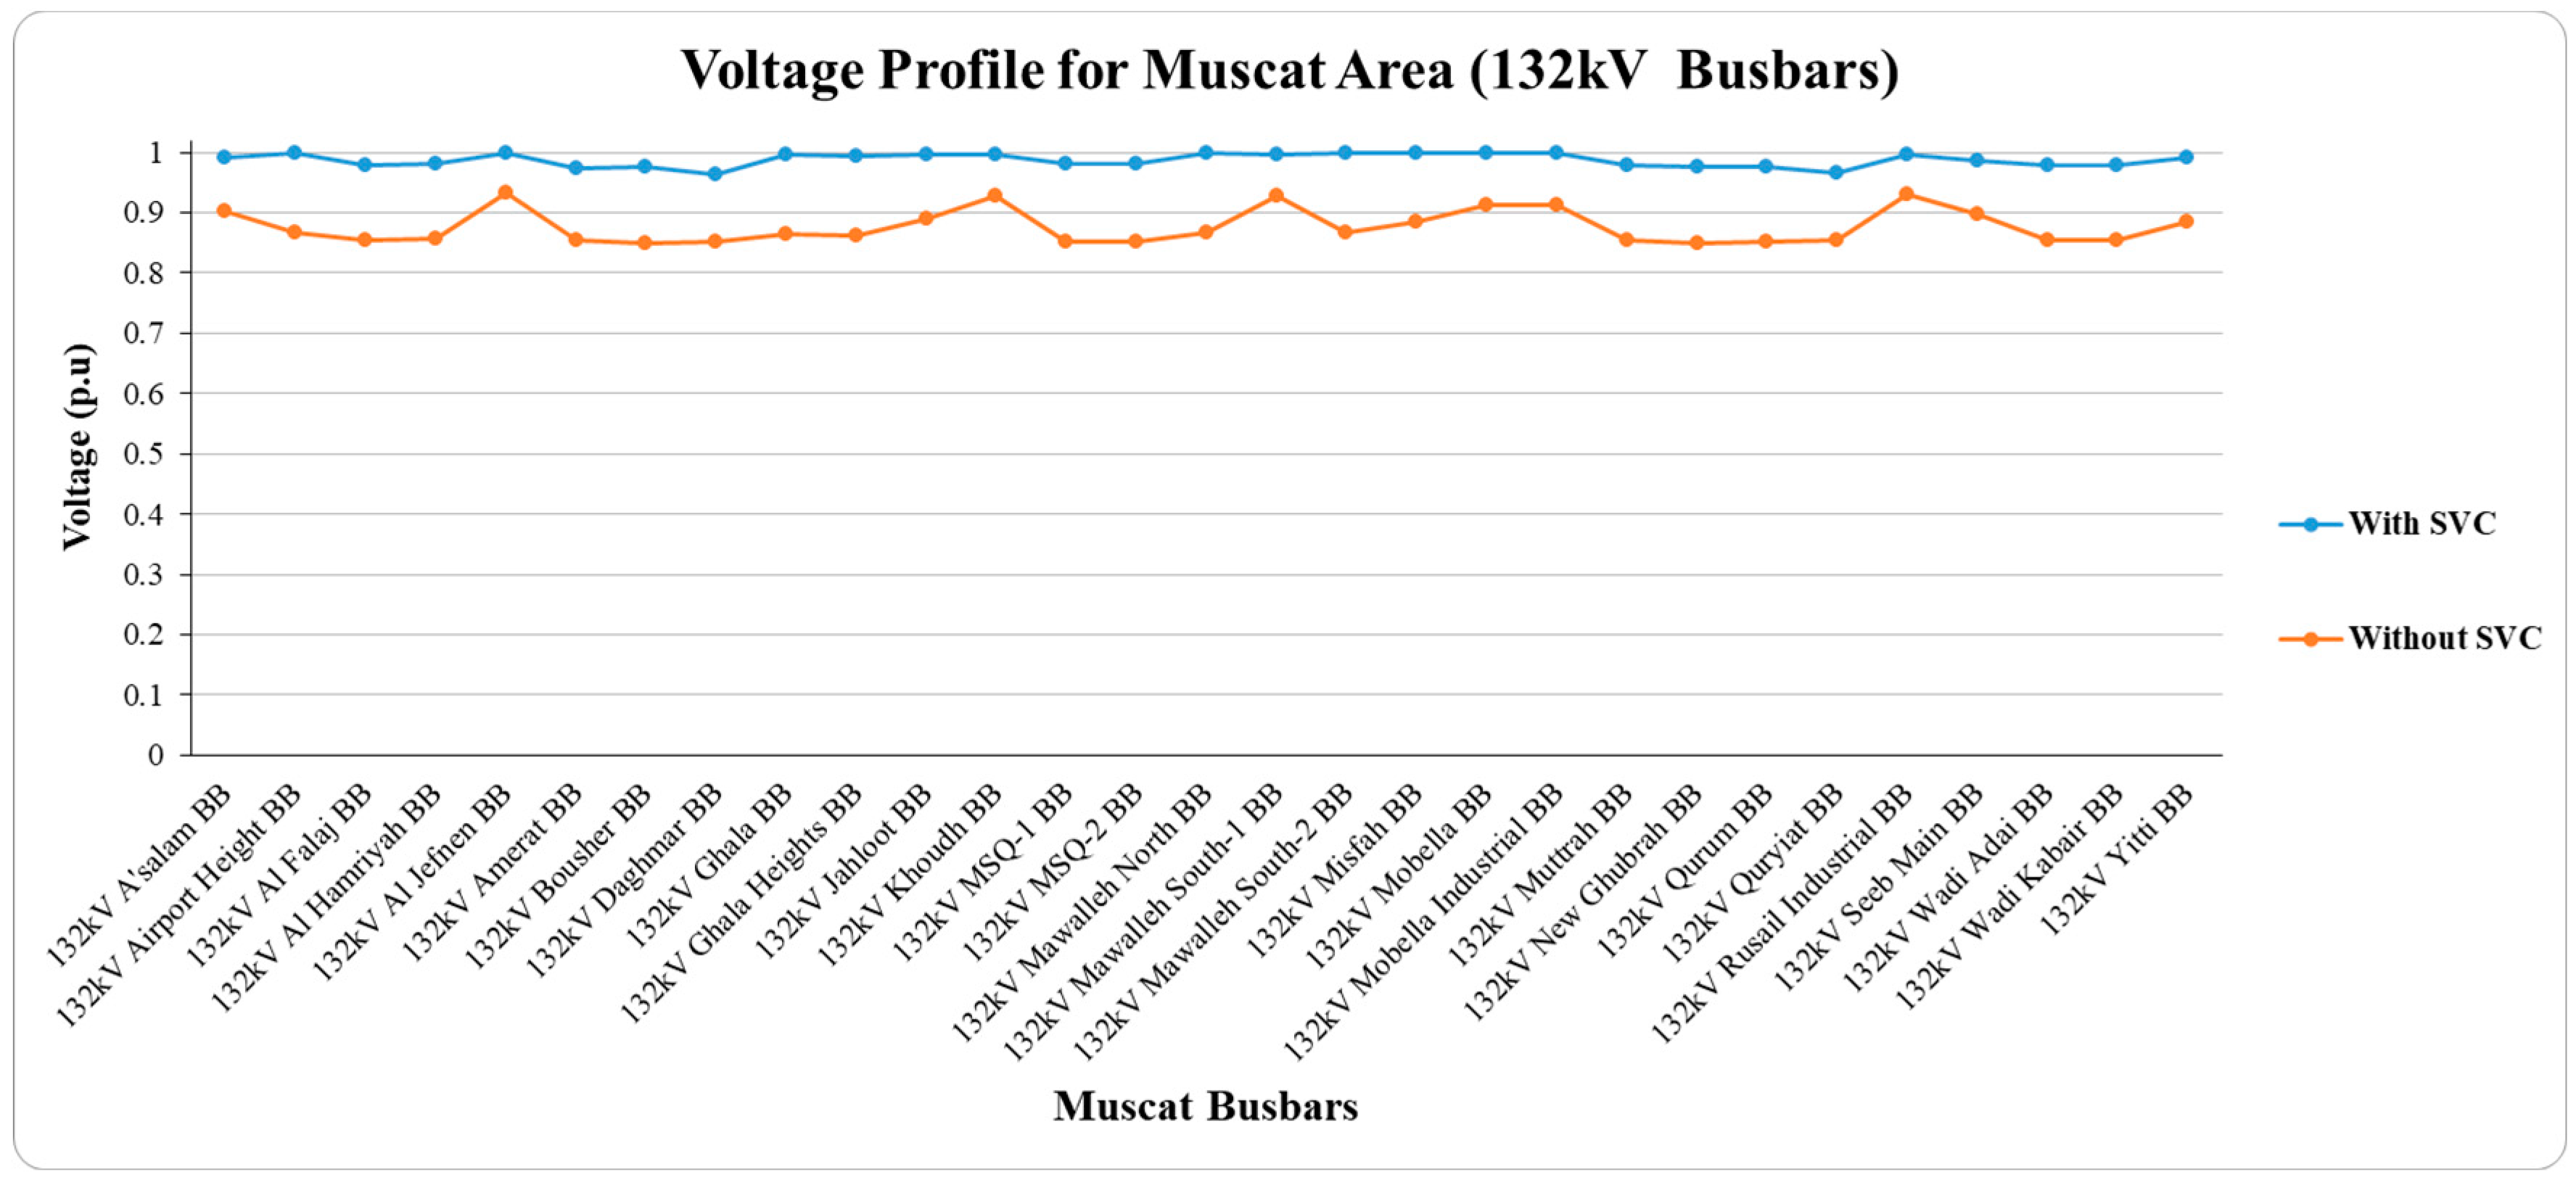
14]. Furthermore, installing SVC in the Muscat area, which represents the largest load area in MIS, will help to maintain the voltage profile for both under and overvoltage problems.
Flexible AC transmission systems (FACTS) are critical for reducing system losses and voltage variations while maximizing transmission line loading. The appropriate size and location determine how much these controllers can enhance transmission network performance. Moreover, FACTS devices are expensive, so optimal sizing is necessary. As a result, the required number and capacity of compensating devices used can reduce the overall cost of the system. However, determining optimal locations and sizes for these devices in massive electrical systems can be challenging because it is a highly nonconvex and nonlinear problem [1,2,3,4,5,6].
In previous research, many different methods and systems were used to define the optimal location and sizes of different FACTS devices [3,6,7]. Some research used analytical approaches to find the optimal locations and settings for FACTS devices such as: using the real power flow performance index in [8] to find the optimal location and setting of TCSC and UPFC in IEEE-30, a 246-bus practical Indian system and optimal location and setting for TCSC and SSSC in Ref. [9] in IEEE-30 to improve system security, or the single contingency sensitivity (SCS) index optimal location of TCSC in IEEE-14 and IEEE-118 systems as in reference [10]. However, analytical approaches offer computational efficiency but may lack accuracy without accounting for the power flow model nonlinearity and the fact that they cannot handle multi-objective optimization, such as FACTS controller placement and settings, simultaneously [3,6]. Other research used arithmetic programming approaches such as Ref. [13] which used mixed integer linear programming (MILP) to define the optimal location, number, and parameter settings of TCSC in the IEEE-9 system. Similarly, Ref. [15] used the same programming approach to find the optimal location of TCSC in the IEEE-24 system to enhance system loading. Classical optimization techniques have limitations, including the need for complete knowledge of the objective function’s relationship with variables, a propensity for getting stuck in local solutions, and challenges in computing gradients [3,6,11,12]. On the other hand, most new research used meta-heuristic or artificial intelligence (AI) methods to find the optimal location and size since they are extremely efficient at dealing with multi-model data and discrete, multi-objective, and highly constrained systems [3,6,7,11,12,16,17,18,19]. References [2,4,20,21,22] are examples that utilized various AI-based optimization techniques to enhance power system performance through the placement and sizing of FACTS devices. Ref. [2] employed teaching-learning-based optimization (TLBO) to determine the optimal siting and sizing of SVCs within the IEEE-30 system, with the objective of minimizing real and reactive power loss and voltage deviation. Ref. [4] employed the grey wolf optimizer to minimize voltage deviation through optimizing the control variables and FACTS device size, encompassing both SVCs and STATCOMs in the IEEE-30 systems. In Ref. [20], a self-adaptive firefly algorithm was utilized to minimize transmission loss and to identify the location, size, and number of FACTS devices, primarily focused on SVCs in the IEEE-14, IEEE-30, and IEEE-57 systems. Ref. [21] adopted particle swarm optimization (PSO) to reduce power losses and optimize FACTS device location and size, with a particular emphasis on STATCOMs within the IEEE-14 networks. Finally, Ref. [22] utilized teaching-learning-based optimization (TLBO) to minimize power losses and offered flexibility in determining the location, size, and type of FACTS devices, serving both SVCs and STATCOMs in the IEEE-14 and IEEE-30 bus systems. These AI-driven approaches provided tailored solutions for improving power system performance, addressing various aspects of system operation, and accommodating a range of system configurations.
Moreover, Ref. [23] searched for optimal SVC controller parameters; optimum SVC locations were selected based on the effect of load percentage and the line outage on system voltages. In order to reduce network power losses and the cost of installing the FACTS controllers, Ref. [24] proposed a probabilistic multi-objective optimization approach to determine the ideal sizes and locations of static var compensators (SVCs) and thyristor-controlled series capacitors (TCSCs) in a power transmission network with a high level of wind-generated penetration. In Ref. [25], a method for selecting the best site for static var compensator (SVC) devices in power systems was presented. This method used a multi-criteria decision-making process called the analytic hierarchy process. A thorough analysis of the available suggestions for improving power system performance through implementing FACTS devices was provided in Ref. [26].
The comparison of various heuristic optimization techniques revealed that particle swarm optimization (PSO) was a commonly favored method due to its simplicity, low computational time, robustness, and rapid convergence. Research indicated that particle swarm optimization (PSO) was the preferred optimization method, accounting for 45% of applications through optimizing the placement and settings of FACTS devices. Genetic algorithm (GA) followed closely with a 30% usage rate, while the remaining methods collectively represented the remaining 25% [7,27]. GA was another popular technique, sharing similarities with PSO although differing in its information exchange mechanisms [7,27]. PSO relies on a one-way information exchange system with the global best point distributing information to others, while GA’s chromosomes communicate with each other allowing the entire population to move towards an optimal solution collectively. PSO generally exhibits faster convergence speed compared to GA due to GA’s selection, crossover, and mutation processes. However, PSO can be sensitive to random particle initialization, necessitating multiple trials for reliable results. PSO was also more responsive to parameter changes. Nevertheless, it may suffer from premature convergence and local minima issues in complex optimization problems. GA, on the other hand, tends to be more consistent across multiple trials although it can face challenges with divergence and local optima. These characteristics highlight the trade-offs between PSO and GA in heuristic optimization. Therefore, PSO was used in this research as an optimization method [27,28,29].
However, this previous research worked on small and ideal networks such as IEEE-9, IEEE-14, IEEE-30, IEEE-57, etc. These systems do not implement the real constraints and complexity of the real system. Therefore, this work presents the optimization based on the real system data and a large network (more than 200 buses).
The main contribution of this study can be summarized as follows:
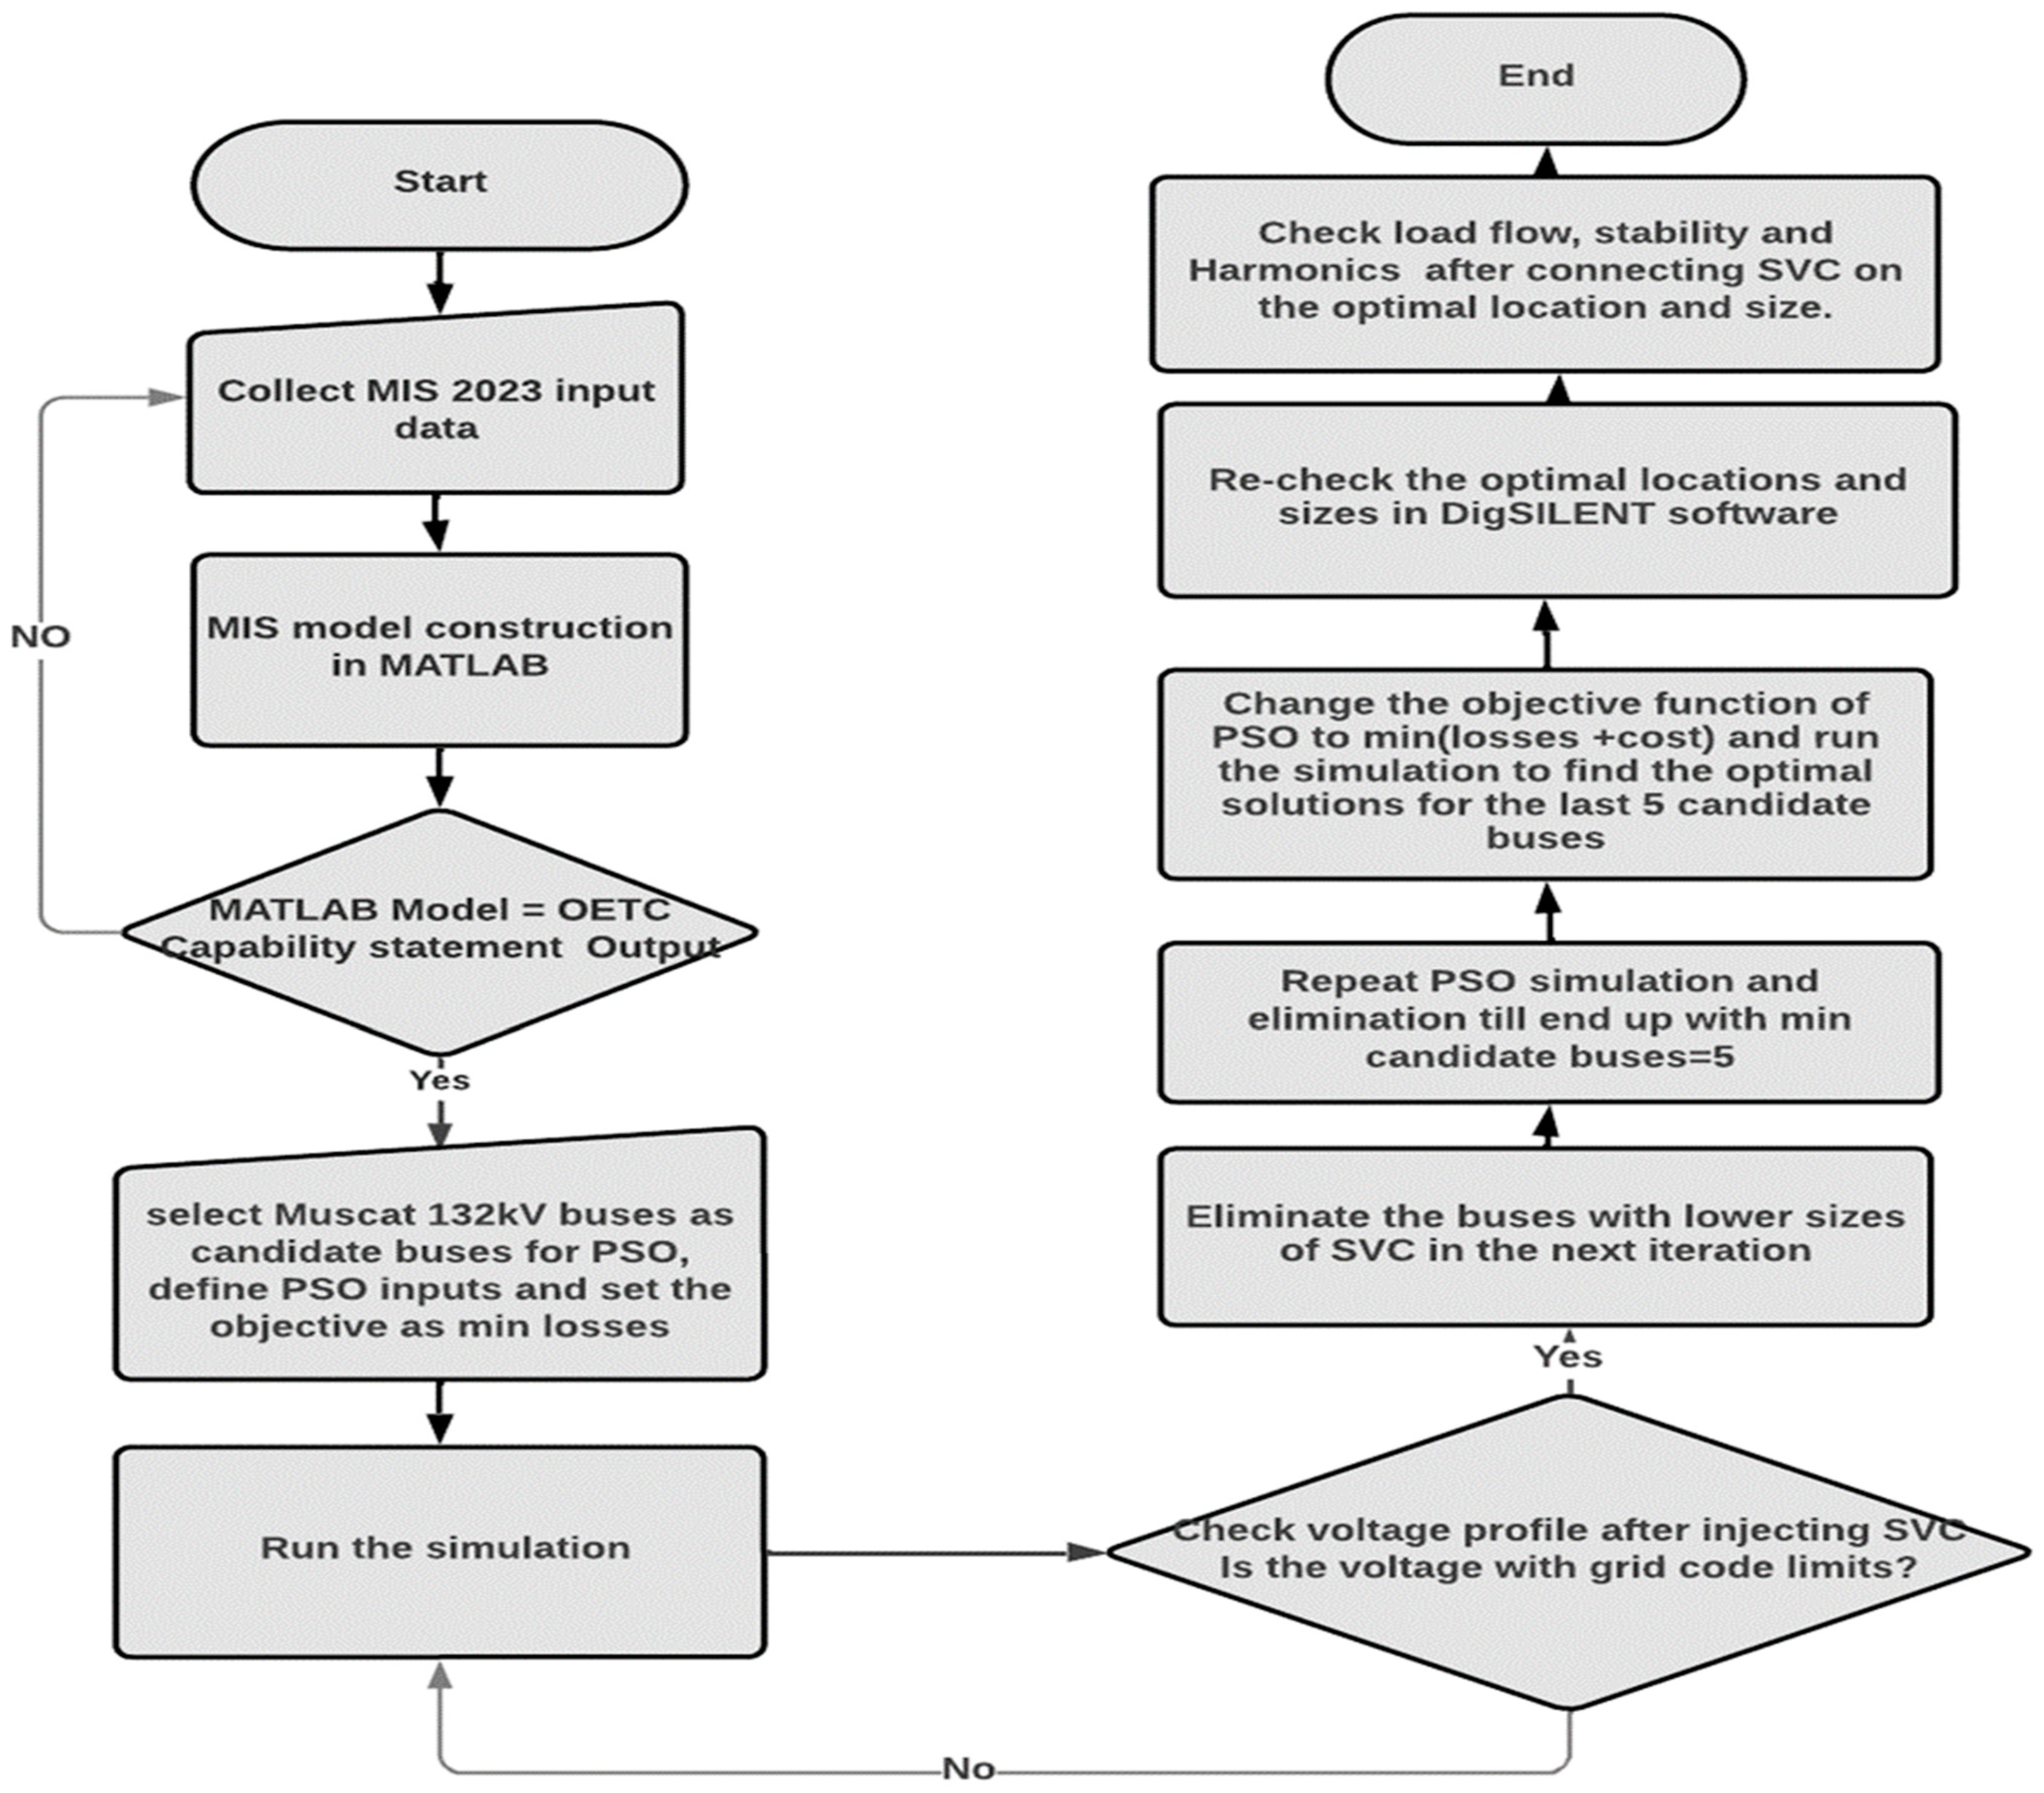
  • The MIS system was built in MATLAB and DigSILENT environments.
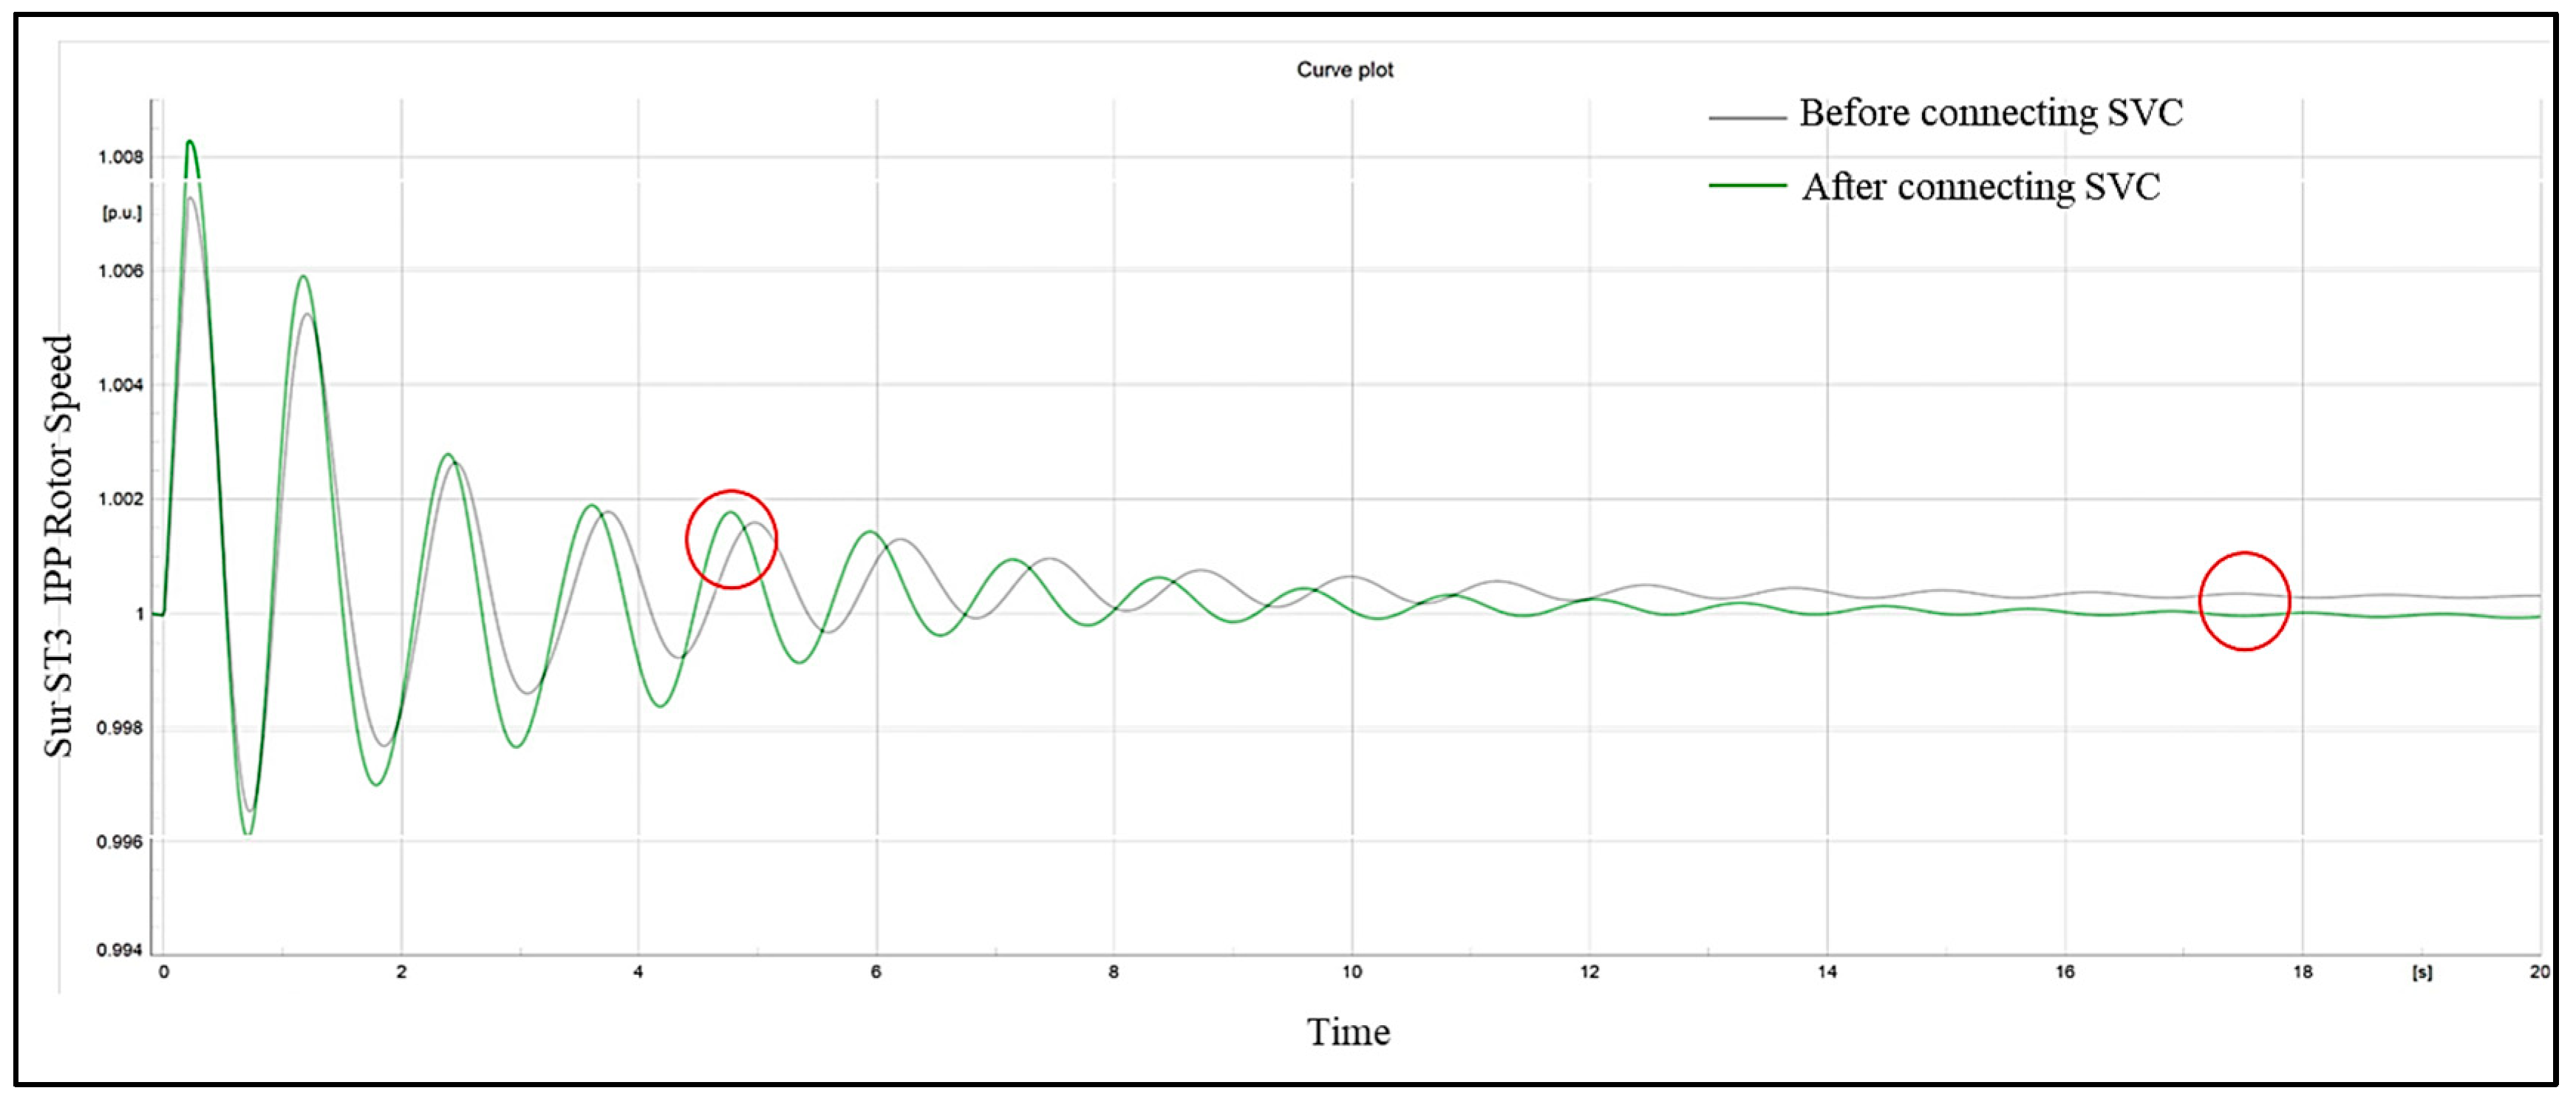
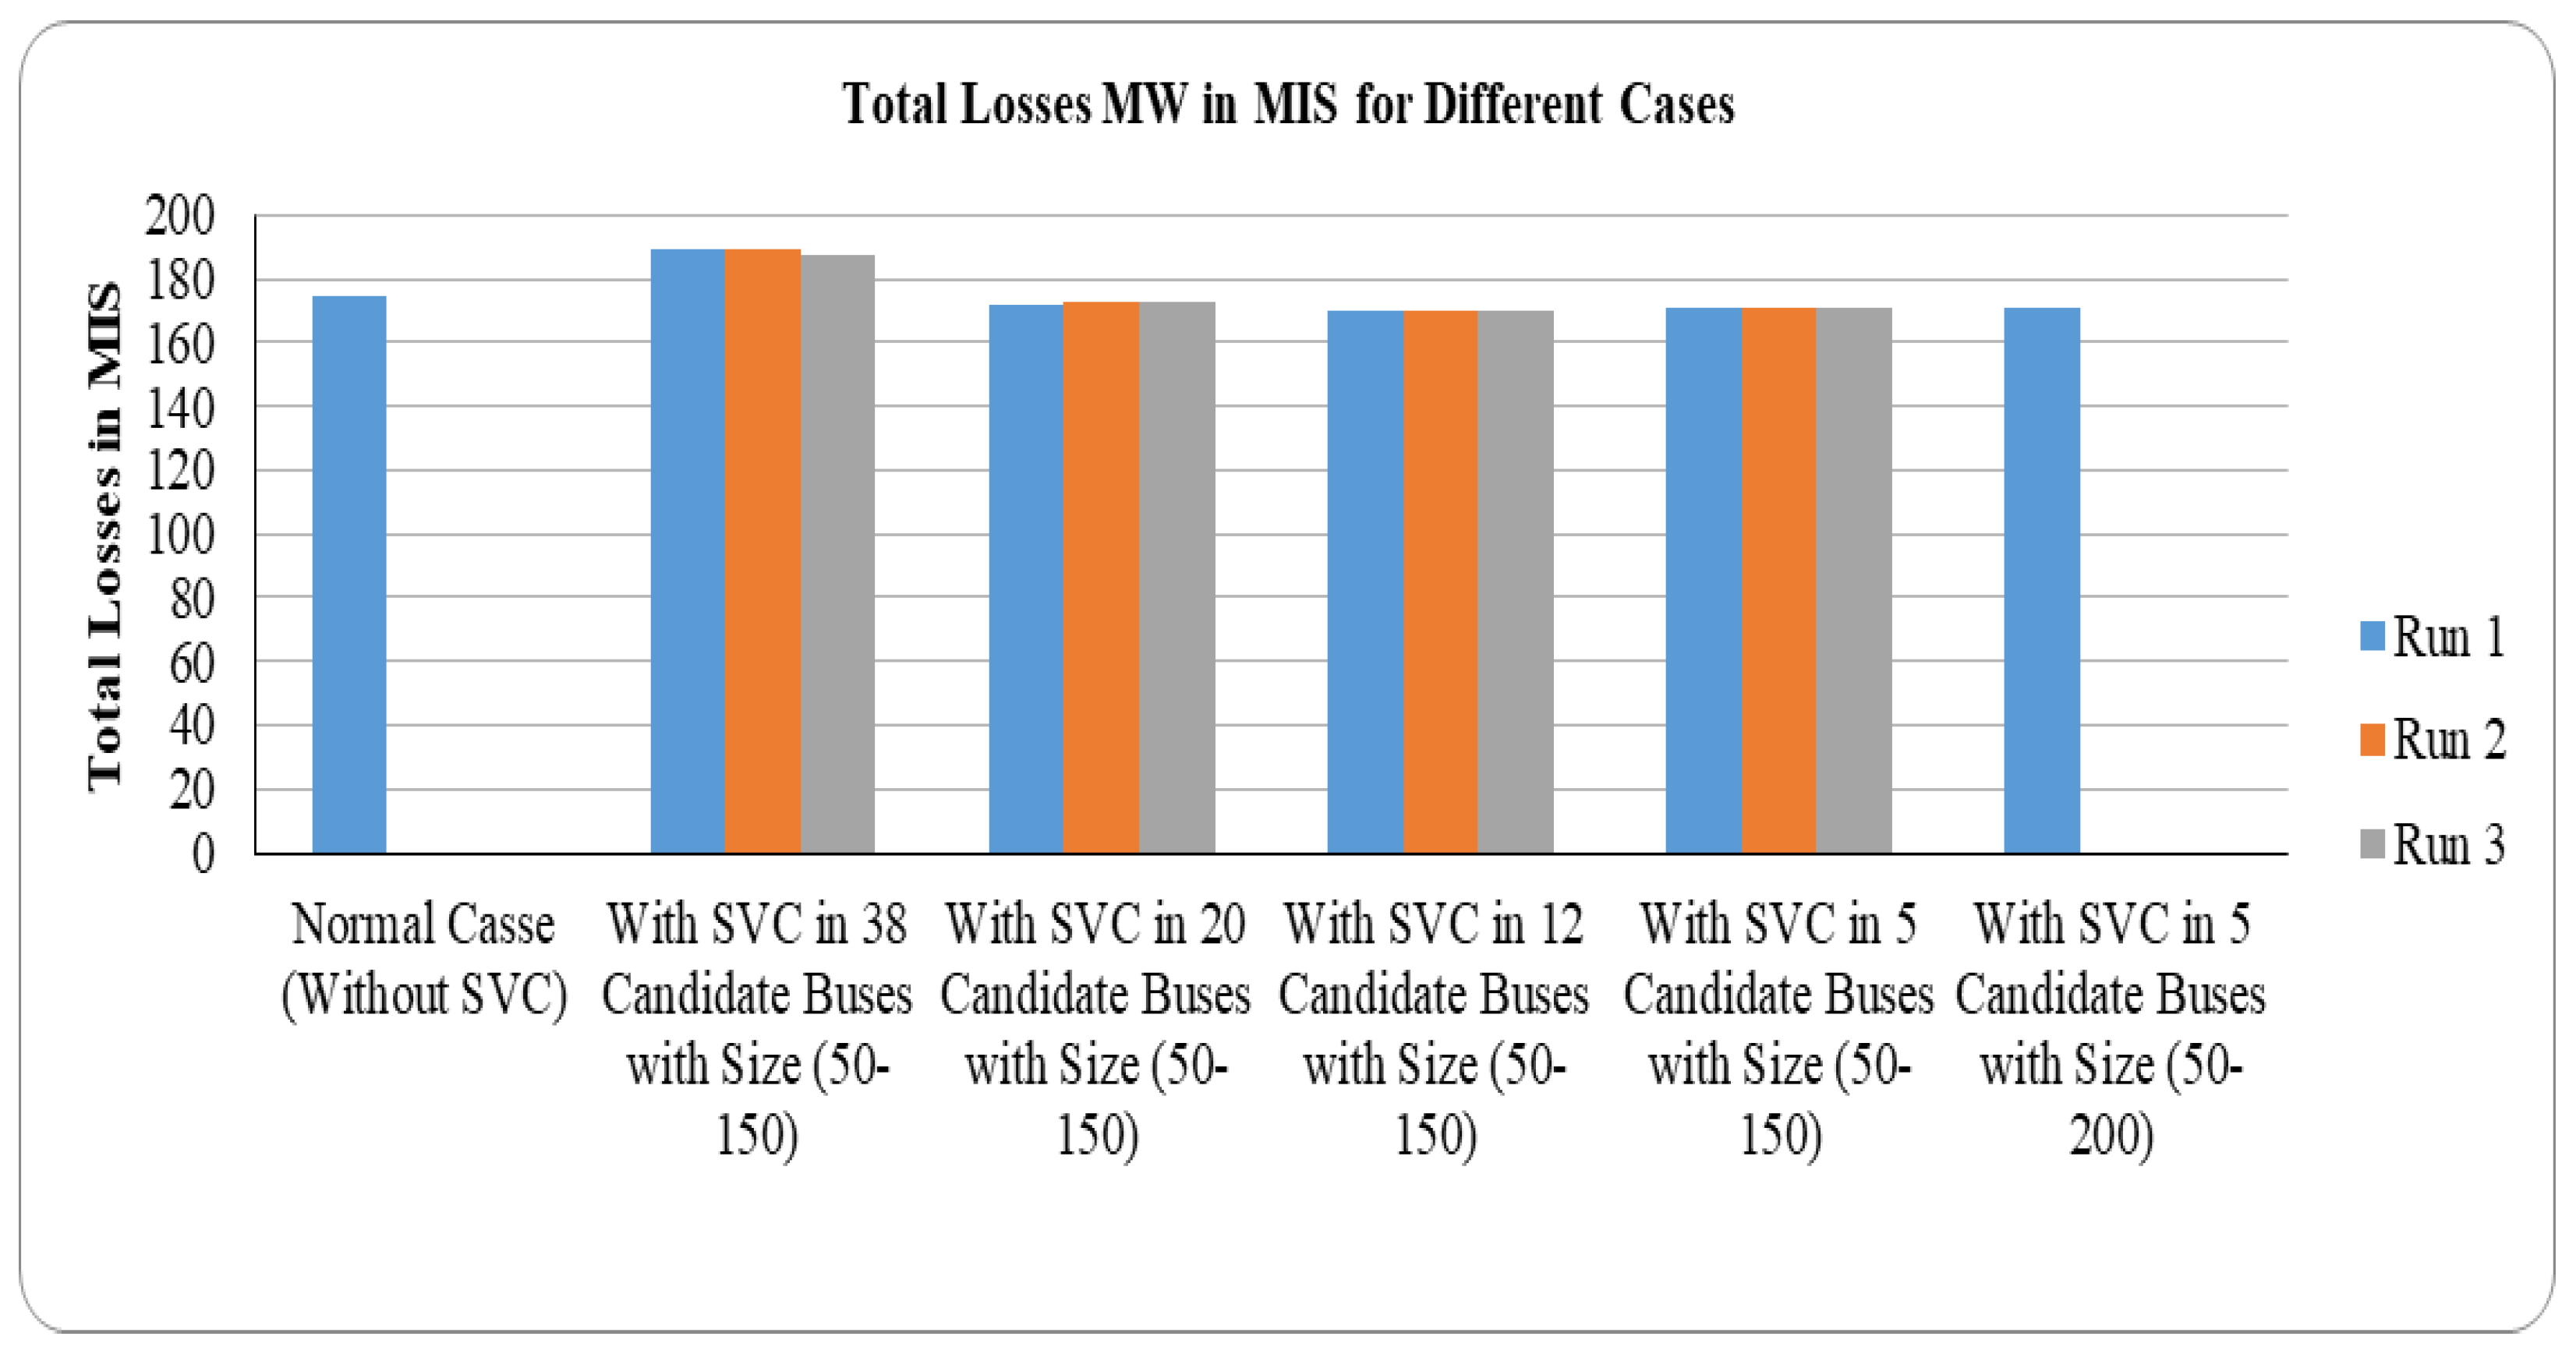
  • Different steady-state and dynamic scenarios were implemented to see the effect of SVC integration on the MIS in Oman and validated with the Oman grid code.
  • There was no detailed work related to SVC on the MIS in Oman with multi-objective PSO values presented before.
  • This work was investigated with the real future years projected data from MIS in Oman to implement SVC in real networks for the future.

2. Methodology

2.1. Main Interconnected System in Oman

Modeling the MIS system in MATLAB R2019b software was the first step in this work. Summer MIS 2023 transmission system data were used in this study. A MATLAB MIS model was implemented as per the capability statement (2022–2026) published by OETC [21]. In 2023, the generation will be supplied by six gas-based power stations: Barka II IPP, Barka III IPP, Sur IPP, Sohar II IPP, Sohar III IPP, and Ibri IPP, and one solar plant at Ibri Solar PV IPP. The overall system generation is 8017 MW with the generation supplied to the load at 7317.3 MW and with 645.7 MW spare [21]. The total forecasted peak load of MIS in 2023 was 7187 MW and 2868 Mvar. Therefore, the total losses for the system were 184 MW and 3791 Mvar. As per the capability statement, Muscat area has the most significant load in the system and the closest generation (Rusail IPP and Manah IPP) will not be a part of the generation in 2023; the other generation stations are far away from the loads which will increase the losses and decrease the voltage profile.

2.2. MIS Development in MATLAB

In MATLAB, two matrices were constructed. The first matrix represented the busbars data, which included the bus code, generators, loads, voltage, and injected reactive power based on the data in the capability statement. The second matrix represented the branch data which included line data and transformer data. All data used in the two matrices were collected from OETC-5 Year Capability Statement 2022–2026 [21]. The load flow solution was calculated via the Newton-Raphson function. The results from after constructing the MIS data and the difference between the capability statement values are shown in Table 1. The built model was based on OETC MIS 2023 data.
From the output results of the simulated system, the voltage profile for the 132 kV busbars were not within the grid code limit (0.94–1.06 p.u). Furthermore, as expected, the voltage drops were mainly in the Muscat area, more than in the other areas. For the 220 kV buses, all busbars were within the grid code. On the other hand, the 400 kV busbars were facing an overvoltage issue, which was solved by connecting suitably sized reactors. It is worth noting that the system was modelled based on the summer load, during which the reactors were disconnected. Figure 1 shows the different voltage levels of the Muscat area for 132 kV and 220 kV.
Based on simulated results from the MATLAB model, it was evident that the Muscat area required an injection of reactive power to compensate and regulate the voltage profile. Therefore, SVC can overcome the issue. On the other hand, the SVC’s size and location should be carefully selected.
Figure 2 summarizes the methodology used for this work. The work started with collecting the MIS data and modeling the system using MATLAB software. Then, PSO optimization was defined to minimize the losses. There were approximately 200 buses within the entire MIS. However, our study specifically concentrated on the buses operating in the Muscat area. Additionally, we excluded the 33 kV, 220 kV, and 400 kV buses from our analysis. The reason for excluding the 33 kV buses was that they were equipped with their own capacitor banks to regulate voltage levels. Consequently, our analysis was narrowed down to a total of 38 buses. However, this does not mean that the complexity of the function was reduced since our objective function calculated the whole system losses (200 bus). The sizes of SVC determined via PSO were analyzed based on their effect on the system to reduce the number of buses. Therefore, the bus was eliminated if the injected reactive power (SVC value) of the bus did not have a large contribution to the voltage and system losses. The process was eliminated to leave five candidate buses that had a large effect on the system voltage and losses. The last five candidate buses remaining from the elimination with the associated reactive power injection were considered as the optimal location and size determined via PSO. The voltage profile during this process should remain within the grid code.
In addition, another trial for PSO was performed to investigate and minimize the cost of SVC. Therefore, a multi-objective function (minimum losses and cost) was tested for the last five candidate buses. Finally, the results of the PSO optimal location were tested in DigSILENT 2022 SP1 software to analyze the dynamic behavior of SVC on the system.

3. Results and Discussions in MATLAB Software

3.1. PSO with One Objective Function (Minimum Losses)

PSO found the optimal size of SVC in 38 buses with the objective function to minimize the losses in the system [30].
Objective   function = Min   P l o s s
The total active power losses of any electrical system was calculated using the following equation [30]:
P l o s s = l = 1 m R l I l 2 = i = 1 b j = 1 , i j b [ V i 2 + V j 2 2 V i V j cos ( δ i δ j ) ] Y i j cos φ i j
where m was the number of lines, II was the current through the lines, RI was the resistance of the lines, Vi and δ i were the voltage magnitude and angle at bus i, Vj and δ j were the voltage magnitude and angle at bus j, and Y i j and φ i j were the magnitude and angle of line admittance [30].
The power balanced equations are [4,5,21,31]:
P G i P D i = P i ( V , δ )
Q G i Q D i = Q i ( V , δ )
where P G i and Q G i are generated real and reactive power for bus i, P D i and Q D i are demand real and reactive power for bus i, P i and Q i the real and reactive power losses for bus i.
The size limit of SVC for PQ buses is giving as [4,5,21,31]:
50 Q S V C 150
where Q S V C is reactive power generated by the SVC.
The voltage profile for 132 kV and 220 kV buses in the Muscat area is shown in Figure 3. It was clear from the selection of the candidate buses that the voltage profile of the overall Muscat area increased, and that the optimization was repeated three times to ensure that PSO did not trap into the local minimum solution. Moreover, since the voltage profile did not improve much in the five candidate buses with SVC ranging from 50 to 150 Mvar, a second PSO tracing was conducted for the same five candidate buses using a different search space (SVC size) ranging from 50 to 200 Mvar. The sizes determined by PSO for the last trial are shown in Table 2. It was clear from Figure 3 that the voltage profile of the system improved from an average voltage of 0.912 pu to 0.952 pu for SVC up to 150 MVAr and up to an average of 0.959 pu for SVC up to 200 MVAr.
MSQ-1 and Misfah were the two best optimal locations, which had a significant impact on the overall system since they absorbed more reactive power. Mawalleh was removed because it absorbed less reactive power. Airport height and Mobella can also be used as the second-best locations.

3.2. Total Losses

The total losses for the overall system with and without SVC are shown in Figure 4 and Figure 5. Injecting more reactive power, as shown in Figure 4 and Figure 5, increased system losses, as 38 candidate buses demonstrated. However, decreasing the number of candidate buses with the injected reactive power decreased the losses in the system, as in the cases of 20, 12 and 5 candidate buses. The active and reactive power losses decreased by 1.3 to 2.46% and 2 to 2.2%, respectively, for 20, 12 and 5 candidate buses, respectively.

3.3. PSO with Multi-Objective Function (Minimum Cost and Losses)

A multi-objective function was considered in this stage where the objective function was changed to minimize both losses and costs in searching for a solution consisting of both the SVC location and size for five candidate buses only.
Objective   function = Min   ( P l o s s + C o s t   o f   S V C )
FACTS device investment expenses were divided into: costs associated with the actual devices and costs associated with the required infrastructure [32].
The installation cost of SVC was given via [22,25,26]:
I C = C S V C × S × 1000
where I C was the installation cost in USD, C S V C was the cost of the SVC device in USD/kVar.
The cost of devices was calculated using the cost function given via [30,33,34]:
C S V C = 0.0003 S 2 0.3051 S + 127.38
S = Q 2 Q 1
where S was the operating range of SVC in Mvar, Q1 and Q2 were the reactive powers flowing through the bus before and after the SVC installation, respectively.
The size limit in this problem was given via:
50 Q S V C 200
where Q S V C was injected reactive power via the SVC.
Table 3 shows the effect of involving the cost function to optimizing the size of the SVC. The table compares the two cases (with and without the cost function). The cost of the device per SVC size was higher for smaller SVC sizes. On the other hand, the total installation cost for the optimal location with minimum losses as an objective function was lower than the installation cost for the solution of an objective function with minimum losses and cost.
Figure 6 shows the voltage profile for the multi-objective function compared to the single objective function. The voltage profile increased compared to a single objective function as the injected reactive power to the system increased from an average voltage of 0.912 pu to 0.959 pu using a single objective function and up to an average of 0.973 pu for multi objective function. However, the total losses remained almost the same in both cases.

4. Results and Discussions in DigSILENT Software

The dynamic behavior and performance of SVC were also crucial while studying the effect of SVC on any system. Therefore, the results of PSO were used to test SVC on the MIS 2023 DigSILENT model. Moreover, the SVC devices connected to the five candidate buses were determined via PSO, and the size was selected to range from 50 to 200 Mvar. Normally, SVC absorbs and injects reactive power based on the voltage of the bus so DigSILENT built this ability into the model itself. The following sections investigated various cases and conditions with and without SVC.

4.1. Load Flow and Voltage Profile

The system was tested with and without SVC. Since SVC can change the injected or absorbed reactive power based on the bus requirement, the system absorbed the required reactive power to regulate the bus voltage to 1 p.u. Table 4 shows the size of the SVC in Mvar at the candidate buses determined via the PSO algorithm. The maximum SVC size was set to 200 Mvar. Table 5 shows a comparison with and without SVC for losses, generated Q, and compensation required by the MIS system and in the Muscat area. Total real and reactive losses decreased for the Muscat area and MIS after integrating SVC into the candidate buses. Moreover, the generated Q of the system decreased for MIS since SVC generated Q to compensate for the system; in the Muscat area, it was zero since there was no generation in that area. Capacitive compensation was introduced to the MIS transmission system after connecting SVC to 132 kV candidate buses.
The voltage profile for 132 kV buses before and after installing SVC is shown in Figure 7. Voltage profiles were improved for all buses in the Muscat area (38 buses) through integrating SVC in five buses from an average voltage of 0.877 pu for the system without SVC to an average voltage of 0.987 pu with SVC.

4.2. Transient Stability

A fault in the line between two major buses was made with and without SVC to check the effect of SVC on transient stability. The fault was cleared after 200 ms. The rotor speed for the largest power station, Sur Steam Turbine (ST3), was investigated (closest and largest generation units in the system) for 20 s after the fault inception as presented in Figure 8. The system responded faster with SVC than without it and the system reached a steady state faster.

4.3. Harmonics

The total harmonic distortion (THD) for the MIS in each candidate bus was checked before and after connecting the SVC. Table 6 shows the values before and after the connection of SVC. THD obviously increased after installing SVC, yet the grid code limit was maintained. For voltage level 132 kV, the THD should not exceed 2% [27]. Additionally, it was evident that THD increased concurrently with an increase in SVC size. Adding a harmonic filter with the SVC removed the harmonic effects.

4.4. System Loading

One of the most common methods for identifying voltage instability issues is the QV curve. A QV analysis looks at the relationship between bus voltage sensitivity (V), variation for different load margins (Q), and reactive power levels. The DigSILENT software determined the load margin Q of each candidate bus and can be defined as the minimum required reactive power before and after connecting SVC for voltage collapse [15,16,17]. Table 7 shows the load margin (minimum Q) for the candidate buses with and without connecting SVC. The load margin increased after connecting SVC from 18% to 96%, which means the system was more stable and can withstand more load than without SVC. Therefore, SVC improves the loading of the buses.

5. Conclusions

In this study, optimization techniques addressed the challenges related to FACTS device integration. The focus centered on identifying the optimal locations and sizes for static var compensators (SVCs) within Oman’s main interconnected system (MIS) using real MIS 2023 data. The particle swarm optimization (PSO) algorithm in MATLAB achieved substantial improvements in voltage profiles and loss reduction of approximately 2%. A multi-objective approach further minimized costs while maintaining enhanced voltage profiles and controlled losses.
Validation through DigSILENT highlighted the dynamic impact of optimal SVC placement, consistently improving voltage profiles and mitigating losses in the Muscat area. Analyzing harmonics, transient stability and loading, controlled harmonics within limits, and enhanced system stability were observed. Optimal SVC placement accelerated the attainment of steady-state conditions, and the QV curve demonstrated heightened stability as buses were loaded from 18% to 96%, showcasing the robustness of SVC.

6. Future Work

While SVCs enhance voltage profiles, untapped potential remains. Comparing STATCOM’s performance merits consideration. Future research can focus on:
  • Exploring alternative optimization techniques (e.g., GA) and comparing results.
  • Applying the methodology to STATCOM for performance insights.
  • Investigating additional stability and harmonics scenarios.
  • Studying control and harmonic filter designs for SVC.
  • Conducting comprehensive cost analyses, including loss and filter costs, and comparing voltage enhancement solutions.

Author Contributions

Conceptualization, A.A.-B.; Methodology, M.A.-S. and A.O.; Software, M.A.-S., A.O. and A.E.; Validation, M.A.-S.; Formal analysis, M.A.-S., A.A.-B. and A.O.; Investigation, A.E.; Data curation, M.A.-S.; Writing—original draft, M.A.-S.; Writing—review & editing, A.A.-B.; Supervision, A.A.-B. All authors have read and agreed to the published version of the manuscript.

Funding

This research received no external funding.

Data Availability Statement

Not applicable.

Conflicts of Interest

The authors declare no conflict of interest.

Abbreviations

FACTSFlexible Alternating Current Transmission Systems
GAGenetic Algorithms
HFHarmonic filter
MISMain Interconnected System
MITSMain Interconnected Transmission System
OETCOman Electricity Transmission Company
PReal Power
PSOParticle Swarm Optimization
QReactive Power
RResistance
SApparent Power
STATCOMStatic Synchronous Compensators
SVCStatic VAR Compensation
THDTotal Harmonic Distortion
TLTransmission Line
VVoltage
XReactance
ZImpedance

References

  1. Nadeem, M.; Imran, K.; Khattak, A.; Ulasyar, A.; Pal, A.; Zeb, M.Z.; Padhee, M. Optimal placement, sizing and coordination of FACTS devices in transmission network using whale optimization algorithm. Energies 2020, 13, 753. [Google Scholar] [CrossRef]
  2. Verma, R.; Rathore, A. Optimal Placement of Facts Device Considering Voltage Stability and Losses using Teaching Learning based Optimization. J. Inst. Eng. India Ser. B 2021, 102, 771–776. [Google Scholar] [CrossRef]
  3. Krishnam, R.; Singh, A.P. Various Approaches of Use and Optimization of FACTS: A Review. In Proceedings of the 2022 2nd International Conference on Power Electronics and IoT Applications in Renewable Energy and its Control, PARC 2022, Mathura, India, 21–22 January 2022; Institute of Electrical and Electronics Engineers Inc.: Piscataway, NJ, USA, 2022. [Google Scholar] [CrossRef]
  4. Ladumor, D.P.; Trivedi, I.N.; Bhesdadiya, R.H.; Jangir, P. Optimal Power Flow with shunt Flexible AC Transmission system (FACTS) device using Grey Wolf Optimizer. In Proceedings of the 3rd IEEE International Conference on Advances in Electrical and Electronics, Information, Communication and Bio-Informatics, AEEICB 2017, Chennai, India, 27–28 February 2017; Institute of Electrical and Electronics Engineers Inc.: Piscataway, NJ, USA, 2017; pp. 387–391. [Google Scholar] [CrossRef]
  5. Kumar, G.N.; Kalavathi, M.S.; Krishna, R.H. Optimal Placement of SVC and STATCOM for Voltage Stability Enhancement under Contingency using Cat Swarm Optimization. Int. J. Adv. Eng. Technol. 2012, 436, 436–447. [Google Scholar]
  6. Ahmad, A.A.L.; Sirjani, R. Optimal placement and sizing of multi-type FACTS devices in power systems using metaheuristic optimisation techniques: An updated review. Ain. Shams. Eng. J. 2022, 11, 611–628. [Google Scholar] [CrossRef]
  7. Patil, B.; Karajgi, S.B. A Review on Optimal Placement of FACTS Devices in Deregulated Environment—A Detailed Perspective. In Proceedings of the International Conference on Electrical, Electronics, Communication, Computer and Optimization Techniques (ICEECCOT), Mysuru, India, 15–16 December 2017; IEEE: Piscataway, NJ, USA, 2017. [Google Scholar]
  8. Singh, S.N.; Srivastava. Enhancement of Power System Security Through Optimal Placement of TCSC and UPFC; IEEE: Piscataway, NJ, USA, 2007. [Google Scholar]
  9. PVaidya, S.; Rajderkar, V.P. Optimal location of series FACTS devices for enhancing power system security. In Proceedings of the International Conference on Emerging Trends in Engineering and Technology, ICETET, Port Louis, Mauritius, 18–20 November 2011; pp. 185–190. [Google Scholar] [CrossRef]
  10. Lu, Y.; Abur, A. Static security enhancement via optimal utilization of thyristor-controlled series capacitors. IEEE Trans. Power Syst. 2002, 17, 324–329. [Google Scholar] [CrossRef]
  11. Bhargava, C. AI Techniques for Reliability Prediction for Electronic Components; IGI Global: Hershey, PA, USA, 2019. [Google Scholar]
  12. Islam, J.; Vasant, P.M.; Negash, B.M.; Laruccia, M.B.; Myint, M.; Watada, J. A holistic review on artificial intelligence techniques for well placement optimization problem. Adv. Eng. Softw. 2020, 141, 102767. [Google Scholar] [CrossRef]
  13. Etemad, R.; Navabi, R.; Shayanfar, H.A. Optimal location and setting of TCSC under single line contingency using mixed integer nonlinear programming. In Proceedings of the 2010 9th Conference on Environment and Electrical Engineering, EEEIC 2010, Prague, Czech Republic, 16–19 May 2010; pp. 250–253. [Google Scholar] [CrossRef]
  14. Dawn, S.; Tiwari, P.K.; Goswami, A.K. An approach for long term economic operations of competitive power market by optimal combined scheduling of wind turbines and FACTS controllers. Energy 2019, 181, 709–723. [Google Scholar] [CrossRef]
  15. Sharma, A.; Chanana, S.; Parida, S. Combined optimal location of FACTS controllers and loadability enhancement in competitive electricity markets using MILP. In Proceedings of the 2005 IEEE Power Engineering Society General Meeting, San Francisco, CA, USA, 12–16 June 2005; pp. 670–677. [Google Scholar] [CrossRef]
  16. Beheshti, Z.; Shamsuddin, S.M.H. A Review of Population based Meta Heuristic Algorithm. ICSRS 2013, 5, 1–35. [Google Scholar]
  17. Priyadarshi, N.; Bhoi, A.K.; Padmanaban, S.; Balamurugan, S.; Nielsen, J.B.H. Intelligent Renewable Energy Systems; Scrivener Publishing: Beverly, MA, USA, 2016; Volume 1. [Google Scholar]
  18. Radosavljević, J. Metaheuristic Optimization in Power Engineering; IET: Stevenage, UK, 2018; ISBN 978-1-78561-546-7. [Google Scholar]
  19. Dhiman, G.; Kaur, A. Optimizing the design of airfoil and optical buffer problems using spotted hyena optimizer. Designs 2018, 2, 28. [Google Scholar] [CrossRef]
  20. Selvarasu, R.; Kalavathi, M.S.; Rajan, C.C.A. SVC placement for voltage constrained loss minimization using self-adaptive Firefly algorithm. Arch. Electr. Eng. 2013, 62, 649–661. [Google Scholar] [CrossRef]
  21. Okelola, M.O.; Ayanlade, S.O.; Ogunwole, E.I. Particle Swarm Optimization for Optimal Allocation of STATCOM on Transmission Network. In Journal of Physics: Conference Series; IOP Publishing Ltd.: Bristol, UK, 2021. [Google Scholar] [CrossRef]
  22. Youssef, H.; Kamel, S.; Aly, M.M. Optimal allocation and size of appropriate compensation devices for voltage stability enhancement of power systems. In Proceedings of the 2018 International Conference on Innovative Trends in Computer Engineering, ITCE 2018, Aswan, Egypt, 19–21 February 2018; Institute of Electrical and Electronics Engineers Inc.: Piscataway, NJ, USA, 2018; pp. 305–310. [Google Scholar] [CrossRef]
  23. Abd-Elazim, S.M.; Ali, E.S. Bacteria Foraging Optimization Algorithm based SVC damping controller design for power system stability enhancement. Int. J. Electr. Power Energy Syst. 2012, 43, 933–940. [Google Scholar] [CrossRef]
  24. EL-Azab, M.; Omran, W.A.; Mekhamer, S.F.; Talaat, H.E.A. A probabilistic multi-objective approach for FACTS devices allocation with different levels of wind penetration under uncertainties and load correlation. Int. J. Electr. Comput. Eng. IJECE 2020, 10, 3898. [Google Scholar] [CrossRef]
  25. Aydin, F.; Gumus, B. Determining Optimal SVC Location for Voltage Stability Using Multi-Criteria Decision Making Based Solution: Analytic Hierarchy Process (AHP) Approach. IEEE Access 2021, 9, 143166–143180. [Google Scholar] [CrossRef]
  26. Mirsaeidi, S.; Devkota, S.; Wang, X.; Tzelepis, D.; Abbas, G.; Alshahir, A.; He, J. A Review on Optimization Objectives for Power System Operation Improvement Using FACTS Devices. Energies 2023, 16, 161. [Google Scholar] [CrossRef]
  27. Gaur, D.; Mathew, L. Optimal placement of FACTS devices using optimization techniques: A review. In IOP Conference Series: Materials Science and Engineering; Institute of Physics Publishing: Bristol, UK, 2018. [Google Scholar] [CrossRef]
  28. Sirjani, R.; Mohamed, A.; Shareef, H. Optimal Placement and Sizing of Shunt FACTS Devices in Power Systems Using Heuristic Optimization Techniques: A Comprehensive Survey. Prz. Elektrotechniczny 2012, 88, 335–341. [Google Scholar]
  29. Shaheen, H.I.; Rashed, G.I.; Cheng, S.J. Application and comparison of computational intelligence techniques for optimal location and parameter setting of UPFC. Eng. Appl. Artif. Intell. 2010, 23, 203–216. [Google Scholar] [CrossRef]
  30. Sirjani, R.; Mohamed, A.; Shareef, H. Optimal placement and sizing of Static Var Compensators in power systems using Improved Harmony Search Algorithm. Prz. Elektrotechniczny 2011, 87, 214–218. [Google Scholar]
  31. Saddique, M.S.; Bhatti, A.R.; Haroon, S.S.; Sattar, M.K.; Amin, S.; Sajjad, I.A.; ul Haq, S.S.; Awan, A.B.; Rasheed, N. Solution to optimal reactive power dispatch in transmission system using meta-heuristic techniques―Status and technological review. Electr. Power Syst. Res. 2020, 178, 106031. [Google Scholar] [CrossRef]
  32. Habur, K.; O’Leary, D. FACTS–For Cost Effective and Reliable Transmission of Electrical Energy. Available online: https://www.rds.oeb.ca/CMWebDrawer/Record/176620/File/document (accessed on 11 April 2023).
  33. Vanishree, J.R.V. Optimization of size and cost of Static VAR Compensator using Dragonfly algorithm for voltage profile improvement in power transmission systems. Int. J. Renew. Energy Res. 2018, 8, 56–66. [Google Scholar]
  34. Rul, N.; Abdullah, N.R.H.; Musirin, P.D.I.; Othman, M. Static VAR Compensator for Minimising Transmission Loss and Installation Cost Calculation. Aust. J. Basic Appl. Sci. 2010, 4, 646–657. [Google Scholar]
Figure 1. Voltage profile for 132 kV and 220 kV in the Muscat area using a MATLAB Model.
Energies 16 06802 g001
Figure 2. Methodology of the research.
Energies 16 06802 g002
Figure 3. Voltage profile for 132 kV and 220 kV stations with optimal SVC sizes for five candidate buses for trace of size [50–200].
Energies 16 06802 g003
Figure 4. Total MW losses in MIS for different cases with and without SVC.
Energies 16 06802 g004
Figure 5. Total MVar losses in MIS for different cases with and without SVC.
Energies 16 06802 g005
Figure 6. Voltage profile for 132 kV and 220 kV stations with optimal SVC sizes for five candidate buses with different objective.
Energies 16 06802 g006
Figure 7. Voltage profile for 132 kV stations with and without SVC using DigSILENT software.
Energies 16 06802 g007
Figure 8. Rotor angle for Sur ST3 after fault cleared.
Energies 16 06802 g008
Table 1. Output of MIS 2023 model.
Load Flow Output MATLAB Output Model
Total Generation MW7354.208
Total Generation Mvar2898.442
Total Load MW7179.7
Total Load Mvar2358.7
Total Losses MW174.508
Total Losses Mvar3849.742
Table 2. The optimal size of SVC of three iterations for five candidate buses with size trace [50–200].
Bus NameOptimal SVC Size [Mvar]
Airport Height132 kV156.971
MSQ-1 132 kV200
Mawalleh S-B132 kV51.4908
Misfah 132 kV200
Mobella 132 kV147.254
Total Losses in MW170.896
Total Losses in MVar3769.08
Table 3. Total cost comparison for different object function.
Bus Name Min   ( P l o s s ) Min   ( P l o s s   +   C S V C )
Optimal Size C S V C USD/kVAr I C USDOptimal Size C S V C USD/kVAr I C USD
Airport Height 132 kV156.986.94,949,640.520078.3615,672,000
MSQ-1 132 kV20078.415,672,00020078.3615,672,000
Mawalleh S-B 132 kV51.5112.55,791,170.320078.3615,672,000
Misfah 132 kV20078.415,672,00020078.3615,672,000
Mobella 132 kV147.388.913,099,421.3199.978.3715,672,000
Total Losses170.896 (MW)171.486 (MW)
Total cost55,184,232.13 (USD)78,360,000 (USD)
Table 4. The five candidate buses with SVC sizes determined via DigSILENT software.
Bus NameOptimal SVC Size [Mvar]
Airport Height 132 kV181.42
MSQ-1 132 kV193.39
Mawalleh South-B 132 kV40.32
Misfah 132 kV121.38
Mobella 132 kV121.28
Table 5. Comparison of critical parameters in load flow for MIS and Muscat area.
Total Losses P MWTotal Losses Q
Mvar
Generated Q MvarCapacitive Compensation, C Mvar
MIS Before SVC205.2701.74317.10.0
MIS after SVC188.4−97.53031.8−613.0
Muscat Area Before SVC54.51063.00.00.0
Muscat Area after SVC45.5876.60.0−613.0
Table 6. Harmonics before and after connecting SVC at the candidate buses.
Bus NameTHD% before SVCTHD % after SVC
Airport Height 132 kV0.0760.339
MSQ-1 132 kV0.1571.035
Mawalleh S-B 132 kV0.0800.358
Misfah 132 kV0.0850.783
Mobella 132 kV0.0281.030
Table 7. Load margin for candidate buses with and without SVC.
Bus NameLoad Margin Q (Mvar)Difference (%)
Without SVCWith SVC
Airport Height 132 kV−761.8−961.426.2
MSQ-1 132 kV−934.8−173685.7
Mawalleh S-B 132 kV−684.9−899.031.26
Misfah 132 kV−827.0−1624.096.3
Mobella 132 kV−999.7−1182.018.2
Disclaimer/Publisher’s Note: The statements, opinions and data contained in all publications are solely those of the individual author(s) and contributor(s) and not of MDPI and/or the editor(s). MDPI and/or the editor(s) disclaim responsibility for any injury to people or property resulting from any ideas, methods, instructions or products referred to in the content.

