Abstract
Poor transient load sharing has been observed during the parallel operation of synchronous generators (SGs) and droop-controlled grid-forming (GFM) inverter-based resources (IBRs) in islanded microgrids. This can result in overcurrent protections, causing the inverters to trip, which leads to the collapse of voltage and frequency. In this article, small-signal analysis supported by electromagnetic transients (EMTs) simulation is performed on a detailed model of a microgrid containing IBRs and an SG to identify underdamped modes and their sensitivities to the power–frequency (P-F) droop parameter. Further EMT simulation of a more complex microgrid model with multiple GFM IBRs and SGs is performed to determine whether trends identified from the modal analysis extend to cases where the number of SGs in operation may vary. The objective is to investigate the effectiveness of tuning this parameter to reduce the likelihood of overcurrents in response to load and generation disturbances. The work uncovers both fast and slow modes of concern. Primarily, the findings show that increasing the P-F droop value improves the damping of the slower mode while degrading the damping of the faster mode, leading to an upper limit on the damping improvement of the GFM IBR output current. In EMT simulations of the more complex microgrid, the greatest damping improvement still exhibits significant maximum overshoot. Furthermore, the optimal value of the P-F droop parameter is sensitive to the number of SGs in operation. The conclusion is that tuning the P-F droop parameter is not an effective means to avoid the overcurrent tripping of GFM IBRs during response to large load or generation disturbances when operating in parallel to SGs in islanded microgrids.
1. Introduction
Implementing microgrids capable of independent operation can be a solution to provide a reliable electricity supply. This particularly applies to remote locations where a grid connection is unavailable or where service interruptions are frequent. Under these circumstances, integrating renewable energy resources coupled with energy storage reduces emissions and fuel costs, which are otherwise incurred by operating conventional synchronous generators (SGs) [1]. The already low amount of inertia in these power systems is thus further reduced if SGs are shutdown to prevent operating below minimum load, which can cause operational problems for these devices [2]. This may occur during periods of high renewable energy availability and increases the likelihood of frequency instability [3]. To address this issue, applying the grid-forming (GFM) droop control of inverter-based resources (IBRs) in parallel to SGs has been shown to improve the frequency response to load and generation disturbances in [1,4,5]. Full-scale demonstrations of such scenarios are available in [6,7].
Power–frequency droop control is a mature and widely used strategy for the load sharing of grid-forming inverters in standalone power systems. It is summarized by the following equation, which provides the frequency reference of the droop-controlled inverter
where is a frequency setpoint (fixed or set by a secondary controller), is an active power setpoint (fixed or set by a secondary controller), and is the measured active power output of the inverter. A common method of selecting the droop slope was presented in [8], which was given as
Here, and are the maximum and minimum output active power of the ith inverter, respectively, and and represent the range of allowable operating frequencies of the microgrid. The authors of [4] provided operational frequency bands of international grid codes. The range of maximum positive frequency deviations spanned from 0.016 pu to 0.04 pu and maximum negative frequency deviations spanned from −0.016 pu to −0.06 pu. Since the denominator of (2) is 2.0 pu for a four-quadrant device, a range of typical power–frequency droop slopes would be from 0.016 pu/pu to 0.05 pu/pu. However, both smaller and larger droop slopes were often used in the works reviewed for this manuscript. This was observed from a survey of power–frequency droop values, converted to pu/pu, which are documented in Table 1.

Table 1.
Power–frequency droop slopes from cited references.
In [18], it was shown that the GFM IBRs initially picked up the majority of an abrupt load increase when operating in parallel to an SG. The transient load on the inverter significantly exceeded its post-disturbance steady state load. This phenomenon could trigger the collapse of a microgrid as successive trips of GFM IBRs occur due to the activation of protection thresholds. Such scenarios were demonstrated in [9,10]. Existing efforts addressing this problem proposed control schemes to limit the IBR output power during transient conditions. This led to three forms of current-limiting controls: (1) the utilization of current reference limits in a multi-loop GFM implementation [19]; (2) switching from voltage regulation to current regulation (i.e., grid following (GFL) operation) when the overcurrent occurred [20]; and (3) virtual impedance current limiting, which effectively reduced the IBR voltage behind an impedance [13]. Alternatives to these approaches attempted to dynamically modify the power–frequency relationship of the droop control [10,11]. While these efforts made progress toward improving the reliability of microgrids with GFM IBRs and synchronous machines, they focused on developing additional control schemes added on top of the GFM P-F droop control strategy. In contrast, the work in this paper focused on studying how the P-F droop control itself impacted the damping of the output current of a GFM IBR when operated in parallel to synchronous generators in islanded microgrids.
Other works investigated the damping of important modes in power systems containing droop-controlled GFM IBRs and SGs. Generally, small-signal analysis was performed on reduced-order models to qualitatively describe the interaction of these resources as in [5,12,21,22]. These works focused on the frequency response and the results consistently showed that an increased penetration of GFM IBRs improved the damping of modes observed in the reduced-order models. However, these analyses were limited to slow-moving modes associated with the SG rotor speeds. This limitation was highlighted in [12], where EMT simulation revealed a faster underdamped mode when the GFM IBR penetration was high. Thus, it was unclear whether the damping of faster modes associated with the GFM IBR output current would also be improved and how that trend would be sensitive to the P-F droop parameter. In contrast, small-signal analyses of higher-order microgrid models using a rotating reference frame (RRF) approach were performed in [14,23,24], where the authors presented the response of the dominant system modes to variations in the P-F droop parameter. However, these microgrid models did not include synchronous generators. Finally, the authors in [25,26] studied microgrids containing SGs. They also explored the sensitivity of modes to the GFM IBR P-F droop slope. However, they did not vary other important parameters related to SG and GFM IBR interaction such as the SG inertia or the number of SGs in operation. Additionally, these works assumed SG inertia constants of 5.6 s and 3.5 s, respectively, which are quite large for SGs found in microgrid applications (see 0.4 s cited in [1] and 0.345 s and 1.86 s cited in [27] from real equipment data).
The work in this paper contributed to research into GFM IBR and SG interaction for the improvement of transient load sharing by performing a small-signal analysis of a detailed, mixed-source microgrid model. EMT simulations of the microgrid model were performed to support the observations from the small-signal model. Additional simulation was performed for a more complex microgrid model to determine if the results extend to microgrids with multiple SGs and GFM IBRs. The small-signal analysis and simulations addressed the limitations and shortcomings discussed above by performing a sensitivity analysis of the modes to the P-F droop parameter and SG inertia. The results of this investigation provided valuable insights regarding how the P-F droop parameter affected transient load sharing between these devices. The damping of the GFM IBR output current response was found to be highly sensitive to the P-F droop parameter. However, improvements in the damping achieved by tuning the parameter were limited due to the increasing participation of a faster underdamped mode as the P-F droop parameter was increased. Furthermore, in the microgrid with multiple SGs, the optimal P-F droop value depended on the number of SGs in operation, which would add complexity to any potential tuning algorithm. For these reasons, the investigation concluded that tuning the P-F droop parameter was not an effective means to mitigate poor transient load sharing in low-inertia islanded microgrids.
2. Small-Signal Modeling of a Mixed-Source Microgrid
The transient overload phenomenon involves a large-signal disturbance where a structural change to the microgrid occurs. This disturbance can be the disconnection of an existing distributed energy resource (DER) (generation trip) or the re-connection of a large load (load acceptance). The results are significant changes in the steady state outputs of the DER and a new microgrid operating point. Linearizations of nonlinear models are generally valid only in a small region around an operating point. However, the size of this region depends on the required approximations. Thus, a change in operating point is not guaranteed to significantly impact the locations of system modes. Therefore, small-signal analyses can be applied to the large-signal phenomenon in some cases.
Results from prior works suggested that small-signal models could accurately reproduce responses to large-signal stimuli. The responses to significant load disturbances predicted using the small-signal RRF models of multi-IBR microgrids were validated against laboratory-scale experimental test set-ups in [14,15]. Furthermore, in [16,28], variation in the operating point around which small-signal models were linearized produced minimal changes in the system modes. Finally, in [29], variation in the DER loading of a mixed-source microgrid had a small effect on modes of interest and did not substantially change the sensitivities of those modes to variation in the P-F droop parameter. Leveraging these findings as justification, a small-signal model of a microgrid, illustrated in Figure 1, was developed in order to perform sensitivity analyses to the P-F droop parameter and SG inertia constant.
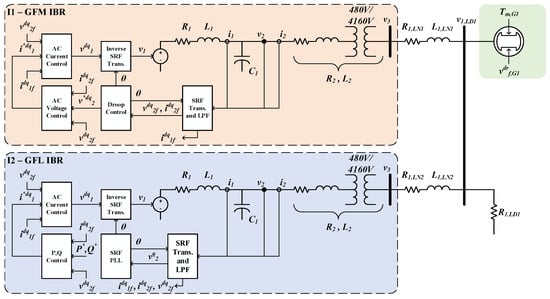
Figure 1.
Diagram of the single Grid-Forming (GFM) Inverter Based Resource (IBR) microgrid. GFM IBR model is highlighted in red and Grid-Following IBR model is highlighted in blue. Refer to Section 2.1.2 through Section 2.1.4 for the GFM IBR controller subsystems. Refer to Section 2.2.1 through Section 2.2.3 for the GFL IBR controller subsystems.
The system in Figure 1 was composed of three DERs: an SG, a three-phase GFM IBR, and a three-phase grid following (GFL) IBRs. The differential and algebraic equations describing the model dynamics were linearized and per unitized on the system base to form the small-signal model. A nonlinear, EMT model of this microgrid was created using Simscape Electrical Specialized Power System toolbox in Matlab/Simulink. The EMT model was used to simulate a load acceptance scenario for comparison with the modal analysis results. The power system model simulation type was discrete with a time step of 50 s, while the overall model used the default fixed-step solver, also with a 50 s time step. The interconnecting impedances and resistive load were balanced, which facilitated the use of the RRF modeling approach. The following subsections present the small-signal model of this system, which will be referred to as the single GFM IBR microgrid for brevity in distinguishing this model from a second microgrid model presented in Section 3. Validation of the small-signal model is presented in Section 4.1.
In the following sections, the subscript 0 was used to denote the value of a variable at the operating point at which the model was linearized. A bar was used to denote a per unitized variable or parameter on the system base, which was 2.5 MVA, 4160 V, and 60 Hz. The subscript b denoted the system base value of a quantity such as power, voltage, frequency, impedance, and admittance. The model parameters are available in Table A1 of Appendix A.
2.1. Grid-Forming Inverter Model
The GFM IBR model, denoted as I1 in Figure 1, was representative of a battery energy storage system and was composed of an LCL filter, an average value model of a two-level voltage source converter, and a fixed DC voltage source, which neglected the DC subsystem dynamics. In [12], the authors found that the adequate sizing of the DC bus capacitor buffered the DC voltage against short-time AC-side output disturbances and thus, this was considered a suitable simplification.
2.1.1. LCL Filter
The LCL filter incorporated a smaller inductor at the inverter terminals followed by a shunt capacitor and then a second, larger inductor, which was consistent with the configuration recommended for multi-loop GFM droop control, as found in [17]. Finally, a step-up transformer connected the GFM IBR AC subsystem to the medium voltage network. The second inductor and step-up transformer were combined and modeled as a series RL circuit with series resistance and inductance . The dynamic equations describing the LCL filter dynamics were
and
where
The superscript denotes the vector of direct (d) and quadrature (q) components of a rotating vector obtained from a three-phase set of stationary reference frame variables by the following transformation:
where is the angular deflection between the stationary axis and the rotating vector when the d-component is non-zero and the q-component is zero. Thus, is the angular velocity of the rotating vector. Note that with the definition of the RRF in (7), the d-axis is aligned with the -axis when is zero and the q-axis leads the d-axis by 90 degrees.
2.1.2. Inner Loop Current Control
The inner loop current controller regulated the current flowing to the LCL filter capacitor by utilizing proportional–integral (PI) control and feedforward decoupling terms. This allowed the GFM IBR to control the AC voltage across the capacitor. The RRF terminal voltage references produced by the inner loop current controller were equated to the physical RRF inverter terminal voltages. This was feasible by neglecting the DC bus dynamics and assuming an ideal operation of the two-level voltage source converter pulse width modulation (PWM) control. The result was the following differential and algebraic equations defining the current controller:
and
The voltage and current low-pass-filter cutoff frequency was chosen to be a decade lower than a hypothetical switching frequency of 4 kHz, creating a realistic upper limit on the bandwidth of the current controller. The PI controller gains were tuned experimentally, starting with to obtain a rise time on the order of a few ms and good stability margin.
2.1.3. Outer Loop Voltage Control
The outer loop voltage controller used PI control and feedforward decoupling terms to synthesize the references for the inner loop current controller based on the LCL filter capacitor voltage error. The equations describing this controller were
and
2.1.4. Active and Reactive Power Droop Control
Droop control was employed in order to maintain synchronism and achieve proportional steady-state active and reactive power load sharing with the SG. The linearized droop control equations were
and
The low-pass filtering of the measured active power was important for avoiding fast frequency deviations and eliminating measurement noise, as discussed in [28]. Additionally, it was found in [28] that the active power measurement low-pass filter significantly changed the behavior of the GFM IBR. Thus, including this model detail and selecting an appropriate cutoff frequency (see [28]) was necessary for obtaining realistic models of GFM IBRs.
2.2. Grid Following Inverter Model
The GFL IBR model, denoted as I2 in Figure 1, was representative of a renewable energy resource with variable output such as a solar/photovoltaic (PV) plant. Similar to the GFM IBR model, it was composed of an LCL filter, an average value two-level voltage source converter model, and a fixed DC voltage source. The principle difference from the GFM IBR was the outer control loops and parameter values. For brevity, the LCL filter equations were omitted from the following subsections as these may be obtained by substituting the GFM IBR subscript I1 for the GFL IBR subscript I2 in (3)–(5).
Note that trigonometric terms appeared in the GFL IBR control equations that were absent from the GFM IBR control equations. This was due to using the GFM IBR RRF as the common RRF for physical system quantities, while other device control system quantities were established in independent RRFs. Thus, linearized frame–frame transformations were required to relate physical system quantities to their counterparts in the RRFs established by other device control systems. More detailed explanations were provided in [14,15]. The linearized forward transformation was
and the inverse was
where
The superscript c indicates the physical quantity counterpart in the device controller RRF and the subscript 0 indicates the quantity at the steady-state operating point.
2.2.1. Inner Loop Current Control
The inner loop current controller of the GFL IBR was identical to the GFM IBR. The PI controller and low-pass filter equations, integrated with the frame–frame transformations, were
and
2.2.2. Outer Loop Power Control
The GFL IBR outer loop controls regulated the output active and reactive power by synthesizing the inner loop current references through the use of PI controllers. The PI controller equations were as follows:
and
2.2.3. Phase-Locked Loop
The GFL IBR used a synchronous reference frame phase-locked loop (PLL) to maintain synchronism between the control system RRF and the system RRF. This allowed the components to be DC quantities at steady state.
and
2.3. Synchronous Generator Model
The six winding, RRF, flux linkage model of the SG was obtained from [30]. The components in the referenced SG model (denoted and ) were aligned such that the -axis is aligned with the -axis when is zero and the -axis lags the -axis by 90 degrees. As a result, the equations relating the SG stator currents and voltages in the system RRF ( and , respectively) to these quantities in the SG RRF ( and ) were
and
Thus, (37) and (38) were used to integrate the SG electrical model equations with the remainder of the microgrid model. The rotational equations of motion were
and
Additionally, the equation for the field winding flux linkage derivative was modified so that a field winding voltage of 1.0 pu will correlate to 1.0 pu stator voltage when the generator was unloaded. This equation was
Field winding flux and engine/governor dynamics were known to have relatively large time constants compared to IBR control dynamics. For this reason, the small-signal model of the SG featured a constant mechanical torque and field voltage, which neglected the influence of the governor and excitation system. Here, it is noted that the base case inertia constant of the SG model used in the analyses in this work is 0.736 s, which was obtained from the manufacturer data of a similarly rated SG encountered by the authors in other research projects.
2.4. Network
The load denoted as LD1 in Figure 1 was modeled as a constant resistance, which caused the load voltage to be given by the following equation:
The lines denoted as LN1 and LN2 (connecting the GFM and GFL IBR to the load in Figure 1, respectively) were modeled as series RL circuits. The line currents and were set equal to the respective IBR point of common coupling (PCC) currents and . Solving for the IBR PCC voltages in terms of the PCC current derivatives produced
and
The line current variables were eliminated by substituting (43) into (5) and (44) into the differential equation, resulting in (not shown, but readily obtained by replacing I1 variables with I2 variables in (5)). The remaining algebraic equations provided above were substituted into the differential equations and rearranged to obtain the complete, linear, state space model of the single GFM IBR microgrid illustrated in Figure 1.
3. EMT Model of a Multiple GFM IBR Microgrid
To determine if observations from the single GFM IBR microgrid analysis extended to a more complex system, an additional microgrid model featuring multiple GFM IBRs and SGs was developed. This was achieved via the modification of the Banshee Distribution System model, which was developed for the benchmarking of commercial microgrid control systems [31]. The loads were converted to constant impedance models. Existing DER models were replaced with the nonlinearized versions of the models presented in Section 2.1 through Section 2.4. Additional GFM IBR and SG models were added to obtain the model shown in Figure 2. The Banshee Distribution System model network data were accessed from a publicly available GitHub repository [32]. The DER model parameters are placed in Table A2 of the Appendix A. The model was developed and simulated using the RTDS Technologies Novacor simulation platform due to the availability of the banshee model as an existing example in the RSCAD modeling package. This model was referred to as the Multiple GFM IBR Microgrid to differentiate it from the system shown in Figure 1.

Figure 2.
Single-line diagram of the Multiple GFM IBR Microgrid (synchronous generator = green circle, GFM IBR = red squares:, and GFL IBR = blue square).
In this case, prime mover and excitation system models were included in the SG generator subsystems to represent diesel internal combustion engine generating sets. The prime mover model was similar to other models found in the literature where the engine was modeled as a fixed delay and the fuel system actuator as a low-pass filter [27,33]. The prime mover model parameters were experimentally determined in order to produce the behavior representative of commercially available internal combustion engine generator sets according to the transient frequency response metrics found in ISO Std. 8528 [34]. A first-order Padé approximation was used to linearize the fixed time delay. The prime mover model block diagram is shown in Figure 3.

Figure 3.
Block diagram of the governor and engine model used for electromagnetic transients (EMT) simulation of the microgrid shown in Figure 2.
The excitation system model was based on the IEEE-type AC5C model [35], which represented brushless excitation systems, and was linearized by neglecting the saturation of the rotating exciter. This model is provided in Figure 4.

Figure 4.
Block diagram of the excitation system model used for EMT simulation of the microgrid shown in Figure 2.
The EMT model was used to simulate several generation trip scenarios with a time step of 50 s. Results and analysis obtained from the simulation of this model will be discussed in Section 4.3.
4. Results
4.1. Validation of the Small-Signal Model
This section provides a validation of the small-signal model presented in Section 2. Validation was performed by simulating both the small-signal and EMT models of the microgrid shown in Figure 1 and comparing the responses of select state variables. Two cases featuring different disturbances were tested. First, the state variables were recorded in the EMT model before and after the disturbance was applied. These values were used as the small-signal model states at the pre- and post-disturbance operating points ( and , respectively). The post-disturbance operating point was used to obtain the state matrix . Then, the small-signal model was simulated using Matlab/Simulink with the default fixed-step solver and 50 s time step according to
The first disturbance was a reduction in the load LD1 shunt resistance, which caused a 0.2 pu (on the system base) increase in the active power consumed by load. The relevant setpoints and parameters used for this simulation are summarized in Table 2.

Table 2.
Load acceptance EMT simulation setpoints and parameters. System base: 60 Hz, 2.5 MVA, 4160 V.
The responses of the selected state variables from the EMT simulation and small-signal model simulation are compared in Figure 5.
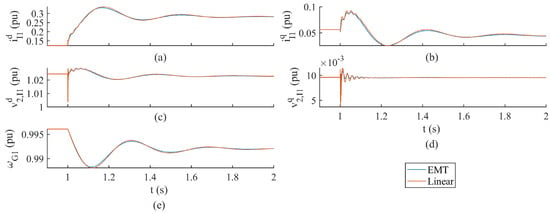
Figure 5.
Comparison of model states in response to load acceptance for EMT and small-signal models of the single GFM IBR microgrid. The EMT states are in blue and small-signal model states are in red; (a,b) show the GFM IBR output currents; (c,d) show the GFM IBR filter capacitor voltages; and (e) shows the generator rotor speed.
Higher resolution plots of the GFM IBR filter capacitor voltages are provided in Figure 6 to illustrate the model agreement for higher-frequency modes.
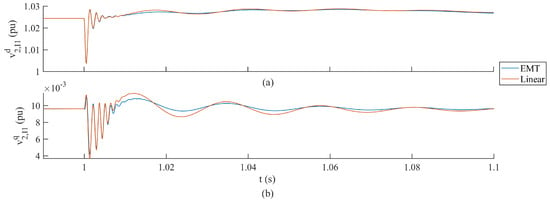
Figure 6.
Higher resolution comparison of the GFM IBR filter capacitor voltages in response to load acceptance for EMT and small-signal models of the single GFM IBR microgrid. The EMT states are in blue and small-signal model states are in red; (a) shows the d-axis voltage and (b) shows the q-axis voltage.
A contingency where the GFL IBR was tripped offline was simulated for the second case. The relevant setpoints and parameters used for this simulation are summarized in Table 3.

Table 3.
GFL IBR Contingency EMT Simulation Setpoints and Parameters. System Base: 60 Hz, 2.5 MVA, 4160 V.
The responses of the selected state variables for the GFL IBR contingency case are compared in Figure 7 with higher-resolution plots of the filter voltages in Figure 8.
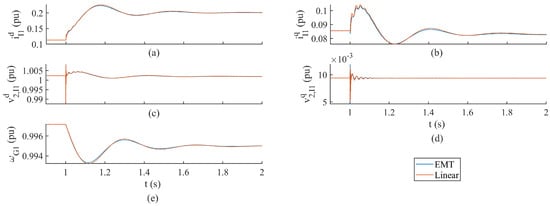
Figure 7.
Comparison of model states in response to GFL IBR contingency for EMT and small-signal models of the single GFM IBR microgrid. The EMT states are in blue and small-signal model states are in red; (a,b) show the GFM IBR output currents; (c,d) show the GFM IBR filter capacitor voltages; and (e) shows the generator rotor speed.

Figure 8.
Higher resolution comparison of the GFM IBR filter capacitor voltages in response to GFL IBR contingency for EMT and small-signal models of the single GFM IBR microgrid. The EMT states are in blue and small-signal model states are in red; (a) shows the d-axis voltage and (b) shows the q-axis voltage.
Note that the small-signal model cannot reproduce the behavior of an EMT breaker model, which includes an RC-snubber circuit as well as single-phase switching at the current waveform zero crossings. Therefore, the GFL IBR model was replaced with controlled current sources, which injected the pre-disturbance GFL IBR point of common coupling currents. To simulate the contingency, the current source references were instantaneously set to zero. Additionally, to reflect the GFL IBR contingency in the small-signal model, the equations and variables related to the GFL IBR dynamics were removed before forming the state matrix.
The EMT and small-signal model state variable responses in Figure 5 through to Figure 8 exhibit similar amplitudes and frequencies. The two test cases resulted in similar behavior, which was expected since load acceptance and generation loss both cause rapid increases in load for the grid-forming inverter and synchronous generator. The authors selected these types of disturbances as they are highly applicable to the transient load sharing problem.
4.2. Modal Analysis of Small-Signal Microgrid Model
A state matrix was formed by using the small-signal model discussed in Section 2 and post-load acceptance operating point discussed in Section 4.1. This matrix was used as the basis to conduct a sensitivity analysis of the eigenvalues and eigenvectors to variation in the GFM IBR P-F droop parameter and the synchronous generator inertia . The analysis began by identifying modes with low-to-moderate damping ratios that were both sensitive to and participated in the state variable . The variable was selected because the choice of RRF orientation caused the disturbances associated with fluctuation in the GFM IBR output active power to appear predominantly as an increase in the GFM IBR ouput current d-axis component magnitude. This can be seen from Figure 5. Thus, the presence of modes with low and significant participation in were indicative of a poorly damped GFM IBR output current response to an active power-related disturbance (such as generation trip or load acceptance) and an elevated risk of tripping overcurrent protections. The eigenvalues of the state matrix were iteratively computed using the eig() function of the Numpy linalg module in Python for a set of values ranging from 0.002 pu/pu to 0.2 pu/pu on the GFM IBR base, and the eigenvalue trajectories are displayed in Figure 9.

Figure 9.
Sensitivities of the single GFM IBR microgrid system (see Figure 1) eigenvalues to . Increasing marker size indicates increase in from 0.002 pu/pu to 0.2 pu/pu on GFM IBR base. The inset shows underdamped eigenvalues that were found to be sensitive to , which have been labeled , , and .
Figure 9 shows three underdamped modes (see inset at right), which responded significantly to the variation in the grid-forming inverter P-F droop . These were designated in order of decreasing damped natural frequency as the fast , medium , and slow modes. The main trends observed were that both and exhibited very low damping ratios initially. Then, experienced a significant damping improvement, while moved toward the right hand side (RHS) of the real axis, eventually leading to instability and imposing a limit on any damping improvement to . exhibited a worst-case damping ratio of 0.45, which corresponded to an overshoot of about 20% for a second-order system and therefore was not considered a problem mode. In the remaining analysis, a maximum overshoot was used as the threshold to determine if a response was well damped. This threshold was chosen as it had been encountered in overcurrent and overload protection functions of commercially available control systems for both IBRs and SGs in the authors experience.
In the next step, the inertia constant of the SG varied from 0.368 s to 3.312 s. The objective was to determine how the mode trends respond to the changes in the system inertia. This was deemed an important consideration as there was consensus from the power systems research community that the integration of renewables would lead to lower-inertia power systems [4,5,12,21,22]. At a more local level, islanded microgrids may feature groups of smaller SGs [1] that perform load-dependent start/stop operations to ensure that individual units operate at minimum loads, thus causing the amount of physical inertia to vary depending on the microgrid load and renewables’ profiles. For this reason, a simultaneous sensitivity of the modes – to the GFM IBR P-F droop and is presented in Figure 10.
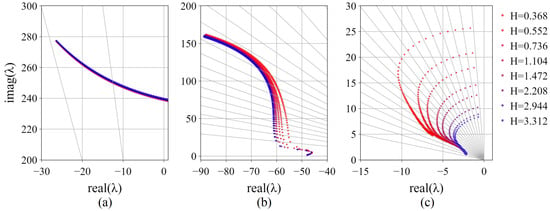
Figure 10.
Sensitivities of , , and to for variation in . Increasing marker size indicates increase in from 0.002 pu/pu to 0.2 pu/pu on GFM IBR base. Gray radial lines indicate constant damping ratio. (a) Sensitivity of . (b) Sensitivity of . (c) Sensitivity of .
The main observation from Figure 10 was that sensitivity trends of the fast mode and medium mode to the GFM IBR P-F droop were little affected by the SG inertia constant value. The trends for the slow mode showed that the natural frequency was reduced by increasing ; however, the trends in damping were very similar as indicated by the constant damping ratio lines in subplot (c). Therefore, it was predicted that the damping improvement in the GFM IBR output current magnitude determined through detailed simulation would exhibit only minor sensitivity to . At this point, further modal analysis was performed for only and due to finding that exhibited suitable damping ratios regardless of the values of or tested.
The participation factors are often used in modal analysis to determine how the system modes contribute to the response of the system states when perturbed away from the operating point to some initial condition, denoted as . This is readily observed by the time domain solution of the linear system response (assuming the system inputs are constant):
where the columns of are the right eigenvectors (also known as mode shapes) and the columns of are the left eigenvectors. Thus, the term containing the mode and the initial value of the state in the solution of the state is
and is the participation factor. and were used to denote the participation of the fast mode and the slow mode in the GFM IBR d-axis current , respectively. The sensitivities of and to the GFM IBR P-F droop and SG inertia constant are given in Figure 11.
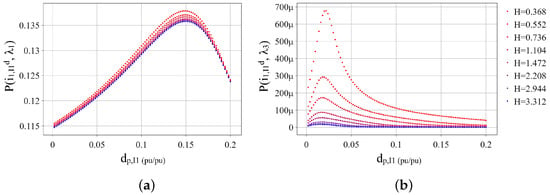
Figure 11.
Sensitivities of (a) and (b) to and .
The participation factor trends suggested that the fastest mode would be the dominate oscillatory mode observed in the response of the GFM IBR d-axis current regardless of the value of the GFM IBR P-F droop and SG inertia constant . In contrast, would likely not be observed at all. It was noted that there are other underdamped oscillatory modes that were not studied due to insensitivity to both and . However, in referring once again to Figure 9, these modes had greater than 4000 rad/s and a damping ratio of at least 0.1 and so were likely to settle before contributing to an overcurrent condition.
The implications of the analysis thus far was that the smallest value of the GFM IBR P-F droop would yield the best damping of the GFM IBR output current magnitude response to a load or generation disturbance. This prediction was tested with 198 simulations of the EMT model of the single GFM IBR microgrid performed for 22 different values of and nine values of the SG inertia constant . The output current magnitude of the GFM IBR was recorded for each combination of parameters in response to a 0.2 pu load increase occuring at . The EMT simulation was carried out using built-in stationary reference frame models of passive and active components available in the Matlab/Simulink Specialized Power System toolbox. As a result, the magnitude was obtained by first applying (7) ( can be arbitrary) to the three-phase currents and then calculating the magnitude as
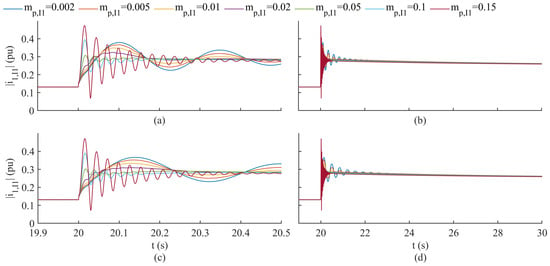
Figure 12.
EMT simulations of 0.2 pu load acceptance in single GFM IBR microgrid (see Figure 1) for variations in and . Plots illustrate response of GFM IBR output current magnitude to load disturbance. (a) Short time and (b) full transient response when is 0.368 s. (c) Short time and (d) full transient response when is 0.736 s.
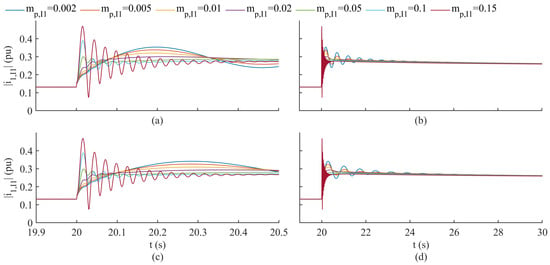
Figure 13.
EMT simulations of 0.2 pu load acceptance in single GFM IBR microgrid (see Figure 1) for variations in and . Plots illustrate response of GFM IBR output current magnitude to load disturbance. (a) Short time and (b) full transient response when is 1.472 s. (c) Short time and (d) full transient response when is 2.944 s.
The most notable observation from these figures was the prevalence of the slow mode in response to the GFM IBR output current magnitude when the GFM IBR P-F droop was less than 0.05 pu/pu (on the GFM IBR’s base). This seemed to contradict the indication of mode participations by the participation factors shown in Figure 11. This result was significant given that participation factors were traditionally used to identify dominant modes associated with specific state variables in power systems (see [26,36]). Additionally, the use of these metrics continued to be found in more recent works, addressing power system frequency stability improvement [37,38]).
It was apparent that the substantial participation of the slow mode in the GFM IBR current magnitude observed in the subplots of Figure 12 and Figure 13 may be due to the excitation of by the initial conditions of states other than the GFM IBR d-axis current . This would not be reflected by the values of the participation factor illustrated in Figure 11. To determine if another state was exciting , the elements of the matrix containing the left eigenvectors of the model state matrix (henceforth referred to as the mode excitations) correlating to the fast mode and slow mode for the case when = 0.01 pu/pu and = 0.736 s are tabulated in Table 4.

Table 4.
and excitations by states when is 0.01 pu/pu and is 0.736 s for single GFM IBR microgrid.
From Table 4, the excitation of the slow mode by the SG rotor speed was found to be several orders of magnitude larger than the excitation of by the GFM IBR d-axis current . This explained the discrepancy between the values of the participation factor from Figure 11 and the EMT simulation results in Figure 12 and Figure 13. It was proposed to use a new metric to estimate the participation of a mode in a state , which would be denoted and given by
The sensitivities of and to and are plotted in Figure 14.
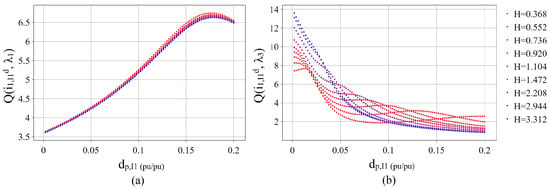
Figure 14.
Sensitivity of (a) and (b) to (pu/pu values are on GFM IBR base) and .
The following observations arose from a comparison of Figure 11, Figure 12, Figure 13 and Figure 14:
- In contrast to the participation factors, the metrics clearly indicated the contribution of in response to ;
- The metrics predicted the inversion of the relative dominance of the slow mode and fast mode in response to the GFM IBR current magnitude as the GFM IBR P-F droop increased toward the stability limit;
- exhibited almost no sensitivity to the SG inertia constant while showed some sensitivity to but the general trend was the same.
The smallest overshoot occurring for each value and the corresponding value of P-F droop parameter are tabulated in Table 5.

Table 5.
Smallest overshoot of and the corresponding value of for each EMT simulation of the single GFM IBR microgrid.
Table 5 shows that the optimal value of exhibited little sensitivity to as decreased by 0.01 pu/pu. The total improvement to was 16.8%. Additionally, the values of showed diminishing returns as increased. These results suggested that re-tuning the value of when the physical inertia in the system changed would confer minimal benefit since even the best case scenario resulted in greater than 20% maximum overshoot.
4.3. EMT Simulation of the Multiple GFM IBR Microgrid
EMT simulations of the microgrid shown in Figure 2 were performed to determine if the same trends obtained from analyzing the single GFM IBR microgrid (Figure 1) would be observed. Details about the simulation platform and settings are given in Section 3. Four case studies were developed such that the number of diesel generators in operation varied from one to four. In each case study, the GFL IBR was tripped offline, resulting in a substantial load acceptance for the remaining DER. The cases were designed to result in approximately the same pre- and post-disturbance loading of the GFM IBRs (0.55 pu and 0.9 pu, respectively) and the diesel generators (0.48 pu and 0.8 pu, respectively). This was accomplished by adjusting the pre-disturbance GFL IBR active and reactive power setpoints and connecting only a subset of the constant impedance loads. These scenarios are described in Table 6.

Table 6.
Multiple GFM IBR microgrid cases.
For each case, several simulations were run in which the value of the P-F droop parameter shared by all three GFM IBRs varied from 0.02 pu/pu to 0.10 pu/pu (on the GFM IBR base) to determine the effect, if any, on the magnitude of the output current of the GFM IBRs (calculated according to (48)). The starting value of resulted in the maximum output of the GFM IBRs occurring for a frequency of 58.8 Hz at steady state, which was the continuous operation lower limit for distributed IBRs per the IEEE Std. 1547-2018 frequency ride-through requirements [39]. Additionally, it should be noted that the GFM IBR models were identical in structure and parameters and their output current response to the generation trip was found to be nearly the same across all cases and values of tested, as illustrated by the traces in Figure 15.

Figure 15.
Case 1 IBR1–IBR3 output current responses to generation trip when is 0.02 pu/pu on the GFM IBR base.
This was expected due to the similarity of these models and the fact that the network impedances are smaller than the GFM IBR LCL filter impedances. As a result, further figures containing simulation results will only show the response of IBR1 output current magnitude for space considerations.
A subset of the results of the Case 1 through Case 4 simulations are shown in Figure 16 and Figure 17. From examining the output current responses for the Multiple GFM IBR Microgrid simulations, it was observed that the response contains both fast (hundreds of rad/s) and slow (tens of rad/s) components that were easily distinguished due to their disparities in time scales.
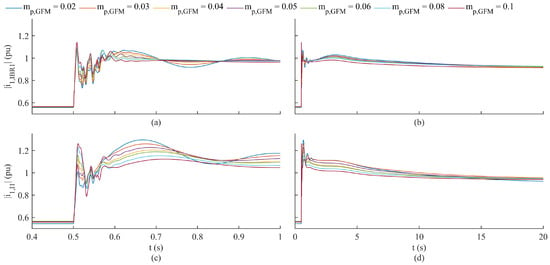
Figure 16.
EMT simulations of IBR4 trip in Multiple GFM IBR Microgrid (see Figure 2) for variations in and the number of SGs (as indicated by the case number in Table 6). Plots illustrate response of IBR1 output current magnitude to generation disturbance. (a) Short time and (b) full transient response for Case 1 (one SG). (c) Short time and (d) full transient response for Case 2 (two SGs).
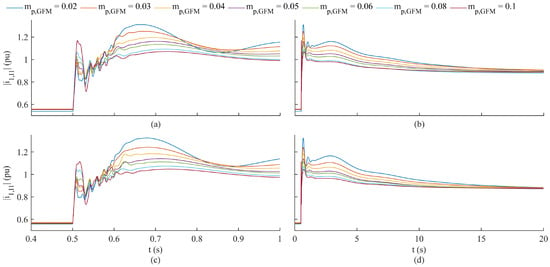
Figure 17.
EMT simulations of IBR4 trip in Multiple GFM IBR Microgrid (see Figure 2) for variations in and number of SGs (as indicated by the case number in Table 6). Plots illustrate response of IBR1 output current magnitude to generation disturbance. (a) Short time and (b) full transient response for Case 3 (three SGs). (c) Short time and (d) full transient response for Case 4 (four SGs).
This was similar to the distribution of modes observed in Figure 12 and Figure 13. For comparison with the EMT simulation results of the single GFM IBR microgrid, the same data pertaining to the smallest overshoots of are record in Table 7.

Table 7.
Smallest overshoot of and corresponding values from EMT simulations of the Multiple GFM IBR Microgrid.
From Figure 16 and Figure 17, and Table 7, it was apparent that the introduction of the governor and exciter dynamics significantly affected the settling time of the IBR1 output current magnitude and decreased the damping of the slower modes. Table 7 shows a substantial reduction in the effectiveness of tuning the GFM IBR P-F droop to improve the damping of the GFM IBR output current in the Multiple GFM IBR Microgrid as compared to the single GFM IBR microgrid. Interestingly, Table 7 shows that the greatest damping improvement to occurred for the fewest number of SG cases and that the optimal value of exhibited significant sensitivity to the number of SGs in operation. These results revealed the importance of the detailed modeling of the governor and excitation systems despite large time constants associated with these subsystems. Overall, the damping improvement by tuning was still limited to an unsatisfactory level and the change in the smallest overshoot due to the variation in the number of SGs in operation was 19%. This was a similar result to the limited improvement in the damping and low sensitivity of to the SG inertia constant in the single GFM IBR microgrid analysis.
5. Discussion
In this paper, the detailed modeling of a mixed-source microgrid containing a GFM IBR, GFL IBR, and SG was performed to create a simple yet effective platform for studying the phenomenon of transient load sharing between GFM-controlled IBRs and SGs (see Figure 1 in Section 2). The model was linearized to obtain the small signal equivalent in Section 2.1, Section 2.2, Section 2.3 and Section 2.4. The linear model was analyzed in Section 4.2 to identify two important modes of interest contributing to the underdamped response of the GFM IBR output current to a load disturbance. This was compared to EMT simulations of the microgrid model in Figure 1. Notably, participation factors traditionally used to identify dominant modes associated with specific state variables in power systems did not predict the prevalence of the lower-frequency mode in the GFM IBR output current response. Alternatively, a metric was proposed, which better indicated the participations of each mode and the sensitivities of these participations to both the P-F droop parameter and SG inertia. Finally, EMT simulations were performed on a more complex microgrid (see Figure 2 in Section 3) and the results were compared with the modal analysis results. These led to three important findings relating to the influence of the P-F droop parameter on the GFM IBR output current damping:
- The peak value of the GFM IBR output current in response to a load acceptance displayed high sensitivity to the P-F droop parameter.
- The optimal value of P-F droop parameter in the Multiple GFM IBR Microgrid was dependent on the number of SGs in the system, with substantial variation in the optimal value and the lowest overshoot occurring with only one SG in the system (the greatest penetration of the GFM IBRs).
- In the Multiple GFM IBR Microgrid, the lowest overshoot achieved was 44.9%.
The first finding was noteworthy as it was in direct contrast to prior work investigating interactions of GFM IBR and SG in [25]. The second finding was somewhat aligned with the results in [12,21,22], which established improvement in the damping of frequency transients in power systems as the ratio of GFM IBRs to SGs increases. Having found the GFM IBR output current to be highly coupled to the SG rotor speed through the slow mode , it could be concluded that the damping improvement extends to the GFM IBR output currents as well. However, the reduced-order modeling in these works failed to capture the higher-frequency modes, which would clearly contribute to the overcurrent tripping of the GFM IBRs. In the context of islanded microgrids with fewer resources, it was unclear whether the frequency stability improvement would offset an increased risk of cascading generation trips due to the greater proportions of devices with higher sensitivity to overcurrents. Finally, the main implication of the findings was that tuning the P-F droop parameter was not an effective approach to reducing the potential for overcurrent conditions for GFM IBR in response to large load and generation disturbances. This was consistently the result across simulations of both microgrid models. Furthermore, the value of P-F droop parameter that optimizes the current damping objective was sensitive to the number of SGs in operation, which would increase the computational burden of the P-F droop tuning approach for minimal payback. Future work on the transient load sharing of GFM IBRs and SGs will focus on developing auxiliary control loops that can enforce output power and current limits of the GFM IBR through the initial phase of the load or generation disturbance response, while still supporting load sharing objectives during the recovery and post-recovery phases.
Author Contributions
Conceptualization, J.W.; Funding acquisition, R.H.; Investigation, J.W.; Methodology, J.W.; Project administration, R.H.; Supervision, R.H.; Visualization, J.W.; Writing—original draft, J.W.; Writing—review and editing, J.W. and R.H. All authors have read and agreed to the published version of the manuscript.
Funding
This research was funded by the Advanced Manufacturing Office of the Office of Energy Efficiency and Renewable Energy of the U.S Department of Energy under award numbers DE-EE0008409 and DE-EE0009423.
Data Availability Statement
Not applicable.
Conflicts of Interest
The authors declare no conflict of interest.
Appendix A

Table A1.
Single GFM IBR microgrid model parameters. System base: 2.5 MVA, 4160 V/480 V, 2 60 rad/s.
Table A1.
Single GFM IBR microgrid model parameters. System base: 2.5 MVA, 4160 V/480 V, 2 60 rad/s.
| Param. | Value | Param. | Value | Param. | Value |
|---|---|---|---|---|---|
| Common Parameters | |||||
| 2.5 MVA | 480 V | 2 60 rad/s | |||
| 10.85 S | 0.0922 | ||||
| I1 GFM IBR Parameters, Base: 1.0 MVA, 480 V | |||||
| 0.1 m | 30.0 H | 1.9 mF | |||
| * | 0.0037 | * | 132.0 H | 0.05 V/A | |
| 2.5 V/As | 10.0 A/V | 1000.0 A/Vs | |||
| 2500.0 rad/s | 100.0 rad/s | 0.01 pu | |||
| 0.05 pu | |||||
| I2 GFL IBR Parameters, Base: 2.0 MVA, 480 V | |||||
| 0.001 | 150.0 H | 1.3 mF | |||
| ** | 0.92 m | ** | 35.4 H | 0.1 V/A | |
| 1.0 V/As | 100.0 A/MVA | 8000.0 A/MVAs | |||
| 2500.0 rad/s | 628.0 rad/s | 10.0 rad/sV | |||
| 1000.0 rad/V | |||||
| G1 SG Parameters, Base: 2.5 MVA, 4160 V | |||||
| 0.01457 pu | 0.007293 pu | 1.7503 pu | |||
| 1.7503 pu | 0.2898 pu | 0.0207 pu | |||
| 0.1148 pu | 0.00058 pu | 0.1504 pu | |||
| 0.1115 pu | 0.4407 pu | 0.09327 pu | |||
| H | 0.736 s | D | 0.01 pu | ||
| Network Parameters | |||||
| 0.7157 | 1.661 mH | 0.0837 | |||
| 0.276 mH | 5.769 | ||||

Table A2.
Multiple GFM IBR Microgrid model parameters. System base: 2.5 MVA, 4160 V/480 V, 2 60 rad/s.
Table A2.
Multiple GFM IBR Microgrid model parameters. System base: 2.5 MVA, 4160 V/480 V, 2 60 rad/s.
| Param. | Value | Param. | Value | Param. | Value |
|---|---|---|---|---|---|
| IBR1–IBR3 GFM IBR Parameters, Base: 1.0 MVA, 480 V | |||||
| 0.001 | 30.0 H | 1.91 mF | |||
| * | 0.0168 | * | 176.0 H | 0.05 V/A | |
| 2.5 V/As | 10.0 A/V | 10 A/Vs | |||
| 2500.0 rad/s | 100.0 rad/s | 0.02 pu | |||
| 0.05 pu | |||||
| IBR4 GFL IBR Parameters, Base: 4.0 MVA, 480 V | |||||
| 0.00538 | 400.0 H | 2.3 mF | |||
| ** | 0.415 m | ** | 6.01 H | 0.2 V/A | |
| 3.26 V/As | 100.0 A/MVA | 10 A/MVAs | |||
| 2500.0 rad/s | 100.0 rad/s | 5.0 rad/sV | |||
| 500.0 rad/V | |||||
| G1–G4 Diesel Generator Parameters ***, Base: 2.5 MVA, 13.8 kV | |||||
| 15.0 pu | 4.0 pu | 0.02 pu | |||
| 0.1 s | 0.1 s | 0.024 s | |||
| 100.0 pu | 0.02 s | 0.03 pu | |||
| 1.0 s | 0.01 pu | 0.001 s | |||
| 0.8 s | 0.12 pu | 1.0 pu | |||
| 0.3 pu | 1.0 pu | ||||
References
- Hernandez-Alvidrez, J.; Darbali-Zamora, R.; Flicker, J.D.; Shirazi, M.; VanderMeer, J.; Thomson, W. Using Energy Storage-Based Grid Forming Inverters for Operational Reserve in Hybrid Diesel Microgrids. Energies 2022, 15, 2456. [Google Scholar] [CrossRef]
- Jabeck, B. The Impact of Generator Set Underloading, LEXE0832-01. Deerfield: Caterpillar Inc. 2014. Available online: https://s7d2.scene7.com/is/content/Caterpillar/CM20151029-39727-00007?_ga=2.135155441.1302000910.1615573472-291789971.1615573472 (accessed on 1 August 2023).
- Farrokhabadi, M.; Cañizares, C.A.; Simpson-Porco, J.W.; Nasr, E.; Fan, L.; Mendoza-Araya, P.A.; Tonkoski, R.; Tamrakar, U.; Hatziargyriou, N.; Lagos, D.; et al. Microgrid Stability Definitions, Analysis, and Examples. IEEE Trans. Power Syst. 2020, 35, 13–29. [Google Scholar] [CrossRef]
- Fang, J.; Li, H.; Tang, Y.; Blaabjerg, F. On the Inertia of Future More-Electronic Power Systems. IEEE J. Emerg. Sel. Top. Power Electron. 2019, 7, 2130–2146. [Google Scholar] [CrossRef]
- Lasseter, R.H.; Chen, Z.; Pattabiraman, D. Grid-Forming Inverters: A Critical Asset for the Power Grid. IEEE J. Emerg. Sel. Top. Power Electron. 2020, 8, 925–935. [Google Scholar] [CrossRef]
- Lasseter, R.H.; Eto, J.H.; Schenkman, B.; Stevens, J.; Vollkommer, H.; Klapp, D.; Linton, E.; Hurtado, H.; Roy, J. CERTS Microgrid Laboratory Test Bed. IEEE Trans. Power Deliv. 2011, 26, 325–332. [Google Scholar] [CrossRef]
- Lin, Q.; Uno, H.; Ogawa, K.; Kanekiyo, Y.; Shijo, T.; Arai, J.; Matsuda, T.; Yamashita, D.; Otani, K. Field Demonstration of Parallel Operation of Virtual Synchronous Controlled Grid-Forming Inverters and a Diesel Synchronous Generator in a Microgrid. IEEE Access 2022, 10, 39095–39107. [Google Scholar] [CrossRef]
- Lopes, J.A.P.; Moreira, C.L.; Madureira, A.G. Defining control strategies for MicroGrids islanded operation. IEEE Trans. Power Syst. 2006, 21, 916–924. [Google Scholar] [CrossRef]
- Pulcherio, M.C.; Renjit, A.A.; Illindala, M.S.; Khalsa, A.S.; Eto, J.H.; Klapp, D.A.; Lasseter, R.H. Evaluation of Control Methods to Prevent Collapse of a Mixed Source Microgrid. IEEE Trans. Ind. Appl. 2016, 20, 4566–4576. [Google Scholar] [CrossRef]
- Mondal, A.; Illindala, M.S. Improved Frequency Regulation in an Islanded Mixed Source Microgrid through Coordinated Operation of DERs and Smart Loads. IEEE Trans. Ind. Appl. 2018, 54, 112–120. [Google Scholar] [CrossRef]
- Du, W.; Lasseter, R.H.; Kalsa, A.S. Survivability of Autonomous Microgrid during Overload Events. IEEE Trans. Smart Grid 2019, 10, 3515–3524. [Google Scholar] [CrossRef]
- Kenyon, R.W.; Sajadi, A.; Bossart, M.; Hoke, A.; Hodge, B. Interactive Power to Frequency Dynamics between Grid-Forming Inverters and Synchronous Generators in Power Electronics-Dominated Power Systems. IEEE Syst. J. 2023, 1–12. [Google Scholar] [CrossRef]
- Paquette, A.D.; Divan, D.M. Virtual Impedance Current Limiting for Inverters in Microgrids with Synchronous Generators. IEEE Trans. Ind. Appl. 2015, 51, 1630–1638. [Google Scholar] [CrossRef]
- Pogaku, N.; Prodanovic, M.; Green, T.C. Modeling, Analysis and Testing of Autonomous Operation of an Inverter-Based Microgrid. IEEE Trans. Power Electron. 2007, 22, 613–625. [Google Scholar] [CrossRef]
- Rasheduzzaman, M.; Mueller, J.A.; Kimball, J.W. An Accurate Small-Signal Model of Inverter-Dominated Islanded Microgrids Using dq Reference Frame. IEEE J. Emerg. Sel. Top. Power Electron. 2014, 2, 1070–1080. [Google Scholar] [CrossRef]
- Qoria, T.; Gruson, F.; Colas, F.; Guillaud, X.; Debry, M.-S.; Prevost, T. Tuning of Cascaded Controllers for Robust Grid-Forming Voltage Source Converter. In Proceedings of the 20th Power System Computation Conference (PSCC), Dublin, Ireland, 11–15 June 2018. [Google Scholar]
- Du, W.; Chen, Z.; Schneider, K.P.; Lasseter, R.H.; Pushpak Nandanoori, S.; Tuffner, F.K.; Kundu, S. A Comparative Study of Two Widely Used Grid-Forming Droop Controls on Microgrid Small-Signal Stability. IEEE J. Emerg. Sel. Top. Power Electron. 2020, 8, 963–975. [Google Scholar] [CrossRef]
- Paquette, A.D.; Reno, M.J.; Harley, R.G.; Divan, D.M. Sharing Transient Loads: Causes of Unequal Transient Load Sharing in Islanded Microgrid Operation. IEEE Ind. Appl. Mag. 2014, 20, 23–34. [Google Scholar] [CrossRef]
- Huang, L.; Xin, H.; Wang, Z.; Zhang, L.; Wu, K.; Hu, J. Transient Stability Analysis and Control Design of Droop-Controlled Voltage Source Converters Considering Current Limitation. IEEE Trans. Smart Grid 2019, 10, 578–591. [Google Scholar] [CrossRef]
- Oureilidis, K.O.; Demoulias, C.S. A Fault Clearing Method in Converter-Dominated Microgrids with Conventional Protection Means. IEEE Trans. Power Electron. 2016, 31, 4628–4640. [Google Scholar] [CrossRef]
- Tayyebi, A.; Dominic, G.; Adolfo, A.; Kupzog, F.; Dorfler, F. Frequency Stability of Synchronous Machines and Grid-Forming Power Converters. IEEE J. Emerg. Sel. Top. Power Electron. 2020, 8, 1004–1018. [Google Scholar] [CrossRef]
- Sajadi, A.; Kenyon, R.W.; Hodge, B. Synchronization in Electric Power Networks with Inherent Heterogeneity up to 100% Inverter-Based Renewable Generation. Nat. Commun. 2022, 13, 2490. [Google Scholar] [CrossRef]
- Naresh Kumar, V.; Parida, S.K. Modeling, Parameter Optimization of Universal Droop and Internal Model Controller for Multi Inverter-Fed DGs Based on Accurate Small-Signal Model. IEEE Access 2019, 7, 101928–101940. [Google Scholar] [CrossRef]
- He, J.; Wu, X.; Wu, X.; Xu, Y.; Guerrero, J.M. Small-Signal Stability Analysis and Optimal Parameters Design of Microgrid Clusters. IEEE Access 2019, 7, 36896–36909. [Google Scholar] [CrossRef]
- Miao, Z.; Domijan, A.; Fan, L. Investigation of Microgrids with Both Inverter Interfaced and Direct AC-Connected Distributed Energy Resources. IEEE Trans. Power Deliv. 2011, 26, 1634–1642. [Google Scholar] [CrossRef]
- Malik, S.M.; Sun, Y.; Ai, X.; Chen, Z.; Wang, K. Small-Signal Analysis of a Hybrid Microgrid with High PV Penetration. IEEE Access 2019, 7, 119631–119643. [Google Scholar] [CrossRef]
- Conte, F.; Massucco, S.; Silvestro, F.; Baccino, F.; Serra, P. Equivalent Modelling of Reciprocating Engines Generators for Microgrid Frequency Response Analysis. In Proceedings of the IEEE Manchester PowerTech Conference, Manchester, UK, 18–22 June 2017. [Google Scholar] [CrossRef]
- Qoria, T.; Cossart, Q.; Li, C.; Guillaud, X.; Colas, F.; Gruson, F.; Kestelyn, X. Deliverable 3.2 Local Control and Simulation Tools for Large Transmission Systems, Horizon 2020-LCE-6. MIGRATE. 2018. Available online: https://www.h2020-migrate.eu/_Resources/Persistent/5c5beff0d5bef78799253aae9b19f50a9cb6eb9f/D3.2%20-%20Local%20control%20and%20simulation%20tools%20for%20large%20transmission%20systems.pdf (accessed on 1 August 2023).
- Westman, J.; Hadidi, R. Influence of Power-Frequency Droop on Grid Forming Inverter Current Damping in Mixed Source Islanded Microgrids. In Proceedings of the 59th Industrial and Commercial Power Systems Technical Conference (I&CPS), Las Vegas, NV, USA, 21–25 May 2023. [Google Scholar] [CrossRef]
- Krause, P.; Wasynczuk, O.; Sudhoff, S. Analysis of Electric Machinery and Drive Systems, 2nd ed.; John Wiley & Sons: Hoboken, NJ, USA, 2002; Chapter 5; pp. 200–205. ISBN 0-471-14326-X. [Google Scholar]
- Salcedo, R.; Corbett, E.; Smith, C.; Limpaecher, E.; Rekha, R.; Nowocin, J.; Lauss, G.; Fonkwe, E.; Almeida, M.; Gartner, P.; et al. Banshee Distribution Network Benchmark and Prototyping Platform for Hardware-in-the-Loop Integration of Microgrid and Device Controllers. IET J. Eng. 2019, 2019, 5365–5373. [Google Scholar] [CrossRef]
- PowerSystemHIL/EPHCC. Available online: https://github.com/PowerSystemsHIL/EPHCC/tree/master/DistributionSystems/SimulinkOpal/Banshee (accessed on 8 August 2023).
- Roy, S.; Malik, O.P.; Hope, A.G. An Adaptive Control Scheme for Speed Control of Diesel Power-Plants. IEEE Trans. Energy Conv. 1991, 6, 605–611. [Google Scholar] [CrossRef]
- Ponte, P. Transient Performance of Generating Sets; 5544421; Cummins Inc.: Columbus, IN, USA, 2019; Available online: https://mart.cummins.com/imagelibrary/data/assetfiles/0058629.pdf (accessed on 1 August 2023).
- Std 421.5-2016; IEEE Recommended Practice for Excitation System Models for Power System Stability Studies. IEEE: Piscataway, NJ, USA, 2016.
- Kundur, P. Power System Stability and Control; McGraw-Hill: New York, NY, USA, 1994; Chapter 12; pp. 715–716. [Google Scholar]
- Zenelis, I.; Wang, X.; Kamwa, I. Online PMU-Based Wide-Area Damping Control for Multiple Inter-Area Modes. IEEE Trans. Smart Grid 2020, 11, 5451–5461. [Google Scholar] [CrossRef]
- Shi, X.; Ruan, G.; Lu, H.; Chen, H.; Cai, W.; Ron, H.; Chen, G.; Zhao, Y. Analysis of Ultra-Low Frequency Oscillation in Hydro-Dominant Power System and Suppression Strategy by GPSS. IEEE Trans. Ind. Appl. 2023, 59, 2796–2806. [Google Scholar] [CrossRef]
- Std 1547-2018; IEEE Standard for Interconnection and Interoperability of Distributed Energy Resources with Associated Electric Power Systems Interfaces. IEEE: Piscataway, NJ, USA, 2018.
Disclaimer/Publisher’s Note: The statements, opinions and data contained in all publications are solely those of the individual author(s) and contributor(s) and not of MDPI and/or the editor(s). MDPI and/or the editor(s) disclaim responsibility for any injury to people or property resulting from any ideas, methods, instructions or products referred to in the content. |
© 2023 by the authors. Licensee MDPI, Basel, Switzerland. This article is an open access article distributed under the terms and conditions of the Creative Commons Attribution (CC BY) license (https://creativecommons.org/licenses/by/4.0/).