Article

Investigating the Ignition and Stability Limits of Premixed Methane/Air Combustion in Micro-Channels

by
Almoutazbellah Kutkut
1,
Mohsen Ayoobi
2,
Marc E. Baumgardner
3 and
V’yacheslav Akkerman
1,*
1
Center for Innovation in Gas Research and Utilization (CIGRU), Department of Mechanical and Aerospace Engineering, West Virginia University, Morgantown, WV 26506, USA
2
Division of Engineering Technology, Wayne State University, Detroit, MI 48202, USA
3
Mechanical Engineering, Gonzaga University, Spokane, WA 99258, USA
*
Author to whom correspondence should be addressed.
Energies 2023, 16(18), 6752; https://doi.org/10.3390/en16186752
Submission received: 19 August 2023 / Revised: 11 September 2023 / Accepted: 14 September 2023 / Published: 21 September 2023

Abstract

:
Understanding and improving the performance of miniature devices powered by micro-combustion have been the focus of continued attention of researchers recently. The goal of the present work is to investigate the behavior of premixed methane–air combustion in a quartz microreactor with an externally controlled wall temperature. Specifically, the impacts of the flow inlet velocity, the equivalence ratio, and the microreactor channel size are examined. This study is conducted by means of computational simulations, and the results are validated against prior experimental data, as well as by other similar studies in the literature. Utilizing simulation results with detailed chemistry, the present work provides more in-depth insight into a variety of phenomena, such as ignition, flame propagation, flames with repetitive extinctions and ignitions (FREI), and flame stabilization. In particular, the ignition, the flame span, and the FREI-related characteristics are scrutinized to understand the underlying physics of the flame stability/instability modes. It is shown that the flames appear stable at higher inlet velocities, while the FREI mode is detected at a lower inlet velocity, depending on the equivalence ratio and the channel size. The findings also explain how different operating conditions impact the flame characteristics in both stability modes.

1. Introduction

Recent developments in micro-manufacturing technologies have dramatically accelerated the versatility of micro-electromechanical systems (MEMS), unmanned aerial vehicles (UAV), and communication and sensing gadgets. All these devices necessitate compact, long-lasting, and instantly rechargeable power supplies capable of delivering power in the range of 10−3~102 W [1,2]. Motivated by the significantly higher chemical energy densities of hydrocarbons as compared to most advanced batteries, microscale combustion research has been actively pursued in an effort to maximize the operational lifespan of these devices [3,4]. To be specific, current cutting-edge batteries have an energy density of 0.05~0.265 kWh/kg, which is ~1/60th (for the upper energy density limit) of that of typical hydrocarbon fuel, such as methane (CH4) [1,5]. Many physical and chemical processes impact micro-combustion systems; topics such as gas-phase phenomena, surface reactions, species transport, and thermal properties of the combustor material, as well as thermal and mass diffusion, convection, and radiation can all have a dramatic impact on a specific application [1,5,6,7,8].
In a micro- or mesoscale combustor, the combustion characteristics differ from those of a conventional “macro-combustor”, which is mostly attributed to the differences in the surface area per unit volume ratio, and the thrust–weight ratio [9]. A combustion process becomes slightly less efficient as compared to macro-combustors due to the heat losses from the flame region to the combustor wall. On the other hand, the resulting power–weight ratio is higher for the micro-combustion devices due to the inverse relation of the characteristic length scale and the thrust–weight ratio [10]. Because of the inherently small heat release rate of a micro-combustion system, the effects of heat and radical losses dominate the propagation characteristics of a premixed flame and, as such, directly impact the flame stability and quenching. The literature on premixed microchannel combustion distinguishes three main flame stability modes, depending on the inlet flow velocity, namely, (i) a stationary stable flame; (ii) a flame with repetitive extinctions and ignitions (FREI); and (iii) a weak flame [11,12]. Among them, stationary stable flames are commonly observed at higher inlet velocities. The restrained preheating of unburned reactants emphasizes the flame anchoring at a position where the local flame speed is balanced by the flow rate. Decreasing the flow rate results in further upstream propagation of the flame front and, eventually, flame extinction in relatively colder regions. Subsequent to this extinction, however, once the unburned mixture arrives at a high wall temperature region, it re-ignites and again propagates upstream, thus resulting in the FREI regime. Further reduction of the inlet velocity generates “slowly” propagating flames, different from the conventional stable flames defined previously. The developed flames are stabilized by the transverse heat transfer, in contrast to the stable flame regime. Although these flames do not behave in the same way as conventional flames, the term “weak flames” is widely used in the literature on microchannel reactors [4,13,14,15].
Previous analytical, experimental, and numerical studies focused primarily on the stable and weak flame modes for various fuel mixtures and under various operating conditions. These studies provided insight to understand the concepts of low-temperature ignition (LTI), cool flames, and the influence of the negative temperature coefficient (NTC) region [4,12,16,17,18,19,20,21]. It has been shown that cool flames are usually generated in the unburned fuel mixture region, while another conventional flame propagates through the reacting mixture. Such a phenomenon is referred to as autoignition-assisted flame propagation [22]. Pizza et al. [23] studied the dynamics of fuel-lean premixed hydrogen/air flames in microchannels using three-dimensional (3D) numerical simulations, and observed that various flame modes depend on the inlet flow velocity and the channel size. Similar behavior was also observed in the planar, two-dimensional (2D) simulations of the same group [24].
The FREI phenomenon has been investigated for a methane/air mixture in a series of works [18,25,26,27]. Miyata et al. [26] studied the unsteady behavior of the oscillating flames and the FREI for methane/air premixed combustion in microchannels. It was observed that the flame stability is directly affected by the total heat transfer rate, the wall temperature gradient, and the wall thickness. For example, the FREI amplitude and period are directly related to the thickness of the channel wall and the wall temperature gradient. Norton et al. [28] identified the optimal flow velocity, optimal wall thermal conductivity, and the optimal combustor dimensions to achieve stable methane/air flames. Furthermore, the behavior and the stability modes of methane/air flames in microchannels were studied experimentally by Di Stazio et al. [19] over a wide range of equivalence ratios and flow inlet velocities. Different flame regimes were detected, including stable, weak, and FREI flames. They performed a frequency analysis of the CH* signals to demonstrate the periodic nature of the FREI phenomenon and adopted the concept of the Strouhal number to characterize the effect of the equivalence ratio variations on the FREI frequency.
Aligned with the aforementioned studies, the literature would still benefit from more comprehensive examinations targeted at understanding and characterizing the underlying combustion physics related to flame stability in microchannels. In the present work, premixed CH4–air combustion in a microreactor is investigated numerically and validated experimentally. The main objective of this work is to scrutinize the combustion characteristics and flame behavior for various inlet velocities (0.1–0.6 m/s), equivalence ratios representing the fuel-lean ( ϕ = 0.6 ,   0.8 ), stoichiometric ( ϕ = 1 ), and fuel-rich ( ϕ = 1.2 ,   1.4 ) conditions, and channel diameters of 1.8 mm, 2.3 mm, and 3 mm, resulting in simulating a total of 34 unique cases with 2 to 5 days needed to complete each simulation using high-performance computers, depending on the operating conditions and the flame behavior. Varying these parameters, the flame can become stable or experience repeated extinctions and ignitions [11,21,29,30]. It is important to highlight that the models and the methods employed in this work have been accepted and acknowledged in the literature [24,27]. In the following sections, the simulation methodology is described. Then, the metrics, such as the ignition time, length, location, and the flame span, as well as the characteristics of the FREI are identified and studied for various operating conditions.

2. Methodology

2.1. Governing Equations

For a chemically reacting fluid, the governing equations describing, respectively, the balance of mass, momentum, species mass fractions, and energy, read
ρ t + · ρ u = 0 ,
t ρ u + · ρ u u = P + · τ ¯ + ρ g + F B ,
t ρ Ƴ i + · ρ u Ƴ i = · J i + R i ,
ρ C p T t + ρ C p u   T = q ρ i = 1 N C p , i Ƴ i V i i = 1 N h i Ω i .
Here, ρ is the fluid density; u is the flow velocity vector; P is the static pressure; τ ¯ is the viscus stress tensor; g and F B are the acceleration vectors associated with gravity and the external body force, respectively; C p is the specific heat at constant pressure; q is the heat flux vector; and R i is the rate of production in the chemical reactions for the i t h species, with N being the total number of species. It should be noted that gravity and other external body forces of Equation (2) are neglected in this work. The mass fraction of each species Ƴ i is obtained by solving the diffusion equation for the i t h species, while h i ,   Ω i , and V i are the specific enthalpy, the net production rate, and the diffusion velocity, respectively, and J i stands for the diffusion flux of the i t h species caused by the gradients of the temperature and the species concentration; it is given by Fick’s law of diffusion with respect to the concentration gradient:
J i = ρ D i , m   Ƴ i D T , i T T ,
where D i , m is the mass diffusion coefficient of the i th species, while D T , i is the thermal diffusion coefficient. The numerical simulations were carried out by means of the commercial computational fluid dynamics (CFD) package Ansys FLUENT [31]. The simulation setup parameters are listed in Table 1.

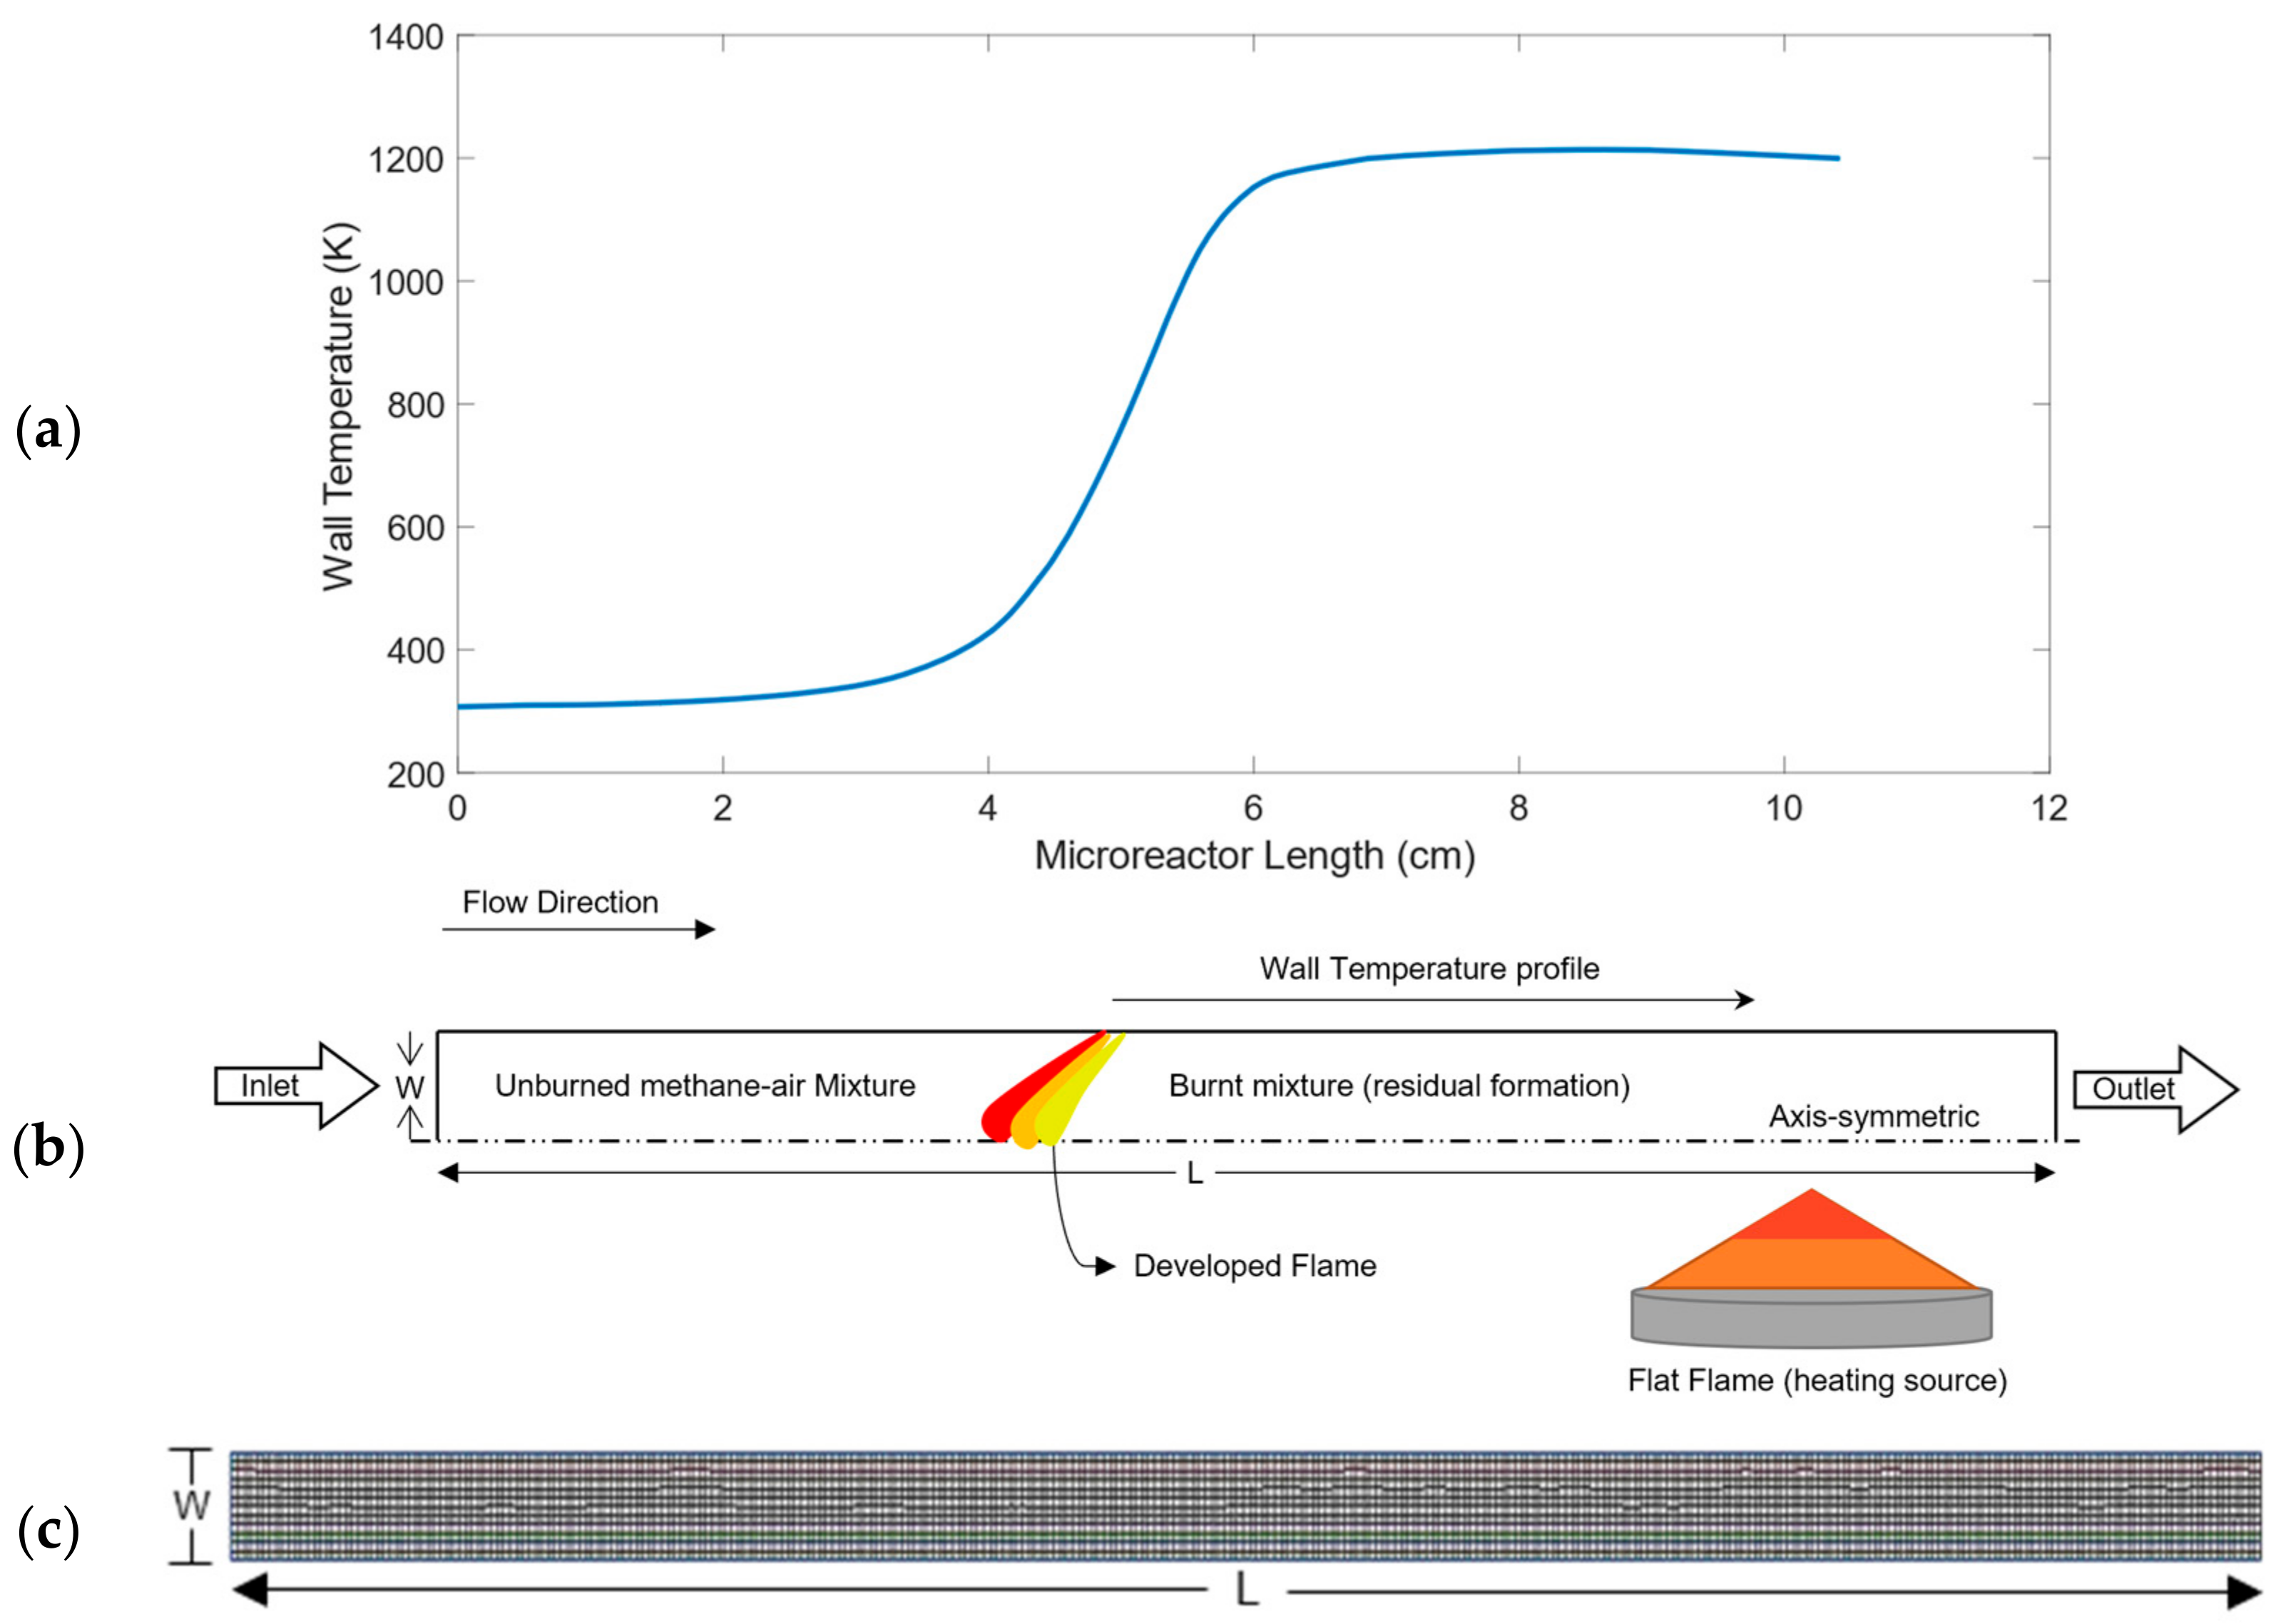
2.2. Operating Conditions

A 2D axisymmetric computational domain represents a micro-channel of length 10.75 cm and a radius (half-width) of 1.15 mm, as illustrated in Figure 1. In addition, Table 2 provides a summary of all the simulated cases showing the chosen inlet velocities, the mixture regime (lean/rich/stoichiometric), and the equivalence ratios for a channel width of 2.3 mm.
The 2D geometry was chosen for the following reasons: (i) considering the simulation time and the number of cases to be simulated, it would be extremely challenging to perform all the simulations using a 3D domain; (ii) although 3D simulations could provide more refined results and additional details, 2D results nevertheless provide solid and sufficient understanding of the primary combustion stages, especially for our case, where the flow in the channel has a 2D nature, i.e., exhibits a significantly axisymmetric behavior; (iii) due to the laminarity of the flow, the standard approach for such applications is 2D modelling, as used to be recognized and accepted in the literature [24,27]. Furthermore, in order to save time and computational resources, half of the tube was simulated by employing the axisymmetric boundary condition at the lower side of the computational domain.
The inlet and outlet extremes of the channel are open, and a temperature profile was imposed as a wall boundary condition similar to the experimental wall temperature measured by Baumgardner [33]. The wall temperature increased from 305 K at the inlet to around 1200 K at the outlet, and was externally controlled by a McKenna-style, flat-flame burner fueled by a H2–air mixture. Such a configuration ensured the auto-ignition of the CH4–air mixture in the microchannel. The fuel–air mixture entered the tube at a constant temperature (extracted from the temperature profile mentioned earlier), along with a no-slip boundary condition at the wall, with a uniform inlet velocity value. A square mesh of 0.1 mm in size (as shown in Figure 1c) and a time step of 10 µs were used for all the simulated cases. Preliminary trials in the setup of the model utilized herein showed that such a time step is sufficient in producing accurate simulation results that successfully predict the ignition characteristics. Additionally, this time step has been shown in the literature to be sufficiently small for capturing the microscale combustion phenomena, including the ones of interest in this study [27,34]. Furthermore, with the flame thickness being of the order of 1 mm, the chosen grid size ensured that the flame characteristics were resolved sufficiently within circa 15 cells. The grid resolution and its sufficiency to capture the flame details will be discussed in Section 2.3. The chemical kinetics were modelled by the San Diego mechanism with 46 species and 235 reactions [32], which is sufficient to describe the laminar flame dynamics at the microscale level and is able to successfully depict the ignition characteristics [35]. Table 3 summarizes all the species mass fractions at the inlet for the simulated cases.

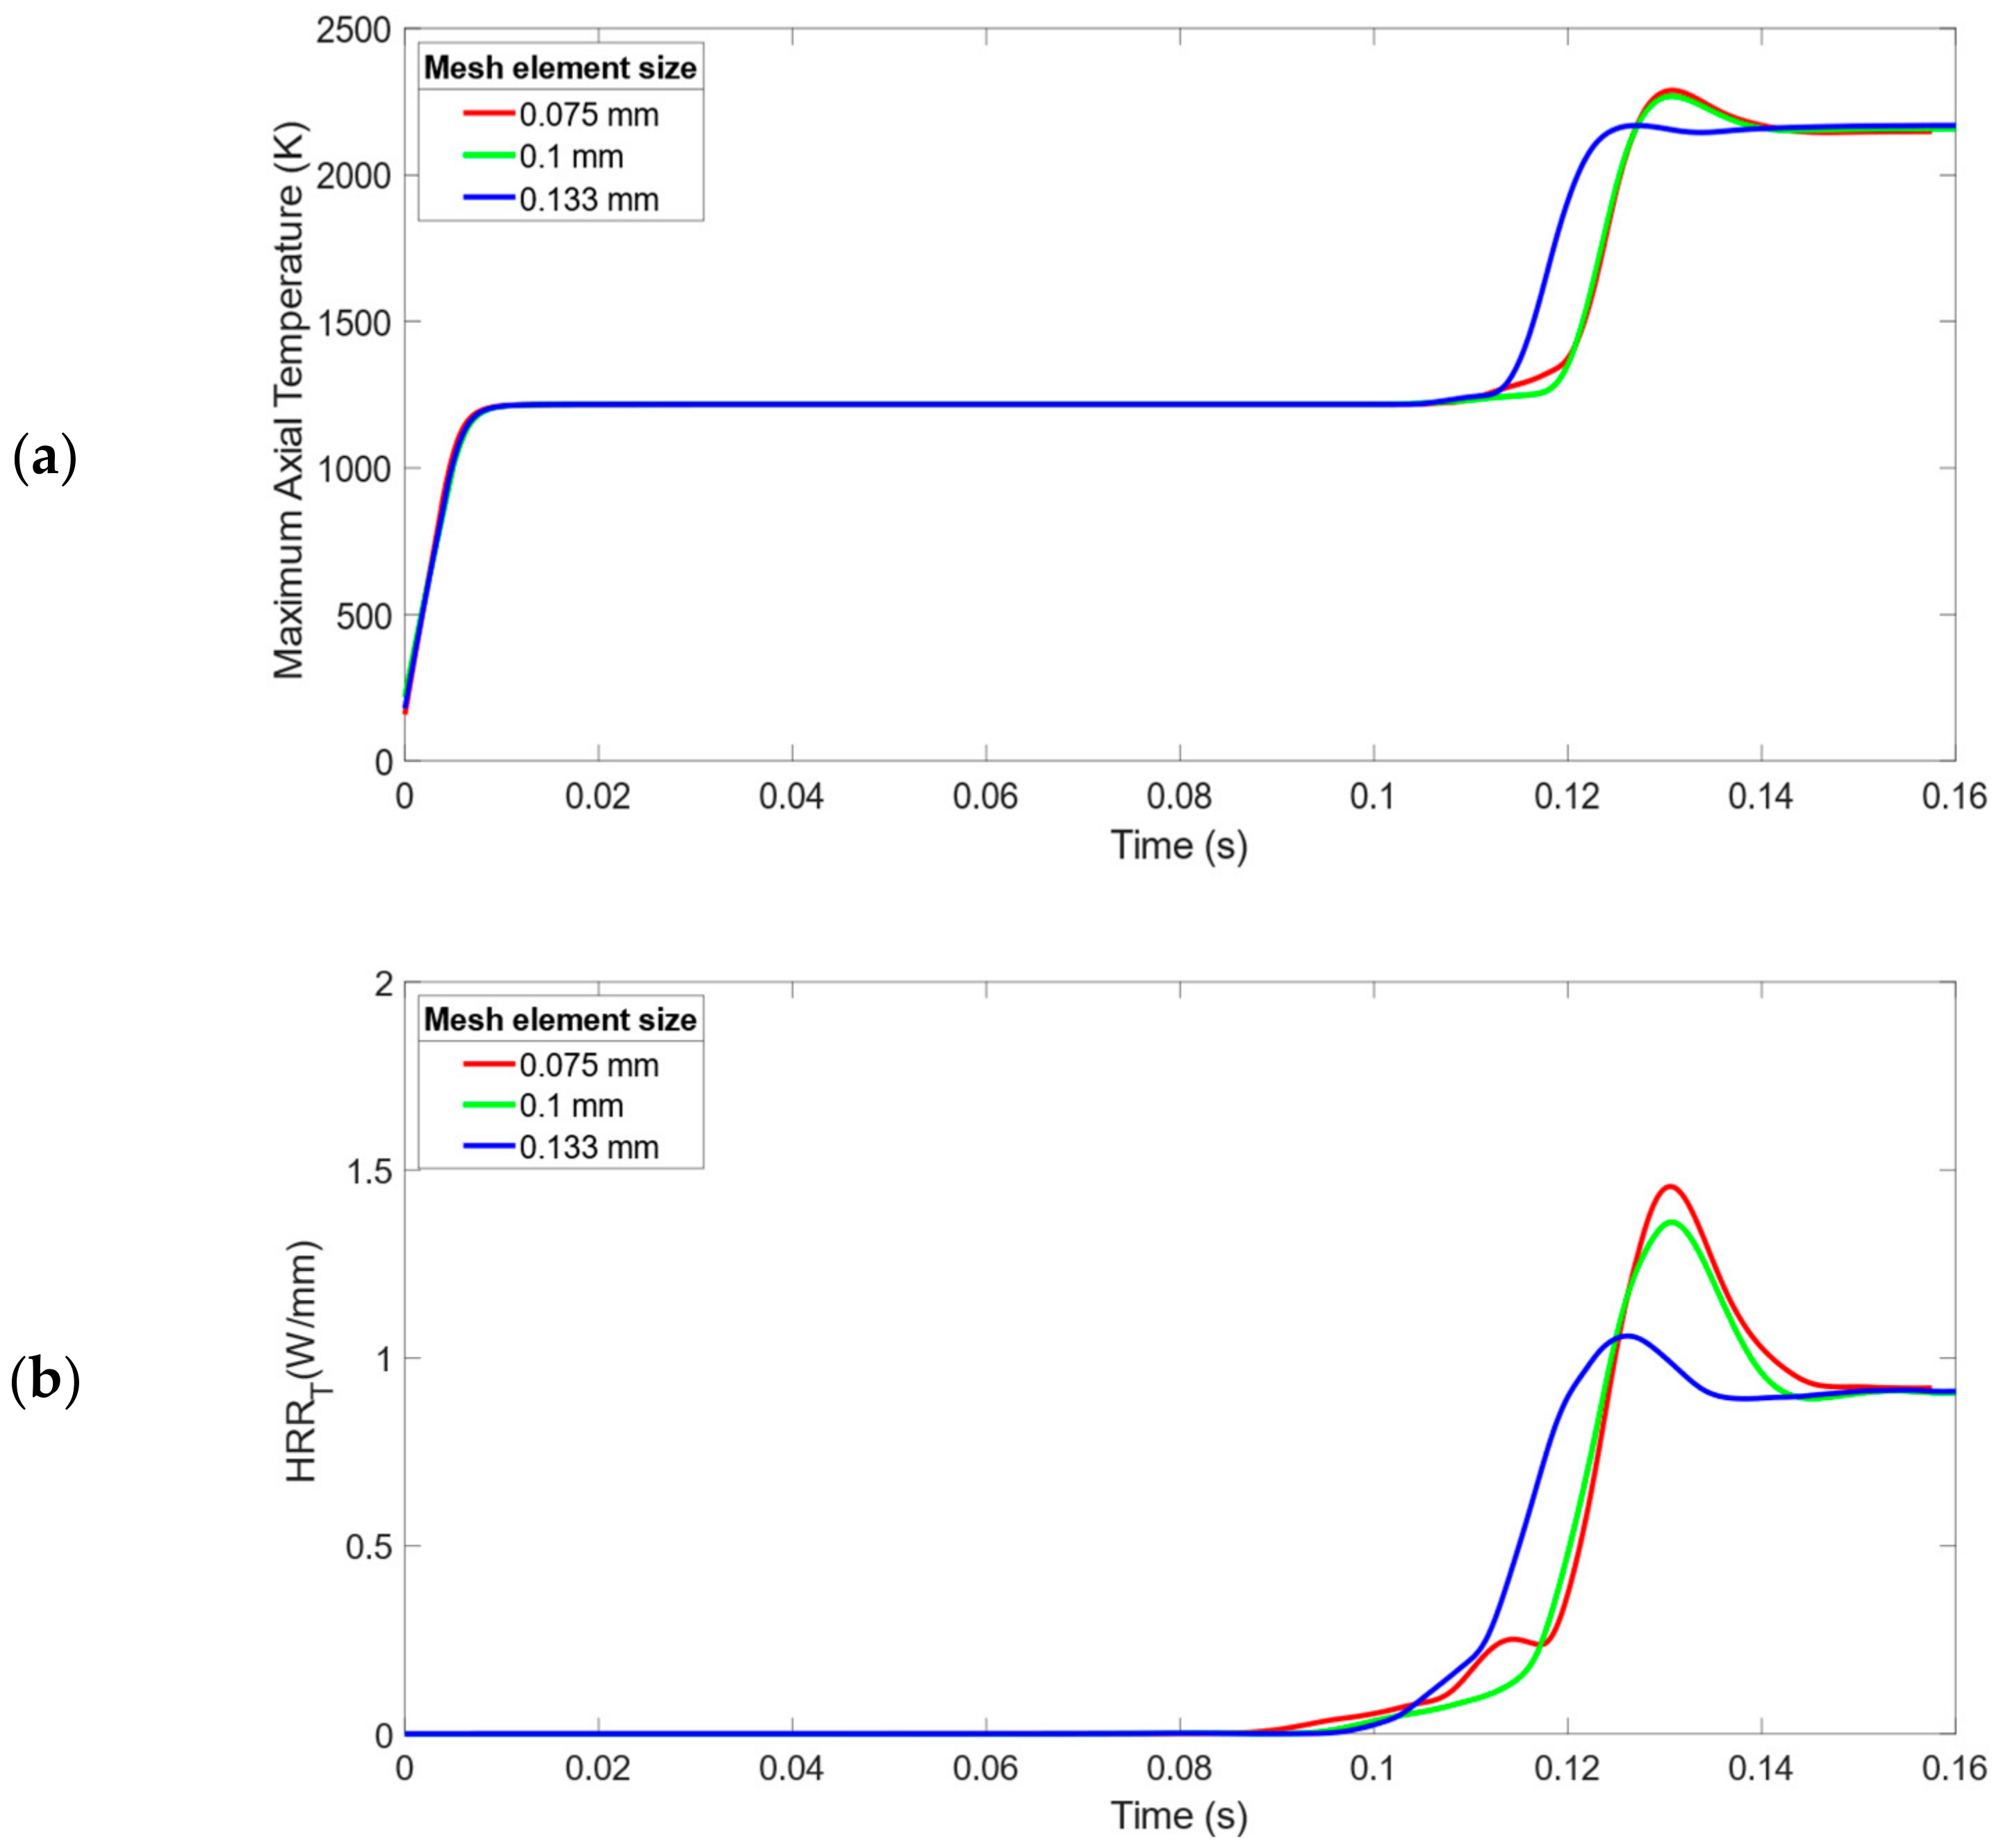
2.3. Grid Independence Test

The computational domain was segregated into evenly sized square mesh elements, with three different grid sizes employed, namely, 0.075 mm (fine), 0.1 mm (moderate), and 0.133 mm (coarse). To compare the performance of these meshes, the maximum axial temperature and the total heat release rate (HRRT) were monitored over a specific time, as shown in Figure 2. Here, HRRT was computed numerically by integrating the heat release rate for all the chemical reactions over the computational domain at each time step. When this property peaks, it indicates the ignition and then the formation of a flame front. As depicted in Figure 2, the temperature for the three cases was identical from the starting point of the heating process until the mixture moved into the ignition phase; however, variations in the peak temperature were observable thereafter, especially for the coarse mesh. Nevertheless, the other two cases (the moderate and fine meshes) agree well, with almost the same ignition times and maximum temperatures. In a similar way, the HRRT curves experienced a noticeable deviation upon varying the grid size. This is especially profound when approaching the ignition time, where the properties experience the highest gradients. The coarse mesh failed to predict the ignition time and the peak reaction rate, as well as the other two cases, whereas satisfactory agreement is seen between the moderate and fine meshes. It is noted that the HRRT data were quite noisy; therefore, smoothing it was necessary to avoid any misleading data representation. Because of that, slight deviations produced by such a process are inevitable, especially where high noisiness points were detected; however, the time at which the peak of HRRT occurred (indicating the ignition time, which is of significant importance in this comparison) was the same for both the 0.1 mm and 0.075 mm meshes. Recognizing the fact that the simulation time and required memory almost doubled as the mesh size was reduced from 0.1 to 0.075 mm, and accounting for the number of cases simulated in this work, the moderate mesh, 0.1 mm, was chosen for all the remaining simulation runs. It is noted that, in terms of the flame behavior, the simulation results are comparable with those found throughout the literature [19,29,33].

2.4. Metrics

The purpose of this section is to describe the metrics that were defined to characterize and analyze the ignition and flame properties under various operating conditions.

2.4.1. Ignition Metrics: Time, Location, and Span

The ignition process was identified by tracking the time evolution of the transient maximum axial temperature, T a x i a l m a x , obtained from the numerical simulation. As the mixture was heated through the walls, the chain-branching chemical reactions were initiated and eventually triggered ignition, thereby resulting in a V-shape flame front. Figure 3 further demonstrates the pre-ignition, ignition, and post-ignition features of a stable flame. Here, point (b) indicates the ignition with the peak temperature gradient. Figure 4 complements Figure 3 with the temperature contours to visualize the ignition process.
In particular, the chain-branching reactions started at instant (a), as the fuel/air mixture was preheated, and went through time (b), thereby indicating the beginning of the ignition process. At instant (b), the maximum axial temperature experienced the highest gradient, where the flame front was formed, thus separating the unburnt and burnt gases.
State (b) determined the ignition time t i g and the ignition span; see Figure 5. Moving forward from instant (b) to instants (c), (d), and (e) in Figure 3 and Figure 4, the flame started propagating upstream until it either became stable or was extinguished, depending on the operating conditions, which are discussed in the next sections. The ignition time, t i g , is defined as the time associated with the maximum gradient of the quantity T a x i a l m a x :
t i g = t d T a x i a l m a x d t m a x .
Similarly, the extinction time (if any) is defined as the time associated with the minimum gradient (maximum negative) of the quantity T a x i a l m a x :
t e x = t d T a x i a l m a x d t m i n .
It is worth mentioning that the extinction time parameter is defined and utilized only when the flame is not stable and there is an extinction; therefore, an additional parameter is introduced to describe the time instant at which the flame is stabilized and has a fixed location and span for the remainder of the simulation time:
t s t = t d T a x i a l m a x d t = 0 .
Moreover, the ignition span was also examined to fully describe the ignition process. Using the axial temperature variation at the ignition time, the ignition span is defined as the location bounded by the peak positive temperature gradient,   x i g s t , and the peak negative temperature gradient, x i g e . The ignition span, Δ x i g , is then defined as the distance between these two locations (see Figure 5):
x i g s t = x d T d x m a x ; t = t i g ,
x i g e = x d T d x m i n ; t = t i g ,
Δ x i g = x i g s t x i g e .
It should be noted that using HRRT for the ignition phenomenon analyses is a more common approach in the literature than using the axial temperature [18,22,28,34,36]; however, in the present work, the HRRT data were not directly implemented, as they typically produce noisy curves, which cannot be utilized to define such time-sensitive properties. Such noise is primarily attributed to the numerical artifacts resulting from the computational analysis; therefore, a smoothened HRRT data trace was plotted against the axial temperature to validate our approach and to make sure that the axial temperature data are technically supported and can be used as a metric to predict the ignition properties and the flame characteristics. Figure 6 illustrates the comparison between these metrics. It can be seen that both curves had almost the same rate of change around the ignition time, and they concurred at the maximum point detected. In addition, both metrics demonstrate a comparable stabilized flame time, where both curves settle down to steady behavior, ultimately indicating the stable flame regime, as will be discussed further in Section 2.4.2.
Moreover, to verify the reliability and functionality of the axial temperature metric, as well as its sufficiency to predict the ignition properties, the mass fraction of the CH radicals was monitored along with the axial temperature at the same points that have been defined earlier in Figure 3. Figure 7a shows both the axial temperature and the CH mass fraction at the time of ignition for an inlet velocity of 0.4 m/s; here, it is important to note that the location of the flame on the contour plots is clearly correlated to the formation of CH radicals. The highest CH concentrations were located at the upstream flame side, where the reaction occurred at the unburned fuel/air mixture region. In addition, as shown in Figure 7b, the maximum temperature gradient coincided with the location of highest concentration of the CH radical, which indicates the ignition location. These results demonstrate that the axial temperature data can provide the required accuracy to describe the ignition phenomena herein.

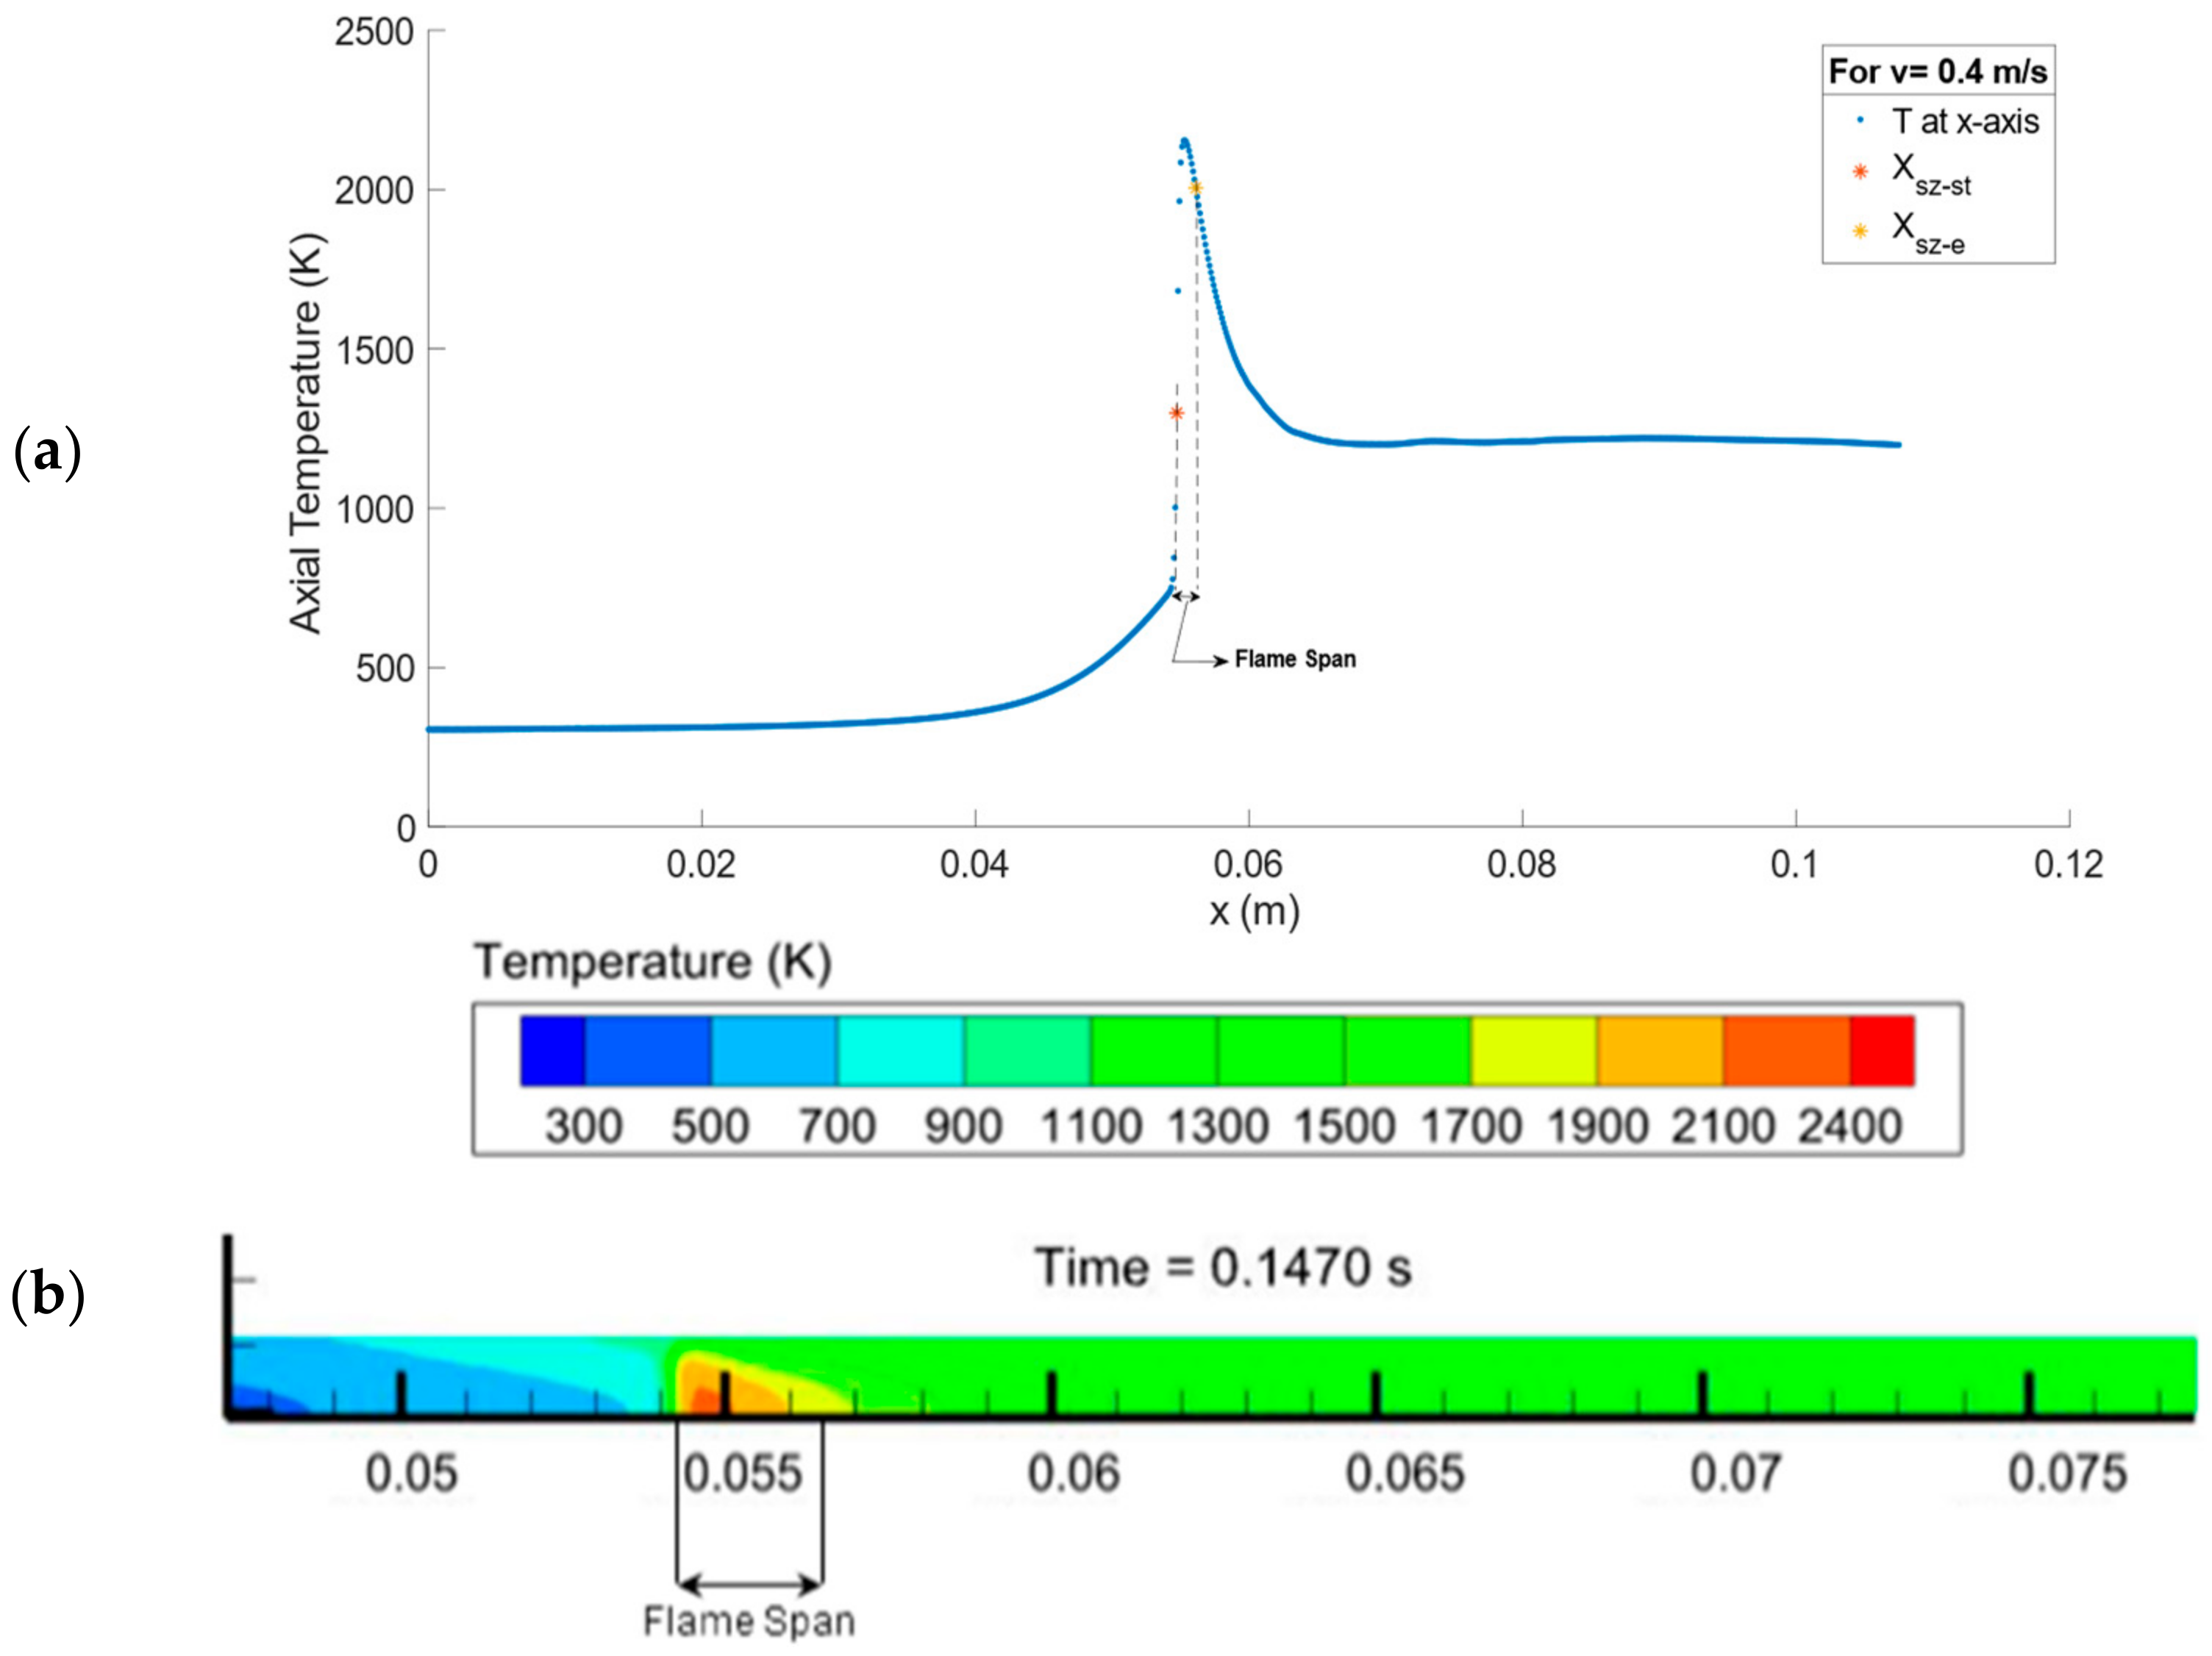
2.4.2. Stable Flame Metrics: Location and Span

In the event of a stable mode, the flame propagated further upstream and sustained its shape, behavior, and location, starting from point (e) in Figure 3. Similar to the ignition process, the stable flame was also characterized by its location and span. Using the axial temperature profile at time instant t s t , the maximum and minimum temperature gradients were determined to mark the two extremes of the stable flame:
x s z s t = x d T d x m a x ; t = t s t ,
x s z e = x d T d x m i n ; t = t s t .
Here, x s z s t indicates the start of the flame span, while x s z e stands for the ending point of the flame span; see Figure 8. In addition, the span of the stabilized flame is defined as the difference between these points:
Δ x s z = x s z s t x s z e .

2.4.3. FREI Metrics: Length, Period, Frequency, Ignition-to-Extinction Time, and Extinction-to-Ignition Time

In the event of FREI, the flame could not sustain itself due to unrestrained heat loss through the microreactor wall; however, after the flame extinguished, the supply of the fresh fuel–air mixture eventually reached the high-temperature zone downstream of the channel and ignited again. Such phenomenon is detected numerically and experimentally in the literature [27,28,29,34]. To better comprehend the FREI phenomena, a specific case with an inlet velocity of 0.2 m/s is presented in this section. Specifically, Figure 9 shows variations of the maximum axial temperature during the combustion process, while Figure 10 presents the spatial temperature contours corresponding to the selective time steps in Figure 9. The ignition process was exactly the same as that for the stable flame; however, in a FREI mode, as the flame front formed and propagated upstream, it started to diminish after point (d) until flame extinction occurred just before point (e). Due to the uninterrupted fuel–air feeding source, the mixture ignited again, and the process occurred repeatedly, as clarified in the rest of the points; see positions (f)–(h) in Figure 9 and Figure 10.
It has historically been a challenge to characterize the FREI by means of simple parameters due to the intriguing behavior of flames under such circumstances. For example, the cycle-to-cycle variations will notably influence the simulation results. In the present work, several parameters were considered simultaneously to allow for a more comprehensive characterization, as follows:
  • The FREI length: defined as the distance the flame travels along the channel before extinction;
  • The FREI period (τFREI) defined as the time duration required for a flame to attain two successive ignition events [34];
  • The FREI frequency: the reciprocal of the FREI period (τFREI)
  • The ignition-to-extinction time: defined as the time duration from the ignition time to the extinction time in the same FREI cycle [22];
  • The extinction-to-ignition time: defined as the time duration from the extinction time to the ignition time of the subsequent cycle [22].

3. Results

In this section, first, the numerical results are validated by means of the experimental observations. Then, the impacts of the inlet velocity, the equivalence ratio ϕ , and the channel width on the flame behavior and the metrics, defined in the previous section, are scrutinized.

3.1. Comparison with Experimental Observations

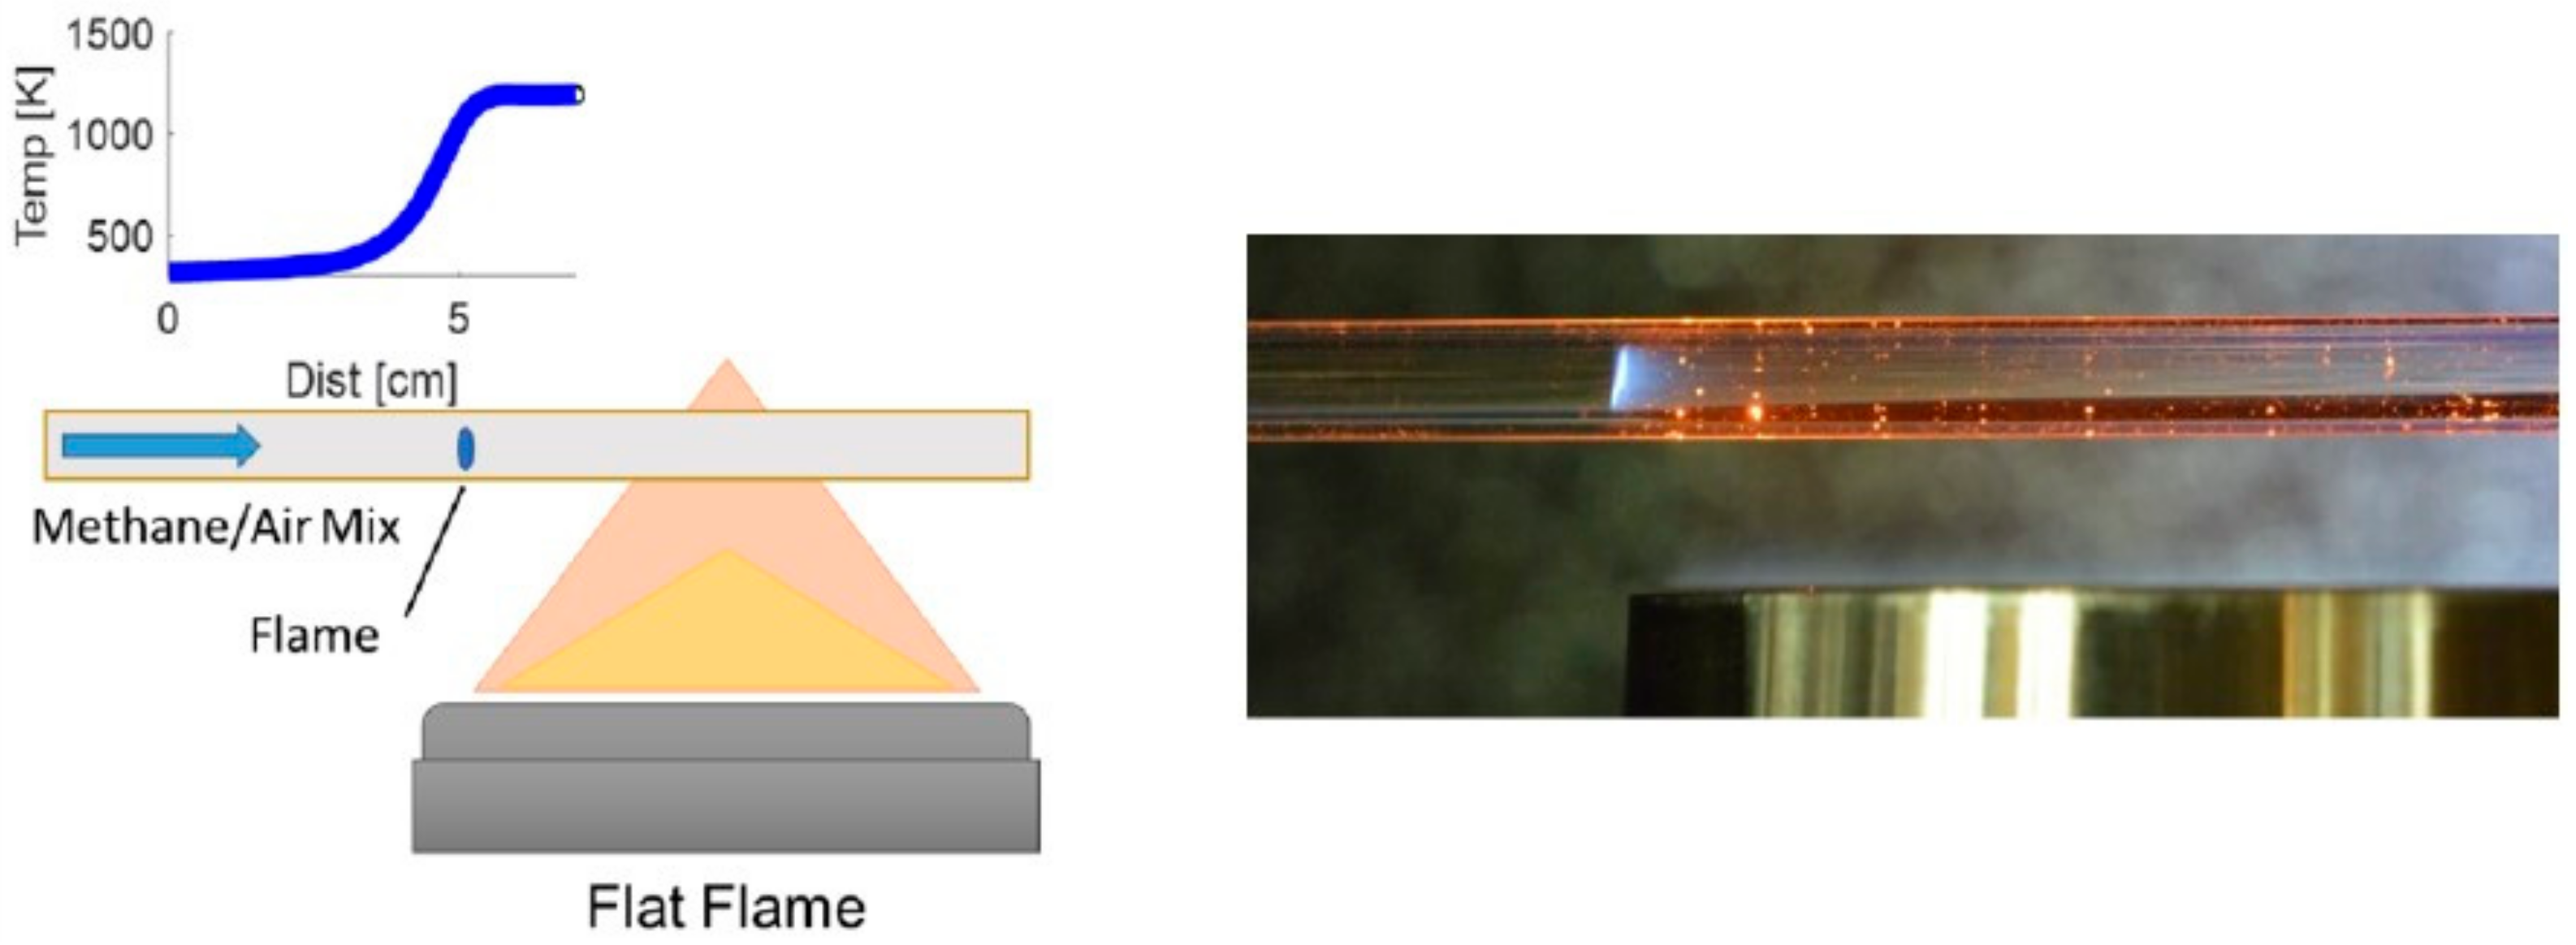
3.1.1. Experimental Work Overview

The computational study of the present work is validated by an earlier experimental method [33], where an optically accessible microreactor with a controlled temperature profile was used in order to explore stoichiometric fuel/air mixtures of methane and other hydrocarbons, under velocities ranging from 0.2 m/s to 0.6 m/s. In this experimental work, two main flame modes were observed: (a) stable flames at higher inlet velocities and (b) unstable flames (FREI) at lower inlet velocities. The experimental arrangement is shown in Figure 11, in which the premixed fuel/air mixture flowed through a 2.3 mm diameter quartz tube, heated by a McKenna-style flat burner. The CH* chemiluminescence data were utilized to detect the flame positions, where the CH* signals were captured via long exposure images (with an associated optical filter). A CH* chemiluminescence profile for the FREI flame indicating the extinction and ignition limits was used to compare the numerical results with those of the experiment via the so-called FREI length metric. The maximum axial temperature, the local heat release rate (HRRaxial) at the ignition and extinction points, and the temperature contours for one FREI cycle represent such a comparative approach, as detailed in Section 3.1.2 and Section 3.1.3.

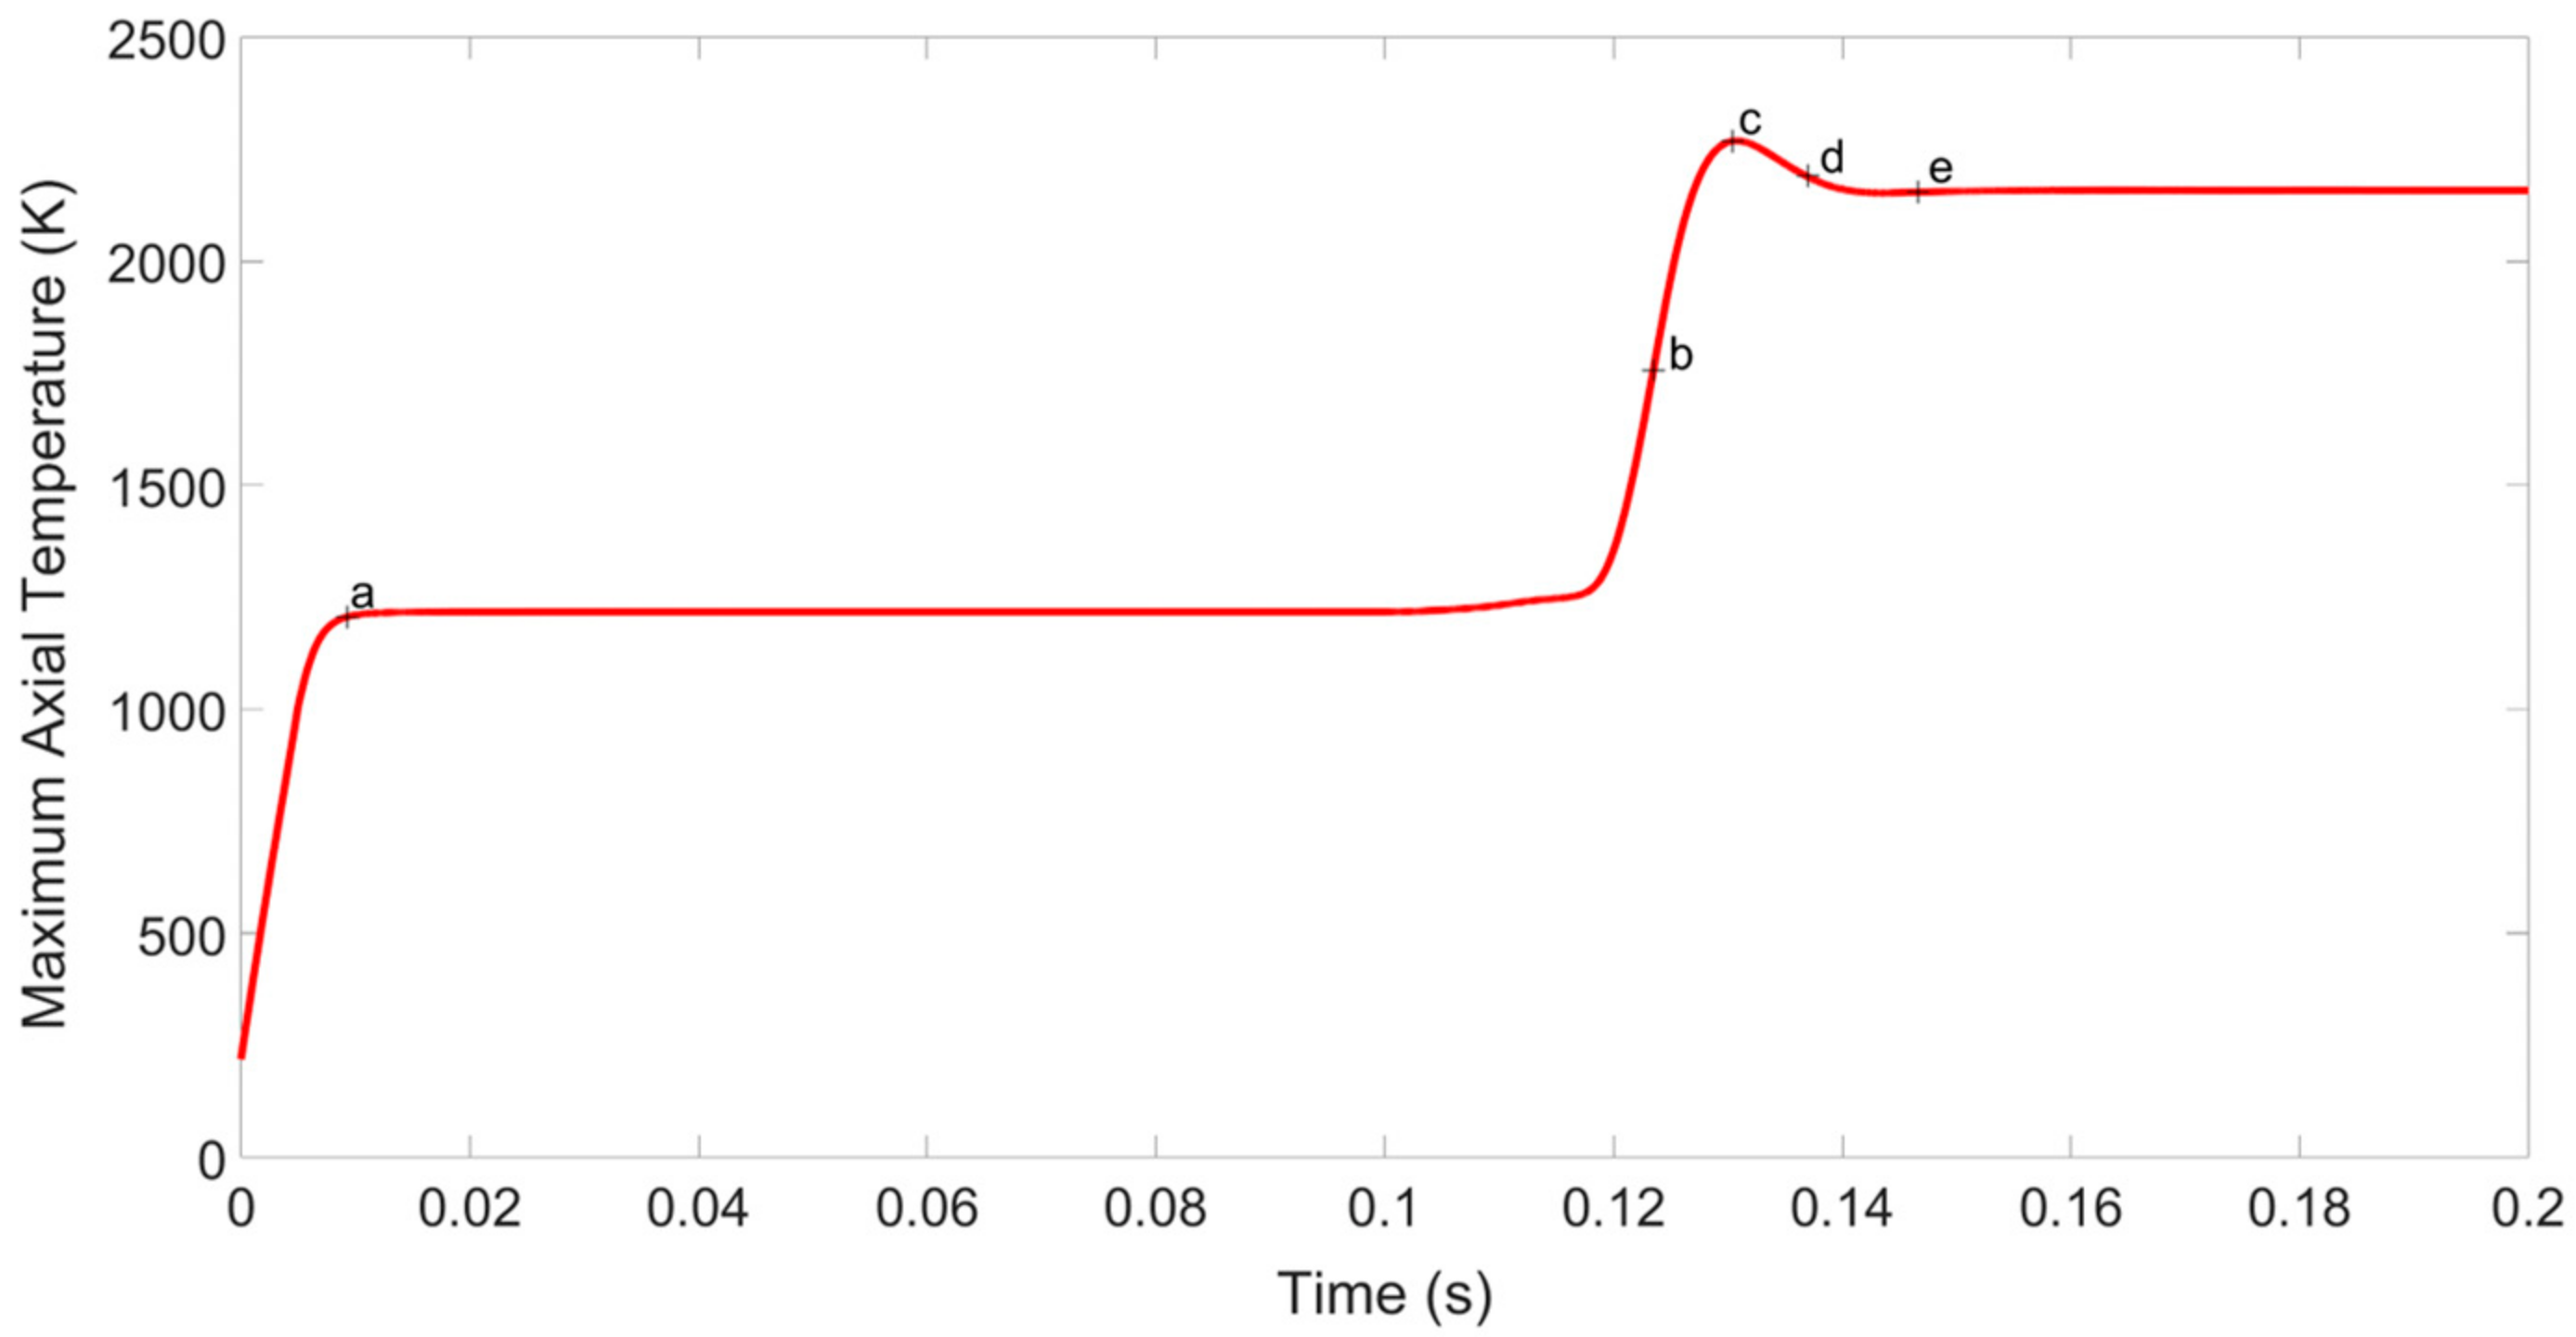
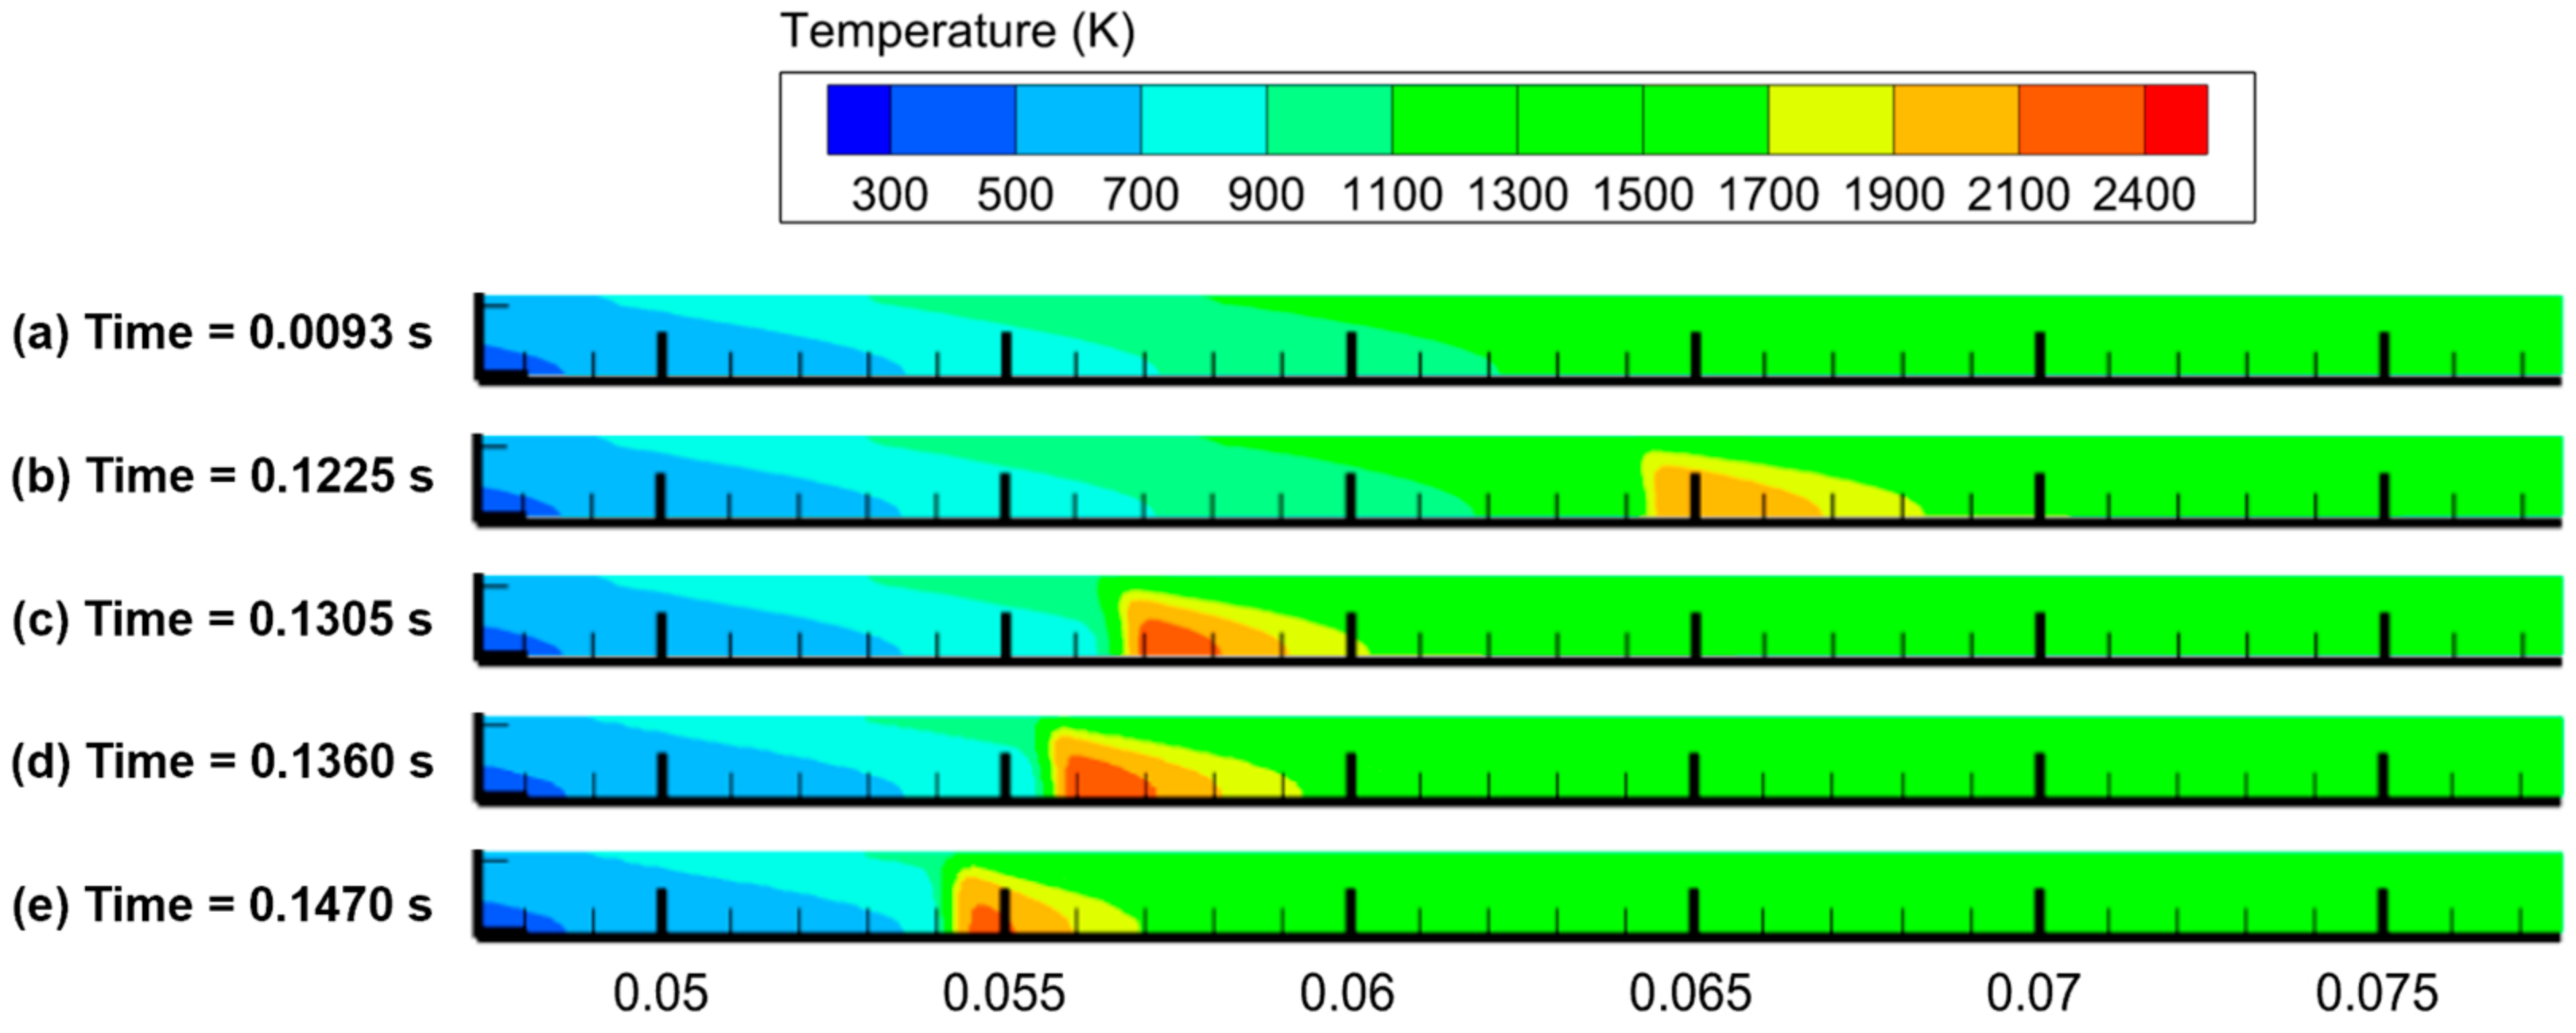
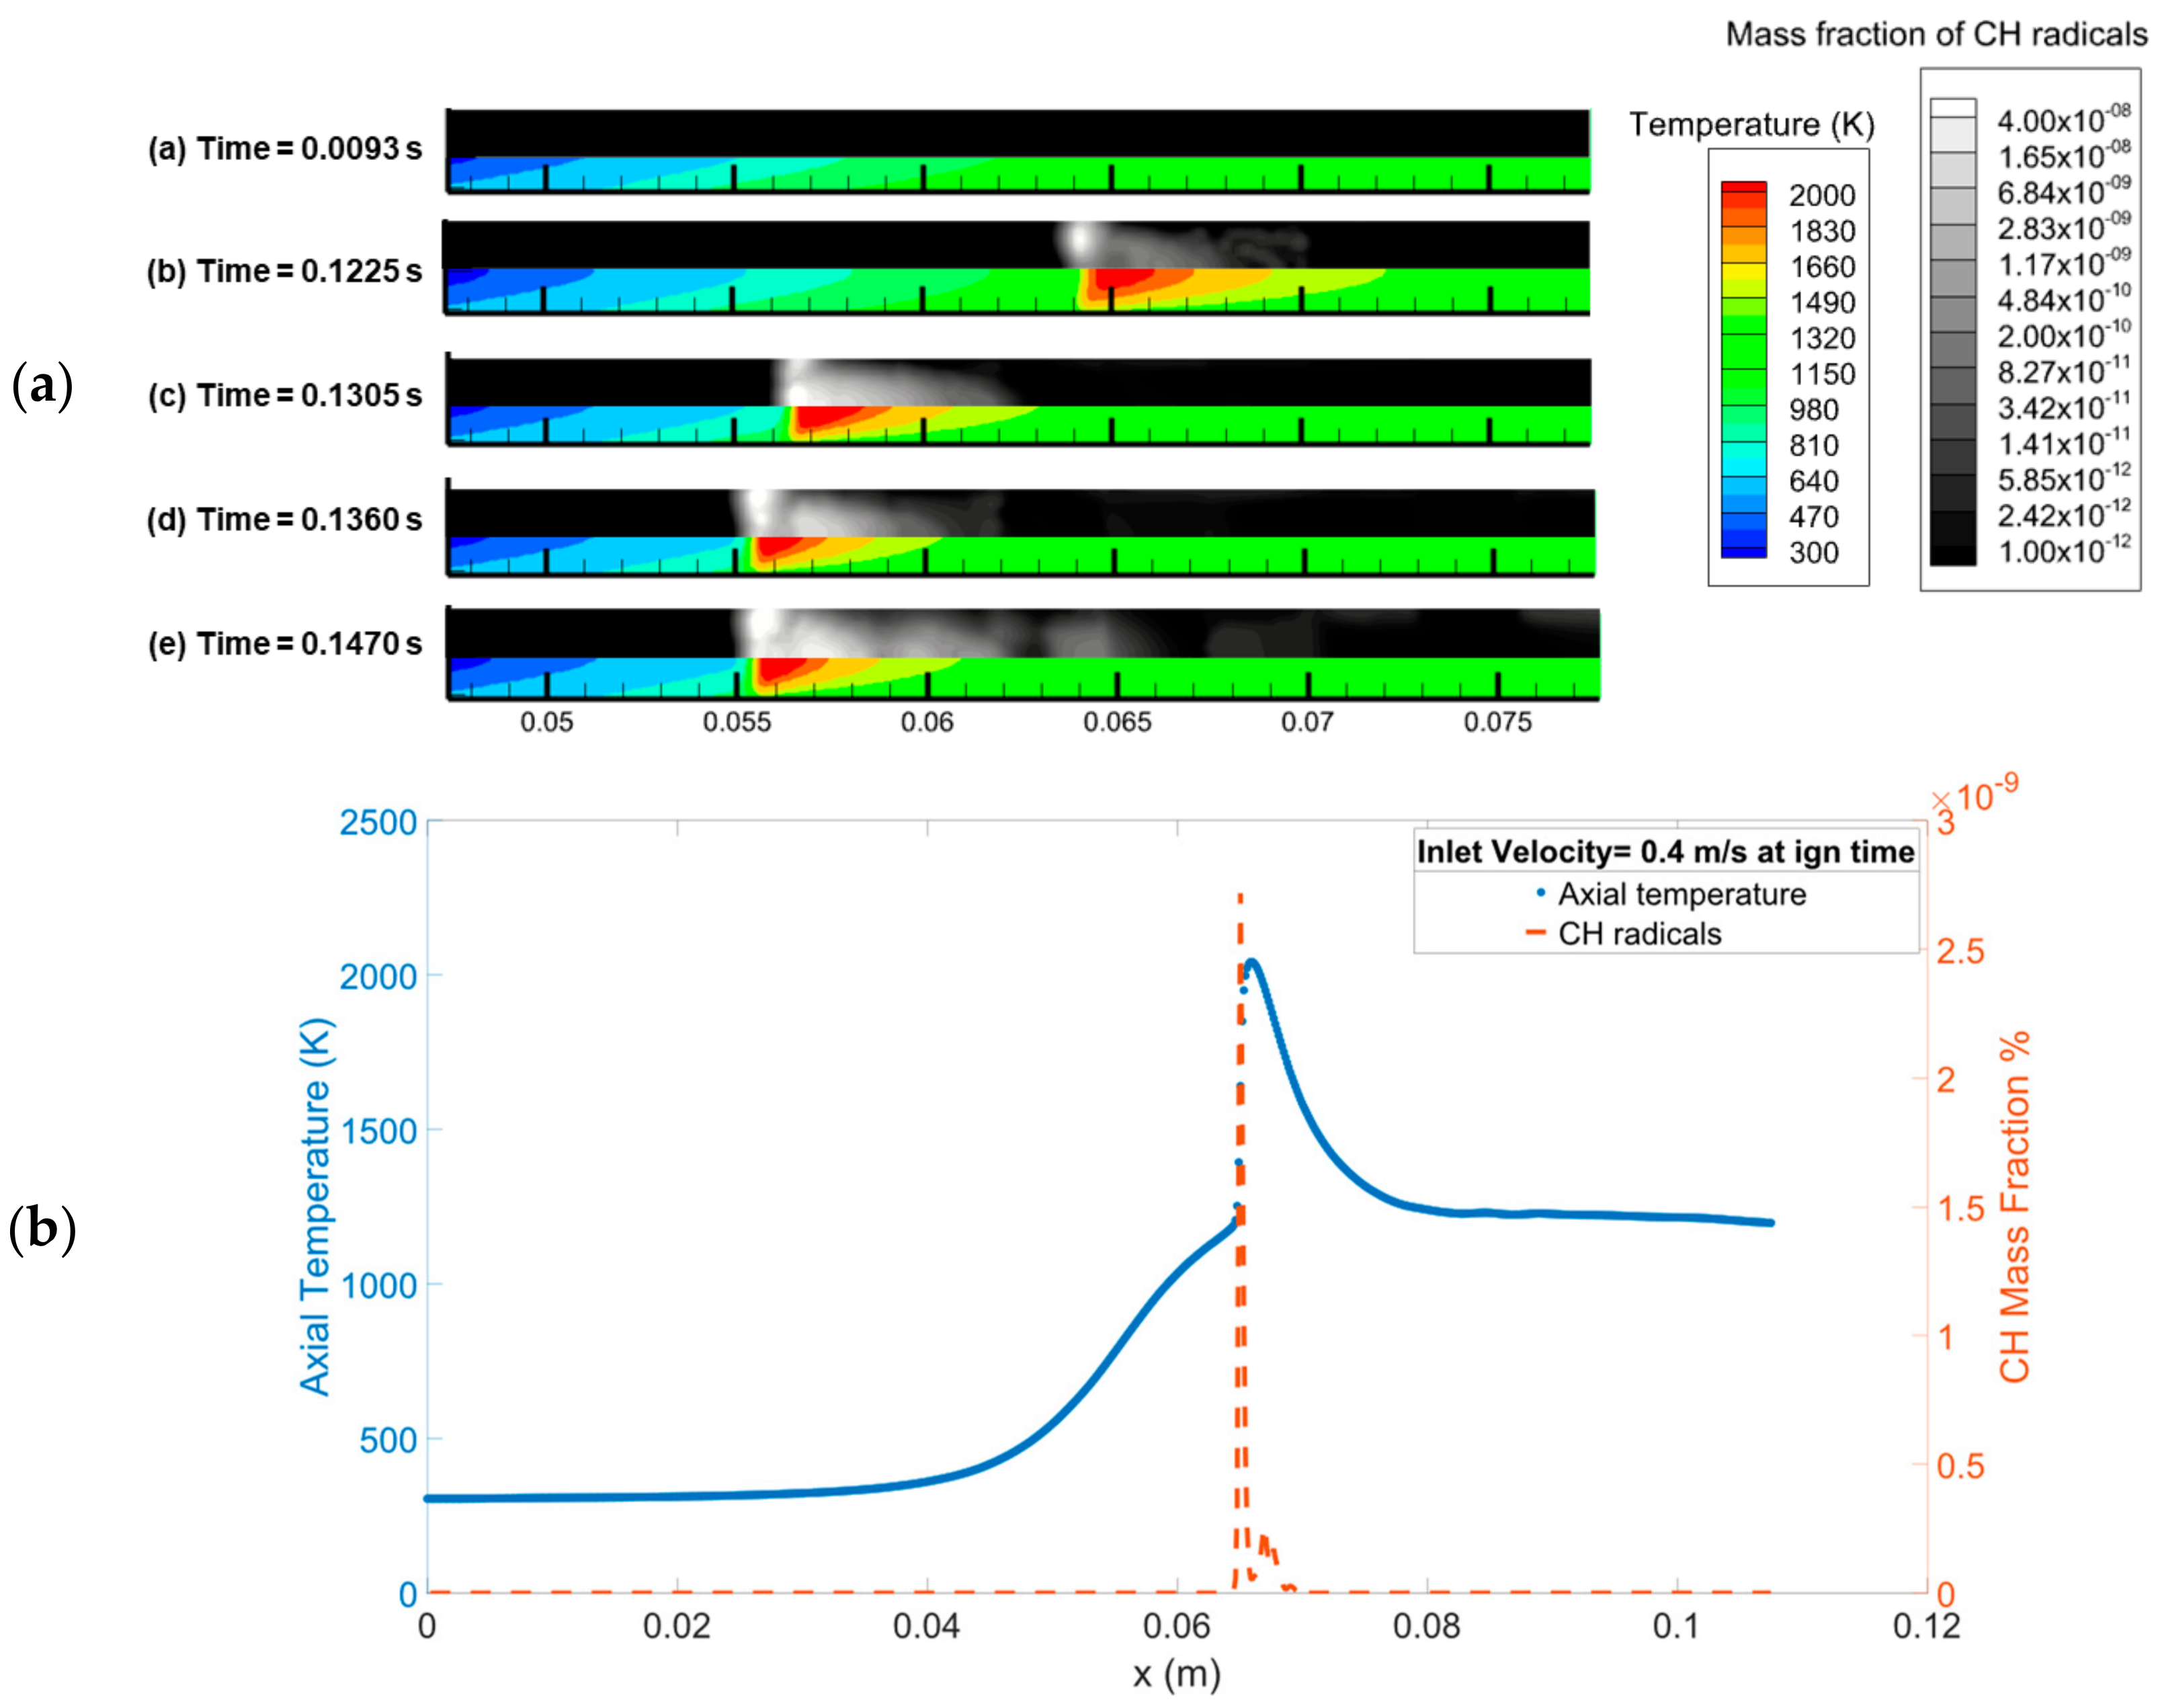
3.1.2. Comparison with Experimental Work: Axial Temperature

Figure 12 constitutes the processed image of CH* chemiluminescence extracted from the experiments [33], along with the temperature contours obtained from the simulation data for one FREI cycle at the same operating conditions. The maximum axial temperature plots for the corresponding time instants in the contour plots were also added to this figure for a more comprehensive comparison. As defined earlier, the maximum and the minimum gradient points for each plot explicated the span of the respective flame at that specific time instant. The experimental FREI length of 26 mm appears to be in excellent agreement with its numerical counterpart of 25.6 mm. Furthermore, the phenomenon of a double flame front was also detected in the first three instants (a–c). This double flame front occurs when a strong flame propagates upstream and a second, weaker flame also appears and travels further downstream. The double flame front was not readily visible in the methane experimental studies, but was clearly visible from the simulation, thus highlighting the essential role of the simulations in complementing the experimental observations. Such phenomenon was also explored numerically for a methane–air mixture by Nakamura et al. [18] and experimentally for a propane–air mixture by Baumgardner et al. [37]; however, this phenomenon is not the focus of this study, as it requires more simulations and post-processing.
On the other hand, there was an evident deviation for the FREI location, i.e., the experimental FREI location is slightly further downstream as compared to the numerical one. This difference can be attributed to two primary observations. First, the method of defining the ignition and extinction points when post-processing the numerical simulation results is slightly different than what was used in the experimental work; the FREI location and length were detected experimentally by means of the chemiluminescence profile of the CH* radicals. This is unlike the present numerical approach utilizing the maximum axial temperature data. Second, there are inherent uncertainties in detecting the FREI location in the experimental setup, as for such a small-scale work environment, slight variations in the ambient conditions could potentially influence the readings and the outputs of the experiment.

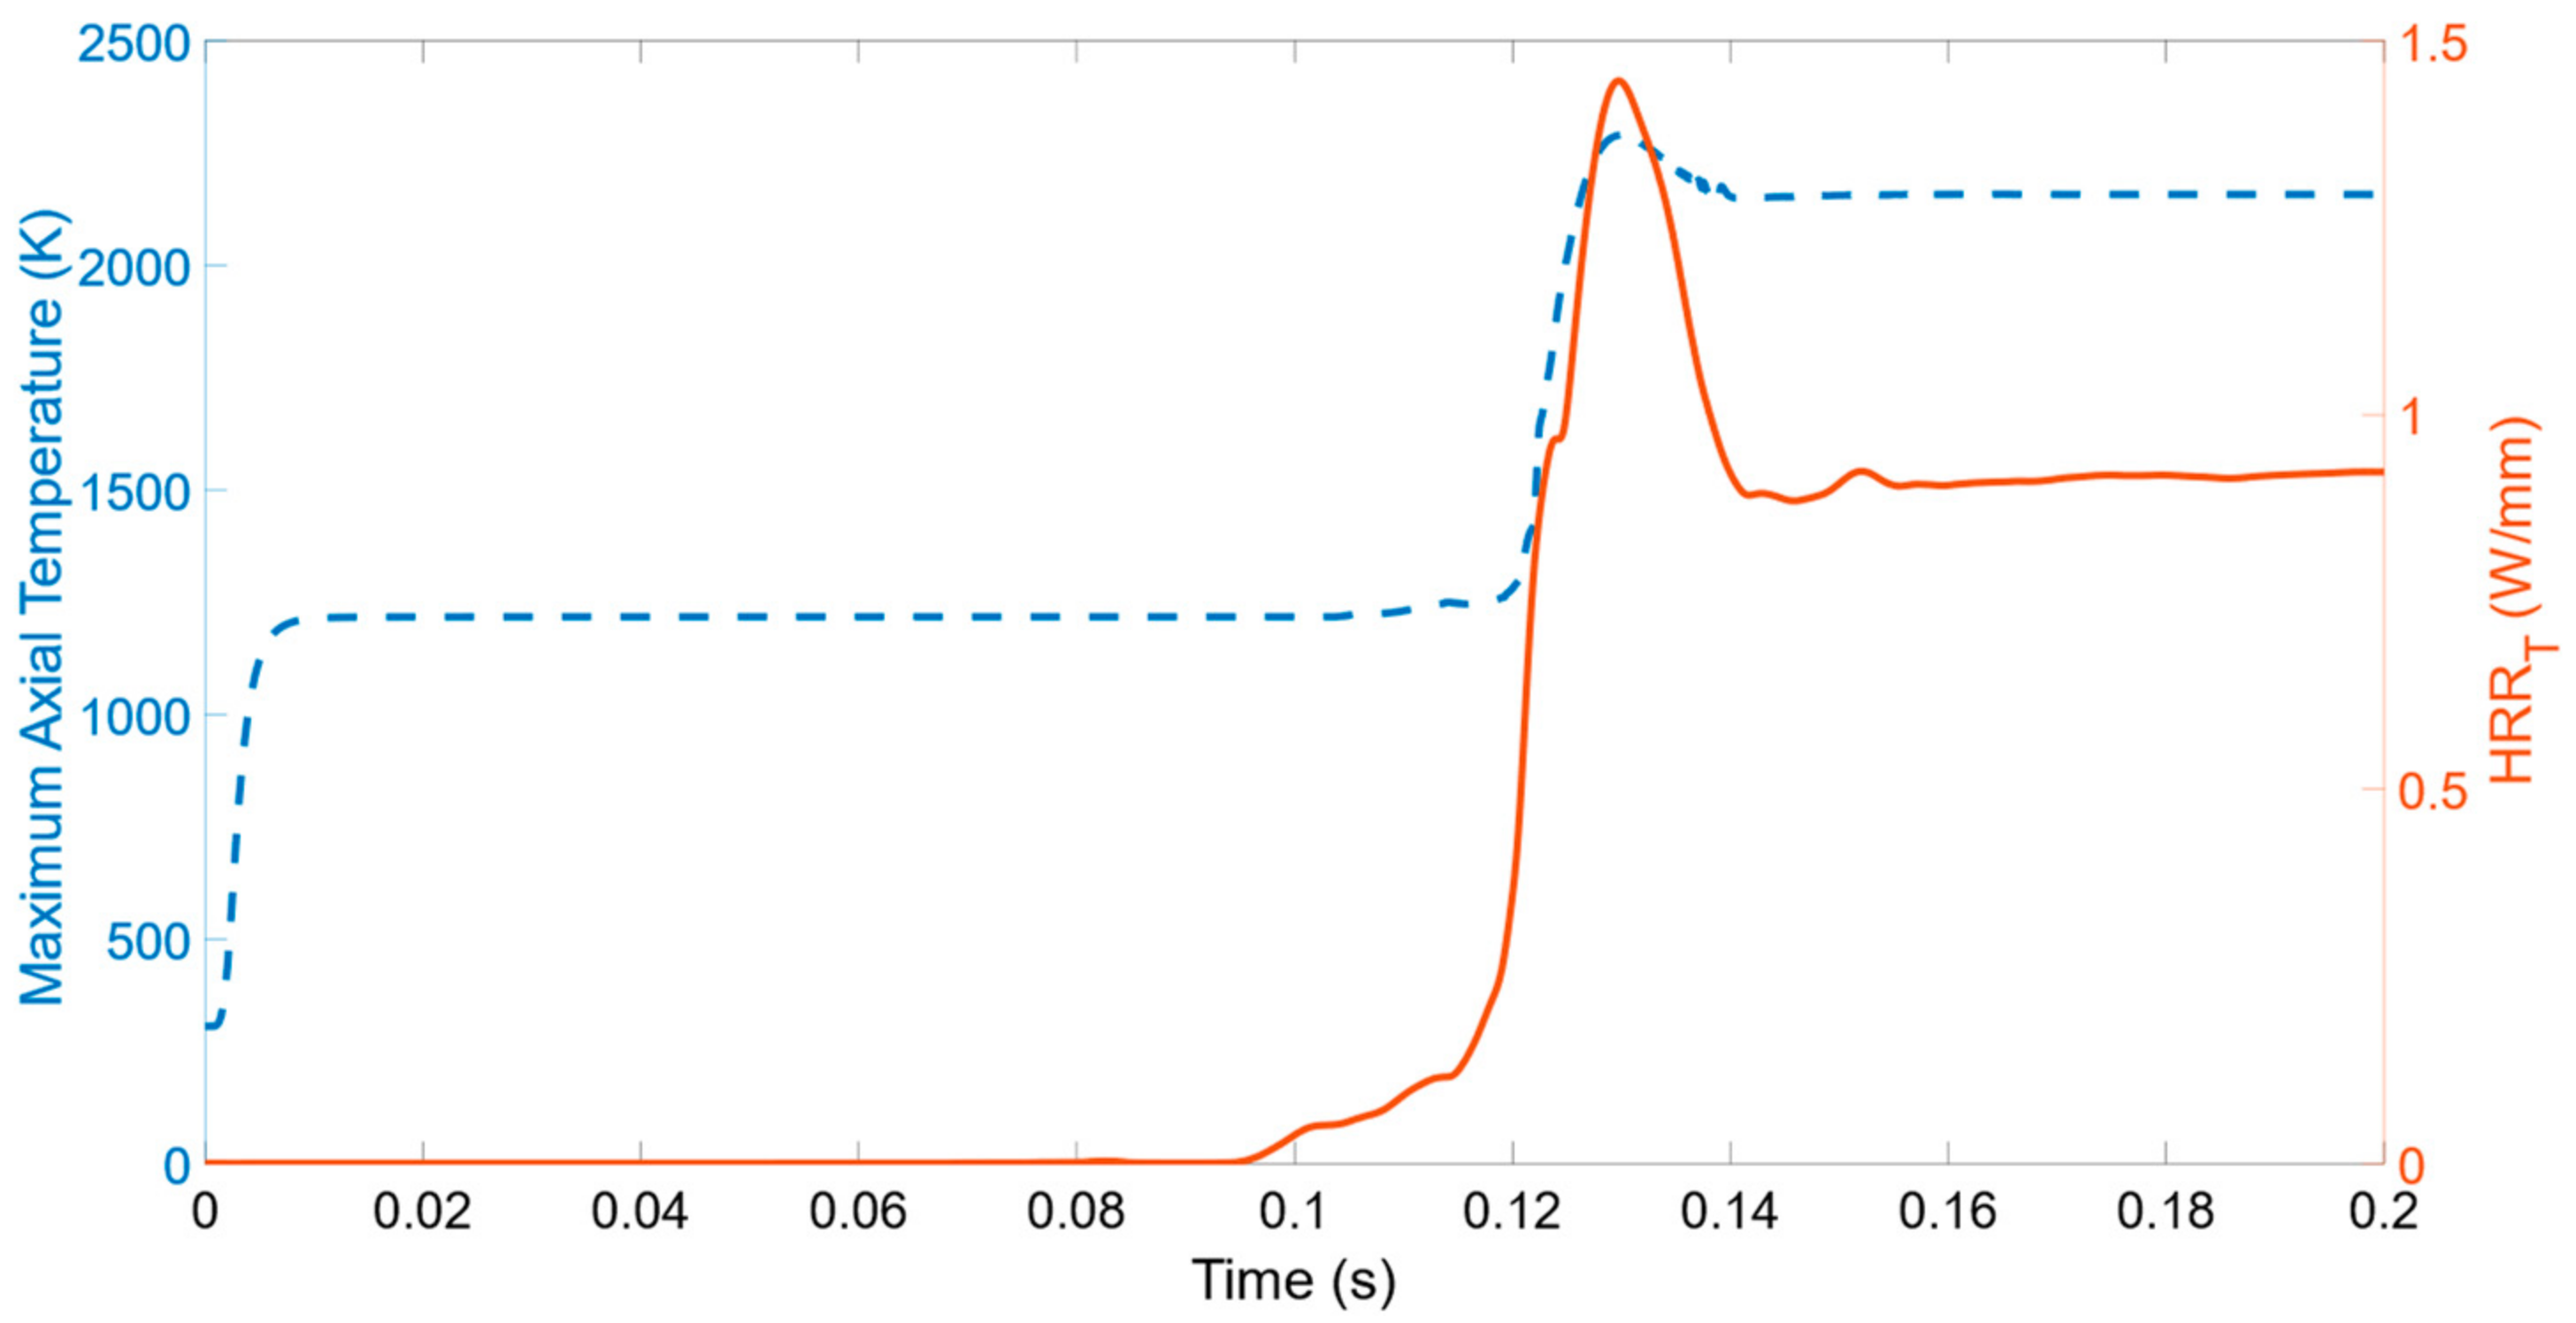
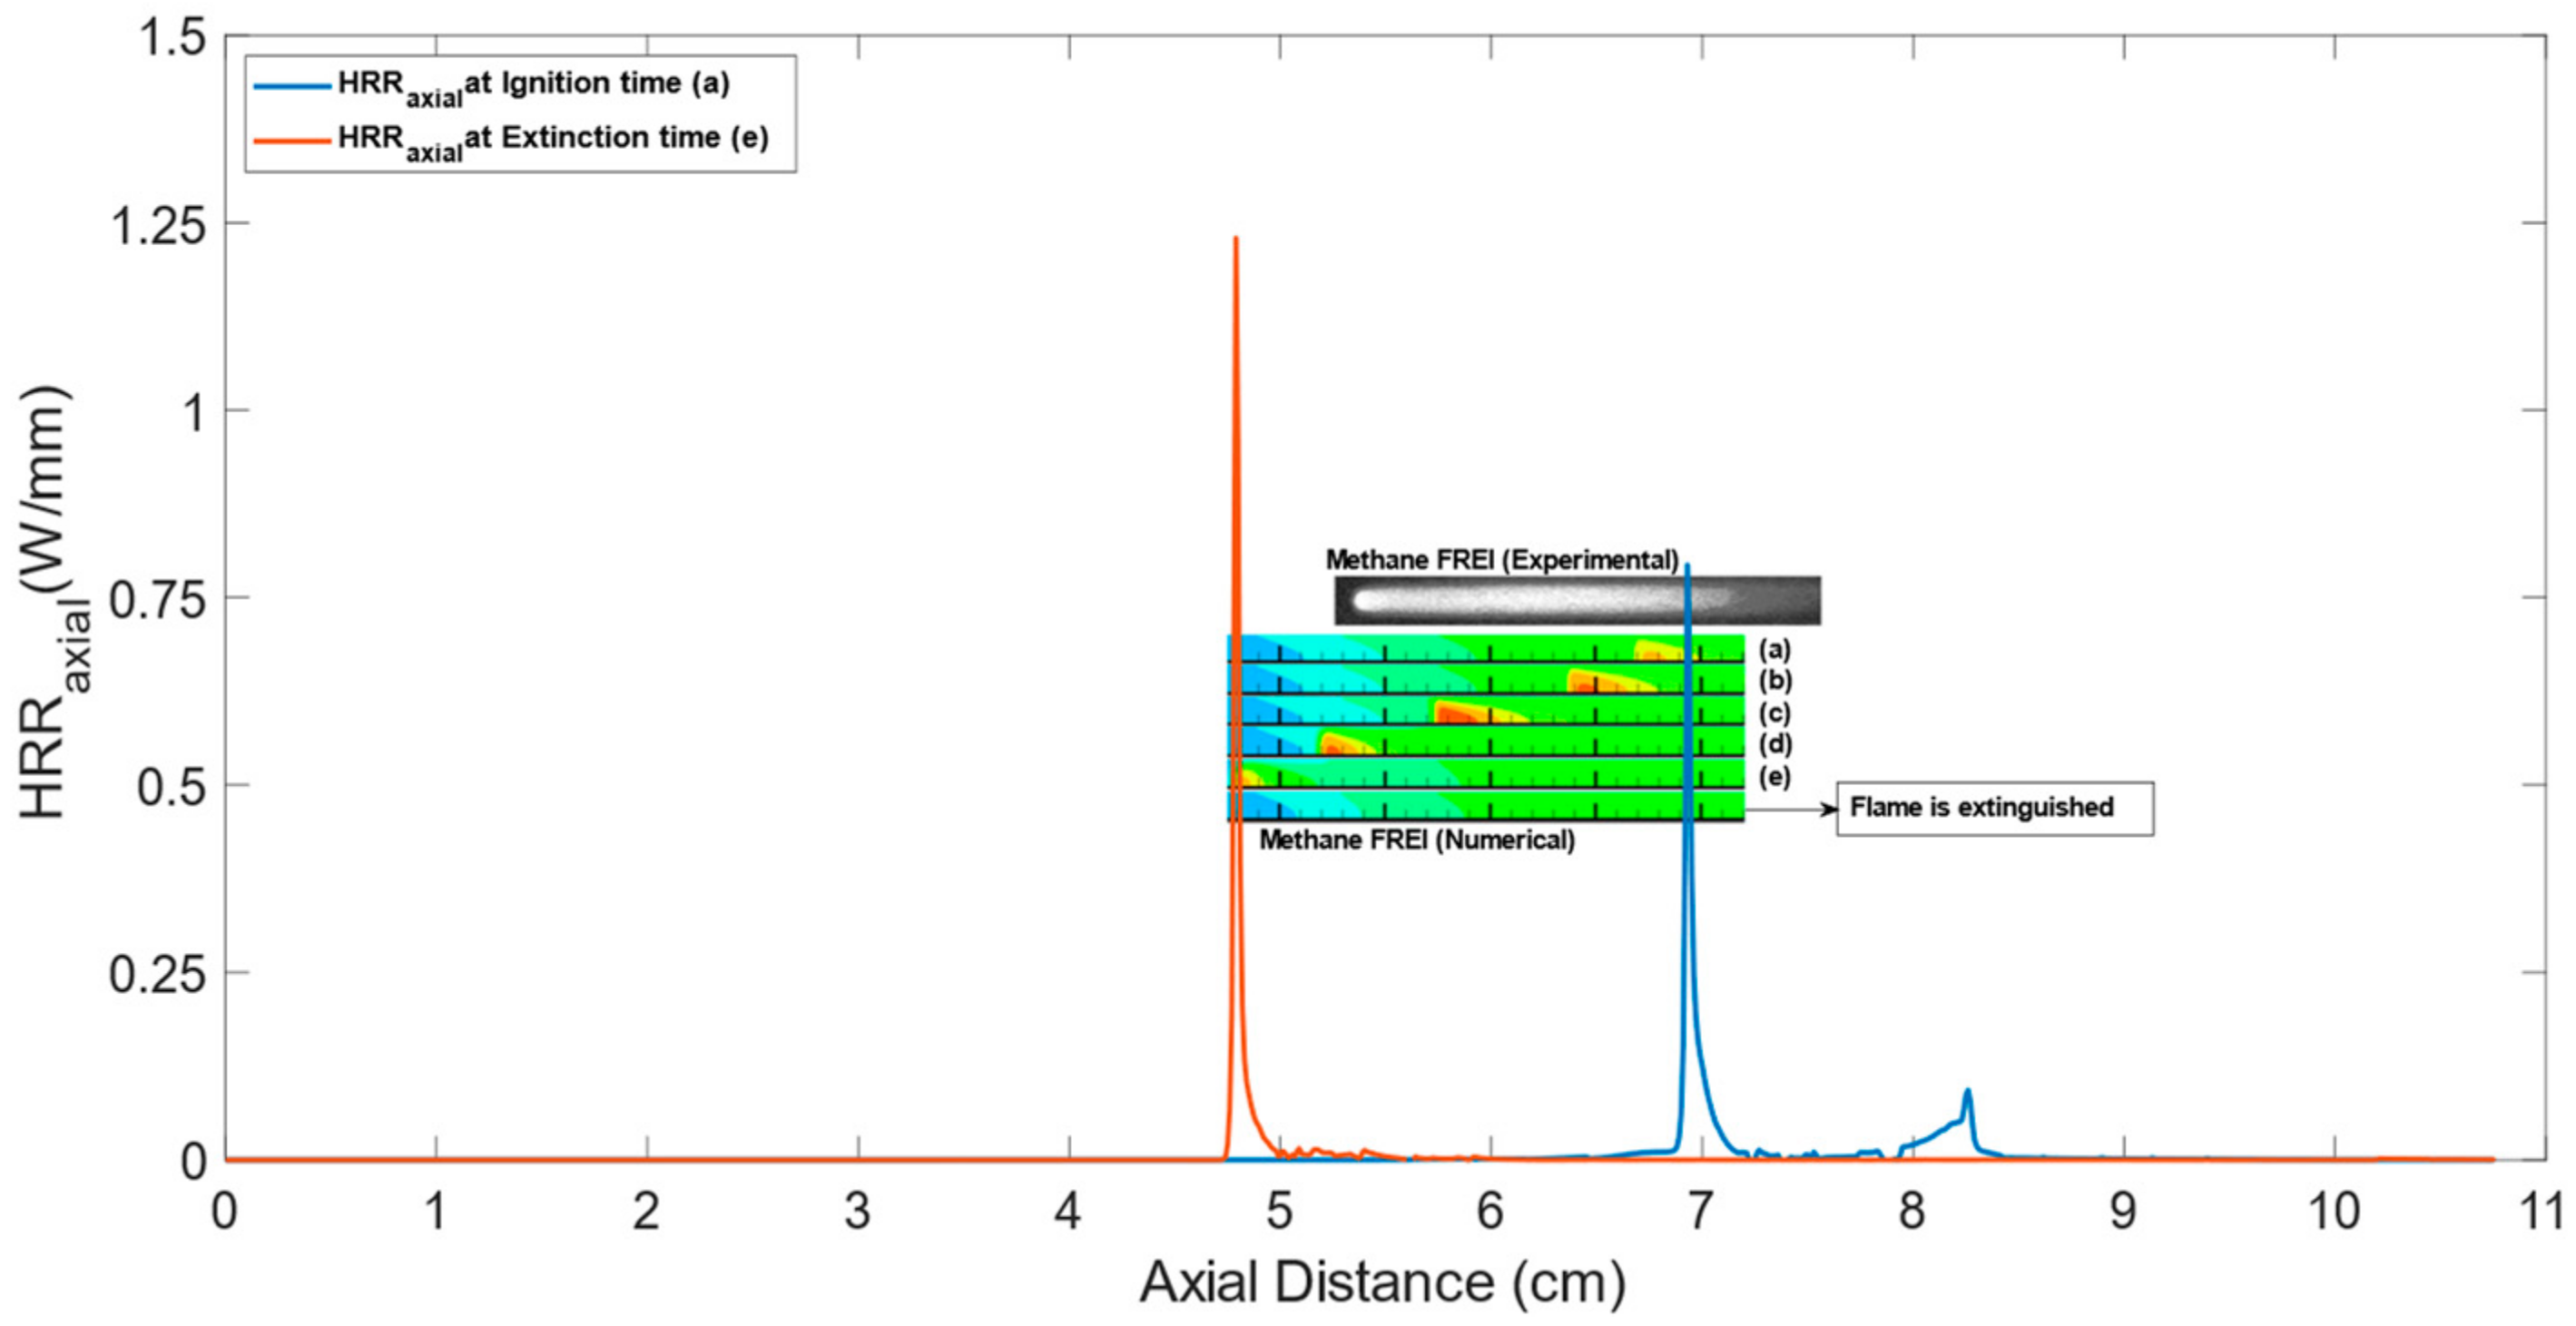
3.1.3. Comparison with Experimental Work: Local Heat Release Rate (HRRaxial)

The heat release rate at the microreactor axis is also a good indication of the presence of active reaction zones throughout the computational domain, hence, the HRRaxial peaks at a developed flame region starting from the time of ignition up to the time just before flame extinction. Such information facilitates a viable comparison with the experimental data. Figure 13 presents the variation of the axial heat release rate at the ignition and extinction times for the FREI mode (with an inlet velocity of 0.2 m/s). This therefore establishes the limits of the FREI cycle and the so-called FREI length. In addition, it can be seen that the heat release rate values for both the ignition and extinction points were not identical. It is shown that the upstream end of the FREI segments (i.e., the extinction location) is where the heat release peaked. This figure also provides the configurations of the CH* radicals at the same locations detected in the experiment. With a slight deviation between the two results, acceptable agreement is evident, thereby fulfilling the validity of the computational results. The uncertainty of the presented data is attributed to the same reasons that were mentioned previously in Section 3.1.2.

3.2. Impact of the Inlet Velocity

This section will illustrate how the variation of the inlet velocity can affect the combustion characteristics and metrics that were discussed in prior sections. Various inlet velocities ranging from 0.1 m/s to 0.6 m/s were used to form a total of eight (8) unique cases, all at a stoichiometric condition ( ϕ = 1 ) and a channel width of 2.3 mm. The results from these simulations show that the cases with the inlet velocities exceeding 0.24 m/s became stable, while those with lower inlet velocities experienced the FREI mode.

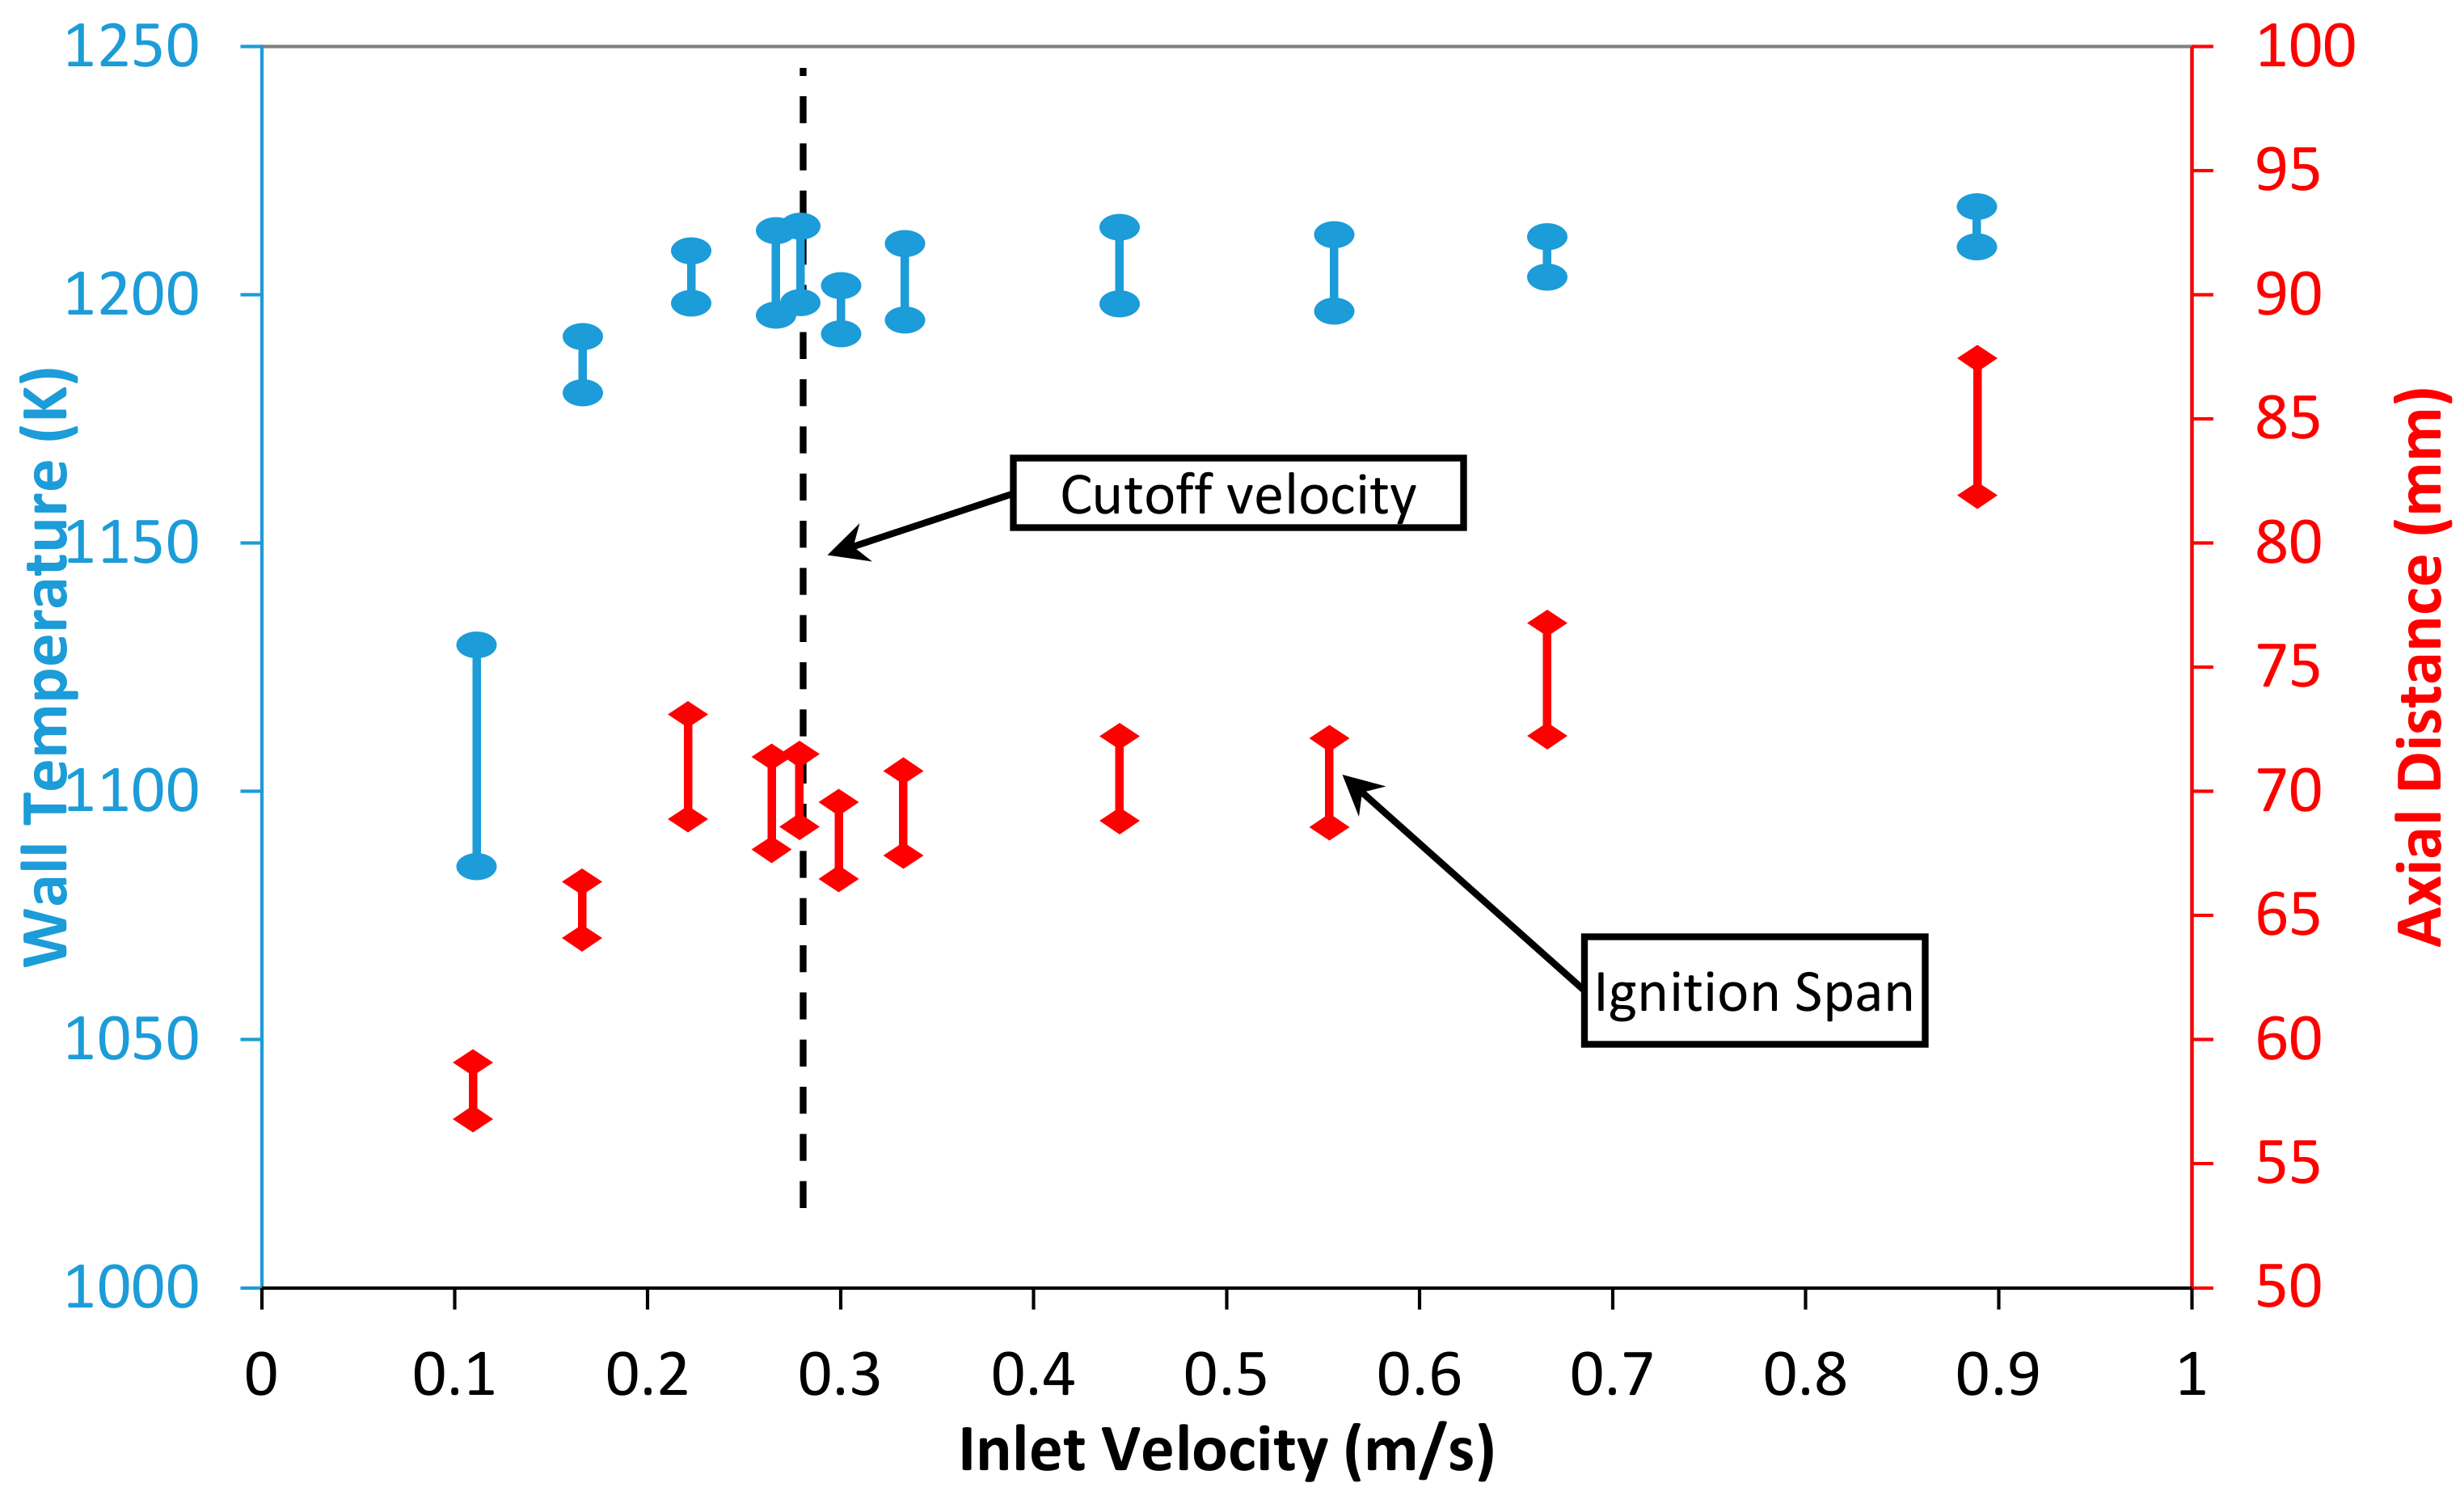
3.2.1. Impact of Inlet Velocity on Ignition Process

The ignition properties (as defined in Section 2.4.1) were determined for all the cases and are listed in Table 4. These results indicate that ignition occurred faster but also further downstream, which is attributed to a smaller residence time in the reactor at higher inlet velocities. This is consistent with the experimental and numerical findings in the literature [27,28,34,38]. Similarly, the ignition locations presented in Table 4 suggest an intuitive trend, i.e., ignition occurred further downstream for higher inlet velocities. Furthermore, the ignition span was larger for the cases with higher inlet velocities. This is explained by the fact that higher inlet velocities push the unburned fuel/air mixture further downstream and increase its concentration at a given time, as well as expand the high-temperature region (where the ignition is more likely to occur) at a faster rate. Under these circumstances, when a given differential volume (dx) ignites, it affects the surrounding area instantly, thus increasing the ignition span and the rate of heat release, resulting in an extended ignition surface (flame kernels). Accordingly, the HRRT (at the ignition time) for the inlet velocities of 0.2 m/s, 0.4 m/s, and 0.6 m/s are 1.12 W/mm, 1.45 W/mm, and 1.64 W/mm, respectively.
To further examine the influence of the flow inlet velocity and the imposed wall temperature on the ignition span and location, Figure 14 describes these trends and illustrates the changes in the wall temperature difference at the ignition span limits. First, it can be seen that the largest wall temperature difference was detected for the lowest inlet velocity case (a FREI case), which also coincides with the closest ignition event to the channel inlet. It was noted that closer to the inlet, the wall temperature was still low and increasing axially, which exacerbates the flame instability, resulting in a FREI mode. In addition, it was found that the ignition location for both stability modes was affected by the inlet velocity, i.e., higher inlet velocities drive the unburnt fuel/air mixture further down the reactor before arriving to the required ignition temperature, which also directly affects the residence time. At the left-hand-side of the cutoff velocity, the flame front propagated upstream towards the inlet, where the wall temperature was low enough to maximize the wall heat losses and led to flame extinction. As for the stable flames (right-hand side of the cutoff velocity), the ignition span increased as the wall temperature profile became uniform and the wall temperature difference at the ignition span limits was minimal. This also reveals that at the uniform wall temperature region, the high temperature zone in the channel grew, providing an optimum environment for the flame to reside and stabilize. These observations assert that temperature is the key parameter to ensure the ignition process, while the ignition location is dominated by the inlet velocity.

3.2.2. Impact of Inlet Velocity on Stable Flames

The stable flame metrics are presented in Table 5 (various inlet velocities exceeding 0.24 m/s at ϕ = 1 and with a channel diameter of 2.3 mm). It is seen that an increase in the inlet velocity resulted in the formation of a wider flame span stabilized further downstream, consistent with the literature [28,34]. Overall, it can be inferred that with relatively higher inlet velocities, the combustion process was more stable—the wall temperature at the stable flame location was relatively high and the heat loss was therefore relatively low. This resulted in achieving a stable flame, where the flame speed balanced the flow velocity. Figure 15 shows how the axial temperature across the flame span varied. Similar to the ignition span, it can be concluded that the flame span was directly proportional to the temperature across the flame. This is explained by the fact that the propagating flame stabilized where the wall temperature was still high and the axial flame temperature difference across the flame span was minimal. Such conditions diminished the heat loss effect through the walls and sustained ideal conditions for the flame to stabilize. Additionally, the flame span did not change significantly with the inlet velocity; however, the temperature range across the flame span increased with higher inlet velocities (at higher inlet velocities, the stabilized flames reside further downstream with higher wall temperatures).

3.2.3. Impact of Inlet Velocity on the FREI Mode

The flames experiencing the FREI mode are mainly characterized by the FREI period ( τ F R E I ) , adopted to further explain the impact of the inlet velocity on the FREI mode [34]. As illustrated in Table 6, τ F R E I increased for lower inlet velocities, which is explained by the larger flame residence time during each FREI cycle and the fact that the flame was created closer to the cold regions, where the wall temperature was below 750 K. This hindered the reignition event of the unburned mixture, causing the cyclic FREI behavior to slow down, thereby increasing the FREI period. This behavior was evident until reaching a point where the inlet flow velocity was low enough to develop the so-called weak flames, as previously mentioned in the Introduction.

3.3. Impact of Equivalence Ratio

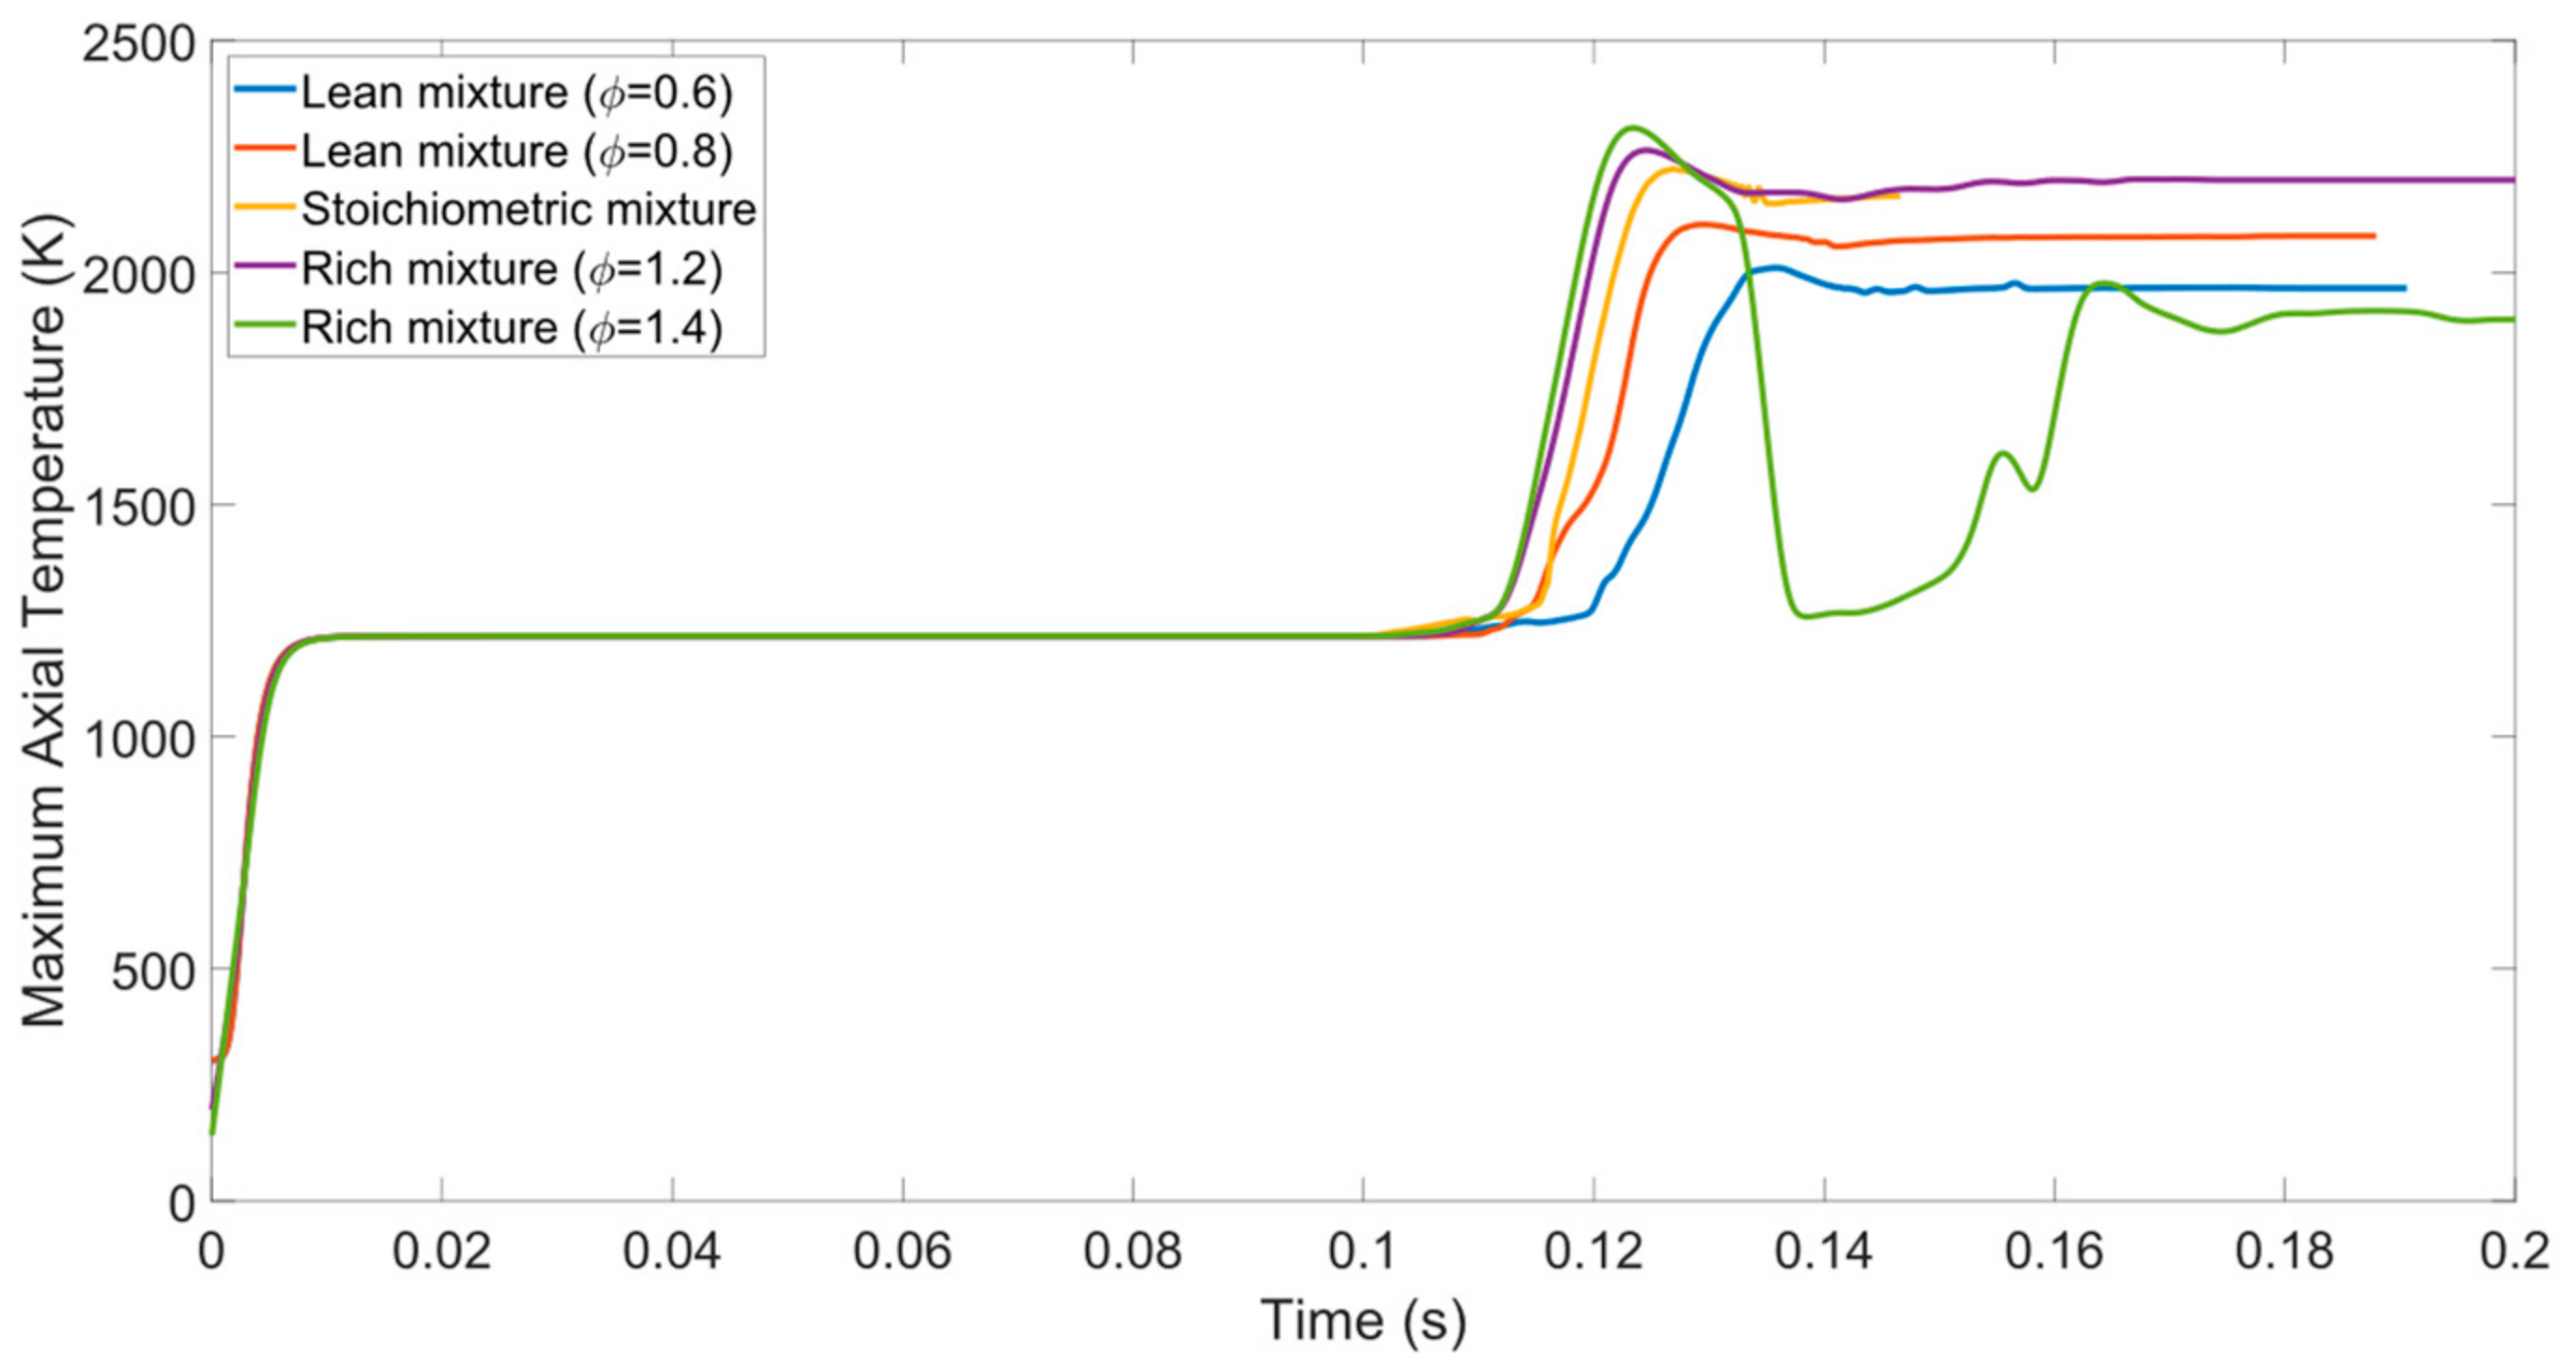
3.3.1. Impact of Equivalence Ratio on Ignition Process

In this section, the impact of the equivalence ratio, ϕ , is analyzed. For this purpose, five various equivalence ratios were chosen: two at the lean regime ( ϕ = 0.6 ,   0.8 ), stoichiometric ( ϕ = 1 ), and two others at the fuel-rich regime ( ϕ = 1.2 ,   1.4 ), all with a channel diameter of 2.3 mm. Each equivalence ratio ϕ was paired with two different inlet velocities of 0.4 m/s (representing the stable mode at ϕ = 1 ) and 0.2 m/s (representing the FREI mode at ϕ = 1 ) to examine the impact of ϕ on both stable and unstable flame modes. The simulation results show that the flame behavior was highly sensitive to such alterations, with the ignition time, ignition span, and flame temperature being affected significantly. Figure 16 compares the ignition progress for various equivalence ratios. It is evident that the fuel/air mixture is ignited slightly faster when the mixture was richer, due to an increased fuel concentration in the mixture; however, such an increase in the fuel concentration was limited—exceeding the flammability limit resulted in no ignition. It was also observed that the ignition was more delayed for the leaner cases. On the other hand, increasing the equivalence ratio further did not show substantial variation in the ignition time. For example, the ignition times of the rich cases of ϕ = 1.2 and 1.4 were almost the same. It was also noted that the peak maximum temperature points for the stoichiometric and the rich cases were quite close, as well, while they were lower for the fuel-lean cases. Table 7 summarizes the ignition properties for various equivalence ratios under each inlet velocity.
For the ignition location, the stoichiometric mixture ignited farther upstream, unlike the fuel-lean and the fuel-rich cases that tended to creep downstream. In contrast, for the unstable mode, the ignition location for the stoichiometric case was the farthest from the inlet, whereas those of the richer and leaner cases were located upstream, closer to the inlet. Interestingly, the ignition span was the largest for the ϕ = 1 condition for both stability modes. The following two subsections will further elaborate on the impacts of the equivalence ratio on the two flame modes comprehensively.

3.3.2. Impact of Equivalence Ratio on Stable Flames

Even though the variation of the equivalence ratio changed the main flame characteristics, the flame mode remained stable in most cases, except for the ultra-rich mixtures ( ϕ = 1.4 ), in which the flame became distinctly unstable (for the channel diameter of 2.3 mm). Specifically, after the flame was ignited, it moved upstream and extinguished, and then a weak flame appeared further downstream, where it resided and sustained its shape. This is especially evident in Figure 16, where the tendency of the transition between stable and FREI modes is higher for richer fuel mixtures. In addition, the inlet velocity at which such a transition was observed (cutoff velocity) decreased from the rich to the lean cases. For instance, at the stoichiometric condition, the cutoff velocity was 0.25 m/s, as compared to 0.4 m/s at the fuel-rich conditions. This observation is aligned with the experimental findings of Di Stazio et al. [19] at similar conditions.
Table 8 shows that the stable flame location was also affected by the equivalence ratio. For example, a lean ( ϕ = 0.6 ) flame stabilized further downstream, requiring more time to achieve stability, as is also illustrated in Figure 16; however, the stable flame location moved upstream when the fuel–air mixture was closer to the stoichiometric conditions. On the other hand, when the mixture became richer, the stabilized flame location shifted downstream again, even though the flame stabilized a bit faster than for the leaner cases. Such results are attributed to the higher fuel concentration. As for the flame span, the stoichiometric and lean cases were quite similar, 1.70~1.75 mm, whereas the flame span was as low as 1.45 mm for the rich fuel–air mixture.

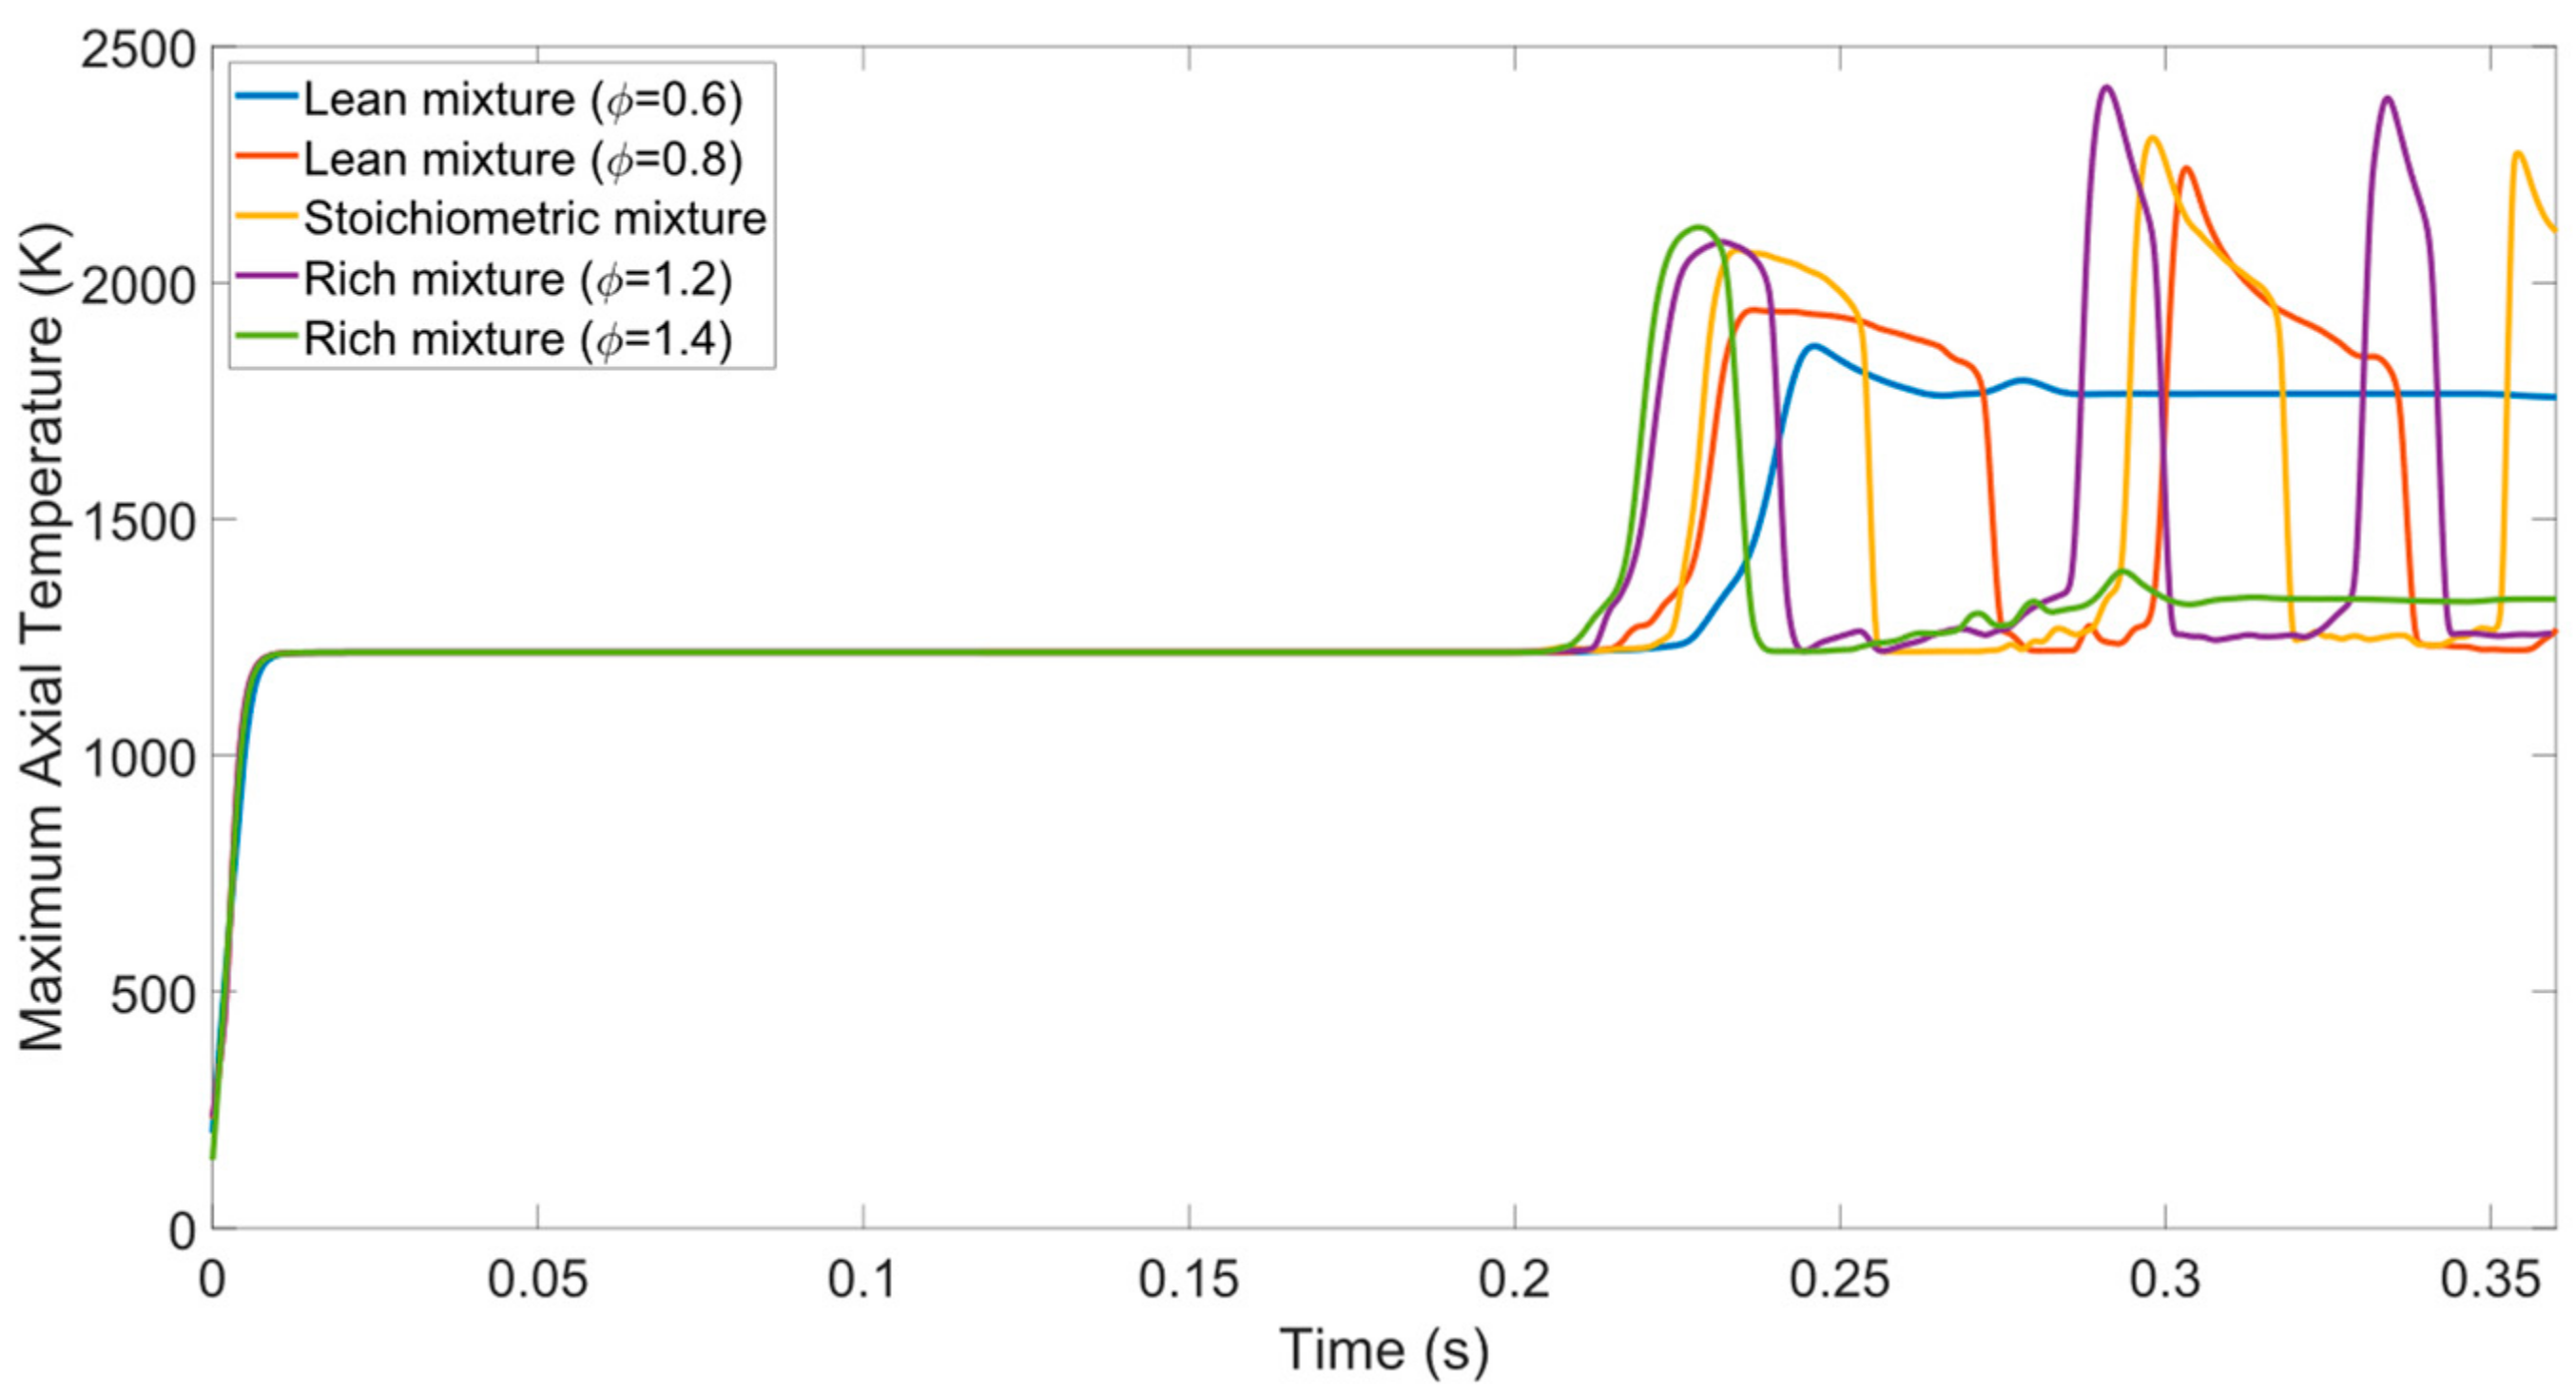
3.3.3. Impact of Equivalence Ratio on FREI Mode

The impact of the equivalence ratio on the FREI characteristics was analyzed using a channel diameter of 2.3 mm. In particular, Figure 17 depicts the maximum axial temperature data for five various equivalence ratios with the same inlet velocity of 0.2 m/s. It is shown that for ϕ = 0.8 ~ 1.2 , the FREI mode was maintained; however, the FREI characteristics, such as the FREI period and maximum axial temperature, were variable. For instance, it is evidently shown that the higher the equivalence ratio, the earlier the ignition occurs since the hot region (where the ignition event is initiated) developed at a faster rate for the richer cases as compared with the leaner ones. This also can be inferred from the peaks of the maximum axial temperature profiles, as the highest temperatures were detected at higher ϕ ; see Figure 17. Additionally, the maximum axial temperature profiles for the first ignition cycle notably differed for each regime (the subsequent FREI cycles were affected by the burnt products left after the first extinction). Additionally, the lean case represents the largest period for a single FREI cycle among the three cases, where it took longer for the flame to extinguish (see Table 9). Increasing ϕ above a certain limit will eventually lead to flame quenching, due to a relative lack of the oxidizer in the mixture, and this is evident for the richest mixture here ( ϕ = 1.4 ). In this case, the flame did not sustain after the initial ignition. In contrast, for the leanest mixture ( ϕ = 0.6 ), the FREI mode was no longer seen, and the flame experienced a stable mode, indicating the very important role of the equivalence ratio in altering the flame stability limits. In some cases, therefore, the equivalence ratio can be used as a controlling factor to stabilize the flame.

3.4. Impact of Channel Width

3.4.1. Impact of Channel Width on Stability

Three channel diameters (1.8 mm, 2.3 mm, and 3 mm) were used to assess the impact of the channel size on the flame behavior and stability modes. Varying the inlet velocity for each channel size at the stoichiometric conditions, the cutoff velocity was determined. It is shown that the cutoff velocity was lower for wider channels. To be specific, the cutoff velocities for the channel diameters of 1.8 mm, 2.3 mm, and 3.0 mm were found to be 0.30 m/s, 0.25 m/s, and 0.18 m/s, respectively. This is a good indication that it is more likely to observe instabilities, such as FREIs in narrower channels, while wider channels tend to be more stable at lower velocities. Similar analytical and experimental results have been reported for a propane/air mixture [39].

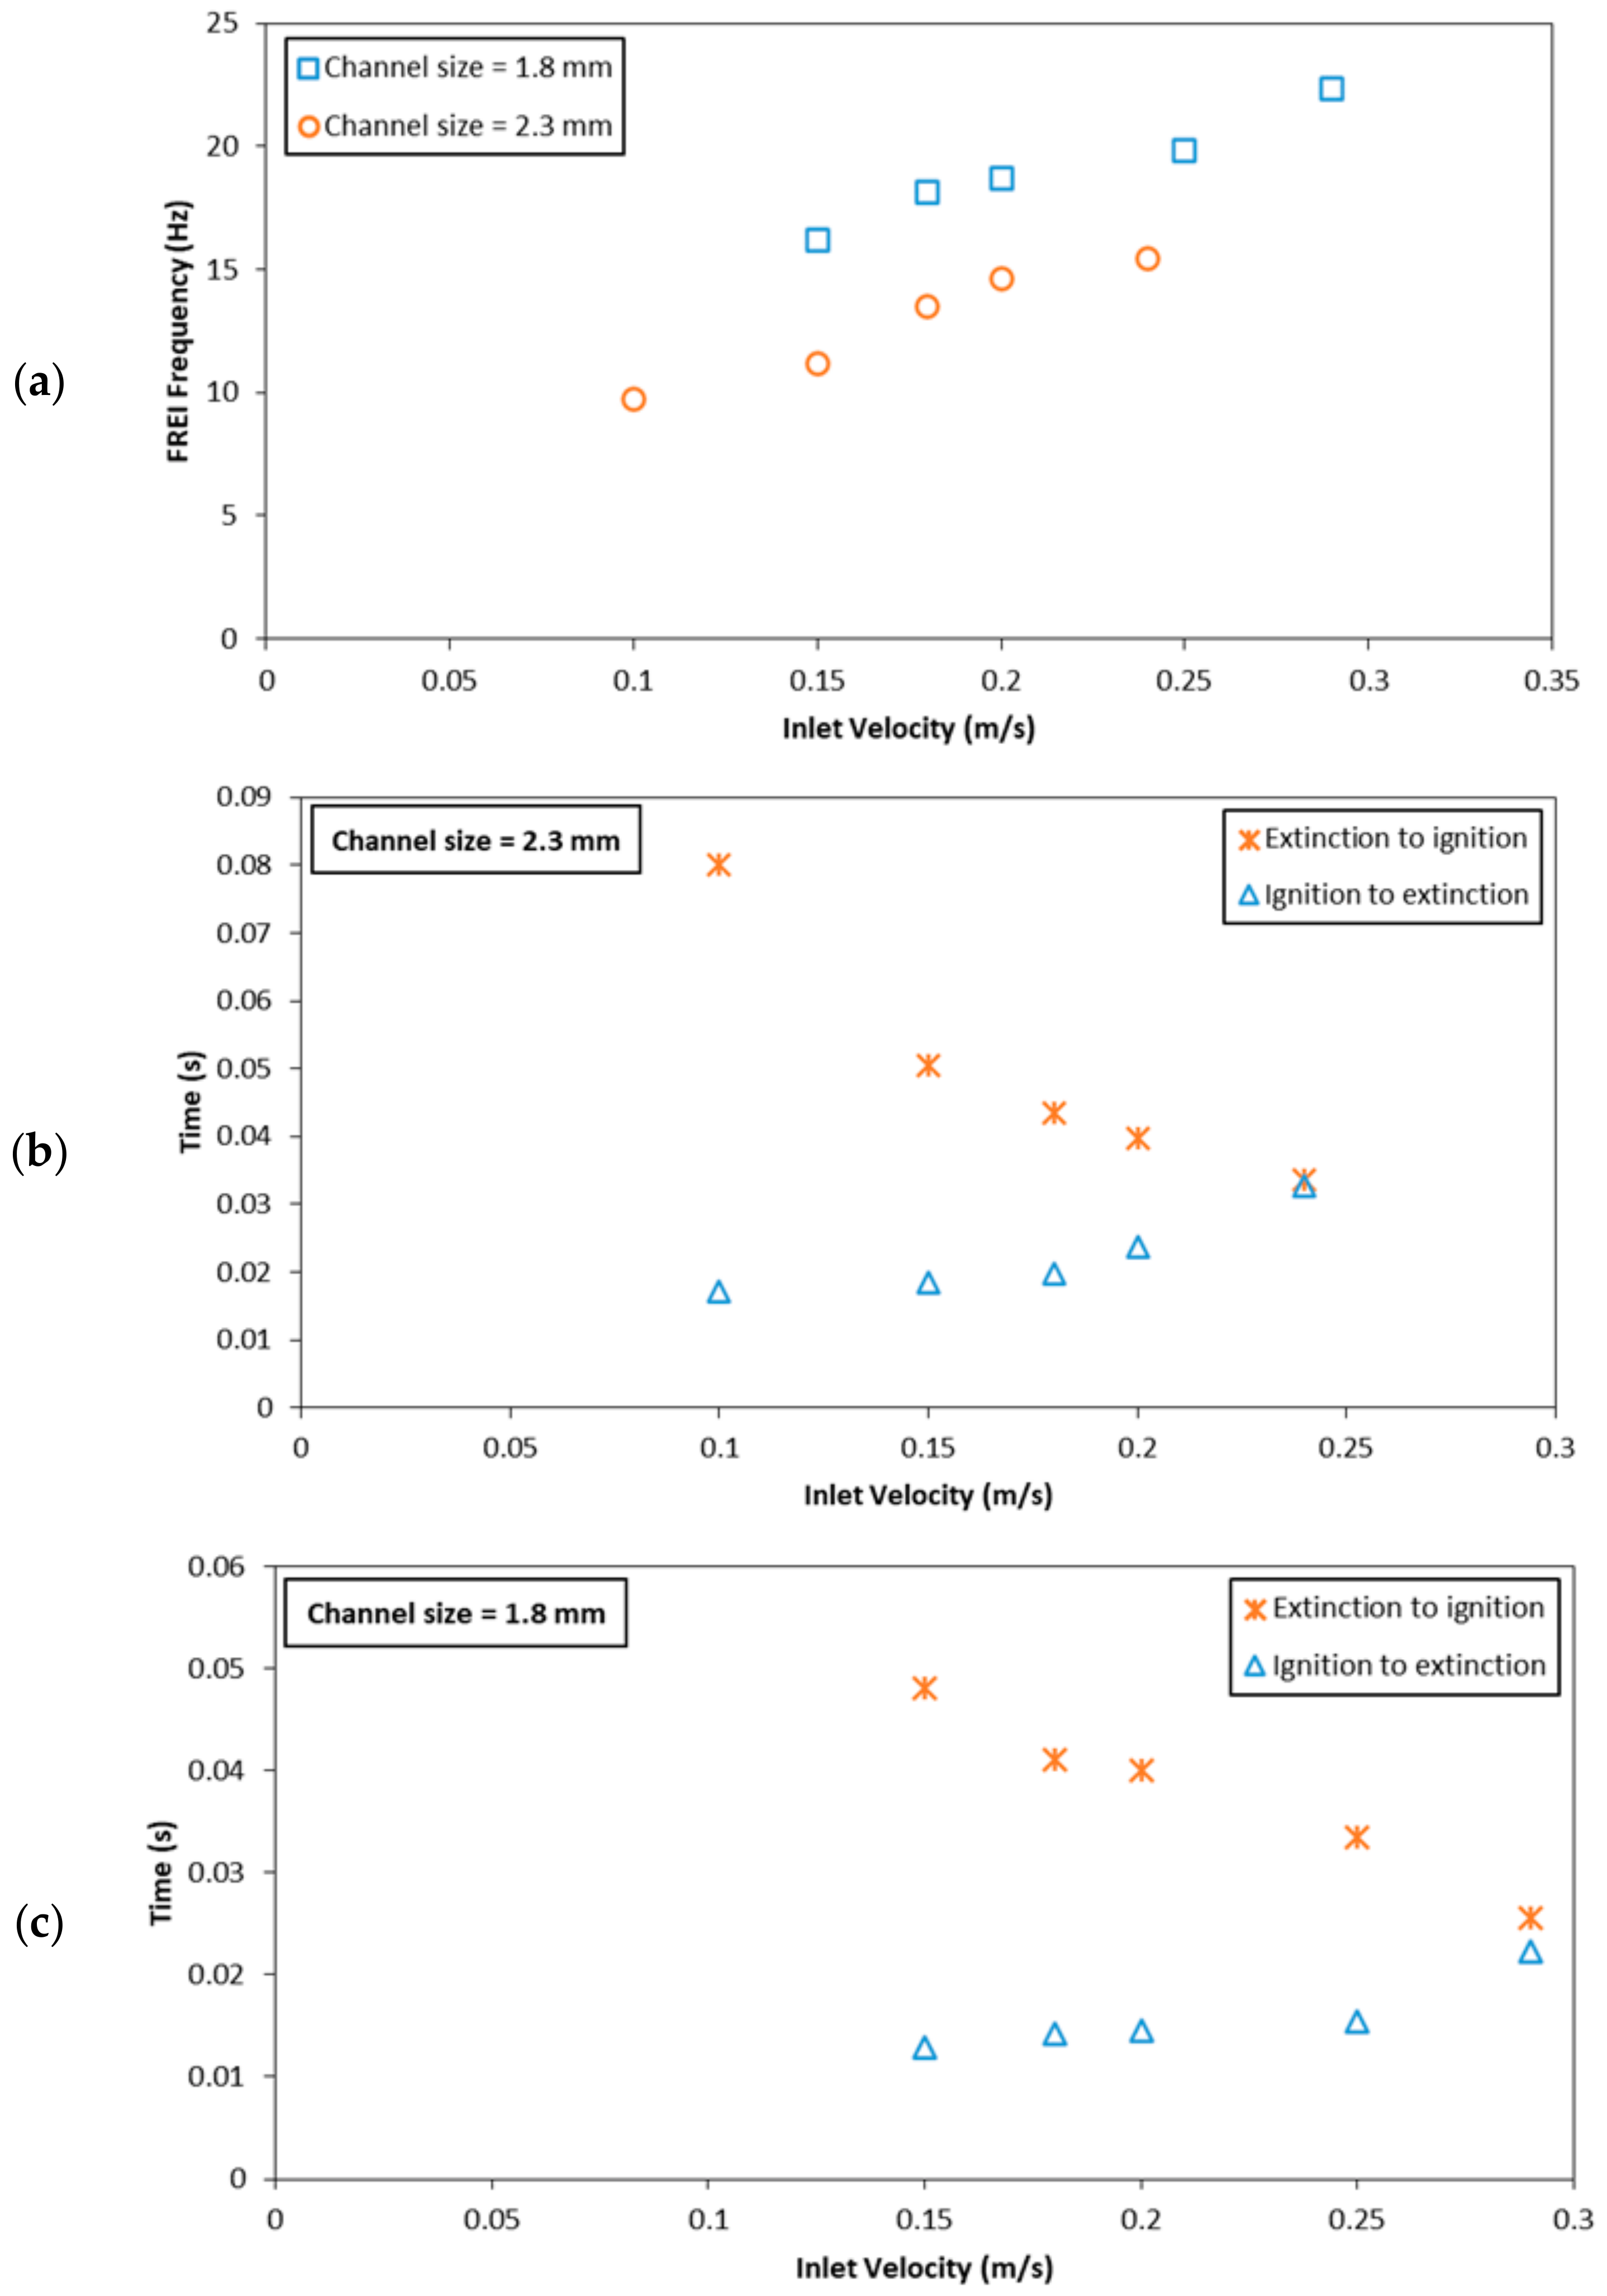
3.4.2. Impact of Channel Width on FREI Characteristics

This section examines the impact of the channel width on the FREI mode properties (e.g., the FREI frequency, the time from ignition to extinction, and the time from extinction to ignition). Figure 18a illustrates how the FREI frequency was affected by the inlet velocity at two different channel diameters of 1.8 mm and 2.3 mm. Specifically, the FREI frequency increased with the inlet velocity for both channels, arriving at a maximum frequency of 22.5 Hz for the narrower channel. Simultaneously, this behavior is explained by Figure 18b,c, where the FREI frequency is associated with the difference between the ignition-to-extinction and the extinction-to-ignition time intervals. In particular, it was concluded that the effect of the ignition-to-extinction time was minimal as compared to the extinction-to-ignition time. The reason for this is that the driving force for extinction is primarily the temperature difference between the reaction zone and the wall, which was relatively constant for all the FREI cases, whereas the wall temperature directly impacted the ignition timing. Furthermore, the wider the channel, the longer it takes for the flame to extinguish, thus diminishing the FREI frequency. These results confirm the findings of similar studies for methane/air combustion [22,40].

4. Conclusions

In this work, methane-air premixed combustion in a microchannel with a controlled wall temperature profile was investigated numerically and validated experimentally. The combustion characteristics were examined for various inlet velocities (0.1 to 0.6 m/s), channel diameters (1.8 to 3.0 mm), and equivalence ratios (0.6 to 1.4), scrutinizing two distinct flame modes: stable flames and FREI. The outcomes from this work offer the following insights:
  • The flow rates can directly affect the behavior of the propagating flame and its stability conditions. Specifically, it was shown that at lower inlet velocities, the flames propagate further upstream towards the cold wall temperature region, increasing the likelihood for the flame to experience FREI.
  • At a given inlet velocity and channel size, the equivalence ratio can play a role in controlling the stability (e.g., a flame may lose its stability if going to an ultra-rich regime or an unstable flame may become stable if going to an ultra-lean regime, producing a weak, but stable flame).
  • At a given channel size and in the case of the FREI mode, the rich fuel/air mixture ignites faster than the other cases and it produces the longest FREI frequency.
  • At a given equivalence ratio, the cutoff velocity is higher for narrower channels, i.e., it is more likely for a flame to experience a FREI mode; the flame extinction occurs at a higher temperature as the channel narrows and the difference between the characteristic ignition and extinction points diminishes, increasing the chance of developing a FREI mode. This is directly associated with the competition between the heat release rate and the wall heat losses, impacting the temperature, the location, and the stability mode of the flame.
  • The FREI frequency is affected by the channel size and the inlet velocity, such that the frequency is higher for narrower channels at a given inlet velocity.
The findings of this work will be beneficial in (a) realizing the nature of the combustion process and flame propagation in a microscale environment, (b) constituting the stability limits of CH4–air combustion in microreactors at various conditions, (c) selecting the optimum operating conditions for sustained microscale combustion, and (d) offering insight into stability mode transitions and the impacts of operating conditions.

Author Contributions

Conceptualization, M.A. and V.A.; data curation, A.K., M.A., M.E.B. and V.A.; formal analysis, A.K., M.A., M.E.B. and V.A.; funding acquisition, A.K., M.A., M.E.B. and V.A.; investigation, A.K., M.A., M.E.B. and V.A.; methodology, A.K., M.A., M.E.B. and V.A.; project administration, M.A. and V.A.; resources, V.A.; software, A.K.; supervision, M.A., M.E.B. and V.A.; validation, A.K. and M.A.; visualization, A.K.; writing—original draft, A.K.; writing—review and editing, M.A., M.E.B. and V.A. All authors have read and agreed to the published version of the manuscript.

Funding

This research was funded by the National Science Foundation (NSF) through CAREER Award #1554254 (V.A.), as well as by the West Virginia Higher Education Policy Commission, through Grant #HEPC.dsr.18.7 (V.A.).

Data Availability Statement

The data presented in this study are available on request from the corresponding author.

Conflicts of Interest

The authors declare no conflict of interest.

References

  1. Ju, Y.; Maruta, K. Microscale combustion: Technology development and fundamental research. Prog. Energy Combust. Sci. 2011, 37, 669–715. [Google Scholar] [CrossRef]
  2. Walther, D.C.; Ahn, J. Advances and challenges in the development of power-generation systems at small scales. Prog. Energy Combust. Sci. 2011, 37, 583–610. [Google Scholar] [CrossRef]
  3. Dogwiler, U.; Mantzaras, J.; Benz, P.; Kaeppeli, B.; Bombach, R.; Arnold, A. Homogeneous ignition of methane-air mixtures over platinum: Comparison of measurements and detailed numerical predictions. In Proceedings of the International Symposium of Combustion, Boulder, CO, USA, 2–7 August 1998. [Google Scholar] [CrossRef]
  4. Kamada, T.; Nakamura, H.; Tezuka, T.; Hasegawa, S.; Maruta, K. Study on combustion and ignition characteristics of natural gas components in a micro flow reactor with a controlled temperature profile. Combust. Flame 2014, 161, 37–48. [Google Scholar] [CrossRef]
  5. Chigier, N.; Gemci, T. A review of micro propulsion technology. In Proceedings of the 41st Aerospace Sciences Meeting and Exhibit, Reno, Nevada, 6–9 January 2003. [Google Scholar] [CrossRef]
  6. Buliński, Z.; Szczygieł, I.; Kabaj, A.; Krysiński, T.; Gładysz, P.; Czarnowska, L.; Stanek, W. Performance analysis of the small-scale α-type Stirling engine using computational fluid dynamics tools. J. Energy Resour. Technol. 2018, 140, 3. [Google Scholar] [CrossRef]
  7. Yan, Y.; Liu, Y.; Li, H.; Huang, W.; Chen, Y.; Li, L.; Yang, Z. Effect of cavity coupling factors of opposed counter-flow microcombustor on the methane-fueled catalytic combustion characteristics. J. Energy Resour. Technol. 2019, 141, 2. [Google Scholar] [CrossRef]
  8. Li, H.; Chen, Y.; Yan, Y.; Hu, C.; Fan, H.; Feng, S. Numerical study on heat transfer enhanced in a microcombustor with staggered cylindrical array for micro-thermophotovoltaic system. J. Energy Resour. Technol. 2018, 140, 11. [Google Scholar] [CrossRef]
  9. Kaisare, N.; Vlachos, D. A review on microcombustion: Fundamentals, devices and applications. Prog. Energy Combust. Sci. 2012, 38, 321–359. [Google Scholar] [CrossRef]
  10. Epstein, A.H. Millimeter-scale, micro-electro-mechanical systems gas turbine engines. J. Eng. Gas Turbines Power 2004, 126, 205–226. [Google Scholar] [CrossRef]
  11. Maruta, K.; Kataoka, T.; Kim, N.; Minaev, S.; Fursenko, R. Characteristics of combustion in a narrow channel with a temperature gradient. Proc. Combust. Inst. 2005, 30, 2429–2436. [Google Scholar] [CrossRef]
  12. Maruta, K.; Parc, J.K.; Oh, K.C.; Fujimori, T.; Minaev, S.S.; Fursenko, R.V. Characteristics of microscale combustion in a narrowheated channel. Combust. Explos. Shock Waves 2004, 40, 516–523. [Google Scholar] [CrossRef]
  13. Kikui, S.; Kamada, T.; Nakamura, H.; Tezuka, T.; Hasegawa, S.; Maruta, K. Characteristics of n-butane weak flames at elevated pressures in a micro flow reactor with a controlled temperature profile. Proc. Combust. Inst. 2015, 35, 3405–3412. [Google Scholar] [CrossRef]
  14. Nakamura, H.; Yamamoto, A.; Hori, M.; Tezuka, T.; Hasegawa, S.; Maruta, K. Study on pressure dependences of ethanol oxidation by separated weak flames in a micro flow reactor with a controlled temperature profile. Proc. Combust. Inst. 2013, 34, 3435–3443. [Google Scholar] [CrossRef]
  15. Hori, M.; Nakamura, H.; Tezuka, T.; Hasegawa, S.; Maruta, K. Characteristics of n-heptane and toluene weak flames in a micro flow reactor with a controlled temperature profile. Proc. Combust. Inst. 2013, 34, 3419–3426. [Google Scholar] [CrossRef]
  16. Watson, G.M.; Bergthorson, J.M. The effect of chemical energy release on heat transfer from flames in small channels. Combust. Flame 2012, 159, 1239–1252. [Google Scholar] [CrossRef]
  17. Yamamoto, A.; Oshibe, H.; Nakamura, H.; Tezuka, T.; Hasegawa, S.; Maruta, K. Stabilized three-stage oxidation of gaseous n-heptane/air mixture in a micro flow reactor with a controlled temperature profile. Proc. Combust. Inst. 2011, 33, 3259–3266. [Google Scholar] [CrossRef]
  18. Nakamura, H.; Fan, A.; Minaev, S.; Sereshchenko, E.; Fursenko, R.; Tsuboi, Y.; Maruta, K. Bifurcations and negative propagation speeds of methane/air premixed flames with repetitive extinction and ignition in a heated microchannel. Combust. Flame 2012, 159, 1631–1643. [Google Scholar] [CrossRef]
  19. Di Stazio, A.; Chauveau, C.; Dayma, G.; Dagaut, P. Combustion in micro-channels with a controlled temperature gradient. Exp. Therm. Fluid Sci. 2016, 73, 79–86. [Google Scholar] [CrossRef]
  20. Edalati-nejad, A.; Fanaee, S.A.; Ghodrat, M.; Khadem, J. Investigation of unsteady premixed micro/macro counterflow flames for lean to rich methane/air mixture. J. Energy Resour. Technol. 2021, 143, 052302. [Google Scholar] [CrossRef]
  21. Kayed, H.; Mohamed, A.; Yehia, M.; Nemitallah, M.A.; Habib, M.A. Numerical investigation of auto-ignition characteristics in microstructured catalytic honeycomb reactor for CH4–air and CH4–H2–air mixtures. J. Energy Resour. Technol. 2019, 141, 082209. [Google Scholar] [CrossRef]
  22. Akita, K.; Morii, Y.; Murakami, Y.; Nakamura, H.; Tezuka, T.; Maruta, K. Dynamics of FREI with/without cool flame interaction. Proc. Combust. Inst. 2023, 39, 1957–1965. [Google Scholar] [CrossRef]
  23. Pizza, G.; Frouzakis, C.E.; Mantzaras, J.; Tomboulides, A.G.; Boulouchos, K. Three-dimensional simulations of premixed hydrogen/air flames in microtubes. J. Fluid Mech. 2010, 658, 463–491. [Google Scholar] [CrossRef]
  24. Pizza, G.; Frouzakis, C.E.; Mantzaras, J.; Tomboulides, A.G.; Boulouchos, K. Dynamics of premixed hydrogen/air flames in mesoscale channels. Combust. Flame 2008, 155, 2–20. [Google Scholar] [CrossRef]
  25. Nakamura, Y.; Yamashita, H.; Saito, K. A numerical study on extinction behavior of laminar micro-diffusion flames. Combust. Theor. Model. 2007, 10, 927–938. [Google Scholar] [CrossRef]
  26. Miyata, E.; Fukushima, N.; Naka, Y.; Shimura, M.; Tanahashi, M.; Miyauchi, T. Direct numerical simulation of micro combustion in a narrow circular channel with a detailed kinetic mechanism. Proc. Combust. Inst. 2015, 35, 3421–3427. [Google Scholar] [CrossRef]
  27. Ayoobi, M.; Schoegl, I. Numerical analysis of flame instabilities in narrow channels: Laminar premixed methane/air combustion. Int. J. Spray Combust. Dyn. 2017, 9, 155–171. [Google Scholar] [CrossRef]
  28. Norton, D.G.; Vlachos, D.G. Combustion characteristics and flame stability at the microscale: A CFD study of premixedmethane/air mixtures. Chem. Eng. Sci. 2003, 58, 4871–4882. [Google Scholar] [CrossRef]
  29. Di Stazio, A.; Chauveau, C.; Dayma, G.; Dagaut, P. Oscillating flames in micro-combustion. Combust. Flame 2016, 167, 392–394. [Google Scholar] [CrossRef]
  30. Singh, S.; Veetil, J.E.; Kumbhakarna, N.; Velamati, R.K.; Kumar, S. Flame dynamics of premixed CH4/H2/air flames in a microchannel with a wall temperature gradient. Combust. Theor. Model. 2022, 26, 989–1013. [Google Scholar] [CrossRef]
  31. Ansys|Engineering Simulation Software. Available online: https://www.ansys.com (accessed on 10 July 2023).
  32. Chemical-Kinetic Mechanisms for Combustion Applications, San Diego Mechanism, Mechanical and Aerospace Engineering (Combustion Research), University of California at San Diego. Available online: http://combustion.ucsd.edu (accessed on 16 July 2023).
  33. Baumgardner, M.E. Microreactor combustion of simple hydrocarbons. In Proceedings of the 11th U.S. National CombustionMeeting, Pasadena, CA, USA, 24–27 March 2019. [Google Scholar]
  34. Pokharel, S.; Ayoobi, M.; Akkerman, V. Computational analysis of premixed syngas/air combustion in micro-channels: Impacts of flow rate and fuel composition. Energies 2021, 14, 4190. [Google Scholar] [CrossRef]
  35. Zettervall, N.; Fureby, C.; Nilsson, E.J. Evaluation of chemical kinetic mechanisms for methane combustion: A review from a CFD perspective. Fuels 2021, 2, 210–240. [Google Scholar] [CrossRef]
  36. Minaev, S.; Maruta, K.; Fursenko, R. Nonlinear dynamics of flame in a narrow channel with a temperature gradient. Combust. Theor Model. 2007, 11, 187–203. [Google Scholar] [CrossRef]
  37. Baumgardner, M.E.; Harvey, J. Analyzing OH*, CH*, and C2* chemiluminescence of bifurcating FREI propane-air flames in a micro flow reactor. Combust. Flame 2020, 221, 349–351. [Google Scholar] [CrossRef]
  38. Fan, Y.; Suzuki, Y.; Kasagi, N. Experimental study of micro-scale premixed flame in quartz channels. Proc. Combust. Inst. 2015, 35, 3429–3437. [Google Scholar] [CrossRef]
  39. Schoegl, I.; Sauer, V.M.; Sharma, P. Predicting combustion characteristics in externally heated micro-tubes. Combust. Flame 2019, 204, 33–48. [Google Scholar] [CrossRef]
  40. Bucci, M.; Di Stazio, A.; Chauveau, C.; Dayma, G.; Legros, G.; Dagaut, P.; Chibbaro, S. Numerical and experimental analysis of combustion in microchannels with controlled temperature. Chem. Eng. Sci. 2019, 4, 100034. [Google Scholar] [CrossRef]
Figure 1. The imposed wall temperature profile along the tube (a), a schematic of the 2D computational domain (b), and the mesh layout showing the distribution of the square elements in the computational domain, where L is the channel length and W is the channel half width (c).
Energies 16 06752 g001
Figure 2. The grid independence tests with an inlet velocity of 0.4 m/s, a channel width of 2.3 mm, and a stoichiometric fuel/air mixture: the maximum axial temperature (a), and total heat release rate (HRRT) (b) vs. time.
Energies 16 06752 g002
Figure 3. The maximum axial temperature vs. time for an inlet velocity of 0.4 m/s, a channel width of 2.3 mm, and a stoichiometric fuel/air mixture. The markers represent the specific time steps for further clarification in Figure 4.
Energies 16 06752 g003
Figure 4. The temperature contours at the selected successive time steps for the ignition and propagating flame process with an inlet velocity of 0.4 m/s, a channel width of 2.3 mm, and a stoichiometric fuel/air mixture. The length is measured in meters.
Energies 16 06752 g004
Figure 5. The axial temperature data at the time of ignition for an inlet velocity of 0.4 m/s, a channel width of 2.3 mm, and a stoichiometric fuel/air mixture. The length is measured in meters. (a) The temperature profile along the x-axis and (b) the temperature contour at the selected time step.
Energies 16 06752 g005
Figure 6. The maximum axial temperature and the smoothed heat release rate (HRRT) data vs. time for an inlet velocity of 0.4 m/s, a channel width of 2.3 mm, and a stoichiometric fuel/air mixture. The secondary y-axis shows the smoothed data instead of the raw HRRT data.
Energies 16 06752 g006
Figure 7. (a) The temperature (below) and the CH radical (above) contours at the selected successive time steps for the ignition and the propagating flame process with an inlet velocity of 0.4 m/s. (b) The axial temperature and the CH radicals vs. the axial distance at the ignition time, all at a channel width of 2.3 mm and with a stoichiometric fuel/air mixture.
Energies 16 06752 g007
Figure 8. The axial temperature data for the stabilized flame for an inlet velocity of 0.4 m/s, a channel size of 2.3 mm, and a stoichiometric fuel/air mixture. The length is measured in meters. (a) The temperature profile along the x-axis and (b) the temperature contour at the selected time step.
Energies 16 06752 g008
Figure 9. The maximum axial temperature vs. time for an inlet velocity of 0.2 m/s, a channel width of 2.3 mm, and a stoichiometric fuel/air mixture, in the case of the FREI mode. The markers represent the specific time steps for further clarification in Figure 10.
Energies 16 06752 g009
Figure 10. The temperature contour for a flame with a FREI mode, with an inlet velocity of 0.2 m/s, a channel width of 2.3 mm, and a stoichiometric fuel/air mixture. Points (a)–(h) correlate with the relevant markers in Figure 9.
Energies 16 06752 g010
Figure 11. A schematic of the microreactor arrangement.
Energies 16 06752 g011
Figure 12. The axial temperature data along with the wall temperature profile and the temperature contour for a flame with a FREI mode with an inlet velocity of 0.2 m/s, a channel width of 2.3 mm, and a stoichiometric fuel/air mixture. Points (a)–(e) show the consecutive time instants of one cycle of the FREI mode. Also shown is the processed image of the chemiluminescence profile of CH* radicals for the actual FREI flames at 0.2 m/s; the start and end locations of each image/contour correspond to the respective experimental locations.
Energies 16 06752 g012
Figure 13. The axial heat release rate at the ignition and the extinction time of one cycle of the FREI mode and the temperature contour for a flame with a FREI mode with an inlet velocity of 0.2 m/s, a channel width of 2.3 mm, and a stoichiometric fuel/air mixture. Points (a)–(e) show the consecutive time instants of one cycle of the FREI mode. The processed image of the chemiluminescence profile of the CH* radicals for the actual FREI flames at 0.2 m/s is also shown; the start and end locations of each image/contour correspond to the respective experimental locations.
Energies 16 06752 g013
Figure 14. The ignition span along with the wall temperature at the span limits vs. the inlet velocity, for a channel width of 2.3 mm and a stoichiometric fuel/air mixture.
Energies 16 06752 g014
Figure 15. The flame span limits along with the maximum flame temperature range within the flame span region vs. the inlet velocity, for a channel size of 2.3 mm and a stoichiometric fuel/air mixture.
Energies 16 06752 g015
Figure 16. The maximum axial temperature profile vs. time for five cases of various equivalence ratio with an inlet velocity of 0.4 m/s and a channel width of 2.3 mm.
Energies 16 06752 g016
Figure 17. The maximum axial temperature profile vs. time for five cases of various equivalence ratios with an inlet velocity of 0.2 m/s and a channel width of 2.3 mm.
Energies 16 06752 g017
Figure 18. (a) The frequency of the FREI vs. the inlet velocity. (b,c) The time from ignition to extinction and extinction to ignition for two channel diameters, 2.3 mm and 1.8 mm, all with a stoichiometric fuel/air mixture.
Energies 16 06752 g018
Table 1. Main parameters of the computational model.
ParametersMethods
Solver typePressure-based solver
Flow viscous modelLaminar
Species reaction (chemical kinetics)Volumetric species transport, San Diego mechanism (46 species and 235 reactions) [32]
DiscretizationSecond-order upwind
Pressure–velocity couplingCOUPLE scheme
Transient formulationFirst-order implicit
Boundary conditionsInlet: velocity-inlet, Outlet: pressure-outlet
External wall: temperature thermal conditions
Axis: axisymmetric line
Initialization methodStandard
Table 2. A summary of the simulated cases depicting the selected inlet velocities, the mixture regimes, and the equivalence ratios for a channel width of 2.3 mm.
Inlet Velocity (m/s)Mixture RegimeEquivalence Ratio (ϕ)
0.10Stoichiometric1
0.15Stoichiometric1
0.20Stoichiometric, lean, rich0.6, 0.8, 1, 1.2, 1.4
0.24Stoichiometric1
0.30Stoichiometric1
0.40Stoichiometric, lean, rich0.6, 0.8, 1, 1.2, 1.4
0.50Stoichiometric1
0.60Stoichiometric1
Table 3. A summary of the reactants mass fractions for the simulated cases.
Equivalence Ratio (ϕ)Reactants’ Mass Fractions (yx)
yCH4yO2yN2
Fuel-lean0.60.03370.22520.7411
0.80.04450.22270.7328
Stoichiometric10.05500.22020.7248
Fuel-rich1.20.06550.21780.7167
1.40.07540.21550.7091
Table 4. Ignition properties for various inlet velocities, a channel width of 2.3 mm, and a stoichiometric fuel/air mixture.
Inlet Velocity (m/s)Ignition Time (s)Ignition Location (mm)Ignition Span (mm)
tigxig−stxig−exig
0.100.440554.9056.801.90
0.150.243064.0066.202.20
0.200.228567.4069.852.45
0.240.162567.5069.802.30
0.300.158066.8069.202.40
0.400.119564.5067.903.40
0.500.097567.0070.503.50
0.600.083574.1078.003.90
Table 5. The stabilization location and the flame span for the stable cases, all at a channel width of 2.3 mm and with a stoichiometric fuel/air mixture.
Inlet Velocity
(m/s)
Flame Location (mm)Flame Span (mm)
xszstxszexsz
0.3051.1052.601.50
0.4054.4056.151.75
0.5056.9058.801.90
0.6058.9061.002.10
Table 6. The FREI time for different inlet velocities, a channel width of 2.3 mm, and a stoichiometric fuel/air mixture.
Inlet Velocity (m/s)0.100.150.200.24
τFREI (ms) 102.5389.6063.6564.67
Table 7. The ignition properties for two inlet velocities (0.2 m/s and 0.4 m/s) and a range of equivalence ratios, all at a channel width of 2.3 mm.
Inlet
Velocity
Equivalence Ratio (ϕ)Ignition Time (s)Ignition Location (mm)Ignition Span (mm)
t i g x i g s t x i g e x i g
0.4 m/sFuel-lean0.60.127567.2069.402.20
0.80.122569.7072.502.80
Stoichiometric10.119564.5067.903.40
Fuel-rich1.20.117069.0072.103.10
1.40.116069.9572.902.95
0.2 m/sFuel-lean0.60.239062.2064.452.25
0.80.230560.0562.452.40
Stoichiometric10.228567.4069.852.45
Fuel-rich1.20.221561.0062.951.95
1.40.219560.0562.052.00
Table 8. The stabilization location and the flame span for the stable cases at an inlet velocity of 0.4 m/s and a channel size of 2.3 mm.
Equivalence Ratio
(ϕ)
Flame Location (mm)Flame Span (mm)
x s z s t x s z e Δ x s z
Fuel-lean0.656.5158.231.72
0.854.9056.601.70
Stoichiometric154.4056.151.75
Fuel-rich1.256.6058.051.45
Table 9. The FREI time for various equivalence ratios at an inlet velocity of 0.2 m/s and a channel width of 2.3 mm.
Equivalence Ratio (ϕ)0.811.21.4
τFREI (ms)66.8563.6559.10N/A
Disclaimer/Publisher’s Note: The statements, opinions and data contained in all publications are solely those of the individual author(s) and contributor(s) and not of MDPI and/or the editor(s). MDPI and/or the editor(s) disclaim responsibility for any injury to people or property resulting from any ideas, methods, instructions or products referred to in the content.

