Abstract
Natural gas, as one of the main energy sources of the modern clean energy system, is also an important raw material for the chemical industry, and the stable extraction of natural gas reservoirs is often affected by bottom water. It is difficult to control water in natural gas reservoirs, while fractured gas reservoirs are even more demanding. This is due to the complexity of the seepage laws of gas and water in fractures, resulting in the poor applicability of conventional processes for water control. Continuous research is needed to propose a process with effective control capabilities for bottom-water fractured gas reservoirs. Aiming at the above difficulties, this paper is based on a large-scale three-dimensional physical simulation device to carry out physical model design and simulation results testing and analysis. The water control ability of the combination of density-segmented sieve tubes and continuous packers in fractured gas reservoirs is explored. The physical simulation results show that the fracture distribution characteristics control the upward transportation path of bottom water. According to the segmentation characteristics of the fractures at the horizontal section location, optimizing the number of horizontal well screen tube segments and the density of boreholes reduces the cone-in velocity of bottom water before connecting the fractures to a certain extent. And the combined process has different degrees of water control ability for the three stages of bottom water transportation from the fractured gas reservoir to the production well. As the degree of water in the production well increases, the water control ability of the process gradually decreases. After the implementation of the water control process, the water-free gas production period was extended by about 6.84%, and the total production time was extended by about 6.46%. After the shutdown of the horizontal wells, the reduction in daily water production can still reach 21% compared to the natural extraction. The results of this research can provide process suggestions for water control in offshore fractured reservoirs and further ensure stable production in offshore fractured gas reservoirs.
1. Introduction
With global greenhouse gas emissions and environmental pollution becoming increasingly prominent, green energy is becoming the focus of the global energy transition. Among various renewable energy sources, hydrogen energy is widely recognized as one of the most promising green energy sources. Currently, natural gas is one of the main energy sources in the modern clean energy system [1]. Meanwhile, the production of hydrogen mainly relies on processes such as fossil fuel processing and water electrolysis, while the use of natural gas for hydrogen production has received attention from both industry and academia, and the efficient production of hydrogen using natural gas has become one of the research hotspots [2]. According to IHS data, 74% of the newly discovered oil and gas resources in the world in the last 10 years were distributed in the offshore area. Therefore, the stable development of offshore gas resources is an important guarantee to provide sufficient feedstock for hydrogen production from natural gas. However, the stable exploitation of offshore gas fields is often threatened by bottom water, and effective water control processes need to be proposed. The development and gradual maturation of bottom water control technologies have provided an important guarantee for the stable production of oil and gas reservoirs. In recent years, the water control processes mainly based on ICD (Inflow Control Device), variable density sieve tubes, and continuous packers have achieved satisfactory results in practical applications [3,4] and have been subjected to continuous modeling and optimization of processes, as well as modeling and optimization of processes [4,5,6]. As the difficulty of water control in reservoir properties and bottom water multiplicity gradually increases, in order to ensure the water control effect of the process, research on the combination of ICD, variable density sieve tube, and continuous packer has been carried out [7]. However, the risk of bottom water coning in fractured reservoirs is higher, and it is difficult to accurately predict the process of bottom water coning in fractured reservoirs and its impact on oil and gas production, especially the water-locking effect after the reservoir sees water, which can cause a rapid decline in production in a short period of time [8,9]. Currently, the most widely used water control process is to seal the fractures with chemical reagents such as gel, which aims to reduce the seepage rate of bottom water in the fracture zone and prevent bottom water from coning in during the early production period [6,10,11,12]. However, the configuration of the agent requires a large source of fresh water. The development of desalination units using solar energy solves this problem [13,14]. However, it requires the offshore production platform to leave enough space to accommodate the desalination equipment. And chemical agents in offshore fractured oil and gas fields have problems such as the requirement of environmental protection limitations and the difficulty of unblocking. A mechanical-based water control process has better applicability. It has become the development direction for water control and plugging in offshore oil and gas fields [15].
Take the HZ26 gas reservoir in China as an example; the water depth of the sea area where it is located is about 112 m. The Mesozoic paleosubmarine reservoir fractures are very developed, with medium- and high-angle diagonal intersecting joints dominating the reservoir. The fracture width of the fracture is from 1 mm to 4 mm, and the permeability is about 1000 mD. In 2019, completion of multiple drill stem tests (DST) DST1 obtained a high-producing oil-gas flow of about 43 × 104 m3/d in the upper paleosubmarine fracture zone, and the test concluded that it is a condensate layer; DST2 obtained a high-producing oil-gas flow of about 2.26 × 10 m/d in the DST2 in the lower part of the paleosubduction rift zone in the inner curtain and obtained a daily gas production of about 2.26 × 10⁴ m3 high-yielding oil and gas flow [16]. The development of bottom water in gas reservoirs is prone to rapid cone penetration of bottom water, and there is an urgent need to improve the understanding of the water intrusion law in gas wells. The implementation of water control technology in gas reservoirs is more limited, and fractured gas reservoirs put forward higher requirements for water control technology.
To this end, this paper analyzes the water control effect of the combination of density-segmented sieve tubes and continuous packer water control processes in bottom-water fractured gas reservoirs based on physical simulation experiments, and the research results and understanding provide support for the preference of the water control process in offshore bottom-water fractured gas reservoirs.
2. Physical Simulation Experiments
2.1. Experimental Setup and Procedure
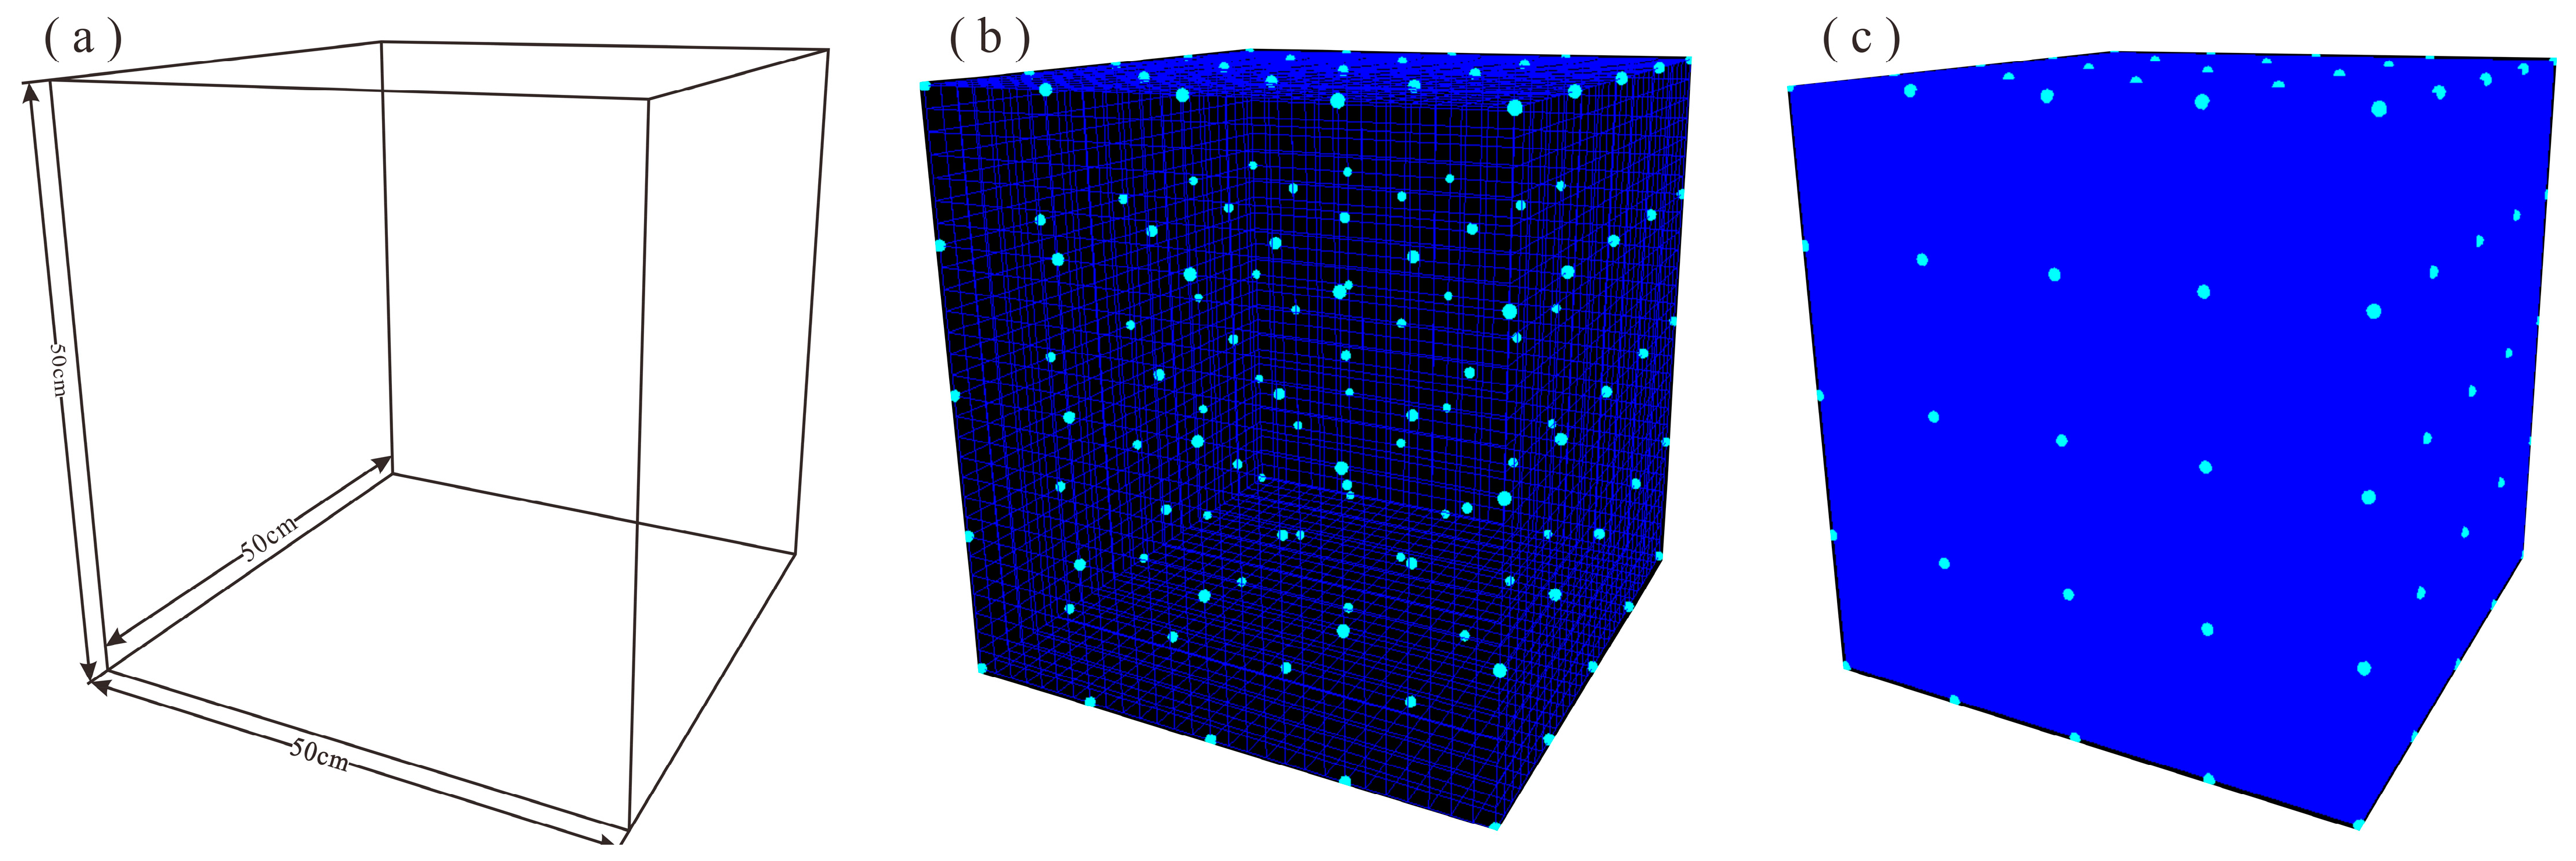
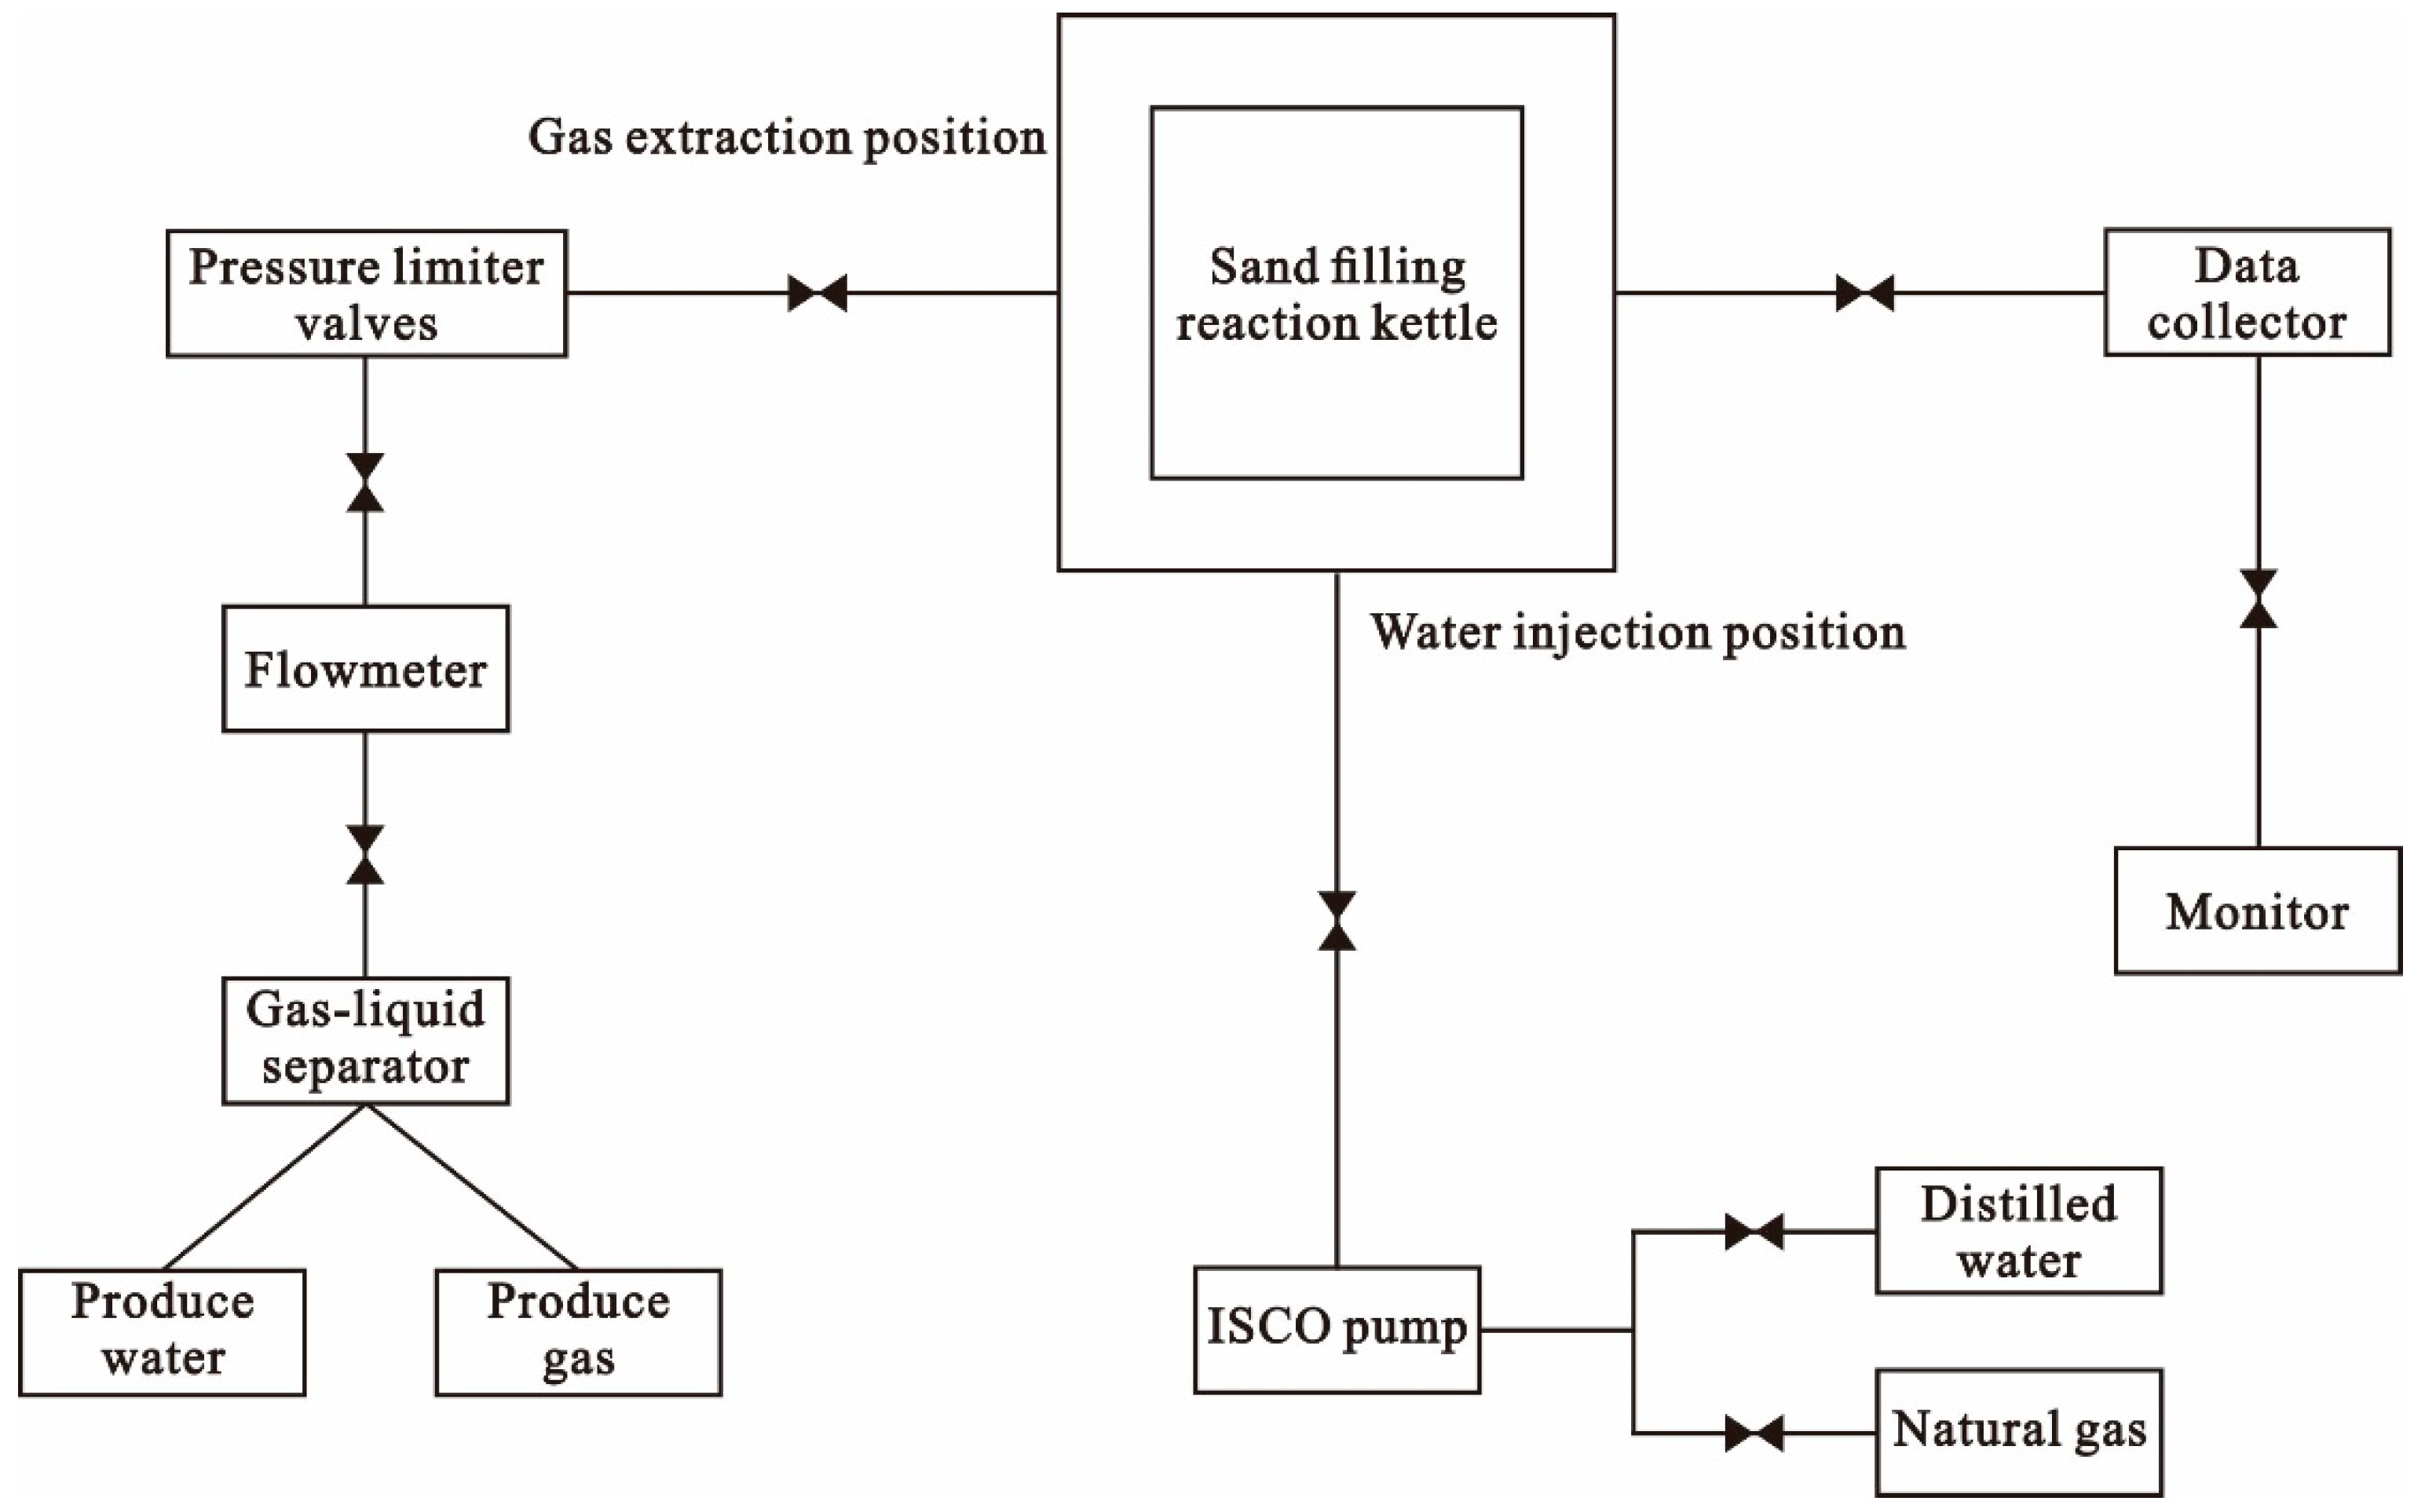
The current experiment and process were conducted based on the previous gas reservoir combined water control process study, using the same continuous packer material and model filling process [17]. The interior of the experimental equipment is a square kettle of 50 cm × 50 cm × 50 cm (Figure 1a). In order to ensure a more delicate evaluation of the water control effect in the gas reservoir, the kettle body was modified so that a total of 125 water saturation measurement sensors were uniformly distributed throughout the entire cavity (Figure 1b,c). CO2 gas was used as the natural gas for the experiment, and the bottom water was replaced by distilled water. There is one extraction valve at the top of the kettle. In order to simulate the seepage process of bottom water at the production location of horizontal wells during the production process of fractured gas reservoirs, three inlet valves were installed at the bottom of the device. The valves are connected to a uniformly perforated water injection pipe, and the kettle is replenished with water at constant pressure by an ISCO pump. Three water injection pipes are covered with uniformly perforated panels to build up the bottom water of the reservoir instead of point injection, which eliminates the risk of congealing into the kettle caused by bottom water injection. The advantage is that it eliminates the risk of bottom water injection causing tapering. A gas valve at the top of the kettle is connected to a gas pipeline, to which a small condensing unit is added, and the lower part of the unit is connected to a water collection device. A flow meter is connected to the end of the pipe to determine the rate of gas collection and to count the volume of gas collected (Figure 2).
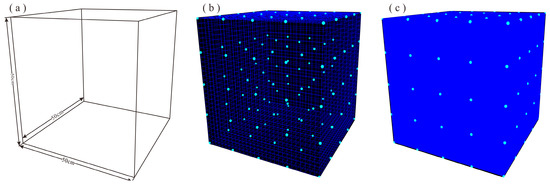
Figure 1.
Geometric parameters and characteristics of the physical model of the water control process (a) Model geometric parameters; (b) Model measurement point grid; (c) Model saturated water.
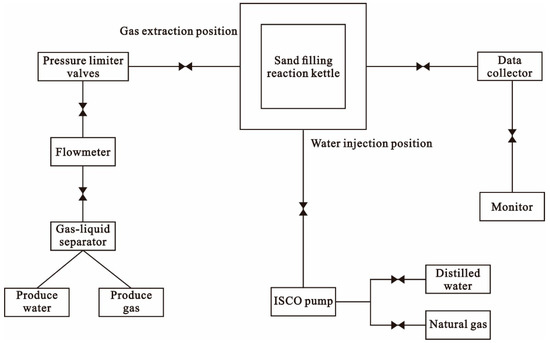
Figure 2.
Connection diagram of the experimental device for water control process.
The model is established based on sand filling, and its advantages are mainly reflected in the following three aspects: real-time monitoring of gas and water distribution in the kettle body is realized through visualization software version 2.0 to depict the bottom water coning process; compared with the core experiments, the sand filling experiments with a larger scale can maximally increase the saturation measurement points according to the experimental requirements to improve the accuracy of the model in the depiction of the characteristics of the gas and water distribution in different periods; the experiments can establish multiple types of fractures and their spatial combinations based on the gas field reservoir fractures characteristics; the experimental results are more in line with the actual gas field production relationship. The experiment can establish various types of fractures and their spatial combinations according to the characteristics of gas field reservoir fractures, and the experimental results are more in line with the gas-water relationship in the actual production of the gas field.
2.2. Experimental Model Design
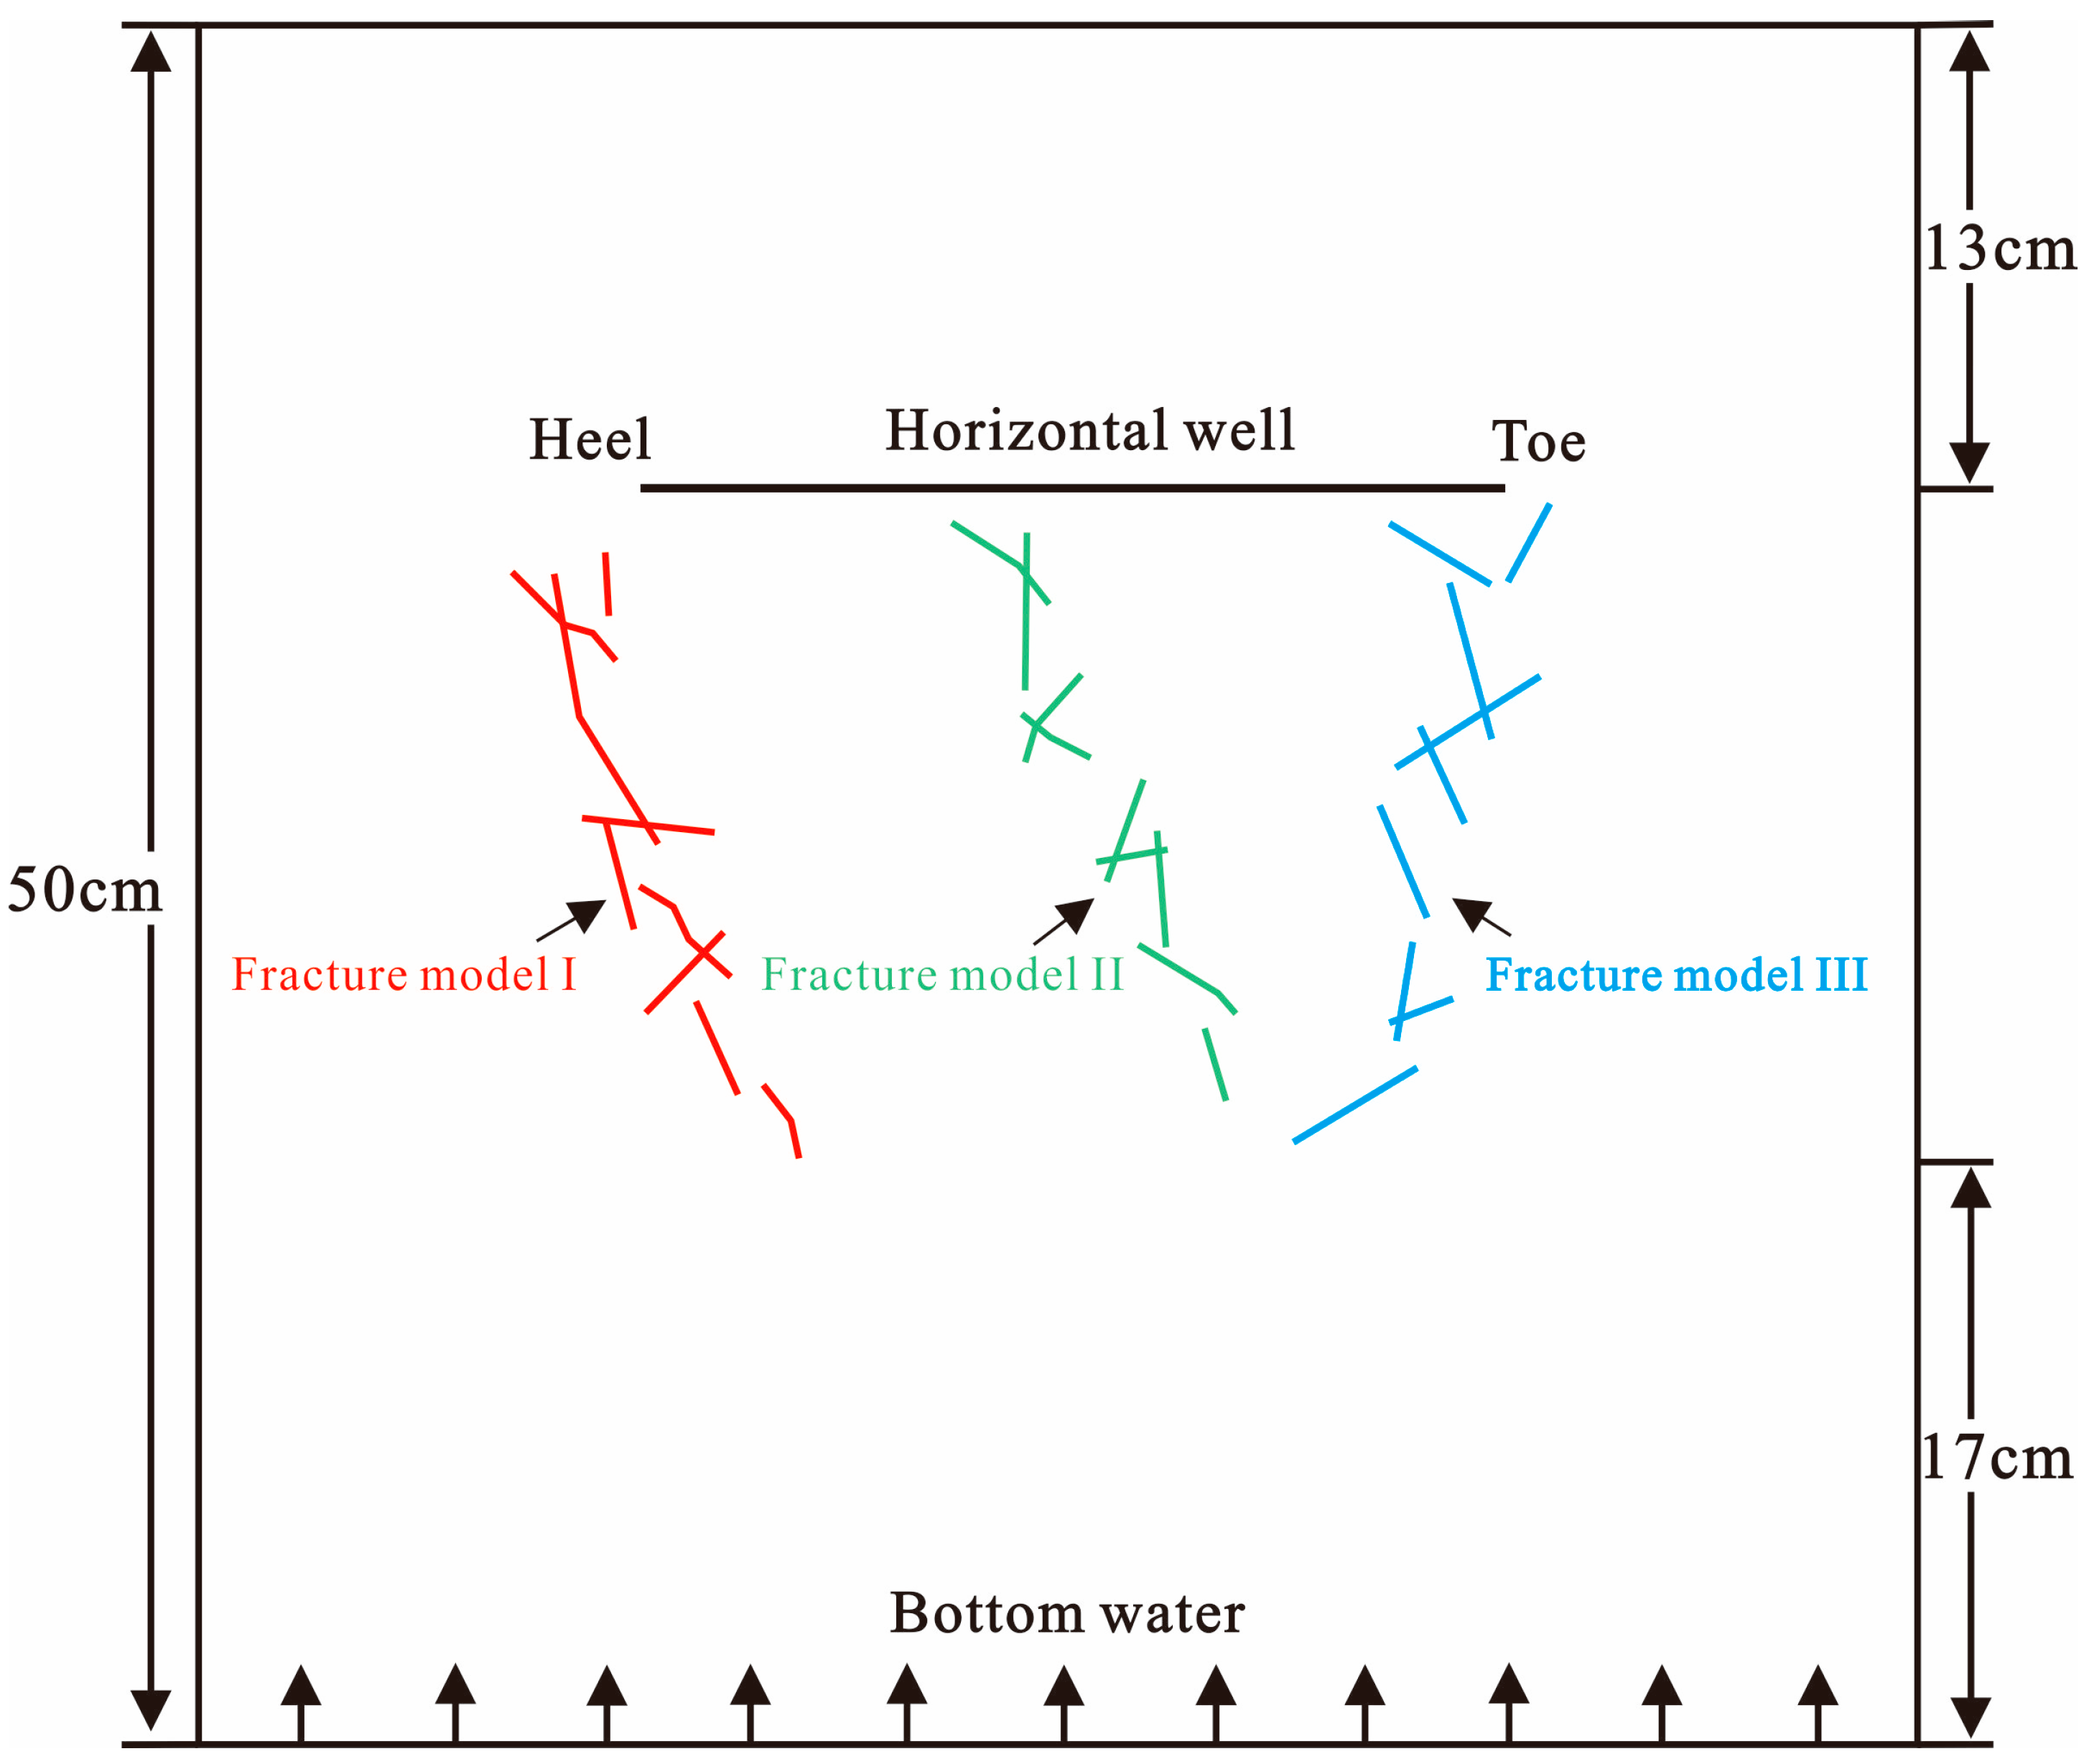
Based on different stages of physical simulation experiments. First, a sand filling model was established based on the gas field reservoir characteristics, on the basis of which fracture setting, fracture filling, compaction of the model sand body in segments, well placement, kettle sealing, gas injection, and equipment connection were carried out. The laboratory utilizes the wet filling method to fill, and the experimental model is designed with three fracture zones, which are located in the heel, middle, and toe of the horizontal well. The fractures were manually cut for ceramic filling (Figure 3), and the production horizontal wells were steel tubes made of carbon steel with an inner diameter of 0.3 cm, an outer diameter of 0.5 cm, and a length of 25 cm. The horizontal wells were located at a distance of 13 cm from the top of the model. The horizontal well is divided by two fracture zones in the center and toe, and the horizontal section can be divided into four segments. The width of the fracture zones is about 3.5 cm, and the density of the sieve tube eyelets in the horizontal wells in the two fracture zones is 1/cm. The density of the sieve tube eyelets in the other locations is 3/cm.
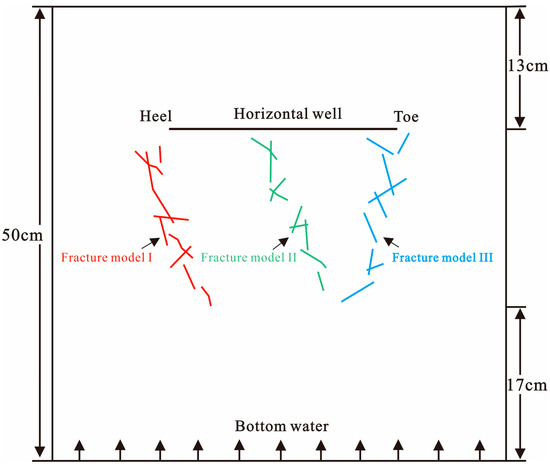
Figure 3.
Physical model fracture distribution characteristics.
The water inside the model was expelled by experimentally injecting CO2 gas at the top until the model was free of water and the bound water saturation was approximately 20%. The water saturation was collected every 5 min during the experiment, and the gas and water yields were recorded. The gas and water distribution characteristics of different profile locations in each time period were saved by 3D visualization software version 2.0 (self-developed software version 2.0 capable of analyzing and mapping the gas and water data collected by the model) until the water content at the output end stopped at 98%. The production time and gas-water saturation field were recorded when water started to come out of the extraction channel, and the gas-water interface and location of water production were determined at this time.
3. Physical Simulation Experiment Results
In this paper, two groups of physical simulation experiments, based on the simulation results of the bottom water cone into the process, gas-water distribution characteristics, gas production and water production, and other indicators, are carried out to carry out a comparative analysis and complete the evaluation of the effect of water control on the process.
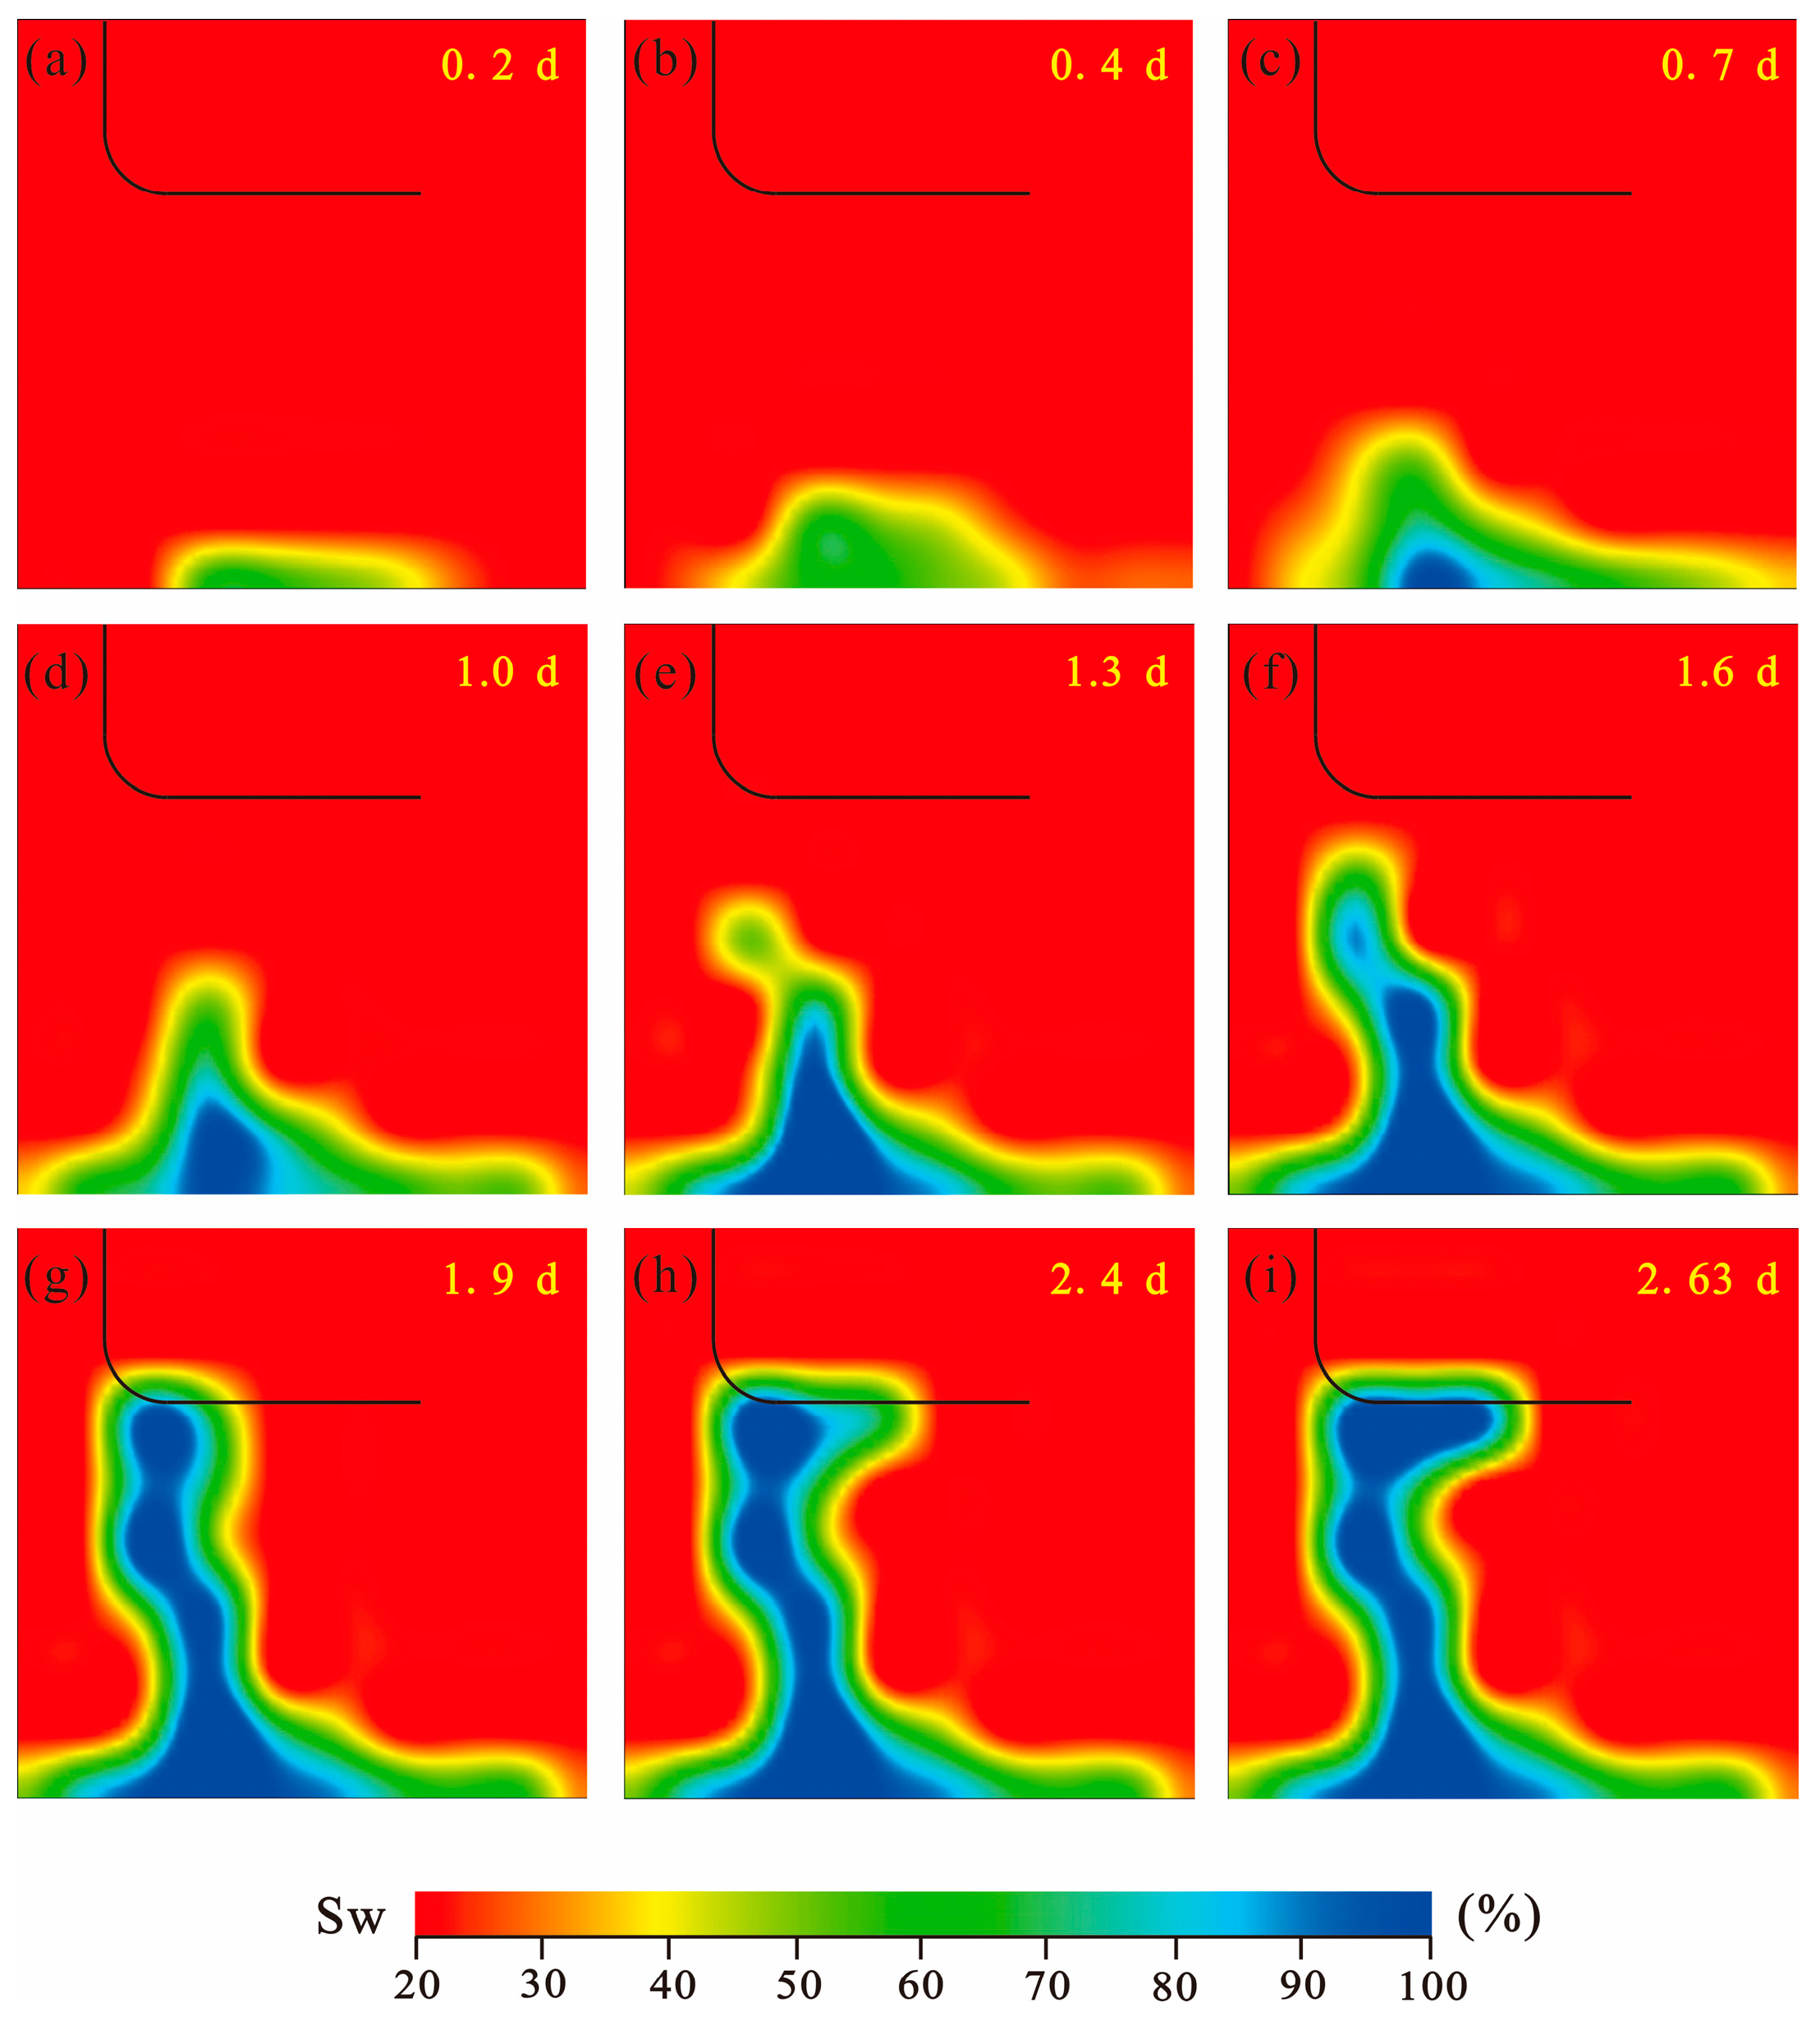
Model I shows the elastic production results of the implementation of the no-control water process. As the gas well production proceeds, the bottom water coning process can be divided into three main phases, which are: the bottom water rising phase (Figure 4a–c), the bottom water-connected fracture phase (Figure 4d–f), and the water flooding phase of the gas well (Figure 4g–i). At the beginning of production, bottom water started to rise, but a water cone had not been formed yet, and at this time, the fracture had little effect on the bottom water rising capacity because it was not connected to the fracture (Figure 4a). After 0.7 d of production, the water ridge began to form and was characterized by a clear heel cone advance (Figure 4b,c). In the middle of production, a water cone is formed in the heel of the horizontal well, and the rate of bottom water coning-in increases. After 1.3 days of production, bottom water began to connect the first fracture zone in the fracture model (Figure 4e), causing bottom water to transport upward along the fracture zone and changing the water cone morphology (Figure 4f). Later in production, as production time increases, bottom water rises to the heel of the horizontal well, and the horizontal well begins to produce water (Figure 4g). The model produces until 2.63 d, when water flooding occurs in the horizontal section, and production eventually stops (Figure 4i).
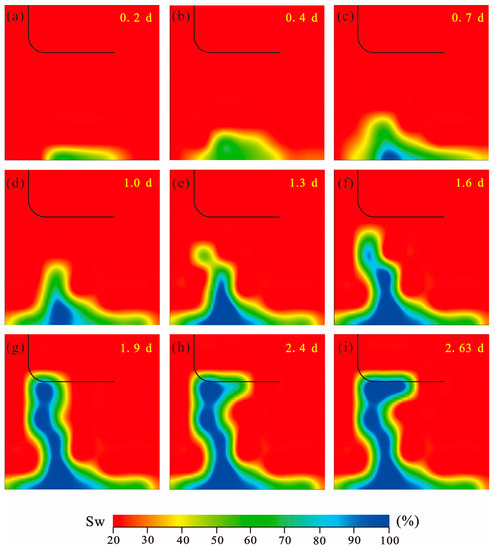
Figure 4.
Characteristics of the bottom water cone inlet and gas-water distribution of the uncontrolled water process. ((a–i): Characteristics of modeled gas-water distribution at different production times).
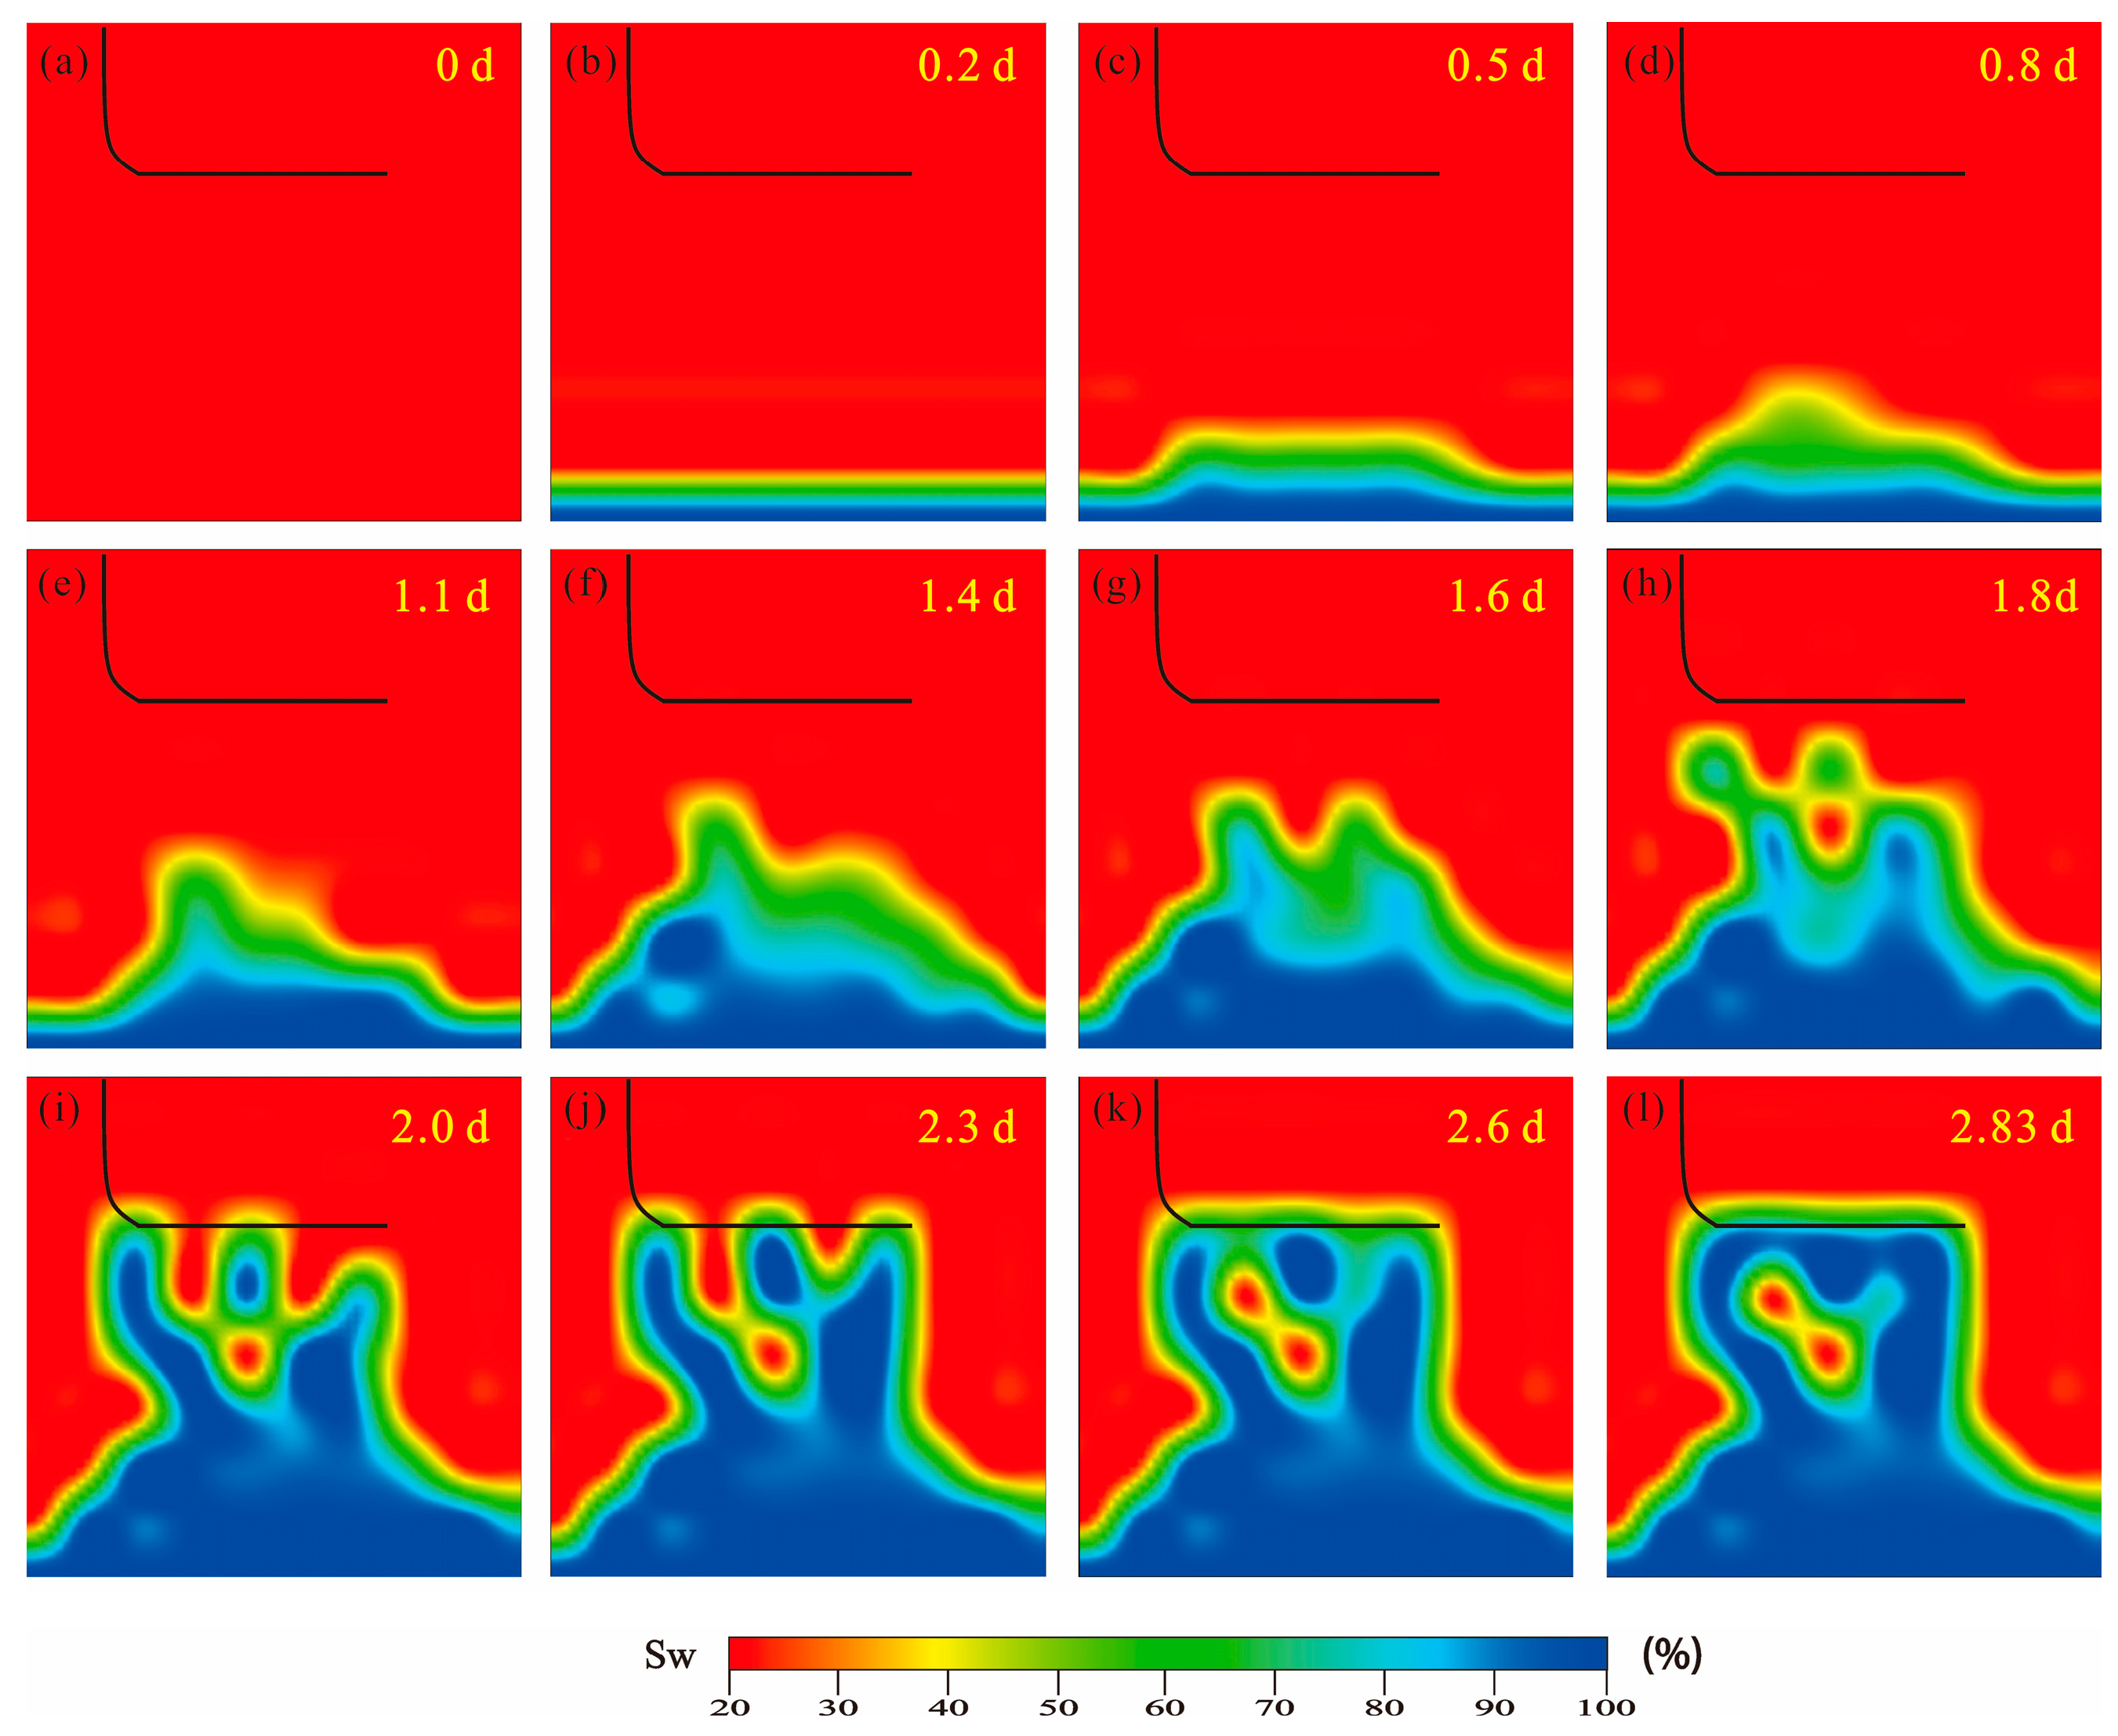
Model II implemented a combination of density-segmented sieve tubes and continuous packer water control processes based on Model I. The Model II is a combination of a density-segmented sieve tube and a continuous packer water control process. The simulation results show that the results of the bottom water condensing process are similar in both models. It is also divided into three stages: the bottom water rising stage, the bottom water connecting fracture stage, and the gas well flooding stage. However, the bottom water convection speed and transportation path are obviously different. This results in a large difference in the dynamic distribution characteristics of gas and water in the production processes of the two groups of models.
During the early stages of production, Model II begins to form a relatively stable air-water interface (Figure 5b). Subsequently, a relatively gentle water ridge on the top surface was formed, and the width of the ridge was similar to the length of the horizontal section (Figure 5c). This indicates that the production and water control effects of the horizontal well at this time are relatively satisfactory, delaying the formation of the water cone. However, after about 0.8 d of production, the water cone started to form below the heel of the horizontal section (Figure 5d). The cone-in rate of bottom water was slower relative to Model I because it had not yet connected to the fracture (Figure 5e). In the second stage, after 1.4 d of production, the bottom water connects to the first fracture zone of the fracture model (Figure 5f). At this point, the ridge continues to rise gently and connects to the second fracture zone in the center, forming a “double ridge model” (Figure 5g). After that, the upward transportation characteristics of the bottom water are deformed by the two fractures, and a “water lock” phenomenon is formed (Figure 5h). In the third stage, water starts to be seen in the heel and center of the horizontal well, and the bottom water starts to connect to the third fracture in the toe of the horizontal section and starts to cone upward along the fracture (Figure 5i). Influenced by the third fracture, the toe of the horizontal section starts to see water (Figure 5j). At this point, the horizontal well remained at some capacity until the water content continued to increase throughout the horizontal section location. The horizontal well ceased production after production reached an average of over 98% after 2.83 d.
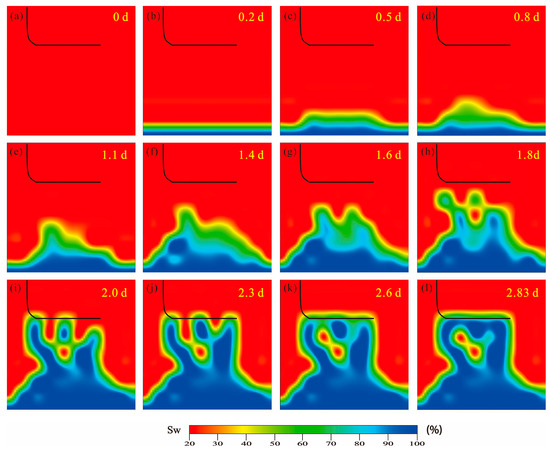
Figure 5.
Characteristics of bottom water cone inlet and gas-water distribution after the implementation of the water control process. ((a–l): Characteristics of modeled gas-water distribution at different production times).
The water production results of Model I and Model II indicate that the combination of variable-density segmented screen tubes and continuous packers has some water control capability.
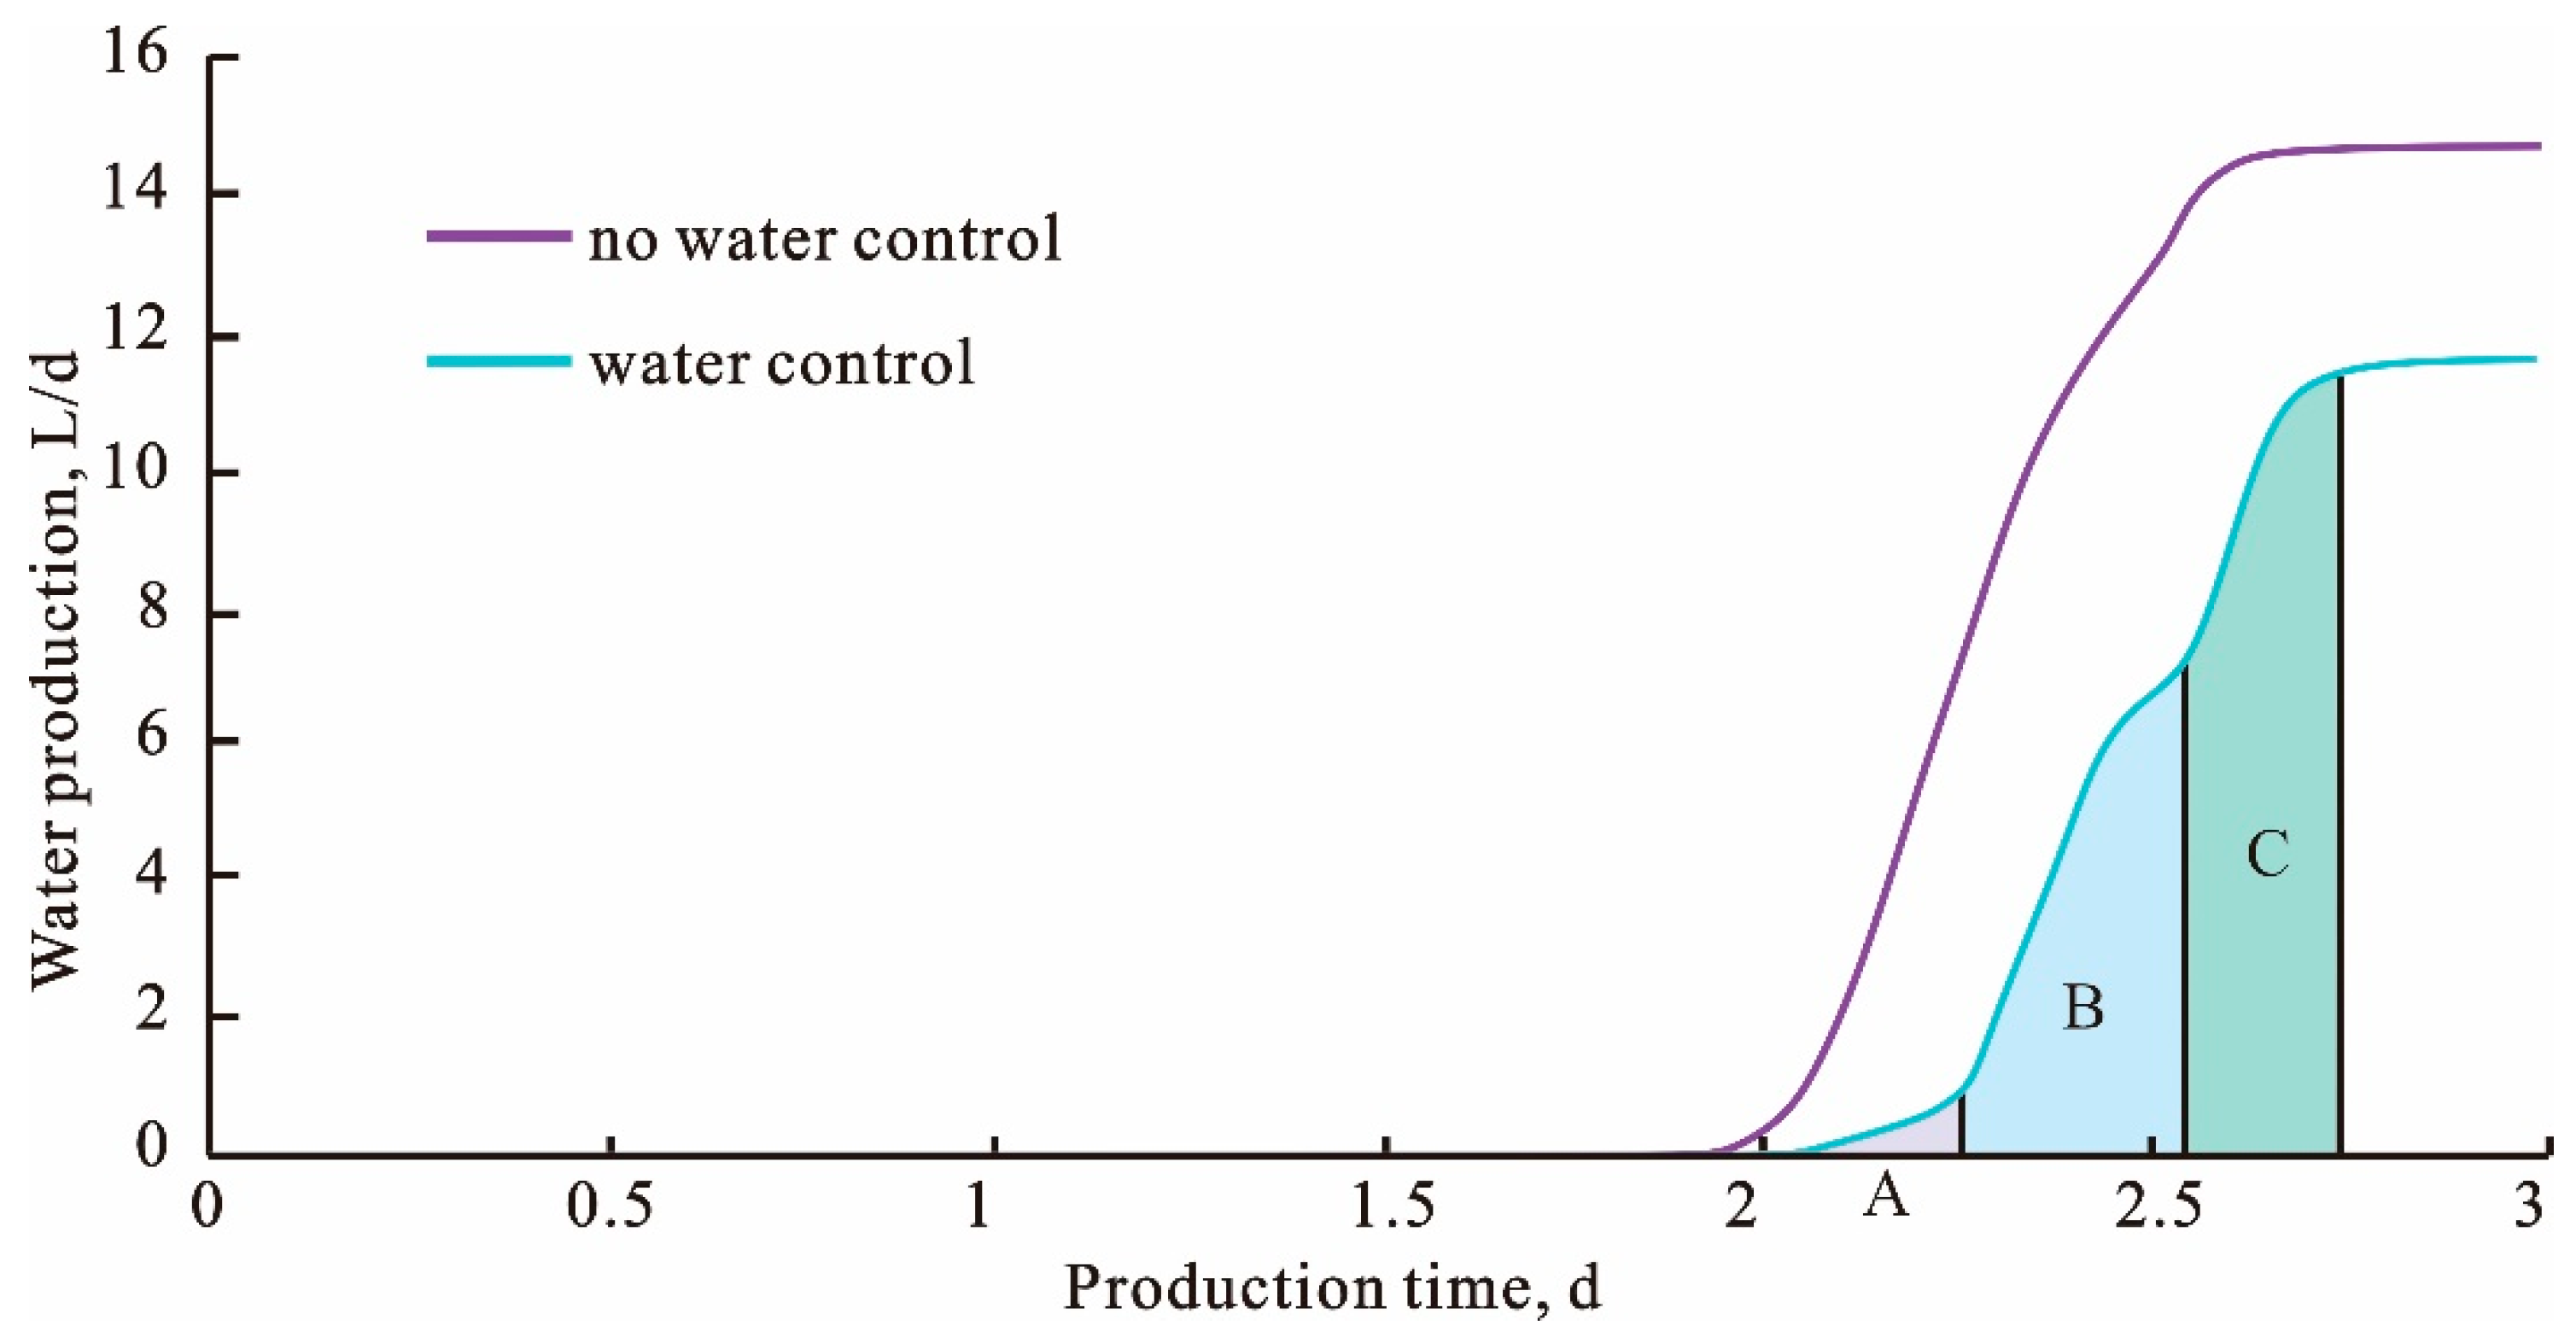
Model I started to produce water after about 1.9 days of production, and the water production time of Model II was about 2.03 days after the start of production. Therefore, the water-free gas production period was extended by about 6.84% after the implementation of the water control process. In terms of total production time, Model I stopped production after 2.63 days of production when the water content reached 98% or more, and Model II produced for 2.8 days, which prolonged the total production time by about 6.46% (Figure 6).
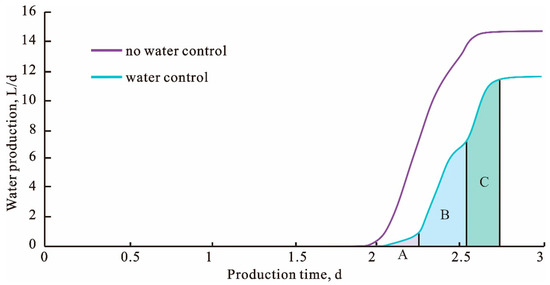
Figure 6.
Characteristics of the water production curve before and after the implementation of the water control process.
4. Discussion
The design of variable-density segmented screen tubing with low-density boreholes at the location of horizontal well fracture development and high-density boreholes at the location of non-fracture development controls the bottom water cone inlet capacity to a certain extent and slows down the water production time of the horizontal well by 6.84%. According to the water production curve, after the implementation of the water control process, Area A is the bottom water transportation along the first fracture strip to the heel of the horizontal well, where the water production starts to rise. The common boundary between area A and area B is that the slope of the water production curve increases after the bottom water is transported along the second fracture strip to the middle of the horizontal well (Figure 6). At this time, the water saturation in the middle of the horizontal well increases to about 90%. However, the growth rate of water production at this stage is still lower than that without water control measures. Area C, which represents the third fracture zone in the toe of the horizontal section, began to produce water in large quantities. After the bottom water reaches the horizontal well through each fracture, the continuous packer starts to play the role of water control. However, as the water volume of the horizontal well increases continuously and exceeds the water-blocking capacity of the continuous packer, the water production will rise rapidly. The reason for the difference in water production between regions is due to the different times when the bottom water reaches the horizontal well. Therefore, the time to break through the water-blocking capacity of the continuous packer is also different. However, affected by the water control effect of the continuous packer, the overall daily water production after water control is lower than that before water control (Figure 6).
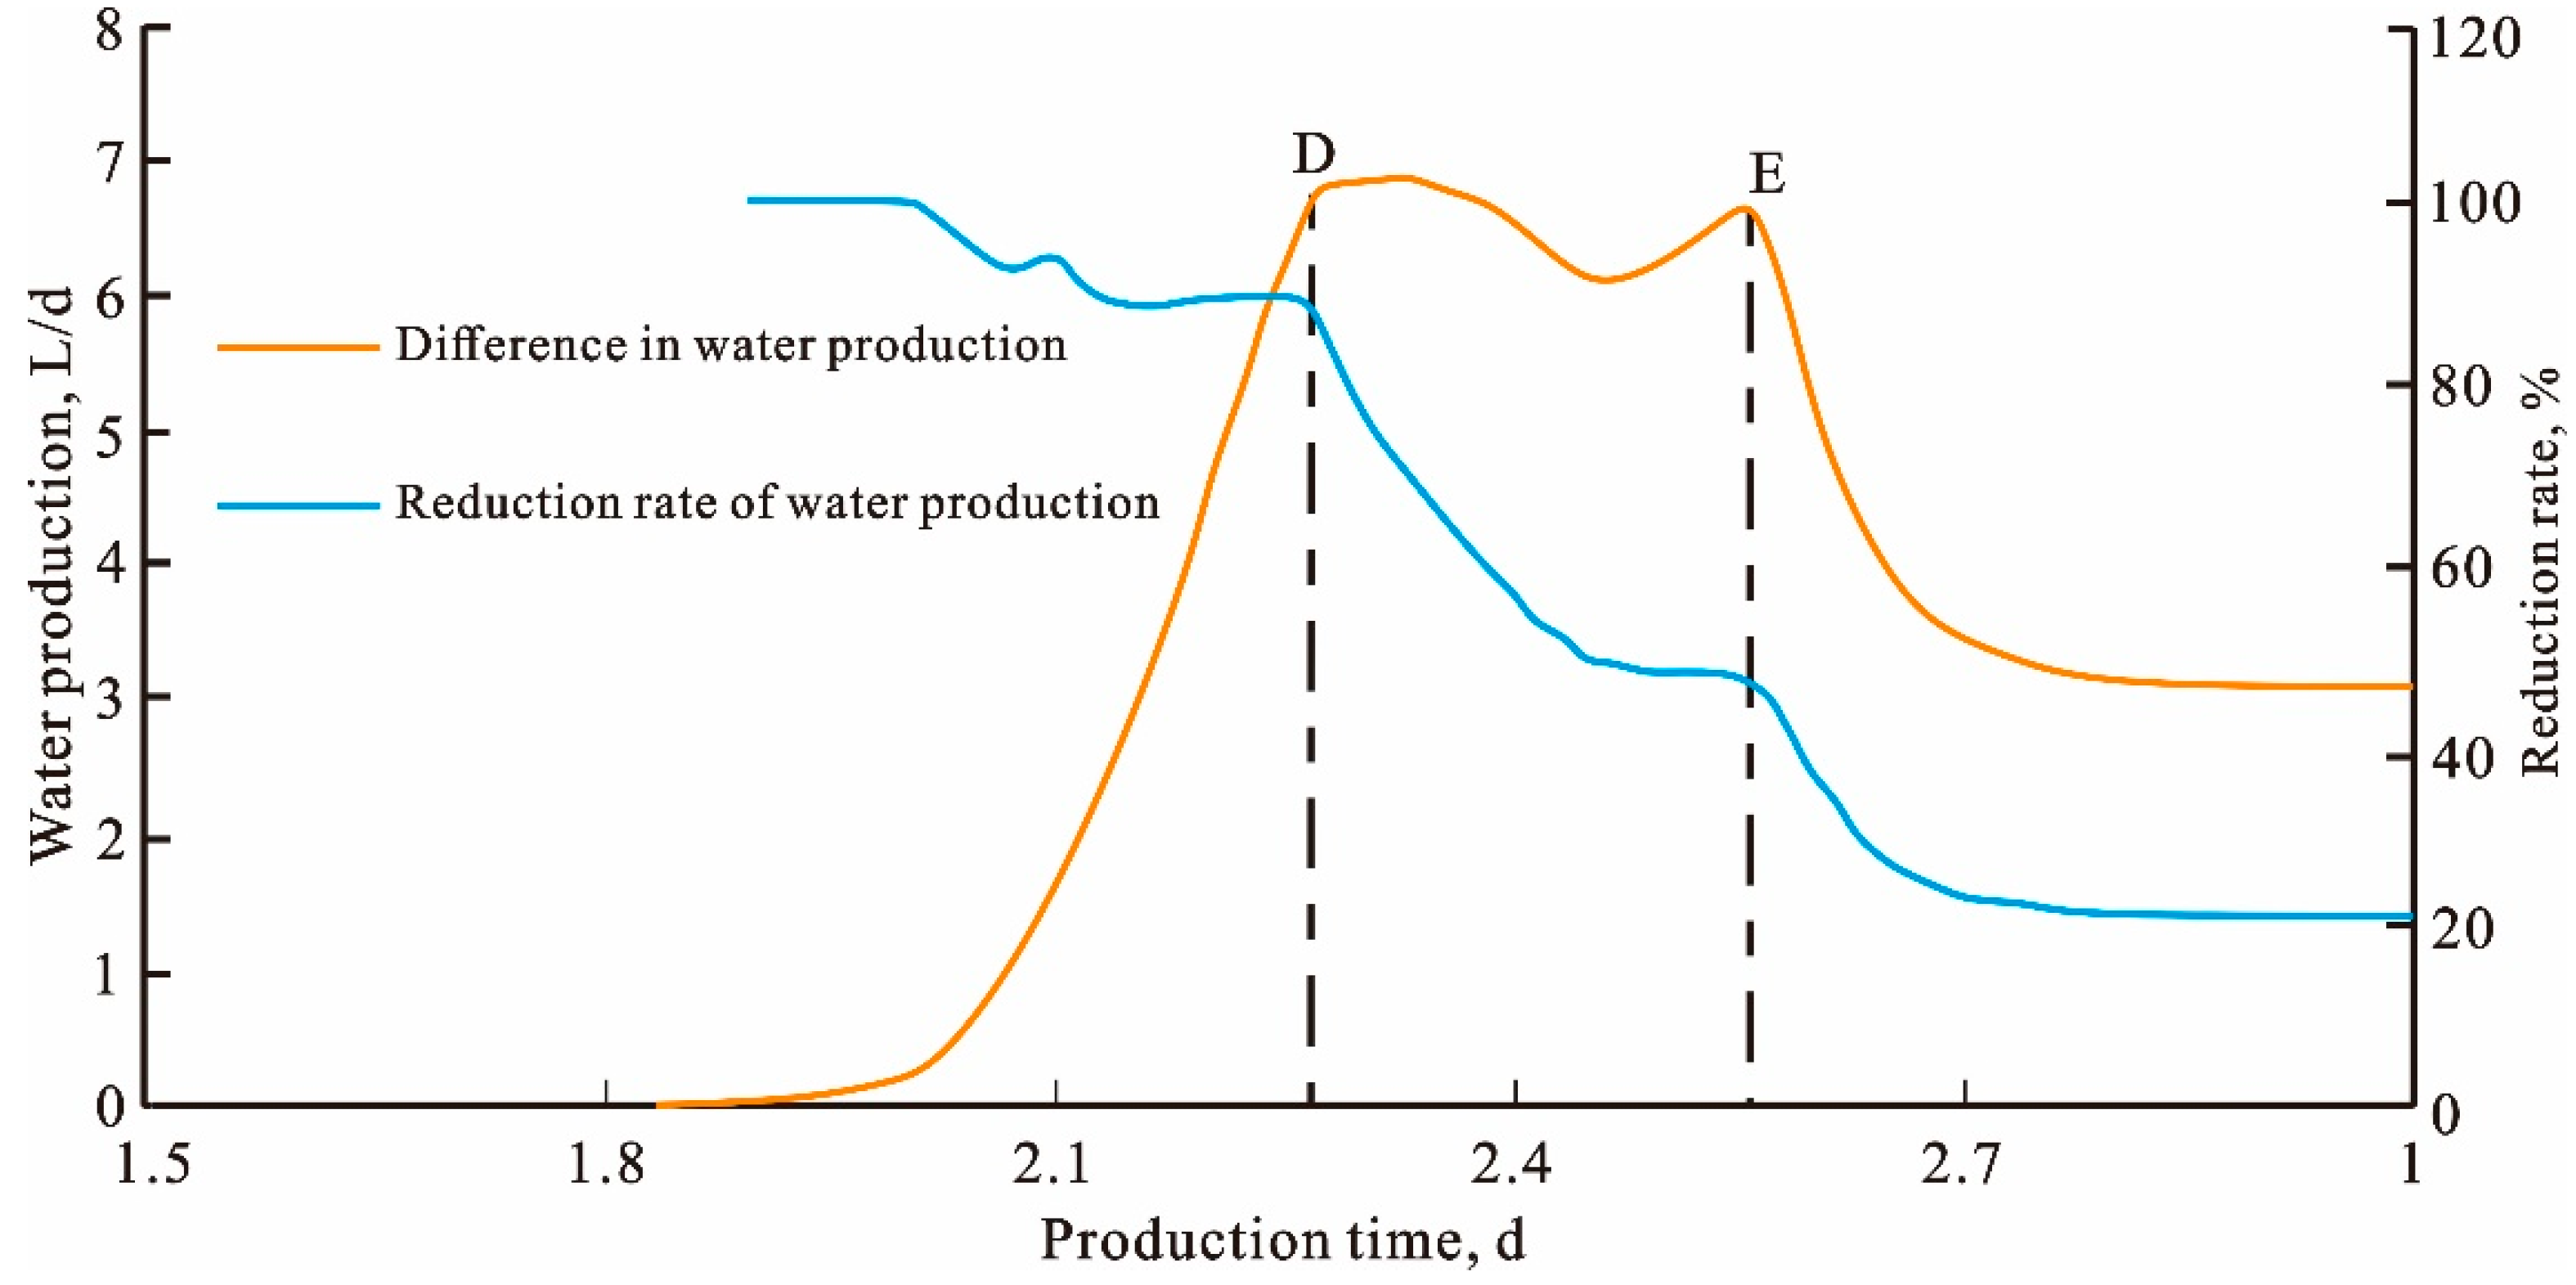
The water control effect of the variable-density segmented sieve tube is mainly reflected in the delayed formation time of the water cone. It also ensures that the water body has a relatively balanced propulsion capacity throughout the horizontal well. After the bottom water is connected to the fracture, the water control ability of the screen tube decreases, which is mainly manifested in the phenomenon of “air lock” below the horizontal well (Figure 5h–l). The water-control effect of the continuous packer is mainly manifested in the water-blocking ability of the bottom-water cone in the horizontal section. The daily water production in Model II decreased substantially compared with Model I, with a maximum decrease of one time at the beginning of the water encounter. Subsequently, the water control capacity gradually decreased. The peak of the daily water production decrease occurs in the middle of the horizontal section after the second fracture connects to the bottom water, and the daily water production decreases by about 6.9 L/d. The curves of the decrease in water production and the percentage of the decrease show that the cut-off point of the water control capacity decreases at D and E. D is the inflection point of the second fracture zone in the middle of the horizontal well after the water is seen in the middle of the horizontal well, and E is the inflection point of the third fracture zone in the toe of the horizontal well after the water is seen in the toe of the horizontal well (Figure 7). The ability of the combined water control process to control water is minimized when bottom water connects to the horizontal well through the third fracture. The water production of Model II after shutdown is reduced by about 3.1 L/d relative to Model I. The reduction ratio is about 21%.
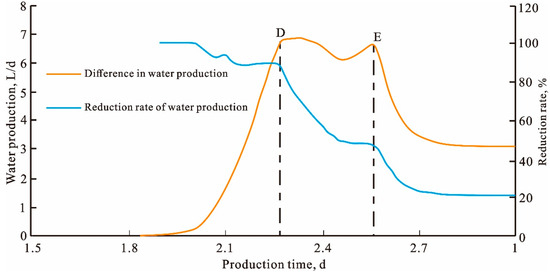
Figure 7.
Amount and percentage of reduction in daily water production after the implementation of the water control process.
We find that before the inflection point D appears, the horizontal well is in the initial water production stage. At this time, the continuous packer is directly blocking the water production location. Horizontal wells can still continue to produce without a water-producing location, so the water production is low and the gas production does not change much. As for the natural extraction model (Model I), the water production is in a stage of rapid increase at the same time. As production proceeded, the difference in water production between the two models became larger and larger, and the difference in water production increased from 0 L/d to 7 L/d. Therefore, the percentage of reduced water production in the water control model was also maintained in the range of 90–100%. Until production reaches 2.2 d, bottom water reaches the middle of the horizontal section through the second fracture zone, and inflection point D appears. The water-control model starts to enter the high water content stage, and the difference between the water production and the natural production model is maintained at a relatively stable state of about 6.2–7 L/d. When the bottom water connects to the third fracture zone, the inflection point E appears. The horizontal section of Model II starts to enter the water flooding stage until the gas production reaches 0. At this time, both models produce water completely. However, because the continuous sealing body of Model II still has some ability to prevent water from flowing into the horizontal section, Its water production is lower than that of Model I, but the difference in water production and the ratio of the difference tend to be constant. The difference in water production is 3.1 L/d, and the reduction ratio is about 21%.
The two sets of simulation results verified the water control ability of the combination process of variable-density segmented screen tubing and continuous packer in fracture-development gas reservoirs. However, the water control ability of the combined process decreases with the increase in length of water seen in horizontal wells, and the water control process ability is the worst in the late production period of horizontal wells. Due to the difficulty of water control in fractured gas reservoirs, the seepage law inside the fractures is complicated, and the distribution characteristics of the fractures affect the bottom water transportation path. In this paper, the influence of sieve tube density at fracture strips on the seepage capacity of water in fractures has not been carried out in terms of mathematical model analysis. This part will be continued in subsequent research, and the understanding of this research can be used as a verification of the theoretical analysis results.
5. Conclusions
- (1)
- It is difficult to control water in fracture-type gas reservoirs. Before the bottom water connects to the fracture, the reservoirs with consistent pore permeability characteristics will still condense into the following part. After the bottom water connects to the fracture, the transportation direction will be affected by the distribution characteristics of the fracture, and once the bottom water connects to the fracture under the condition of no water control, it will rapidly cone into the production well section, resulting in water discharge.
- (2)
- The combination of variable density segmented screen tubing and continuous packer water control process is mainly implemented in fractured gas reservoirs to reduce the bottom water coning ability at the early stage of production. After seeing water, the continuous packer reduces the capacity of bottom water flowing into the well by blocking. Other positions where water is not seen continue to produce, further equalize the gas-water interface, maximize the total production time, and have certain water control ability in fractured gas reservoirs.
- (3)
- After the implementation of the water control process, the water-free recovery period of the fractured gas reservoir was extended by about 6.84%. As the length of water production in the production well section increases, the distal water control ability of the variable density segmented screen tube begins to weaken. At this time, the water control effect of the combined water control process is closer to that of a single continuous packer blocking and controlling water. As a result, the water control capacity gradually decreases, and the total production time is extended by about 6.46%.
Author Contributions
Conceptualization, D.W. and Z.L.; methodology, D.W. and H.Z.; validation, S.L. and Y.X.; formal analysis, D.W. and Z.L.; investigation, Y.L.; resources, J.L.; data curation, F.Y.; writing—original draft preparation, D.W.; writing—review and editing, D.W. and X.L.; supervision, D.W.; funding acquisition, Z.L. and Y.L. All authors have read and agreed to the published version of the manuscript.
Funding
The authors are grateful for Hainan province major science and technology project (ZDKJ2021025), Heilongjiang Province Key Research and Development project (GZ20210015), Heilongjiang Province Joint Guide Fund project (LH2021E017), Northeast Petroleum University start-up funding project for talent introduction and scientific research project (1305021856), and the College of Petroleum Engineering excellent scientific research talent cultivation project (15041260507).
Data Availability Statement
Not applicable.
Conflicts of Interest
The authors declare no conflict of interest.
References
- Muhammad, A.Q.; Yus, D.C.; Wahid, A.B.; Kinza, Q.; Moonyong, L. Coal to clean energy: Energy-efficient single-loop mixed-refrigerant-based schemes for the liquefaction of synthetic natural gas. J. Clean. Prod. 2019, 211, 574–589. [Google Scholar]
- Kathe, M.V.; Empfield, A.; Na, J.; Blair, E.; Fan, L.S. Hydrogen production from natural gas using an iron-based chemical looping technology: Thermodynamic simulations and process system analysis. Appl. Energy 2016, 165, 183–201. [Google Scholar] [CrossRef]
- Gong, N.; Ma, Y.W.; Li, J.; Zhang, Q.L.; Xiao, W.F. Study on the water control technology in horizontal openhole wells of Bohai oilfield. China Offshore Oil Gas 2020, 32, 136–142. (In Chinese) [Google Scholar]
- Wu, S.W.; Wan, X.J.; Zhou, H.Y.; Yuan, H.; Li, Q.T. Application of Continuous Packer Water Control Technology in Offshore Oilfield. Drill. Prod. Technol. 2021, 44, 47–51. (In Chinese) [Google Scholar] [CrossRef]
- Shan, F.; Huang, S.; He, C.; Zhao, L.; Xu, A. Optimization Model of Horizontal Wells with ICD Water Control Completion in Bottom Water Reservoirs. In Proceedings of the International Field Exploration and Development Conference 2018; Lin, J.E., Ed.; Springer: Singapore, 2020; pp. 1479–1487. [Google Scholar]
- Wu, Q.; Ge, J.; Ding, L.; Guo, H.; Wang, W.; Fan, J. Insights into the key aspects influencing the rheological properties of polymer gel for water shutoff in fractured reservoirs. Colloids Surf. A Physicochem. Eng. Asp. 2022, 634, 127963. [Google Scholar] [CrossRef]
- Zhang, J.B.; An, Y.S.; Wang, H.L.; Xiong, M.S.; Li, Q.Q. Study on numerical simulation method for production performance of ICD completion with continuous packer in horizontal wells. China Offshore Oil Gas 2021, 33, 121–125. (In Chinese) [Google Scholar]
- Ahmadi, M.A.; Ebadi, M.; Hosseini, S.M. Prediction breakthrough time of water coning in the fractured reservoirs by implementing low parameter support vector machine approach. Fuel 2014, 117, 579–589. [Google Scholar] [CrossRef]
- Zhang, D.; Zhang, L.; Tang, H.; Yuan, S.; Wang, H.; Chen, S.; Zhao, Y. A novel fluid-solid coupling model for the oil-water flow in the natural fractured reservoirs. Phys. Fluids 2021, 33, 036601. [Google Scholar] [CrossRef]
- Ghosh, B.; Bemani, A.S.; Wahaibi, Y.M.; Hadrami, H.; Boukadi, F.H. Development of a novel chemical water shut-off method for fractured reservoirs: Laboratory development and verification through core flow experiments. J. Pet. Sci. Eng. 2012, 96–97, 176–184. [Google Scholar] [CrossRef]
- Kang, W.; Wang, J.; Ye, Z.; Gu, G.; Li, W.; Yang, H.; Li, Z.; Xu, H.; Lv, Z.; Sarsenbekuly, B. Study on preparation and plugging effect of sawdust gel particle in fractured reservoir. J. Pet. Sci. Eng. 2022, 212, 110358. [Google Scholar] [CrossRef]
- Mardashov, D.; Duryagin, V.; Islamov, S. Technology for Improving the Efficiency of Fractured Reservoir Development Using Gel-Forming Compositions. Energies 2021, 14, 8254. [Google Scholar] [CrossRef]
- Ben Hamida, M.B. Numerical analysis of tubular solar still with rectangular and cylindrical troughs for water production under vacuum. J. Taibah Univ. Sci. 2023, 17, 2159172. [Google Scholar] [CrossRef]
- Ben Hamida, M.B.; Alshammari, F.; Alatawi, I.; Alhadri, M.; Almeshaal, M.; Hajlaoui, K. Potential of tubular solar still with rectangular trough for water production under vacuum condition. Therm. Sci. 2022, 26, 4271–4283. [Google Scholar] [CrossRef]
- Pan, H. Status and Development Trend of Horizontal Well Water-control Completion Technology for Offshore Oilfield. Oil Field Equip. 2020, 49, 86–93. (In Chinese) [Google Scholar] [CrossRef]
- Shi, H.S.; Gao, Y.D.; Liu, J.; Zhu, J.Z.; Long, Z.L.; Shi, Y.L. Characteristics of hydrocarbon source-migration-accumulation in Huizhou 26 Sag and implications of the major Huizhou 26-6 discovery in Pearl River Mouth Basin. Oil Gas Geol. 2022, 43, 777–791. (In Chinese) [Google Scholar] [CrossRef]
- Wang, D.; Li, Y.; Ma, L.; Yu, F.; Liu, S.; Qi, T.; Jiang, S. Evaluation of the Effectiveness and Adaptability of a Composite Water Control Process for Horizontal Wells in Deepwater Gas Reservoirs. Earth Sci. 2022, 10, 906949. [Google Scholar] [CrossRef]
Disclaimer/Publisher’s Note: The statements, opinions and data contained in all publications are solely those of the individual author(s) and contributor(s) and not of MDPI and/or the editor(s). MDPI and/or the editor(s) disclaim responsibility for any injury to people or property resulting from any ideas, methods, instructions or products referred to in the content. |
© 2023 by the authors. Licensee MDPI, Basel, Switzerland. This article is an open access article distributed under the terms and conditions of the Creative Commons Attribution (CC BY) license (https://creativecommons.org/licenses/by/4.0/).

