Abstract
The role of demand response increases considerably with a higher share of renewable energy sources in the energy mix, characterized with more frequent energy market price fluctuations due to mismatch between uncontrollable weather-dependent production and currently relatively inflexible energy consumption. Reallocation of energy consumption from high-price hours to lower price hours helps to avoid extra costs to the entire economy and ensures the possibility to minimize fossil-based energy generation, therefore contributing to the achievement of zero-emission goals. The research aims to analyze involvement stimulating factors of demand-side management and demand response from the angles of various energy sector participants, identifying barriers and enabling a successful implementation and wider development of this important energy transition facilitator. The qualitative methods are as follows: utilizing the conducted literature review; and scrutinizing scientific publications, reports and legal acts. As a result, the authors point out the five main aspects: pricing mechanisms, incentives, technology, government regulation and customer awareness. Demand response requires spectacular human and technological resources and administrative, financial and educational efforts. However, the demand response addresses many challenges, such as cost savings, innovation, integration of renewable energy sources, effective, stable and safe power grid performance, reduced need for costly infrastructure modifications, and greenhouse gas emission reduction. The abovementioned benefits influence what the demand-response brings, and are crucial for modern society and a successful energy transition.
1. Introduction
The world’s energy experts recognize that it would be possible to considerably facilitate energy transition and move faster towards the largest share of renewable energy sources (thereafter—RES) in the energy portfolio, in case an adequate public involvement is ensured. Involvement is necessary both by implementing extensive energy efficiency measures and by actively engaging society in demand response (thereafter—DR) measures, by maximally adapting the energy user’s consumption to variable generation. Supporting the development of RES in the vicinity also ensures the shortest possible distance between generation and consumption, reducing economic and energy losses, both by offloading the centralized network [1].
The ability to clearly reflect data increases people’s trust, while trust and economic interest are the basis for the active involvement of energy users. If there is a financial interest, then the person agrees to share the data. It is essential to ensure that the different stages of the value chain of the energy ecosystem are interested in cooperating, and financial incentives based on market principles help to ensure this interest. For example, wind or solar farm communities produce energy, and thanks to aggregation services, residents are interested in participating in DR measures adjusting their consumption to the generation intensity pattern as the initiative provides a financial interest (usually in the form of savings on electricity charges), and the data provides the necessary process transparency [2].
In the past, DR programs were not widely used and served only as an additional tool for a power system management, which was not particularly implemented often during periods of rapid and large power growth. Extensive restructuring of the energy market, evolution of technology and IT sphere, as well as a greater experience gradually fostered the development of various automatic and safe DR control methods and their successful integration into electricity system operations. In addition, it ensured cost reduction of DR management and relatively quick and easy implementation, making it a modern and effective solution for improving the flexibility of the electricity system [3].
The role of DR in ensuring a resilient and sustainable energy system increases considerably with a higher share of RES stepping in the energy mix of regions. In general, RES are characterized with more frequent energy market price fluctuations due to a mismatch between uncontrollable weather-dependent generation and currently relatively inflexible energy consumption. Shifting the energy consumption from high-price hours to lower price hours not only helps to avoid extra costs to the entire economy, but also ensures the possibility to minimize fossil-based energy generation, therefore contributing to the achievement of ambitious zero-emission goals.
The main aim of the research is to analyze involvement encouraging aspects of demand-side management (thereafter—DSM) and DR from the perspective of different energy ecosystem participants, identifying existing bottlenecks for the wider development of this important energy transition facilitator.
As a result of the research, the authors point out the five main aspects influencing DR: types of pricing mechanisms, offered incentives, availability of technology, government regulation and customer awareness. DR requires spectacular human and technological resources, as well as administrative, financial and educational efforts from all the participants. However, the DR implementation benefits and the wide spectrum of challenges that DR addresses, such as cost savings, innovation driving, enabling the integration of RES, effective, stable and safe power grid performance, a reduced need for costly infrastructure modifications, and greenhouse gas emission reduction. The abovementioned benefits influence what the demand-response brings, and are crucial for modern society and a successful energy transition. The main innovation of this paper is delivering a comprehensive system of the actors who are involved, or their potential involvement, in DSM interrelations, highlighting, in a structured way, their interests and limitations. The mapping of the actors and their interests ensures a highly valuable information for facilitating the mutual cooperation between parties, taking into account their commercial motivation, as well as providing, to the policy makers, the basis for a focused action plan to encourage a higher market-based activity in DSM, and therefore facilitating the energy transition.
2. The Nature of Demand-Side Management and Demand Response
Before diving into the layers of DR performance influencers and the coherence of their relationships, it is crucial to investigate the main characteristics and components of DSM and DR.
2.1. The Evolution of Demand-Side Management
In the late 1970s, the concept of DSM was introduced in Europe and the US with the main drivers being changes in the electricity grid, electrification progress, industrial development, technological evolution, increasing loads and the ageing of the existing electricity system [4]. Gellings and Chamberlin can be considered as the forerunners in DSM research, who primarily defined DSM as the planning and implementation of activities aimed at influencing consumers’ electricity consumption, resulting in a change in the utility’s load shape, i.e., a change in the time pattern and volume of the utility’s load [5,6,7,8]. In 1993, Gellings and Chamberlin refined the previous definition of DSM, emphasizing the inclusion of activities commonly referred to as load management, electrification, strategic growth or intentional market share gains [9].
In the 1970s and most of the 1990s, DSM was implemented by vertically integrated utilities in a structured and regulated environment. This began to change in the late 1980s and early 1990s, when the energy sector entered a process of restructuring and liberalizing energy markets, which was extensively studied by Joskow, as well as by Beesley–Littlechild [10,11,12,13]. The move away from standardized cost-of-service principles allowed electricity producers to sell electricity at market prices based on supply and demand interaction. At the same time, the restructuring process shifted responsibility for grid maintenance from the electricity utilities to the system operators, which reduced the incentive for traditional utilities to maintain demand management programs [13,14].
During the 1990s, the problems of climate change accelerated the evolution of energy efficiency and renewable energy in such a way that it emphasized the need for a flexible energy system, as well as a broadened and strengthened concept of DSM and DR. In 2000, the U.S. Department of Energy highlighted that DSM programs consist of electric service planning, implementation, and monitoring activities designed to encourage consumers to change their level and pattern of electricity consumption [15]. In 2010, Greening provided a relatively broad definition, emphasizing the changes in consumer electricity consumption in response to price, and the introduction of more energy-efficient technologies [16]. Eissa, based on the research of Isaksen et al., Ashok and Banerjee, and Effler et al., discussed load management and characterized it as the process of scheduling loads to reduce electricity consumption and/or peak demand, which can be achieved through load shedding and restoration, load shifting, installation of energy efficient processes and equipment, usage of energy storage, cogeneration and non-conventional energy sources, as well as reactive power control [17]. In 2011, the phenomenon of DSM was also explained by Kerr–Lemaire–Owen who added customer encouragement to modify patterns of electricity usage [18]. In 2015, the definition proposed by Warren reflects the aforementioned explanations and also includes the vector of energy policy towards the reduction of GHG emissions, the wider use of renewable energy sources, and maintaining the safe operation of the energy system [19].
According to the type of implementation, DSM is usually divided into two main categories: energy efficiency and DR (Figure 1) [14,17,20,21,22]. However, some authors, for instance, Stanelyte et al., based on Warren, also highlighted on-site back-up (storage, generation) as a separate category of DSM [4]. Strategic load growth was singled out separately in Lampropoulos et al.’s research [23], while Akbari–Dibavar et al., in addition to DR and energy efficiency, identified the following DSM categories: load growth, energy saving, demand shifting, spinning reserve, and virtual power plants [24].
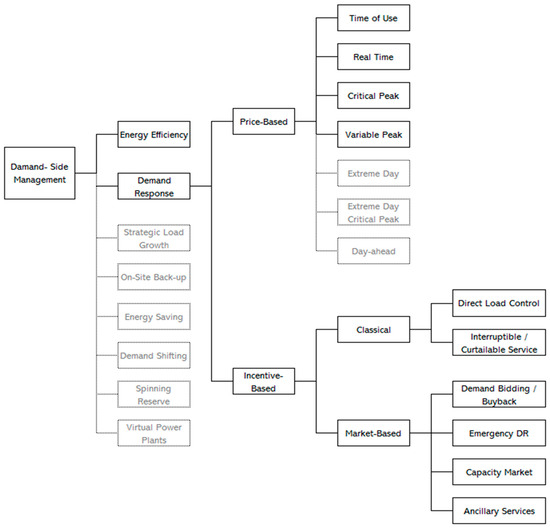
Figure 1.
Classifications of DSM and DR, based on the scope on the review.
The main characteristics of energy efficiency, which are common in the reviewed publications, are its orientation towards reduction of energy consumption by using energy-efficient technologies and equipment without diminishing comfort level, and its static nature, i.e., non-adaption to the signals of the energy system or the market [21,25,26,27,28]. Maintaining comfort level is a key aspect that distinguishes energy efficiency from energy saving. Moreover, energy efficiency measures are long-term oriented.
As part of the research project, the expert working group of the World Energy Council (WEC) have evaluated several energy policy transition scenarios up to 2050, such as Bloomberg, IPCC, IEA, IRENA, BP, McKinsey, DNV, Shell, OECD, Equinor and others. Despite different assumptions based on different methodologies and technological focuses, it can be seen that all of them, notwithstanding the positive trend of economic development and, consequently, the more intensive use of energy-intensive equipment and processes, predict a significant reduction in GHG emissions. The increasing energy demand is compensated by significant energy efficiency measures [1].
The research concludes that the main drivers of energy transition highlight electrification, decarbonization and energy efficiency. A large number of scenarios show the freedom of choice possibilities of each country’s energy system from the point of view of technology use. At the same time, when creating a balanced solution to the energy trilemma (energy affordability, security and sustainability), it is essential to take into account the peculiarities of each country, which determine the cost and safety parameters of the relevant renewable energy technology in the specific energy system. None of the scenarios believe that it is possible to achieve the ambitious net-zero aims, thus continuing the “business as usual” approach. DR and connectivity, together with storages, carbon pricing and digitalization, are the new strong indispensable players to succeed [29].
2.2. Demand Response Products and Services
DR is a more flexible tool compared to energy efficiency. In 2006, the U.S. Department of Energy defined electricity DR as “changes in electric use by demand-side resources from their normal consumption patterns in response to changes in the price of electricity, or to incentive payments designed to induce lower electricity use at times of high wholesale market prices or when system reliability is jeopardized [26]”. This definition was also supported by the Federal Energy Regulatory Commission in 2010 [30]. In 2007, Albadi and El-Saadany emphasized that DR includes all intentional changes in end-users’ electricity consumption patterns, which aim to change the timing, instantaneous demand level, or total electricity consumption [31]. In 2022, Morales–Espana et. al., as well as the International Energy Agency in the report on DR, provided its general explanation as shifting or reducing electricity demand with the aim of balancing the grid, and ensuring flexibility in wholesale and other electricity markets [21,32].
DR is a mechanism that responds to price and system signals, which can be implemented at different end-user scales and at different grid levels (system transmission, distribution, retail). DR has dynamic and event-driven nature and typically involves dynamic electricity pricing, contractual or voluntary curtailment. According to Bakr’s research, DR services can be classified differently depending on certain criteria. On the one hand, is to categorize by economic or market signals (e.g., high prices) and physical emergency signals (i.e., grid signals), whereas on the other hand, it is possible to classify the DR based on the services offered (e.g., power or ancillary services). DR programs can also be categorized based on the goals of program administrators (e.g., load shaping and congestion management) or based on the compensation they offer to program members (e.g., discounts, cheaper fares) [25]. One of the most common DR classifications is based on its stimulus or incentives. In this regard, DR can be (Figure 1):
- An implicit or price-based scheme in which the same time is self-dispatched or a load is controlled indirectly. Electricity consumers change or reallocate their consumption reflecting electricity price or cost signals. Electricity suppliers offer different pricing products that depend on time, for example, day and night prices or dynamic pricing based on wholesale market prices. As this is an indirect load control scheme, there is no two-way communication between consumers and operators, except a response of aggregated consumers, which can be measured by operators. Consumers make decisions individually, and in order to make them more efficient, smart metering and home energy management systems are required. The main purpose of these programs is to smooth the demand curve by offering a high price during peak periods and lower prices during off-peak periods [18,21,22,33,34,35,36].
- An explicit or incentive-based scheme, in which dispatchment is conducted by a third party classified as any of the following: transmission system operators, distribution system operators, or the utility or retailer of the energy user and a DR aggregator. An explicit DR scheme consists of direct load control and market-based mechanisms, which allow the trading of the participant’s dispatchable flexibility in energy markets. This DR case is based on two-way communication and agreements, which lowers the risk of response unpredictability but may affect the consumer’s independent decision and comfort level. Usually the incentive-based schemes are implemented by an aggregator [21,22,33,34,35,36].
Usually, when the end-users obtain the possibility to participate in explicit DR, they implement it through their supplier, who acts as an aggregator. The availability of independent aggregation—a compensation mechanism, the existence of flexible markets at the DSO level, accessible minimum bids, etc.—is determined by regulatory, technical and market factors. Figure 2 represents the development steps of small end-users from having explicit DR available to them to having at least primary legislation on independent aggregators, and finally to having independent aggregators of small end-users operating in the market (Figure 2).
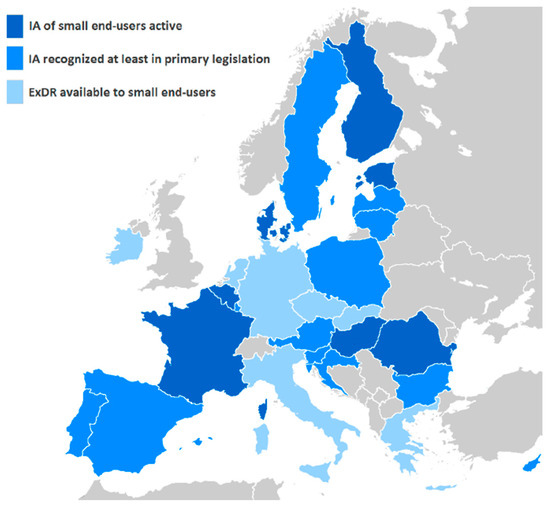
Figure 2.
Status of explicit DR and independent aggregators across the EU Member States in 2021 [37].
In 2021, the aggregation of end-users and their participation, at least at some level, is legally allowed and technically possible in 22 EU countries, although the availability of service is not equal to the actor’s activity in the market. However, the status of Independent Aggregators can be defined as a spectrum rather than a clear category, because the range of services and multitude of markets vary from one Member State to another at different levels of maturity.
Based on that, in 2021 there were only seven EU countries where independent aggregators of end-users exist and participate in at least one electricity market: Belgium, Denmark, Estonia, Finland, France, as well as Hungary and Romania, where the market was just emerging. Across the abovementioned countries, only in France do independent aggregators of end-users have access to all markets. Meanwhile, in Denmark, the high level of taxes makes the business case difficult for the independent aggregators. The DR development progress during the past five years has been the most remarkable in Croatia, Hungary and Estonia. The middle part between Austria and Sweden is extremely diverse and includes countries where end-users can aggregate through a comprehensive legal framework, but the market does not reflect the range of possibilities, as well as countries where aggregation of end-users is possible through their supplier, and countries where there are locally developed entities through which end-users can participate in the markets (Figure 3) [37].
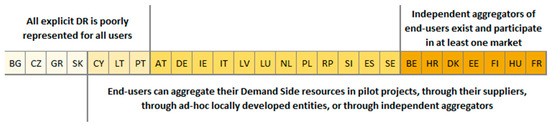
Figure 3.
Degrees of market representation for explicit DR across EU Member states in 2021 [37].
2.2.1. Price-Based DR Programs
The most common DR programs of a price-based scheme are time-of-use, real-time critical peak pricing and variable peak pricing (Figure 1) [20,23,38,39].
Time-of-use pricing (thereafter—TOU)—the program offers consumers time-differentiated electricity prices. According to the level of load consumption, the one-day horizon can be divided into several blocks of price levels (most often peak and off-peak hour prices, and prices in peak periods are higher than in other non-peak periods), which motivates consumers to move their flexible load from hours of high demand to hours of lower demand to reduce electricity costs. Consumers are aware of the prices for each period in advance. The purpose of this tariff development is to reflect the average cost of electricity in different periods. In practice, it is more often applied for medium and long-term load regulation.
Real-time pricing (thereafter—RTP)—within the framework of the program, variable hourly prices are determined for customers, which reflect the real electricity costs in the wholesale market. Program members are notified of prices a day or an hour in advance. This allows program participants to adjust consumption and change the electricity purchase price depending on the period.
Critical peak pricing (thereafter—CPP)—the program is based on a pricing mechanism that is offered when the operation of the power system is threatened and under critical peak load conditions. The purpose of the program is to motivate consumers to reduce or transfer consumption immediately but, more often, it is necessary to provide it for a short period of time. The program is activated during unexpected events or high wholesale electricity price jumps.
Variable peak pricing (thereafter—VPP)—the scheme can be considered as a combination of time-of-use and real-time pricing, because the different periods for pricing are defined and known for participants in advance (on-peak and off-peak hours), but the price for the on-peak period varies by utility and market conditions [40].
Alternatively, other DR price-based programs were pointed out; for example, Stanelyte et al. highlighted extreme day pricing, whereas Usman et al., based on Albadi et al., identified extreme day critical peak pricing. Assad et al. also mentioned day-ahead pricing [4,31,33,36].
2.2.2. Incentive-Based DR Programs
In regard to DR incentive-based programs, authors’ approaches differ. In some research, there were no additional classifications before final incentive-based pricing schemes, while other scientific works specified which programs refer to which market of services within the incentive-based program. Meanwhile, some publications extracted market-based programs as a separate group of DR programs. The authors decided not to extract market-based programs from incentive-based schemes, however, they believe that it is useful to explore this group separately to make the review more concrete and provide a foundation for discussing specific future research (Figure 1). The direct load control and curtailable or interruptible services are classified as classical incentive-based DR programs [20,41,42,43]:
Direct load control—the concept of the program allows its operator to freely and remotely manage participants’ power consumption in response to the current needs. The participants of this program usually are residential segment and small business.
Curtailable or interruptible services—this program offers its customers discounts on electricity bills or a lower electricity price, which are usually integrated into retail tariffs, in exchange for the reduction of participants’ power consumption. A concept of the program becomes relevant if its participants are large commercial and industrial customers.
Demand bidding, emergency DR, capacity market and ancillary services refer to market-based schemes in incentive-based DR categories [20,41,42,43]:
Demand bidding or buyback—the program is closely related to the electricity wholesale market because consumers submit their curtailment bids based on wholesale market price. The program is more suitable for large consumers, whose consumption is counted in megawatt hours, to meet the requirements of the wholesale market.
Emergency DR—the aim of the program is to ensure emergency power reduction, while the scheme’s participants receive incentive payments.
Capacity market—the concept of the program consists of guaranteed power curtailments for participants in order to replace traditional electricity generation resources. Customers usually receive the information of events the day before and receive up-front reservation payments or sanctions if they fail to implement the service when needed.
Ancillary services—the program expects the participants to bid load curtailments in power system support services and operating reserves. The incentive, in case the curtailment bid is accepted, is to pay the market price for participation.
Such a variety of DR schemes in liberalized market conditions means that there is a demand for these products and services. Demand can be considered as a driver of the market and product development. The factors that influence DR implementation and performance are investigated in the next chapter.
3. The Influencers of Demand Response Implementation and Performance
DR is a complex system and consists of many various players: service providers, schemes participants, policy makers, regulators, authorities, etc. Meanwhile, DR cannot be explored as a completely separate component amid modern, well-integrated energy systems. That is why it is also important to investigate the coherence of DR with other smart solutions and technologies. The following are the main influencers of DR implementation and performance (Figure 4):
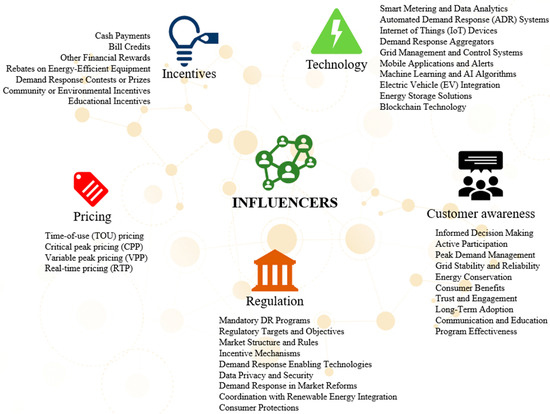
Figure 4.
The Influencers of DR implementation and performance.
- The type of pricing mechanism used can have a significant impact on DR participation. TOU pricing, which charges different rates for electricity at different times of the day, is one of the most common DR pricing mechanisms. Other pricing mechanisms include CPP, VPP, RTP [44,45].
- Incentives can be used to encourage consumers to participate in DR programs. These incentives can include cash payments, bill credits, or other rewards [32].
- The availability of technology can also influence DR implementation and performance. For example, smart meters can be used to track and manage energy consumption, which can make it easier for consumers to participate in DR programs [46].
- Government regulations can also influence DR implementation and performance. For example, some governments require utilities to offer DR programs to their customers [32,47].
- Customer awareness of DR programs is also important. If consumers are not aware of the benefits of DR, they are less likely to participate in those programs [48].
By effectively considering these influencers, utilities and policymakers can design DR programs that are attractive and beneficial to both consumers and the overall energy system. Next, the article describes the implementation of each initiative, its barriers, enables and real examples.
For easier comprehension of further discussion, the authors introduce the summary of main enables and barriers of DR implementation and performance influencers (Table 1).

Table 1.
Main enables and barriers of DR implementation and performance influencers.
More detailed explanations of the abovementioned enables and barriers for each of the influences are provided in the following subchapters.
3.1. Pricing
The selection of a pricing mechanism can exert a notable influence on the level of participation in DR programs. TOU pricing, an extensively employed approach, involves varying electricity rates based on specific time periods during the day [49]. Other pricing mechanisms encompass CPP, VPP and RTP, each offering distinct incentives for consumers to adjust their electricity consumption patterns in response to changing grid conditions [50]. TOU is a pricing mechanism that involves charging different rates for electricity consumption based on specific time periods during the day [51]. The electricity rates are divided into peak, off-peak, and sometimes shoulder periods. Peak periods, typically occurring during high-demand hours, have higher rates, while off-peak periods have lower rates when demand is lower. Shoulder periods fall between peak and off-peak periods, and their rates are generally moderate [52]. TOU pricing encourages consumers to shift their electricity usage to off-peak periods, reducing strain on the grid during peak hours and incentivizing energy conservation [53]. CPP is a more dynamic pricing mechanism that charges consumers significantly higher rates during specific critical peak hours when the demand for electricity is exceptionally high [54]. These critical peak events usually occur during extreme weather conditions or system emergencies. The goal of CPP is to motivate consumers to reduce their electricity consumption during these critical periods and to provide additional revenue for utilities during times of peak stress on the grid [55]. VPP is a pricing mechanism that combines elements of TOU and CPP. Instead of having fixed peak hours, VPP allows electricity rates to vary based on the level of demand in real time [56]. This means that the price of electricity can change throughout the day, depending on the current demand and grid conditions. Consumers receive price signals that prompt them to adjust their energy consumption in response to changing electricity prices [57,58]. RTP is the most dynamic pricing mechanism, as it charges consumers based on the actual wholesale electricity prices prevailing in the real-time market [59]. These wholesale prices can change frequently, sometimes every hour, based on factors such as supply and demand conditions. RTP provides consumers with real-time price signals, enabling them to make immediate decisions about when and how much electricity to use. By responding to the fluctuations in electricity prices, consumers can optimize their energy usage and reduce costs [32].
Every pricing model has its respective merits and limitations with regard to incentivizing DR participation. TOU pricing represents a relatively straightforward implementation, comprehensible to consumers. This strategy fosters load redistribution, consequently reducing peak demand. However, it might fail to offer sufficient inducements for consumers to react to acute peak events. CPP furnishes robust stimuli for consumers to diminish their electricity consumption during critical peak periods, aiding grid stability during high-stress periods. Nonetheless, the predictability of such events may cause consumer unease and possible backlash if not adequately managed. VPP provides more adaptability than fixed TOU pricing by modulating rates in response to real-time demand conditions. This model strikes a balance between TOU and CPP, offering moderate enticements for load shifting while facilitating greater responsiveness to grid circumstances. RTP offers the most acute level of price responsiveness, empowering consumers to optimize their electricity usage in accordance with real-time market rates. However, it necessitates advanced communication infrastructure and intelligent metering, rendering its large-scale implementation more challenging [32,46,60,61].
Here are real examples of DR pricing mechanisms implemented in different countries. The Pacific Gas and Electric Company (PG&E) in California provides TOU rate plans that vary based on three periods: off-peak, partial-peak, and peak hours. Consumers are charged lower rates during off-peak hours, higher rates during partial-peak hours, and the highest rates during peak hours to encourage energy consumption during non-peak times [62]. In Australia, Ausgrid, a major energy distribution company, implemented a CPP program. During critical peak events, participating customers are notified in advance, and their electricity rates increase significantly for a specific period. Ausgrid’s CPP initiative aims to manage peak demand and reduce strain on the grid during extreme weather conditions [63]. The Korea Electric Power Corporation (KEPCO) introduced VPP plans where the electricity prices fluctuate based on real-time grid conditions. Consumers receive dynamic pricing signals, and their electricity costs vary according to the prevailing demand and supply conditions in the market [64]. In Finland, some electricity providers offer real-time electricity pricing plans where consumers have access to hourly price data, allowing them to adjust their consumption in response to changing prices [65]. The Tokyo Electric Power Company (TEPCO) offers TOU rate plans that incentivize consumers to use electricity during off-peak hours [66]. By doing so, consumers can take advantage of lower rates, while the grid benefits from reduced pressure during peak periods.
The variations in DR mechanisms can be attributed to infrastructure maturity; developed nations with mature infrastructures might lean towards real-time pricing mechanisms as they have the technology and grid sophistication to support it. For climatic variation regions prone to extreme weather conditions, like parts of Australia, they might favor CPP to preempt grid overloads. In areas where consumers are technologically savvy and responsive to real-time data, such pricing mechanisms will find traction. The mix of renewable and non-renewable energy sources might influence peak demand periods, and therefore, the choice of DR mechanism. While the overarching aim across countries remains grid stability and efficient energy consumption, the choice of the DR pricing mechanism is intricately tied to regional characteristics, consumer behavior, and infrastructural capabilities.
Summarizing the abovementioned, the main strength of TOU pricing is an understandable and straightforward implementation, but it might fail in offering sharp peak curtailments, as it supports load redistribution and reallocation of peak demand. At the same time, CPP concentrates on consumption reduction during critical peak events, contributing to grid stability. However, in the case of poor management and high-activation frequency, it can cause concerns and negative reactions from participants. The hybrid pricing model of two above mentioned solutions is VPP. This model strikes a balance between TOU and CPP, offering moderate stimulus for load shifting while facilitating greater responsiveness to grid signals. RTP is the most suitable for participants to optimize their electricity consumption based on real-time market rates. However, it might be challenging as it requires advanced information and communication infrastructure.
3.2. Incentives
Incentives play a crucial role in driving consumer participation in DR programs. By offering attractive benefits, utilities and grid operators can encourage consumers to modify their electricity consumption patterns and contribute to a more efficient and resilient energy system. Various types of incentives are used to motivate consumers to participate in DR initiatives. One of the most straightforward and effective incentives is offering cash payments to consumers who participate in DR events [67]. Consumers receive monetary rewards for reducing their electricity usage during peak hours or critical periods. These cash payments provide direct financial benefits to participants, making DR participation more appealing [68]. Instead of providing cash payments, utilities may offer bill credits to consumers who engage in DR activities. Bill credits are applied to the consumer’s electricity bill, reducing the amount they owe based on their contribution to demand reduction. This approach is beneficial for consumers as it helps lower their overall energy costs [69]. In addition to cash payments or bill credits, DR programs may include other financial rewards, such as gift cards, vouchers, or discounts on energy-efficient products [70]. These non-monetary rewards can still serve as effective incentives to encourage participation and promote energy-saving behaviors [71]. Some DR programs provide incentives in the form of rebates for purchasing and installing energy-efficient appliances, smart thermostats or other energy-saving technologies. By upgrading to more efficient equipment, consumers can reduce their energy consumption even outside of DR events [72]. Utilities and grid operators can organize DR contests or prize-based programs to engage consumers. Participants who achieve significant energy savings during specific periods or events may be eligible for additional rewards or special prizes, fostering a sense of competition and excitement among consumers [4]. In some cases, DR programs may offer incentives that contribute to the community or environmental well-being. For example, utilities may promise to donate a portion of the cost savings achieved through DR to local community projects or environmental initiatives [73]. Education and awareness are essential for the success of DR programs. Incentives can include access to educational resources, workshops or training on energy conservation and DR strategies [74]. By empowering consumers with knowledge, they become more willing and capable of participating in DR initiatives.
Advantages of incentives in DR are the following. Incentives effectively motivate consumers to actively participate in DR programs. The prospect of receiving financial rewards or other benefits encourages more consumers to engage in energy-saving behaviors during peak periods, leading to higher overall participation rates. By encouraging consumers to reduce their electricity usage during peak demand periods, incentives help maintain grid stability. Lowering peak demand can prevent grid overloads and potential blackouts, ensuring a reliable energy supply. DR can reduce the need for costly infrastructure upgrades to meet peak demand. Incentives that encourage consumers to shift their usage to off-peak hours can lead to cost savings for utilities and, consequently, consumers. Incentivizing energy conservation and DR can contribute to reduced greenhouse gas emissions. Lower peak demand means less reliance on fossil fuel-based power plants, leading to a more environmentally friendly energy system. Consumers appreciate financial rewards and other benefits received through DR participation. Satisfied customers are more likely to maintain a positive relationship with their utility provider, leading to increased customer loyalty. Incentives can be tied to energy-saving actions beyond DR events, for example, offering rebates on energy-efficient equipment encourages consumers to adopt more eco-friendly technologies, thus promoting long-term energy efficiency [74].
Disadvantages of incentives in DR are the following. Implementing incentives requires financial resources from utilities and grid operators. Depending on the scale of the program and the level of incentives offered, it can result in additional costs for these organizations. Utilities may face budget constraints that limit the amount they can allocate to DR incentives. This can affect the attractiveness and competitiveness of the incentives, potentially leading to lower participation rates. Designing and administering incentive programs can be complex and time-consuming. Utilities must carefully manage the logistics of providing incentives and ensuring that participants meet the eligibility criteria. In some cases, DR incentives might overcompensate consumers for actions they would have taken regardless of the program. This can lead to inefficiencies and higher costs for utilities without achieving significant additional demand reduction. Some consumers may view DR incentives as insufficient or not worth the effort. If the perceived value of the incentives is low, it can deter participation, impacting the overall effectiveness of the DR program. Depending on the design of the incentive program, certain consumer segments may benefit more than others. Low-income households or those without access to specific technologies may face barriers to fully participating in incentive-based DR programs [75].
In the United States, the Southern California Edison (SCE) utility offers its residential customers a program called “Summer Discount Plan”. Participants receive bill credits in exchange for allowing SCE to remotely cycle off their air conditioners during peak periods. By 2019, over one million customers were enrolled in this program, demonstrating increased participation due to the incentive of bill credits [76]. In the United Kingdom, the National Grid’s “Demand Side Balancing Reserve” program incentivizes large energy users to reduce their electricity consumption during times of high demand [77]. In Germany, E.ON introduced the “SolarCloud” program that encourages consumers with solar panels to shift excess energy production to times of peak demand [47]. The French utility, EDF, offers its “EcoWatt” program, where customers receive real-time alerts during peak periods and are incentivized to reduce electricity usage [78]. Some utilities in California faced financial challenges when implementing DR programs with significant incentives, as seen during the energy crisis of 2000–2001, where utilities incurred high costs in procuring demand reductions. In Australia, concerns have been raised that certain DR programs may overcompensate participants for actions they would have taken anyway, leading to inefficiencies and, potentially, higher costs for utilities. The UK’s National Grid introduced the EFR program to enhance grid stability and frequency regulation [79]. Energy storage providers, such as batteries and DR aggregators, are incentivized to participate by offering their services to respond rapidly to frequency deviations [80]. Germany’s transmission system operator, TenneT, launched a Regenerative Reserve Auction to manage grid imbalances due to fluctuations in renewable energy generation [81]. DR providers and battery storage operators can participate in these auctions to offer their flexibility services [80]. In Italy, utilities have introduced DR programs targeted at industrial consumers. Large industries with significant energy demand are encouraged to reduce electricity consumption during peak hours through incentive-based agreements. These incentives can include financial rewards, tariff discounts, or preferential grid access [82]. France has rolled out the Linky smart meter program, which includes DR capabilities [83]. In the Netherlands, the PeakShaving program allows consumers to participate in DR events during times of high-electricity demand [84]. Spain’s electricity system operator, REE (Red Eléctrica de España, Alcobendas, Spain), conducts DR auctions to procure flexibility services from demand-side resources [85]. The Estfeed project is an example of implementing smart metering and DR capabilities [86]. Latvia has been exploring DR through pilot programs involving industrial and commercial consumers [87]. Lithuania has focused on promoting energy efficiency as a key component of DR efforts [88].
Diverse strategies underline the global approach to DR. While incentive-based programs are widespread, the emphasis on integrating renewables, leveraging technology for real-time communication, and market-driven mechanisms showcases a multifaceted approach to managing energy demand. Challenges persist, emphasizing the need for fine-tuning and innovative strategies in the evolving DR landscape.
To generalize, the main incentives for DR participants are financial rewards, environmental rewards, i.e., less reliance on fossil fuel-based power plants and greenhouse gas emission reduction, educational, social, reputational and other benefits that motivate consumers to actively participate in DR programs. The barrier for participants, especially for low-income households, is the access to specific technologies. Moreover, implementing incentives requires financial investments and can cause budget constraints for utilities and grid operators, which can limit the offered incentives and participation. In addition, developing and managing incentive programs is a complex and time-consuming process.
3.3. Technology
DR is one element from a large ecosystem of energy industry and technologies. It is crucial for the enabling and development of DR systems to acknowledge and use advanced technologies, as well as figure out ways to cohere with other technologies in the energy sector.
3.3.1. Information and Communication Technologies
As for any other system that works with data, it is essential for DR implementation to obtain access to qualitative data metering and control systems functionality. The availability and adoption of technology play a crucial role in shaping the effectiveness and success of DR programs. This is a cornerstone for successful DR implementation from both sides: service participants and providers. Technological advancements offer innovative solutions to monitor, manage, and optimize energy consumption, as well as enable consumers to actively participate in DR initiatives. DR participants need to be aware of their electricity consumption volumes during different periods, as well as to have information about their used appliances to evaluate their ability to participate in in DR programs. This data is also crucial for DR providers as it accurately represents the electricity consumption patterns of participants and makes it easier for DR providers to offer the most suitable DR scheme, as well as plan and forecast consumers’ participation activity in certain programs.
Smart meters provide real-time data on energy consumption, allowing consumers and utilities to monitor electricity usage with higher granularity [46]. The availability of detailed energy data empowers consumers to make informed decisions about their energy consumption patterns and participate more effectively in DR events [89]. Data analytics further enhance the understanding of consumption patterns, enabling utilities to optimize DR strategies [46]. Technology enables the deployment of automated demand response (thereafter—ADR) systems that can respond to signals and events without manual intervention [90]. ADR systems can be integrated with building management systems, smart thermostats, and other IoT devices to automatically adjust energy usage during peak periods, ensuring a swift and efficient response [91]. The IoT ecosystem allows for seamless communication and coordination among various devices and appliances. IoT-enabled devices, such as smart thermostats, smart appliances, and smart plugs, enable consumers to remotely control and schedule energy usage, facilitating DR participation [92]. Advanced technology enables the emergence of DR aggregators, which pool and coordinate multiple small loads to create larger virtual power plants [56].
The above mentioned aggregators can efficiently manage DR resources, providing a more significant impact on grid stability and flexibility. Utilities and grid operators can leverage advanced grid management and control systems to monitor and manage energy supply and demand in real-time. These systems allow for better coordination of DR events and ensure grid stability during peak periods [93]. Mobile applications and real-time alerts keep consumers informed about DR events, allowing them to respond promptly [4]. Consumers can receive notifications, incentives, and energy-saving tips via mobile apps, making it easier for them to actively participate in DR programs. Machine learning and AI algorithms can analyze energy consumption patterns and predict peak demand periods more accurately [94]. By understanding consumption behavior, utilities can optimize DR strategies and encourage consumers to shift their energy usage during critical hours. The rise of electric vehicles presents an opportunity for DR. Technology enables smart charging solutions, where EVs can be charged during off-peak hours, leveraging excess renewable energy production and avoiding strain on the grid during peak periods [95]. Energy storage technologies, such as batteries, allow for the efficient storage and discharge of electricity. When integrated with DR, energy storage systems can provide immediate energy supply during peak demand, enhancing the effectiveness of load-shifting strategies [53]. Blockchain technology offers a decentralized and transparent approach to energy transactions; it can facilitate peer-to-peer energy trading and enable innovative DR schemes, fostering more dynamic and flexible energy markets.
The advantages of technologies in DR are the following. Advanced technologies enable real-time monitoring and control of energy consumption, allowing grid operators to manage DR events more efficiently. This leads to improved grid stability and reduced strain during peak demand periods. Technologies like smart meters and IoT devices offer granular control over energy consumption, enabling consumers to shift their electricity usage during DR events [92]. This flexibility helps utilities manage energy demand and balance supply more effectively. DR technologies empower consumers to optimize their energy usage and adopt more energy-efficient behaviors. By participating in DR events, consumers contribute to overall energy efficiency and conservation. Technologies facilitate the integration of renewable energy sources, such as solar and wind, by aligning demand with available supply [96]. DR can help absorb excess renewable energy during periods of high generation and avoid curtailment [97]. DR, when coordinated with renewable energy sources, can lead to reduced reliance on fossil fuels for electricity generation. This alignment helps lower greenhouse gas emissions, contributing to environmental sustainability [98]. Automation through ADR systems enables faster, more precise responses to DR events. Automated load-shifting ensures a coordinated and efficient reduction in electricity consumption during peak hours [99]. Technology-driven DR empowers consumers with real-time energy data and control over their consumption. This empowerment fosters energy awareness and encourages consumers to actively participate in energy conservation efforts [46].
Disadvantages of technologies in DR are the following. The implementation of advanced technologies, such as smart meters and IoT devices, can involve significant upfront costs for utilities and consumers. The expense may be a barrier to adoption, particularly for low-income households [46]. Collecting and sharing consumer energy data raises privacy and security concerns. Ensuring robust data protection measures is essential to address potential risks and gain consumer trust in DR programs. Not all consumers may have access to or be familiar with advanced technologies. The digital divide can lead to disparities in DR participation, leaving some consumers underserved [46]. Technology-driven DR solutions may require technical expertise and training for effective implementation and management. The complexity can be a barrier for smaller utilities or consumers with limited technical knowledge. The reliability of technology and interoperability among different devices and systems are essential for successful DR. Issues with malfunctioning technology or a lack of compatibility could hinder program effectiveness. Some advanced technologies, like IoT devices, may consume additional energy themselves. If not properly managed, the energy usage of these devices could offset the benefits of DR. Technology alone may not be sufficient to drive DR participation. Encouraging behavioral changes and motivating consumers to actively engage in DR can be a challenge [75].
In the United Kingdom, the “Smart Metering Implementation Programme” deployed millions of smart meters to households, facilitating DR and energy management [100]. The “Demand Response Automation Server” in California enables automated DR actions in commercial and industrial facilities, helping reduce peak demand [101]. Tesla’s “Powerpack” energy storage systems have been used in Australia’s DR initiatives to stabilize the grid and enhance reliability [102]. EnerNOC, Boston, MA, USA, an energy intelligence software company, acts as a DR aggregator, helping businesses participate in DR programs efficiently [103]. In the Netherlands, the “Smart Charging” initiative promotes intelligent charging of electric vehicles to support DR efforts [104].
In choosing the information and communication system, it is important to consider not only practical and technical aspects, alongside cost-effectiveness, but also ways to minimize outages and tamper detection, as well as a system’s suitability for DR program expenditure; these factors can appear as a risk barrier for DR implementation in certain time periods [43,105].
While the underlying goal of these DR initiatives is to manage energy demand and ensure grid stability, the strategies, technologies, and focus areas differ, reflecting the unique challenges, opportunities, and innovations of each region or company.
3.3.2. Virtual Power Plants
A virtual power plant is a network of decentralized, medium-scale power generation units, as well as flexible power consumers that can act as virtual storage via load shifting and storage systems. It aims to create a network that brings together distributed energy resources, such as wind power electrostations, solar power systems and cogeneration power plants, to monitor, prognose, optimize and trade their energy [106]. A virtual power plant creates the preconditions for the integration of renewable energy and flexible power consumption into markets. Individual small plants or consumers are usually not able to provide balancing services or offer their flexibility to electricity exchanges. One of the reasons for this, for example, is the non-compliance of the station’s electricity volume with the minimum supply level set in the market. By combining power from multiple cells, a virtual power plant controlled from a central dispatch and management node can trade and provide the same services as larger power plants or industrial consumers. In this way, fluctuations in renewable energy production can be balanced by balancing the electricity production and the energy consumption of the controlled units [42]. As power systems standards may differ, there are various models of virtual power plants and the grids they support. The aims of the models vary from the grid reliability to maximizing economic benefits by selling surplus energy services to larger grids [107].
Table 2 represents a summary of financial, societal and technical trends and factors that positively or negatively affect the viability of virtual power plants.
Table 2.
Trends and Factors of virtual power plant viability.
The rapid development of renewables, growing trend of electrification in transport and gas services, rising capacities of batteries and storages, as well as lower costs of mentioned technologies are building the demand for grid flexibility providing services, such as virtual power plants. Moreover, higher share of renewables in the energy mix suggests more negative price cases in the market. The implementation of virtual power plants could contribute to less curtailment of solar (and wind) and reduce the need for ramping [108]. In addition, already discussed in Section 3.1, information and communication technologies are also considered as one of the factors that tends to positively affect the development of virtual power plants.
For example, in the US it is estimated that by 2050, virtual power plants can benefit to avoid 44–59 million metric tons of CO2 emissions per year. Moreover, by avoiding generation build-out and new power infrastructure investments, virtual power plants can help avoid $17 billion of annual power sector expenditure by 2030 [109]. In Australia, virtual power plants have been lauded as a major part of the future energy mix. In 2019, the Australian Energy Market Operator (thereafter—AEMO) announced its virtual power plant demonstration project, and they predicted that by 2022 virtual power plants capacity could reach 700 MW. However, by the end of the AEMO’s virtual power plant demonstrations in 2021, only 31 MW enrolled, which is a 3% market share of contingency Frequency Control and Ancillary Services. The Institute for Energy Economics and Financial Analyses estimated the total household virtual power plant fleet in the NEM was perhaps 300 MW in March 2022 [108]. As virtual power plants are well developed in Australia, one more tool that enables virtual power plants viability in that region are operating envelopes. Operating envelopes are defined as the limits that an electricity customer can import and export to the electricity grid, that can vary over time and location. The limits are agreed between networks, customers and the Australian Energy Regulator as part of the customer connection or regulatory process. Implementation of virtual power plants will increase exports within the distribution network capacity [110].
Distinguishing factors are the following. While the U.S. has a more diversified and open market for VPP operators, countries like South Korea have state-driven initiatives. The dominant renewable energy sources in a country can shape its VPP strategies. For example, Australia’s focus is on solar, while Germany balances between wind and solar. Japan’s advanced battery industry influences its VPP configuration. Australia’s “operating envelopes” are a distinct approach to facilitate VPP integration. While the overarching goal of VPPs is consistent across countries to balance demand and supply and enhance grid reliability, the methods, technologies, and regulations vary, reflecting each nation’s unique energy landscape and challenges.
On the risk side, that can negatively influence the virtual power plants, there are high initial investments. The system requires long-term planning, specific software development and maintenance, as well as management and administrative efforts. Even if nowadays information and communication technologies are extremely advanced, virtual power plants require a wide data range, from load profiles for different categories of consumers to costs associated with environmental and economic factors. Moreover, some technical failures, which are natural for all kinds of technologies, can also cause difficulties in implementing virtual power plants [111].
Moving forward, there are longer term financial aspects in the form of falling wholesale and Frequency Control Ancillary Service (thereafter—FCAS) market prices and revenue. In regard to a wholesale market, this is expected to continue both with increasing negative daytime price periods and reduced peak pricing with increased storage capacities. In the case of a FCAS market, as more small and large-scale storage enters the system, FCAS costs have been increasing, but prices are likely to move down over time amid better system management with a higher share of variable renewable energy. However, it is predicted that FCAS prices will stay high over the next decade amid the complexity of managing frequency through the transition [108,112].
A lack of clear guidelines and standards for consumers and virtual power plants services providers, as well as their communication, is considered a barrier. The industry needs to ensure transparency in reporting, consistency of language used, contact channels and a clear complaints process, as well as messaging to focus on how consumers are financially better off by joining a virtual power plant and contributing their assets [112].
For a successful virtual power plant’s performance, it is crucial to find the balance between enablers and barriers and to strive for risk factor minimization by improving existing business approaches and developing new ones, as well as data management and customer services.
3.3.3. Case Study: Hydrogen for Demand Response
In the realm of energy storage technologies, the spectrum encompasses flywheels, compressed air energy storage, batteries, and pumped-hydro storage, among others [113]. The concept of DR is typically encapsulated in discretionary and recompensed programs, which empower a power system to incentivize or regulate load reduction as required for maintaining grid stability [32]. The absence of an adequately flexible grid could limit the ability of thermal plants to reduce output, necessitating a curtailment of wind and solar power [96]. With an increase in curtailment, variable Renewable Energy (thereafter—RE) compensates for less fossil generation, subsequently reducing its value. DR and storage, as enabling technologies, have the potential to minimize curtailment and accommodate greater penetrations of variable RE within the grid [47].
Hydrogen, as an energy carrier, has gained significant attention in recent years as a potential solution for energy storage, grid balancing, and decarbonization. When combined with demand response strategies, hydrogen can play a crucial role in enhancing the overall efficiency and flexibility of the energy system [114]. Studies show consensus among researchers on the suitability of hydrogen as an ideal energy carrier in various energy transformation processes in addressing the challenges of using renewable energy sources [115]. As a typical innovative technological solution, the use of hydrogen in the energy sector shows rapid progress in cost reduction, development and accessibility of solutions and products. Hydrogen is used to balance the demand and supply of electricity in the grid by storing surplus electricity produced from renewable energy sources in the form of hydrogen at times when supply is greater than demand. As demand increases, hydrogen can be used to generate electricity and feed it into the grid using stationary hydrogen fuel cell power plants. During periods of low demand and low electricity prices, the generated electricity is diverted to the electrolysis of water and the storage of gaseous hydrogen at elevated pressure, which is then used to generate electricity during high demand and high electricity costs, thus obtaining the highest profit. In addition, the duration of hydrogen storage is much longer than electricity in batteries, up to weeks or months compared to an hour or a week in batteries that are available today [98,114].
In a DR scenario, when electricity demand is high, stored hydrogen can be converted back into electricity, alleviating the demand on the grid. If there’s a surplus of renewable energy, hydrogen production can be ramped up, providing a valuable method to store this otherwise wasted energy [116]. If demand exceeds supply, stored hydrogen can be utilized to generate electricity. Furthermore, hydrogen can also help manage the grid on a seasonal timescale, storing excess renewable energy produced in sunny or windy periods and delivering it in periods of higher demand or less favorable weather conditions (Figure 5) [117].

Figure 5.
Hydrogen utilization in DR.
Summarizing the significance of access and integration of advanced technologies, it needs to be pointed out that technologies enable actual DR implementation, real-time monitoring and control from third parties, granular control over energy consumption for participants themselves, faster, more precise and coordinated responses, as well as facilitating the integration of RES. However, it also requires significant upfront expenses and proper knowledge and management for utilities and consumers, which raises data privacy and security concerns, and addresses issues with technology malfunctioning or a lack of compatibility, which could hinder program effectiveness. The digital divide can lead to disparities and leave some participants underserved.
Here is a more detailed scheme on how hydrogen could be utilized in a DR context: renewable energy sources, such as wind turbines or solar panels, produce electricity. In periods of surplus production (when the energy produced exceeds the grid’s demand), instead of curtailment or wasted generation, this excess electricity can be used to power electrolyzers [118]. The excess electricity from the grid powers electrolyzers, which split water into hydrogen and oxygen through a process known as electrolysis. The hydrogen produced can be stored for later use, which is particularly useful given the intermittent nature of renewable energy. Hydrogen can be stored in various ways, for instance, in high-pressure tanks, as a liquid in cryogenic tanks, in underground salt caverns, or by chemical bonding in solids (solid state storage). This stored hydrogen represents a form of energy storage that can be utilized when needed. During periods of high demand or when renewable energy production is low (e.g., at night for solar or in low wind conditions), the stored hydrogen can be converted back into electricity. This can be achieved by using fuel cells, which combine hydrogen and oxygen to produce electricity, heat, and water, or via hydrogen-fired turbines [119]. The ability to convert stored hydrogen back into electricity on demand helps balance the grid and ensures a stable electricity supply. It allows for a responsive system that can adjust to fluctuations in electricity supply and demand. This is particularly important as we increase our reliance on intermittent renewable energy sources. In addition to providing short-term balancing capabilities, hydrogen can also help manage the grid on a seasonal timescale [120]. It can store excess renewable energy produced in sunny or windy periods and deliver it in periods of higher demand or less favorable weather conditions. Beyond electricity generation, hydrogen can also be used for heating purposes or as a fuel for hydrogen-powered vehicles [121]. These sectors can also participate in DR programs, for example, by using or storing heat when there is an excess of renewable electricity, or by refueling vehicles, mostly during off-peak hours [122]. Certain industries (e.g., ammonia production, oil refining) can switch their operations to times of surplus electricity and produce hydrogen for their processes [123]. This could provide further flexibility in the electricity system and reduce the overall carbon footprint. This scheme underscores the potential of hydrogen in facilitating DR. By transforming surplus electricity into a storable commodity and then converting it back to electricity as needed, a hydrogen-based energy storage system can provide a powerful tool to balance supply and demand, especially in power grids with a high share of intermittent renewable energy sources [53,124]. The German “NEW 4.0” project in the northern Germany region aims to combine renewable energy generation, hydrogen production, and DR to create a flexible and sustainable energy system [125]. Excess wind energy is used for hydrogen production through electrolysis, and the stored hydrogen is utilized for industrial processes, transportation, and electricity generation when needed [126]. The role of hydrogen in DR is influenced by a country’s technological, economic, geographical, and policy landscape. It is essential to consider these various factors when analyzing how different countries or regions approach the integration of hydrogen into their DR strategies.
3.4. Customer Awareness
Customer awareness plays a crucial role in the success and effectiveness of DR programs. The level of awareness and understanding among consumers directly influences their willingness to participate in DR initiatives [127]. Customer awareness empowers consumers to make informed decisions about their energy consumption. When consumers understand the concept and benefits of DR, they can actively choose to participate based on their preferences and energy needs [128]. Awareness drives active participation in DR programs.
The direct participants of DR, which change their normal electricity consumption patterns, interrupt or cut the electricity consumption under relative prices, discounts, incentives, or policies, can generally be classified into a residential segment, industrial and commercial [101]. The main differences between these groups of participants are their electricity consumption volumes and consumption patterns, which determines their ability to perform in the certain DR program. Despite this, these participants face almost the same limitations and facilitations (Table 3).
In 2020, the Midwest United States conducted a survey, which was distributed to a random sample of 3165 residents with the 13% response rate (417 responses in total). One of the survey’s questions was regarding the reasons for not enrolling in a specific DR program and incentive level. The results of the questionnaire showed, when not mentioning an incentive, that most of the respondents are concerned about the impact on comfort level. However, when offered incentives, “incentive is not high enough” was one of the most common answers (Figure 6) [129].
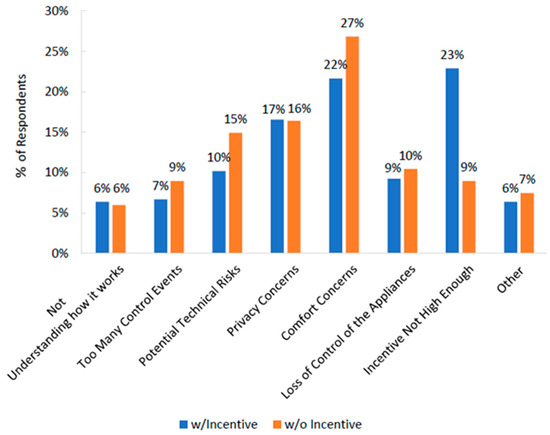
Figure 6.
Reasons for rejecting DR, with and without incentives [129].
Moreover, the findings showed that residents’ willingness to provide control to a DR manager differ in terms of time of the day, day of the week, and type of equipment or appliances; 20% of the respondents were accepting of letting utilities control their home equipment and appliances anytime of the day, while 3–15% of residents favored different times of the day [129].
Table 3.
Barriers and Enablers for DR Participants [130,131].
The aspect of familiarity and knowledge persist on both sides of the coin. For some consumers, the knowledge about the product and examples of its successful implementation is a positive trigger. If consumers are aware of the opportunities to reduce their energy usage during peak hours and the incentives offered for doing so, they are more likely to engage in load-shifting practices [67,132]. Peak demand periods can place significant stress on the electricity grid and lead to higher costs for utilities [133]. Customer awareness of DR programs helps spread the message about the importance of managing peak demand and encourages consumers to modify their energy consumption behavior during critical hours. By participating in DR, consumers can contribute to grid stability and reliability [4]. When consumers are aware of their role in supporting the grid, they are more likely to respond to DR signals and help balance electricity supply and demand.
Meanwhile, the barriers for taking part in DR are as follows: unfamiliarity with technologies; lack of information about enrolling processes; and difficulties in using smart metering. However, there are also other kind of participants that have a great knowledge, but over-scrutinizing and over-analyzing stops them from enrolling in a program because of cautiousness. DR programs can be complex, and customers may misunderstand the intricacies of how they work. This lack of understanding could lead to suboptimal participation or misconceptions about the potential benefits. In voluntary DR programs, some customers may still choose not to participate, even if they are aware of the initiatives. This can limit the overall effectiveness of the program, particularly if critical mass participation is not achieved. Not all customers may have equal access to information about DR programs. Some consumers, particularly vulnerable or marginalized groups, may face barriers to awareness, resulting in reduced inclusivity in DR participation. Even with awareness, some customers may be reluctant to change their energy consumption habits or may not prioritize DR participation over other daily activities or preferences. The cost and effort required to raise customer awareness about DR can be significant for utilities and grid operators. Limited resources may hinder comprehensive awareness campaigns [4,134,135].
A lack of trust may appear as an issue before enrolling and even after. In schemes dispatched by third parties, the distrust is about privacy, autonomy and effect on a comfort level [34,136]. Although a lack of trust may come out after enrolling, there is not enough transparency and communication from the DR provider side. As DR programs involve data collection from consumers, there may be concerns about data privacy and how customer information is used. These concerns can deter some customers from participation [4,134,135].
The barrier of distrust can be minimized by social motivation. Examples of best practices, information from trusted sources, authorities, people in their own social network, or independent sources is considered as an enable factor for taking part in DR programs [131,136]. Customer awareness builds trust between consumers and utilities or grid operators. When consumers are informed about how their data is used in DR and how it benefits them and the grid, they are more likely to engage and cooperate [127].
The lack of knowledge about technological aspects of DR and absence of DR enabling technologies, for example, built-in timers, ability to switch to alternative fuels or appliances, etc., or the requirement to install new technologies, can also be considered as a barrier because it requires time, effort, as well as financial expenditures not everyone can afford. In addition, practical technical issues may limit the response, make disturbing pauses, or respond over time [105].
The roll-out of smart meters can be considered as an indicator for the technical potential for the end-users to participate in DR. In 2021, in eight European countries, the roll-out is high or complete, while other analyzed countries have a space for improvements (Figure 7) [37].
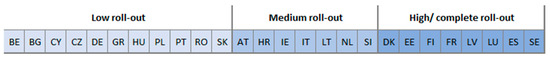
Figure 7.
Status of smart meter roll-out at the residential level in 2021 [37].
Nowadays, technologies, installations and services are extremely advanced and innovative. Moreover, they are well integrated in the everyday life of societies and society is highly innovation oriented. The interest in a new technology may overcome required effort for its installation. From the DR management side, technical expertise and training can be offered to the customers. In addition, there are specific services that can quickly and easily solve any technical issues. The needed financial costs should be considered as an investment, because they will pay back from financial rewards for qualitative participation in DR.
Risk can be interpreted as a line a participant is not ready to cross. To get more benefits and higher refunds, participants may sacrifice their autonomy and comfort level and accept greater control. However, the question is: what is the limit of willing to take additional responsibilities? Moreover, there may appear concerns on interaction of DR with users’ routines and activities. In addition, there is also a place for financial risk if participants invest in the enrolling process and equipment, but their performance in DR does not pay off or even leads to losses.
Specific and detailed agreements on allowed control and duration levels, appropriate notification of control, ability to provide feedback and communicate, as well as the option to override can reduce autonomy and comfort level risk issues. Awareness and clear understanding of the incentives and rewards offered through DR programs can soften financial risks and motivate consumers to participate. Consumers who are aware of the financial rewards, bill credits, or other benefits associated with DR are more likely to see the value in participating [137]. However, the balance is needed because, in some cases, an overemphasis on financial incentives may lead to a transactional approach to DR. Consumers may participate solely for the rewards, rather than embracing the broader benefits of energy conservation and grid support [4,134,135].
Environmental problems become even more crucial and this fact does not leave the society indifferent to the problem. DR promotes energy conservation, which is essential for sustainability and environmental protection. By through implementing DR, individuals, businesses, and organizations can not only obtain financial benefits, but also contribute to climate change reduction, which may be a powerful driver for them to become acquainted with the DR management and enroll in the most suitable DR program [138].
In the United States, the utility company Baltimore Gas and Electric (BGE) implemented a DR program called “PeakRewards” [139]. Singapore’s Energy Market Authority (EMA) launched the “Demand Response (DR) World” campaign to promote DR awareness among commercial and industrial consumers [140]. In Australia, the New South Wales (NSW) government’s “Power to Save” campaign raised awareness about DR and energy conservation [141]. In Italy, the transmission system operator Terna launched the “Energy Days” campaign to raise awareness about DR and its role in grid stability [142]. In France, the “Effacement Jour de Pointe” (Peak Day Erasure) program offered financial incentives to industrial consumers who reduced electricity usage during peak demand periods [143]. In Finland, the “Älykäs Energia” (Smart Energy) campaign aimed to increase awareness of DR and smart energy solutions [144]. In Lithuania, a voluntary DR program faced challenges in achieving high customer participation rates [32]. Each country or region, based on its energy landscape, consumer behavior, and grid infrastructure, has tailored its DR programs and campaigns to address specific challenges and promote benefits tailored to its needs. The differences also highlight various strategies in raising DR awareness and participation, from financial incentives to public education campaigns.
When customers are aware of the benefits and importance of DR, they are more likely to actively participate in DR programs. This leads to higher overall participation rates, making the programs more effective in managing peak demand and balancing the grid. Customer awareness enables consumers to understand the significance of peak demand management. Informed consumers are more willing to adjust their energy usage during peak hours, leading to better grid stability and reduced strain on the electricity system. Awareness of DR encourages energy conservation and efficiency. Informed customers are more likely to adopt energy-saving behaviors, reducing their overall energy consumption and contributing to environmental sustainability. The involvement of aware customers in DR activities improves grid reliability. When consumers respond to DR signals, it helps grid operators maintain a balanced supply demand relationship and minimize the risk of blackouts or power outages. Customer awareness of the incentives and rewards offered through DR programs allows consumers to benefit from potential cost savings. By shifting energy usage to off-peak hours, customers can take advantage of lower electricity rates or receive bill credits. DR programs are viewed more favorably by the public when customers are aware of their benefits. Public perception of DR as an effective solution for energy management improves, leading to increased support and acceptance of these initiatives, therefore, informed consumers are more likely to participate in DR over the long term. Customer awareness fosters a sense of responsibility and commitment to energy conservation, encouraging sustained engagement in DR programs [48,135,138].
Sustainable and successful DR programs require long-term participation from consumers. Customer awareness ensures that consumers understand the continuous benefits of DR, leading to higher adoption rates over time [136]. Increasing customer awareness requires effective communication and education about DR. Utilities, grid operators, and regulators can provide resources, workshops, and educational materials to inform consumers about the importance and advantages of DR [74]. Ultimately, the success of DR programs relies on the participation of a significant number of consumers. Customer awareness drives program effectiveness by encouraging more consumers to actively engage in DR activities [145].
To compile previously mentioned factors, the level of participants’ knowledge about all the aspects of participation in DR plays a spectacular role. Customer awareness about pricing schemes, financial, environmental, social and reputational benefits, as well as innovativeness are the main drivers for participation and effectiveness to all involved sides of the DR system. Meanwhile, a lack of awareness provokes distrust. The lack of knowledge about technological requirements and related financial expenses, as well as other risks, such as less autonomy, possible harm of comfort level, financial losses, difficulties with adaptability, can appear as barriers as a result.
3.5. Policy, Regulators and Authorities
Government regulations play a pivotal role in shaping the landscape of DR programs within a country’s energy market. The way regulations are designed and enforced can significantly impact the adoption, effectiveness, and success of DR initiatives. Some governments mandate utilities or energy providers to offer DR programs to their customers. By making DR participation compulsory, governments can ensure a broader reach and higher participation rates among consumers. These mandatory programs create a standard framework for DR implementation and can lead to more consistent and widespread adoption [32]. Governments may set specific targets and objectives related to energy efficiency, peak demand reduction, or greenhouse gas emissions. DR programs can be instrumental in achieving these targets. By providing financial incentives or regulatory support, governments encourage utilities to invest in DR initiatives and consumers to participate actively [146]. Regulatory policies can influence the structure and rules of the energy market, affecting the integration of DR [147,148]. For instance, some regulations may encourage the development of DR aggregators, who can pool and manage DR resources on behalf of consumers, making it more accessible and efficient for smaller participants [37]. Governments can introduce incentive mechanisms, such as capacity payments or performance-based rewards, to motivate utilities and consumers to embrace DR [149]. Regulations can promote the adoption of technologies that facilitate DR, such as smart meters, smart thermostats, and energy management systems [146]. Governments may set standards or provide incentives for the deployment of these technologies, making it easier for consumers to participate in DR programs. As DR programs involve the collection and use of consumer data, regulations regarding data privacy and security become crucial. Governments need to establish clear guidelines to protect consumers’ data and ensure their privacy while enabling effective DR operations [147]. Governments may introduce regulatory changes to promote competition, open access to the grid, and facilitate DR participation by independent aggregators or third-party providers [150]. DR can complement the integration of renewable energy sources by providing flexible load management [151]. Regulations may encourage the alignment of DR programs with renewable energy generation, enhancing grid stability and reducing the need for fossil fuel-based power plants [152]. Regulations can address consumer protections related to DR participation, ensuring that consumers fully understand their rights and the implications of joining DR programs. Transparent and fair regulations build trust among consumers and enhance their willingness to engage in DR [150].
Advantages of Government Regulation on DR Implementation are the following [153]. Government regulations can establish standardized frameworks for DR programs, ensuring consistency and clarity in implementation. Standardization simplifies the process for utilities, aggregators, and consumers, leading to smoother program operations. Mandatory DR programs or regulatory targets can drive higher adoption rates among utilities and consumers. With regulatory backing, more stakeholders are likely to participate actively in DR initiatives, contributing to greater overall effectiveness. DR, when implemented effectively, helps manage peak electricity demand, reducing strain on the grid during critical periods. This can enhance grid stability and reliability, leading to a more resilient energy system. By reducing energy consumption during peak demand periods, DR can contribute to overall energy efficiency and lower greenhouse gas emissions. Government regulations supporting DR align with environmental sustainability goals [47]. Regulations that promote the adoption of new technologies, such as smart meters and energy management systems, can foster innovation in the energy sector. Regulations can protect consumer rights, ensuring transparent communication, fair incentives, and data privacy. Empowered consumers are more likely to actively participate in DR programs and make informed decisions about their energy usage.
Disadvantages of government regulation on DR implementation are the following [87,154]. Adhering to regulatory requirements can impose additional administrative and financial burdens on utilities and other stakeholders. Compliance costs may be passed on to consumers or affect the profitability of market players. Government-mandated DR programs may lack flexibility, making it challenging to tailor them to the unique needs of different regions or consumer groups. This rigidity can limit the effectiveness of DR initiatives. Utility companies may resist regulatory mandates if they perceive them as restrictive or costly. Some utilities might prefer voluntary approaches to DR, which they believe align better with their business models. The regulatory process can be slow and subject to changes in political priorities or leadership. Delays or sudden shifts in regulations can disrupt the continuity of DR initiatives and hinder long-term planning. Regulatory-driven DR programs may not consider the specific needs of all consumer segments, leading to disparities in participation and benefits. Low-income or vulnerable consumers may face barriers to accessing the advantages of DR incentives. The compliance process for DR regulations can be complex and challenging for stakeholders to navigate. This complexity may discourage participation or create uncertainty in the market [75].
The recent energy crisis has highlighted the significant impact of policy responses in Europe and globally. Although further efforts are necessary to bolster demand-side flexibility and align with the Net Zero Scenario, multiple measures have been implemented across different regions to enhance coverage and scope [127]. Australia introduced the Wholesale DR Mechanism, enabling consumers to engage in DR trading, and implemented the Five-Minute Settlement in the National Electricity Market to improve price signals, thereby encouraging investments in battery technologies [155]. In Brazil, a mechanism was approved to allow large consumers to actively participate in providing DR services [156]. Korea is extending the reach of the residential DR Energy Pause Program by increasing the consumer participation threshold from below 70 kW to encompass all households up to 200 kW [157]. Singapore launched a regulatory sandbox to streamline procedures, reduce penalties, and provide clearer activation timeframes, thereby supporting participation in DR programs [158]. The European Union endorsed an action plan to digitalize the energy system, incorporating provisions to facilitate data access for DR and encourage the adoption of smart appliances [159]. Additionally, the EU electricity market design reform is currently being discussed, aiming to introduce measures that promote low-carbon flexibility solutions, including DR [127]. In the European Union, the Clean Energy for All Europeans Package introduced several regulations to standardize energy markets, including provisions for DR [127,160]. In Denmark, the government has set ambitious targets for DR and energy efficiency. Regulatory requirements have compelled utilities to develop DR programs and incentivize consumers to participate actively. This has led to higher adoption rates and significant demand reduction during peak hours [161]. The Spanish grid operator Red Eléctrica de España (REE) has implemented regulations to enable DR participation in ancillary services [85]. In Germany, the country’s ambitious energy transition strategy (“Energiewende”) includes regulations to promote DR and energy efficiency [162]. In Estonia, government support for smart grid development and regulatory initiatives has encouraged utilities to invest in advanced metering infrastructure [163]. In Latvia, some utilities have faced compliance costs when implementing DR programs due to the need to upgrade infrastructure and systems to meet regulatory requirements [87]. In Lithuania, a government-mandated DR program was initially criticized for its inflexible design, making it challenging for some participants to tailor their DR strategies according to their specific needs [37]. While each region or country has its unique approach towards DR based on its infrastructural capabilities, challenges, and goals, a collective global shift towards more flexible, inclusive, and efficient energy systems is evident.
The main barriers for successful DR implementation built by government and regulation are process complexity, as well as additional administrative and financial burdens that can be passed on to consumers or affect the profitability of market players and create uncertainty in the market; slow regulatory process with sudden shifts can disrupt the continuity of DR; and a lack of flexibility in government-mandated programs may not address the specific needs of all consumer segments, leading to disparities in participation and benefits. However, government support and proper regulation ensures the following enables: standardization that provides clarity and simplicity for all DR players leading to smoother program operations; higher adoption rates among utilities and consumers on mandatory DR programs; adoption of new technologies for innovation progress; achievement of environmental sustainability goals; and protection of consumer rights.
4. Conclusions and Recommendations
Based on the analysis of scientific literature, legal acts and professional reports, as well as case-studies from different countries, the research presented in this paper provides the structured mapping of the main actors of the DMR system, shedding light on the enables and barriers of influence of the DR performance chain, as well as ways of how to overcome the challenges. There are five main influencing aspects, activating the behavior of the actors who are involved, or their potential involvement, in the DMR interactions: types of pricing mechanisms, offered incentives, availability of technology, government regulation and customer awareness.
The research highlights that real-time pricing is the most suitable approach for participants to optimize their electricity consumption based on real-time market rates. However, it might be challenging, as it requires advanced information and communication infrastructure.
The main incentives for DR participants are financial rewards, as well as environmental (less reliance on fossil fuel-based power plants and greenhouse gas emission reduction), educational, social, reputational and other benefits that motivate consumers to actively participate in DR programs. The barrier for participants, especially for low-income households, is the access to specific technologies.
Technologies enable actual DR implementation, real-time monitoring and control from third parties, granular control over energy consumption for participants themselves, and faster, more precise and coordinated responses, as well as facilitating the integration of RES.
Customer awareness about pricing schemes, financial, environmental, social and reputational benefits, as well as innovativeness are the main drivers for involvement to all involved sides of the DR system. Meanwhile, a lack of awareness provokes distrust.
The main barriers for successful DR implementation is generally a slow regulatory process (slower than the technological and market evolution) with sudden changes in level-playing-field creating uncertainty in the market, bringing additional administrative and financial burdens that can be passed on to consumers or affect the profitability of market players.
The authors find out the following recommendations to accelerate successful and effective DR performance in mentioned groups of influencers:
- utilities, grid operators and government can maintain comprehensive awareness campaigns to increase customer awareness and popularization of DR;
- to lower digital divide and ensure effective implementation and management of the required technological equipment a technical expertise and training can be offered;
- careful management of the logistics of provided incentives by utilities and ensuring that customers who meet the eligibility criteria can benefit from increased customer loyalty and be able to maintain a positive relationship between participants;
- clear and standardized frameworks for DR participants from the government is able to solve controversial points and provide full understanding of the processes;
- ensuring transparent communication, fair incentives and robust data protection measures is essential to address potential risks and obtain consumer trust;
- the barrier of distrust to DR and low market activity promoting DR services to customers can be also minimized by examples of best practices and information from trusted sources, such as authorities, social networks, independent sources etc.;
- in regard to finding a balance between the allowed level of autonomy and effect on comfort level, and consumers’ effective participation in a DR program, specific and detailed agreements on allowed control and duration levels, appropriate notification of control, as well as an option to override are needed;
- active communication between all the influencers with the ability to provide feedback and discuss common goals and initiatives can allow to overcome barriers in many stages of DR implementation; the coordinated effort from regulatory authorities, utilities, associations, customers, environmental and public interest groups, technical experts and equipment manufacturers and providers are suggested.
DR requires spectacular human and technological resources, as well as administrative, financial and educational efforts from all participants. However, the DR implementation benefits and the wide spectrum of challenges that DR addresses—cost savings, innovation driving, enabling integration of RES, effective, stable and safe power grid performance, reduced need for costly infrastructure modifications, and greenhouse gas emission reduction—are crucial for modern society and successful energy transition. The policy makers play a crucial role in making the DR system effective, finding the right balance between the regulatory measures and the non-regulatory instruments encouraging a higher activity of the market participants.
Author Contributions
Conceptualization, L.Z., O.B. and K.V.; methodology, L.Z. and O.B.; investigation, K.V. and L.Z.; resources, K.V. and L.Z.; writing—original draft preparation, K.V. and L.Z.; writing—review and editing, O.B.; visualization, K.V. All authors have read and agreed to the published version of the manuscript.
Funding
This research received no external funding.
Data Availability Statement
All data are available without restriction and are included in the manuscript file.
Conflicts of Interest
The authors declare no conflict of interest.
References
- Canizes, B.; Silveira, V.; Zita, V. Demand response and dispatchable generation as ancillary services to support the low voltage distribution network operation. Energy Rep. 2022, 8, 7–15. [Google Scholar] [CrossRef]
- Bogdanova, O.; Pigeons, K. Factors affecting energy costs: Green deal impact. In Towards Climate Neutrality: Economic Impacts, Opportunities and Risks, 1st ed.; Šteinbuka, I., Bogdanova, O., Eds.; University of Latvia Press: Riga, Latvia, 2023; pp. 70–86. [Google Scholar] [CrossRef]
- National Renewable Energy Laboratory. Potential Roles for Demand Response in High-Growth Electric Systems with Increasing Shares of Renewable Generation. Available online: https://www.nrel.gov/docs/fy19osti/70630.pdf (accessed on 24 July 2023).
- Stanelyte, D.; Radziukyniene, N.; Radziukynas, V. Overview of demand-response services: A review. Energies 2022, 15, 1659. [Google Scholar] [CrossRef]
- Gellings, C.W. The concept of demand-side management for electric utilities. Proc. IEEE 1985, 73, 1468–1470. [Google Scholar] [CrossRef]
- Gellings, C.W.; Chamberlin, J.H. Introduction. In Demand-Side Management: Concepts and Methods, 1st ed.; The Fairmont Press, Inc.: Atlanta, GA, USA, 1988; pp. 1–11. [Google Scholar]
- Gellings, C.W. Evolving practice of demand-side management. J. Mod. Power Syst. Clean Energy 2017, 5, 1–9. [Google Scholar] [CrossRef]
- Gellings, C.W. The smart grid—Enabling demand response—The dynamic energy systems concept. In The Smart Grid: Enabling Energy Efficiency and Demand Response; River Publishers: Aalborg, Denmark, 2020; pp. 131–151. [Google Scholar]
- Gellings, C.W.; Chamberlin, J.H. Introduction. In Demand-Side Management: Concepts and Methods, 2nd ed.; The Fairmont Press, Inc.: Atlanta, GA, USA, 1993; pp. 2–3. [Google Scholar]
- Beesley, M.; Littlechild, S. The regulation of privatized monopolies in the United Kingdom. Rand J. Econ. 1989, 20, 454–472. [Google Scholar] [CrossRef]
- Joskow, P.L. Regulatory failure, regulatory reform, and structural change in the electrical power industry. Brook. Pap. Econ. Act. 1989, 20, 125–208. [Google Scholar] [CrossRef]
- Joskow, P.L. Introducing competition into regulated network industries: From hierarchies to markets in electricity. Ind. Corp. Change 1996, 5, 341–382. [Google Scholar] [CrossRef]
- Joskow, P.L. Lessons learned from electricity market liberalization. Energy J. 2008, 29, 9–42. [Google Scholar] [CrossRef]
- Synapse Energy Economics Inc. Demand Response as a Power System Resource. Available online: https://www.synapse-energy.com/sites/default/files/SynapseReport.2013-03.RAP_.US-Demand-Response.12-080.pdf (accessed on 15 July 2023).
- U.S. Energy Information Administration. US Electric Utility Demand-Side Management. 2000. Available online: https://www.eia.gov/electricity/data/eia861/dsm/ (accessed on 15 July 2023).
- Greening, L.A. Demand response resources: Who is responsible for implementation in a deregulated market? Energy 2010, 35, 1518–1525. [Google Scholar] [CrossRef]
- Eissa, M.M. Demand side management program evaluation based on industrial and commercial field data. Energy Policy 2011, 39, 5961–5969. [Google Scholar] [CrossRef]
- Warren, P. A Review of demand-side management policy in the UK. Renew. Sustain. Energy Rev. 2014, 29, 941–951. [Google Scholar] [CrossRef]
- Warren, P. Demand-Side Management Policy: Mechanisms for Success and Failure. Ph.D. Thesis, UCL Energy Institute, University College London, London, UK, August 2015. [Google Scholar]
- U.S. Energy Information Administration. National Action Plan for Energy Efficiency. Coordination of Energy Efficiency and Demand Response. Available online: https://www.epa.gov/sites/default/files/2015-08/documents/ee_and_dr.pdf (accessed on 16 July 2023).
- Morales-Espana, G.; Martínez-Gordon, R.; Sijm, J. Classifying and modelling demand response in power systems. Energy 2022, 242, 122544. [Google Scholar] [CrossRef]
- Kinhekar, N.; Padhy, N.P.; Gupta, H.O. Multiobjective demand side management solutions for utilities with peak demand deficit. J. Int. Electr. Power Energy Syst. 2014, 55, 612–619. [Google Scholar] [CrossRef]
- Lampropoulos, I.; Kling, W.L.; Ribeiro, P.F.; Berg, J. History of demand side management and classification of demand response control schemes. In Proceedings of the IEEE Power and Energy Society (PES) General Meeting, Vancouver, BC, Canada, 21–25 July 2013. [Google Scholar]
- Akbari-Dibavar, A.; Farahmand-Zahe, A.; Mohammadi-Ivatloo, B. Concept and glossary of demand response programs. In Demand Response Application in Smart Grids: Concepts and Planning, 1st ed.; Nojavan, S., Zare, K., Eds.; Springer: Berlin/Heidelberg, Germany, 2020; Volume 1, pp. 1–15. [Google Scholar]
- Bakr, S. Dynamic Demand Response in Residential Prosumer Collectives. Ph.D. Thesis, University of Otago, Dunedin, New Zealand, 30 June 2018. [Google Scholar]
- U.S. Department of Energy, Office of Scientific and Technical Information. Energy Efficiency and Electric System Reliability: A Look at Reliability-Focused Energy Efficiency Programs Used to Help Address the Electricity Crisis of 2001. Available online: https://www.osti.gov/servlets/purl/812819 (accessed on 16 July 2023).
- Behrangrad, M. A review of demand side management business models in the electricity market. Renew. Sustain. Energy Rev. 2015, 47, 270–283. [Google Scholar] [CrossRef]
- Tronchin, L.; Manfren, M.; Nastasi, B. Energy efficiency, demand side management and energy storage technologies—A critical analysis of possible paths of integration in the built environment. Renew. Sustain. Energy Rev. 2018, 95, 341–353. [Google Scholar] [CrossRef]
- World Energy Council. The World in 2050: Explore MAP Phase Insights. Visionario Project Map Phase Analysis. Available online: https://www.worldenergy.org/assets/downloads/FEL_Visionario_MAP_Phase_Analysis_Presentation.pdf?v=1662554370 (accessed on 10 August 2023).
- FERC. Assessment of Demand Response and Advanced Metering. Available online: https://www.smartgrid.gov/files/documents/2010-dr-report.pdf (accessed on 17 July 2023).
- Albadi, M.H.; El-Saadany, E.F. Demand response in electricity markets: An overview. In Proceedings of the IEEE Power Engineering Society General Meeting, Tampa, FL, USA, 24–28 June 2007; pp. 1–5. [Google Scholar]
- International Energy Agency. Demand Response. Available online: https://www.iea.org/energy-system/energy-efficiency-and-demand/demand-response#programmes (accessed on 17 July 2023).
- Usman, R.; Mirzania, P.; Alnaser, S.W.; Hart, P.; Long, C. Systematic review of demand-side management strategies in power systems of developed and developing countries. Energies 2022, 15, 7858. [Google Scholar] [CrossRef]
- De Zotti, G. Leveraging Consumers’ Flexibility for the Provision of Ancillary Services. Ph.D. Thesis, Technical University of Denmark, Kongens Lyngby, Denmark, 2019. [Google Scholar]
- TNO. The Role of Demand Response in the Power System of The Netherlands, 2030–2050. Available online: https://publications.tno.nl/publication/34639481/emVYyq/TNO-2022-P10131.pdf (accessed on 21 July 2023).
- Assad, U.; Hassan, M.A.S.; Farooq, U.; Kabir, A.; Khan, M.Z.; Bukhari, S.S.H.; Jaffri, Z.u.A.; Oláh, J.; Popp, J. Smart Grid, Demand Response and Optimization: A Critical Review of Computational Methods. Energies 2022, 15, 2003. [Google Scholar] [CrossRef]
- Saviuc, I.; Lopez, C.; Puskas, A.; Rollert, K.; Bertoldi, P. Explicit Demand Response for Small End-Users and Independent Aggregators, EUR 31190 EN; Publications Office of the European Union: Luxembourg, 2022; pp. 1–132. [CrossRef]
- Abedrabboh, K.; Al-Fagih, L. Applications of mechanism design in market-based demand-side management: A review. Renew. Sustain. Energy Rev. 2023, 171, 113016. [Google Scholar] [CrossRef]
- Tantau, A.; Puskás-Tompos, A.; Stanciu, C.; Fratila, L.; Curmei, C. Key Factors Which Contribute to the Participation of Consumers in Demand Response Programs and Enable the Proliferation of Renewable Energy Sources. Energies 2021, 14, 8273. [Google Scholar] [CrossRef]
- U.S. Department of Energy. Recovery Act: Time Based Rate Programs. Available online: https://www.smartgrid.gov/recovery_act/time_based_rate_programs.html (accessed on 10 August 2023).
- Laitsos, V.M.; Bargiotas, D.; Daskalopulu, A.; Arvanitidis, A.I.; Tsoukalas, L.H. An Incentive-Based Implementation of Demand Side Management in Power Systems. Energies 2021, 14, 7994. [Google Scholar] [CrossRef]
- Palensky, P.; Dietrich, D. Demand Side Management: Demand response, intelligent energy systems, and smart loads. IEEE Trans. Ind. Inform. 2011, 7, 381–388. [Google Scholar] [CrossRef]
- U.S. Department of Energy. Benefits of Demand Response in Electricity Markets and Recommendations for Achieving Them. Available online: https://energy.gov/sites/prod/files/oeprod/DocumentsandMedia/DOE_Benefits_of_Demand_Response_in_Electricity_Markets_and_Recommendations_for_Achieving_Them_Report_to_Congress.pdf (accessed on 29 July 2023).
- Wang, Z.; Sun, M.; Gao, C.; Wang, X.; Ampimah, B.C. A new interactive real-time pricing mechanism of demand response based on an evaluation model. Appl. Energy 2021, 295, 117052. [Google Scholar] [CrossRef]
- Eid, C.; Koliou, E.; Valles, M.; Reneses, J.; Hakvoort, R. Time-based pricing and electricity demand response: Existing barriers and next steps. Util. Policy 2016, 40, 15–25. [Google Scholar] [CrossRef]
- Jasevics, A.; Zemite, L.; Kunickis, M. Demand load control with smart meters. In Proceedings of the 2017 IEEE 58th Annual International Scientific Conference on Power and Electrical Engineering of Riga Technical University, Riga, Latvia, 10–12 October 2017. [Google Scholar] [CrossRef]
- Sauhats, A.; Zemite, L.; Petrichenko, L.; Moshkin, I.; Jasevics, A. A estimating the economic impacts of net metering schemes for residential PV systems with profiling of power demand, generation, and market prices. Energies 2018, 11, 3222. [Google Scholar] [CrossRef]
- Ferreira, P.; Rocha, A.; Araújo, M. Awareness and attitudes towards demand response programs—A pilot study. In Proceedings of the International Conference on Smart Energy Systems and Technologies (SEST), Seville, Spain, 10–12 September 2018. [Google Scholar] [CrossRef]
- Wesseh, P.K.; Lin, B. A time-of-use pricing model of the electricity market considering system flexibility. Energy Rep. 2022, 8, 1457–1470. [Google Scholar] [CrossRef]
- Gorobetz, M.; Zemite, L.; Jasevics, A.; Korneyev, A. Intelligent Algorithm for using Overall Energy Consumption Statistics. In Proceedings of the 2020 IEEE 61st Annual International Scientific Conference on Power and Electrical Engineering of Riga Technical University, Riga, Latvia, 5–7 November 2020. [Google Scholar] [CrossRef]
- Kaur, A.P.; Singh, M. Time-of-Use tariff rates estimation for optimal demand-side management using electric vehicles. Energy 2023, 273, 127243. [Google Scholar] [CrossRef]
- Goh, H.H.; Zong, L.; Zhang, D.; Dai, W.; Lim, C.S.; Kurniawan, T.A.; Goh, K.C. Orderly Charging Strategy Based on Optimal Time of Use Price Demand Response of Electric Vehicles in Distribution Network. Energies 2022, 15, 1869. [Google Scholar] [CrossRef]
- Hu, W.; Zhang, X.; Zhu, L.; Li, Z. Optimal Allocation Method for Energy Storage Capacity Considering Dynamic Time-of-Use Electricity Prices and On-Site Consumption of New Energy. Energies 2023, 11, 1725. [Google Scholar] [CrossRef]
- Yang, H.; Zhang, X.; Ma, Y.; Zhang, D. Critical peak rebate strategy and application to demand response. Prot. Control Mod. Power Syst. 2021, 6, 28. [Google Scholar] [CrossRef]
- Kii, M.; Sakamoto, K.; Hangai, Y.; Doi, K. The effects of critical peak pricing for electricity demand management on home-based trip generation. IATSS Res. 2014, 37, 89–97. [Google Scholar] [CrossRef]
- Liu, Q.; Tian, J.; Zhang, K.; Yan, Q. Pricing Strategy for a Virtual Power Plant Operator with Electric Vehicle Users Based on the Stackelberg Game. World Electr. Veh. J. 2023, 14, 72. [Google Scholar] [CrossRef]
- Jasevics, A.; Zemite, L.; Gorobecs, M.; Klavina-Makrecka, S. The Impact of Season-Dictated Daylight Saving Measures on Electricity Consumption. In Proceedings of the 2019 IEEE 60th Annual International Scientific Conference on Power and Electrical Engineering of Riga Technical University, Riga, Latvia, 7–9 October 2019. [Google Scholar] [CrossRef]
- Eversource. Variable Peak Pricing FAQ. Available online: https://www.eversource.com/clp/vpp/vppqa.aspx (accessed on 10 August 2023).
- Lu, R.; Bai, R.; Huang, Y.; Li, Y.; Jiang, J.; Ding, Y. Data-driven real-time price-based demand response for industrial facilities energy management. Appl. Energy 2021, 283, 116291. [Google Scholar] [CrossRef]
- Yu, H.; Liu, Z.; Li, C.; Liu, R. Study on Pricing Mechanism of Cooling, Heating, and Electricity Considering Demand Response in the Stage of Park Integrated Energy System Planning. Appl. Sci. 2020, 10, 1565. [Google Scholar] [CrossRef]
- O’Connell, N.; Pinson, P.; Madsen, H.; O’Malley, M. Benefits and challenges of electrical demand response: A critical review. Renew. Sustain. Energy Rev. 2014, 39, 686–699. [Google Scholar] [CrossRef]
- San Francisco Chronicle. As PG&E Summer Rates Kick in, Here’s What You Need to Know. Available online: https://www.sfchronicle.com/climate/article/pge-summer-electricity-rates-18130137.php (accessed on 5 August 2023).
- NSW Department of Infrastructure, Planning and Natural Resources, EnergyAustralia and TransGrid. Demand Management Activities Applicable to Electricity Networks. Available online: https://www.ausgrid.com.au/-/media/Documents/Demand-Mgmt/DMIA-research/DM_Consolidation_Report.pdf (accessed on 5 August 2023).
- Adelphi and Wuppertal Institut. System Integration of Renewables and Smart Grids in Korea. Available online: https://www.energypartnership-korea.org/fileadmin/user_upload/korea/media_elements/8-Study_2019_System_Integration_of_RE_and_Smart_Grids_in_Korea.pdf (accessed on 5 August 2023).
- YLE News. Finns Flock to Spot Price Apps as Power Prices Spike. Available online: https://yle.fi/a/3-12676502 (accessed on 5 August 2023).
- Tokyo Electric Power Company Holdings, Inc. TEPCO Energy Partner, Inc. Available online: https://www.tepco.co.jp/en/hd/newsroom/press/archives/2023/20230123_03.html (accessed on 5 August 2023).
- Astriani, Y.; Shafiullah, G.M.; Shahnia, F. Incentive determination of a demand response program for microgrids. Appl. Energy 2021, 292, 116624. [Google Scholar] [CrossRef]
- Paudyal, P.; Ni, Z. Smart home energy optimization with incentives compensation from inconvenience for shifting electric appliances. Int. J. Electr. Power Energy Syst. 2019, 109, 652–660. [Google Scholar] [CrossRef]
- AGL. Peak Energy Rewards. Available online: https://www.agl.com.au/campaigns/peak-energy-rewards (accessed on 5 August 2023).
- Resideo. Utility Savings Programs. Available online: https://www.resideo.com/us/en/utility-savings-programs/ (accessed on 6 August 2023).
- Ming, H.; Xia, B.; Lee, K.Y.; Adepoju, A.; Shakkottai, S.; Xie, L. Prediction and assessment of demand response potential with coupon incentives in highly renewable power systems. Prot. Control Mod. Power Syst. 2020, 5, 12. [Google Scholar] [CrossRef]
- Edison Electric Institute. Highlights of EEI Member Residential/Commercial/Industrial Efficiency, Demand Response and Renewable Energy Programs. Available online: https://www.eei.org/-/media/Project/EEI/Documents/Issues-and-Policy/EfficiencyandDemandResponsePrograms.pdf (accessed on 6 August 2023).
- Barnes, J.; Hansen, P.; Kamin, T.; Golob, U.; Musolino, M.; Nicita, A. Energy communities as demand-side innovators? Assessing the potential of European cases to reduce demand and foster flexibility. Energy Res. Soc. Sci. 2022, 93, 102848. [Google Scholar] [CrossRef]
- Shekari, M.; Arasteh, H.; Sheikhi Fini, A.; Vahidinasab, V. Demand Response Requirements from the Cultural, Social, and Behavioral Perspectives. Appl. Sci. 2021, 11, 11456. [Google Scholar] [CrossRef]
- Williams, B.; Bishop, D.; Gallardo, P.; Chase, J.G. Demand Side Management in Industrial, Commercial, and Residential Sectors: A Review of Constraints and Considerations. Energies 2023, 16, 5155. [Google Scholar] [CrossRef]
- Green Santa Clarita. Energy Efficiency. Available online: https://greensantaclarita.com/green-friendly-info/energy-efficiency/ (accessed on 6 August 2023).
- National Grid ESO. Demand Side Balancing Reserve & Supplemental Balancing Reserve Update. Available online: https://www.nationalgrideso.com/document/61736/download (accessed on 6 August 2023).
- The Local Europe AB. ‘Ecowatt’: How to Use France’s New Energy Forecasting Website and App. Available online: https://www.thelocal.fr/20220922/ecowatt-how-you-should-use-frances-new-energy-forecasting-website (accessed on 6 August 2023).
- Bal, T.; Ray, S.; Sinha, N.; Devarapalli, R.; Knypiński, Ł. Integrating Demand Response for Enhanced Load Frequency Control in Micro-Grids with Heating, Ventilation and Air-Conditioning Systems. Energies 2023, 16, 5767. [Google Scholar] [CrossRef]
- Abbasi, A.; Sultan, K.; Afsar, S.; Aziz, M.A.; Khalid, H.A. Optimal Demand Response Using Battery Storage Systems and Electric Vehicles in Community Home Energy Management System-Based Microgrids. Energies 2023, 16, 5024. [Google Scholar] [CrossRef]
- TenneT. Reserve Power Plants. Available online: https://www.tennet.eu/markets/reserve-power-plants (accessed on 5 August 2023).
- European Commission. Italian Implementation Plan. Available online: https://energy.ec.europa.eu/system/files/2020-07/italy_market_reform_plan_0.pdf (accessed on 6 August 2023).
- Selectra. Linky: The Smart Meter for Electricity in France. Available online: https://en.selectra.info/energy-france/guides/electricity/linky (accessed on 6 August 2023).
- Interreg Europe. Peak Shaving, Smart Charging, V2G Charging. Available online: https://www.interregeurope.eu/good-practices/peak-shaving-smart-charging-v2g-charging (accessed on 6 August 2023).
- Red Eléctrica. The Peninsular Electricity System Has Available an Active Demand Response Service of Nearly 500 MW to Balance Generation and Demand at Specific Times. Available online: https://www.ree.es/en/press-office/press-release/news/press-release/2022/10/peninsular-electricity-system-has-availablean-active-demand-response-service-of-nearly-500-MW-to-balance-generation-and-demand-specific-times (accessed on 6 August 2023).
- Balkan Green Energy News. Estfeed—Safe Use of Smart Meter Data in Order to Lower Energy Costs. Available online: https://balkangreenenergynews.com/estfeed-safe-use-of-smart-meter-data-in-order-to-lower-energy-costs/ (accessed on 6 August 2023).
- Kurevska, L. Designing Regulatory Framework for Demand Response Service Integration in Baltic Electricity Markets. Ph.D. Thesis, Riga Technical University, Riga, Latvia, 2022. [Google Scholar]
- Vine, E.L.; Kazakevicius, E. Residential energy use in Lithuania: The prospects for energy efficiency. Energy 1999, 24, 591–603. [Google Scholar] [CrossRef]
- Silva, C.; Faria, P.; Vale, Z.; Corchado, J.M. Demand response performance and uncertainty: A systematic literature review. Energy Strategy Rev. 2022, 41, 100857. [Google Scholar] [CrossRef]
- U.S. Department of Energy, Office of Scientific and Technical Information. Open Automated Demand Response Communications Specification (Version 1.0). Available online: https://www.osti.gov/biblio/951952 (accessed on 10 August 2023).
- California Public Utilities Commission. Joint Investor Owned Utilities (Iou) Proposed Guidelines for the 2018–2022 Automated Demand Response Technology Incentive (Auto-Dr) Program. Available online: https://docs.cpuc.ca.gov/PublishedDocs/Published/G000/M233/K824/233824767.pdf (accessed on 10 August 2023).
- Aujla, G.S.; Garg, S.; Batra, S.; Kumar, N.; You, I.; Sharma, V. DROpS: A demand response optimization scheme in SDN-enabled smart energy ecosystem. Inf. Sci. 2019, 476, 453–473. [Google Scholar] [CrossRef]
- International Energy Agency. Smart Grids. Available online: https://www.iea.org/energy-system/electricity/smart-grids (accessed on 10 August 2023).
- EnergyPortal.eu. AI-Powered Solutions for Predicting and Managing Energy Demand. Available online: https://www.energyportal.eu/news/ai-powered-solutions-for-predicting-and-managing-energy-demand/47810/ (accessed on 12 August 2023).
- Kumar, M.; Panda, K.P.; Naayagi, R.T.; Thakur, R.; Panda, G. Comprehensive Review of Electric Vehicle Technology and Its Impacts: Detailed Investigation of Charging Infrastructure, Power Management, and Control Techniques. Appl. Sci. 2023, 13, 8919. [Google Scholar] [CrossRef]
- Rekioua, D. Energy Storage Systems for Photovoltaic and Wind Systems: A Review. Energies 2023, 16, 3893. [Google Scholar] [CrossRef]
- Agbonaye, O.; Keatley, P.; Huang, Y.; Odiase, F.O.; Hewitt, N. Value of demand flexibility for managing wind energy constraint and curtailment. Renew. Energy 2022, 190, 487–500. [Google Scholar] [CrossRef]
- Vempere, L.; Jasevics, A.; Zemite, L.; Vempers, G. Methodology for Investment Evaluation in Electricity Generation Modules according to the Requirements of the European Union. Latv. J. Phys. Tech. Sci. 2021, 58, 15–31. [Google Scholar] [CrossRef]
- Dlamini, N.G.; Cromieres, F. Implementing peak load reduction algorithms for household electrical appliances. Energy Policy 2012, 44, 280–290. [Google Scholar] [CrossRef]
- United Kingdom Government. Department of Energy & Climate Change. Smart Metering Implementation Programme. Available online: https://assets.publishing.service.gov.uk/government/uploads/system/uploads/attachment_data/file/245736/smart_meters_domestic_leaflet.pdf (accessed on 12 August 2023).
- Southern California Edison. Open Automated Demand Response. Available online: https://sce.openadr.com/pss2.website/Login (accessed on 12 August 2023).
- Tesla. Tesla Powerpack to Enable Large Scale Sustainable Energy to South Australia. Available online: https://www.tesla.com/blog/tesla-powerpack-enable-large-scale-sustainable-energy-south-australia (accessed on 12 August 2023).
- Smart Energy Europe. Available online: https://smarten.eu/enernoc/ (accessed on 12 August 2023).
- Tamis, M.; van den Hoed, R.; Thorsdottir, H. Smart Charging in the Netherlands. In Proceedings of the European Battery, Hybrid & Electric Fuel Cell Electric Vehicle Congress, Geneva, Switzerland, 14–16 March 2017. [Google Scholar]
- Rahman, M. Modelling and Analysis of Demand Response Implementation in the Residential Sector. Ph.D. Thesis, Murdoch University, Murdock, Australia, April 2019. [Google Scholar]
- Statkraft. Virtual Power Plants. Available online: https://www.statkraft.com/what-we-offer/energy-flexibility-management/virtual-power-plants/ (accessed on 12 August 2023).
- Popławski, T.; Dudzik, S.; Szeląg, P.; Baran, J. A Case Study of a Virtual Power Plant (VPP) as a Data Acquisition Tool for PV Energy Forecasting. Energies 2021, 14, 6200. [Google Scholar] [CrossRef]
- Institute for Energy Economics and Financial Analyses. What Is the State of Virtual Power Plants in Australia? Available online: https://ieefa.org/wp-content/uploads/2022/03/What-Is-the-State-of-Virtual-Power-Plants-in-Australia_March-2022_2.pdf (accessed on 29 July 2023).
- U.S. Department of Energy. Sector Spotlight: Virtual Power Plants. Available online: https://www.energy.gov/lpo/articles/sector-spotlight-virtual-power-plants (accessed on 31 July 2023).
- Australian Government, Australian Renewable Energy Agency. Dynamic Operating Envelopes Workstream. Available online: https://arena.gov.au/knowledge-innovation/distributed-energy-integration-program/dynamic-operating-envelopes-workstream/ (accessed on 31 July 2023).
- Behi, B.; Baniasadi, A.; Arefi, A.; Gorjy, A.; Jennings, P.; Pivrikas, A. Cost–Benefit Analysis of a Virtual Power Plant Including Solar PV, Flow Battery, Heat Pump, and Demand Management: A Western Australian Case Study. Energies 2020, 13, 2614. [Google Scholar] [CrossRef]
- Australian Energy Market Operator. Virtual Power Plant (VPP) Demonstrations. Available online: https://aemo.com.au/en/initiatives/major-programs/nem-distributed-energy-resources-der-program/der-demonstrations/virtual-power-plant-vpp-demonstrations (accessed on 31 July 2023).
- Chakraborty, M.R.; Dawn, S.; Saha, P.K.; Basu, J.B.; Ustun, T.S. A Comparative Review on Energy Storage Systems and Their Application in Deregulated Systems. Batteries 2022, 8, 124. [Google Scholar] [CrossRef]
- Zemite, L.; Backurs, A.; Starikovs, A.; Laizans, A.; Jansons, L.; Vempere, L.; Bode, I.; Broks, A. A comprehensive overview of the European and Baltic landscape for hydrogen applications and innovations. Latv. J. Phys. Tech. Sci. 2023, 60, 33–53. [Google Scholar] [CrossRef]
- Yue, M.; Lambert, H.; Pahon, E.; Roche, R.; Jemei, S.; Hissel, D. Hydrogen energy systems: A critical review of technologies, applications, trends and challenges. Renew. Sustain. Energy Rev. 2021, 146, 111180. [Google Scholar] [CrossRef]
- Berna-Escriche, C.; Vargas-Salgado, C.; Alfonso-Solar, D.; Escrivá-Castells, A. Hydrogen Production from Surplus Electricity Generated by an Autonomous Renewable System: Scenario 2040 on Grand Canary Island, Spain. Sustainability 2022, 14, 11884. [Google Scholar] [CrossRef]
- Keiner, D.; Thoma, C.; Bogdanov, D.; Breyer, C. Seasonal hydrogen storage for residential on- and off-grid solar photovoltaics prosumer applications: Revolutionary solution or niche market for the energy transition until 2050? Appl. Energy 2019, 340, 121009. [Google Scholar] [CrossRef]
- Kobzars, V.; Zemite, L.; Jasevics, A.; Kleperis, J.; Dimanta, I.; Knoks, A.; Lesnicenoks, P. Appropriateness of Hydrogen Production in Low-Power Hydropower Plant. In Proceedings of the 2021 IEEE 62nd International Scientific Conference on Power and Electrical Engineering of Riga Technical University, Riga, Latvia, 15–17 November 2021. [Google Scholar] [CrossRef]
- Vempere, L.; Zemite, L.; Vempers, G.; Bode, I.; Jasevics, A. Assessment of prospective energy storage options for the heat plant—A case study. In Proceedings of the 2022 IEEE 63rd Annual International Scientific Conference on Power and Electrical Engineering of Riga Technical University, Riga, Latvia, 10–12 October 2022. [Google Scholar] [CrossRef]
- Lekidis, A.; Papageorgiou, E.I. Edge-Based Short-Term Energy Demand Prediction. Energies 2023, 16, 5435. [Google Scholar] [CrossRef]
- Atteya, A.I.; Ali, D.; Sellami, N. Precise Dynamic Modelling of Real-World Hybrid Solar-Hydrogen Energy Systems for Grid-Connected Buildings. Energies 2023, 16, 5449. [Google Scholar] [CrossRef]
- Mitali, J.; Dhinakaran, S.; Mohamad, A.A. Energy storage systems: A review. Energy Storage Sav. 2022, 1, 166–216. [Google Scholar] [CrossRef]
- Saygin, D.; Blanco, H.; Boshell, F.; Cordonnier, J.; Rouwenhorst, K.; Lathwal, P.; Gielen, D. Ammonia Production from Clean Hydrogen and the Implications for Global Natural Gas Demand. Sustainability 2023, 15, 1623. [Google Scholar] [CrossRef]
- Sayed, E.T.; Olabi, A.G.; Alami, A.H.; Radwan, A.; Mdallal, A.; Rezk, A.; Abdelkareem, M.A. Renewable Energy and Energy Storage Systems. Energies 2023, 16, 1415. [Google Scholar] [CrossRef]
- Canadian Climate Institute. Germany’s Energiewende 4.0 Project, Lessons for Canada’s Electricity System Transformation. Available online: https://climateinstitute.ca/publications/electricity-system-innovation/ (accessed on 12 August 2023).
- Ponton. Available online: https://www.ponton.de/new-4-0-completed (accessed on 12 August 2023).
- Silva, C.; Faria, P.; Vale, Z.; Corchado, J.M. Demand Response Implementation: Overview of Europe and United States Status. Energies 2023, 16, 4043. [Google Scholar] [CrossRef]
- Hille, S.; Weber, S.; Brosch, T. Consumers’ preferences for electricity-saving programs: Evidence from a choice-based conjoint study. J. Clean. Prod. 2019, 220, 800–815. [Google Scholar] [CrossRef]
- Morton, A.; Wang, Y.; Zhang, W. Willingness to Participate in Demand Response in the US Midwest: A Market with Great Potential? Center for Agricultural and Rural Development: Ames, IA, USA, 2021; pp. 1–25. [Google Scholar]
- United Kingdom Government. Realising the Potential of Demand-Side Response to 2025. Available online: https://assets.publishing.service.gov.uk/government/uploads/system/uploads/attachment_data/file/657143/DSRReferences_document.pdf (accessed on 30 July 2023).
- Sloot, D.; Lehmann, N.; Ardone, A.; Fichtner, W. A Behavioral Science Perspective on Consumers’ Engagement with Demand Response Programs. Energy Res. Lett. 2023, 4, 1–7. [Google Scholar] [CrossRef]
- Parrish, B.; Heptonstall, P.; Gross, R.; Sovacool, B.K. A systematic review of motivations, enablers and barriers for consumer engagement with residential demand response. Energy Policy 2020, 138, 111221. [Google Scholar] [CrossRef]
- Rezaeimozafar, M.; Monaghan, R.F.D.; Barrett, E.; Duffy, M. A review of behind-the-meter energy storage systems in smart grids. Renew. Sustain. Energy Rev. 2022, 164, 112573. [Google Scholar] [CrossRef]
- Jin-Ho, K.; Shcherbakova, A. Common failures of demand response. Energy 2011, 36, 873–880. [Google Scholar] [CrossRef]
- Sridhar, A.; Honkapuro, S.; Ruiz, F.; Stoklasa, J.; Annala, S.; Wolff, A.; Rautiainen, A. Residential consumer preferences to demand response: Analysis of different motivators to enroll in direct load control demand response. Energy Policy 2023, 173, 113420. [Google Scholar] [CrossRef]
- Srivastava, A.; Passel, S.; Laes, E. Dissecting demand response: A quantile analysis of flexibility, household attitudes, and demographics. Energy Res. Soc. Sci. 2019, 52, 169–180. [Google Scholar] [CrossRef]
- Brown, M.A.; Chapman, O. The size, causes, and equity implications of the demand-response gap. Energy Policy 2021, 158, 112533. [Google Scholar] [CrossRef]
- Lashmar, N.; Wade, B.; Molyneaux, L.; Ashworth, P. Motivations, barriers, and enablers for demand response programs: A commercial and industrial consumer perspective. Energy Res. Soc. Sci. 2022, 90, 102667. [Google Scholar] [CrossRef]
- DISTRIBUTECH International. BGE Delivers Demand Response Programs for Customer Benefits. Available online: https://www.power-grid.com/news/bge-delivers-demand-response-programs-for-customer-benefits-1/#gref (accessed on 12 August 2023).
- Energy Market Authority. Demand Response Programme. Available online: https://www.ema.gov.sg/Demand_Response_Program.aspx (accessed on 12 August 2023).
- NSW Government. Case Study: Businesses Share Solar Power to Save Money and Reduce Emissions. Available online: https://www.energy.nsw.gov.au/sites/default/files/2022-08/Enova%20case%20study.pdf (accessed on 12 August 2023).
- European Commission. Clean Energy for EU Islands: Study on Regulatory Barriers and Recommendation for Clean Energy Transition on the Islands, Italy. Available online: https://clean-energy-islands.ec.europa.eu/system/files/2023-01/PUBLIC_IslandSecretariatII_Study%20barriers%20and%20recommendationsITALY.20221220%20final.pdf (accessed on 12 August 2023).
- RTE. Benefit from a Support Mechanism for the Demand Response Industry. Available online: https://www.services-rte.com/en/learn-more-about-our-services/benefit-from-a-support-mechanism.html (accessed on 12 August 2023).
- Kainiemi, L.; Eloneva, S.; Levänen, J. Transition towards a decentralised energy system: Analysing prospects for innovation facilitation and regime destabilisation in Finland. Technol. Anal. Strateg. Manag. 2019, 31, 1003–1015. [Google Scholar] [CrossRef]
- Gamma, K.; Mai, R.; Cometta, C.; Loock, M. Engaging customers in demand response programs: The role of reward and punishment in customer adoption in Switzerland. Energy Res. Soc. Sci. 2021, 74, 101927. [Google Scholar] [CrossRef]
- Petrichenko, L.; Zemite, L.; Sauhats, A.; Klementavicius, A.; Grickevics, K. A Comparative Analysis of Supporting Policies for Solar PV systems in the Baltic Countries. In Proceedings of the 2019 IEEE International Conference on Environment and Electrical Engineering and 2019 IEEE Industrial and Commercial Power Systems Europe, EEEIC/I and CPS Europe, Genova, Italy, 11–14 June 2019. [Google Scholar] [CrossRef]
- European Commission. Electricity Market Design. Available online: https://energy.ec.europa.eu/topics/markets-and-consumers/market-legislation/electricity-market-design_en (accessed on 13 August 2023).
- Annala, S.; Lukkarinen, J.; Primmer, E.; Honkapuro, S.; Ollikka, K.; Sunila, K.; Ahonen, T. Regulation as an enabler of demand response in electricity markets and power systems. J. Clean. Prod. 2018, 195, 1139–1148. [Google Scholar] [CrossRef]
- Abdul Qadir, S.; Al-Motairi, H.; Tahir, F.; Al-Fagih, L. Incentives and strategies for financing the renewable energy transition: A review. Energy Rep. 2021, 7, 3590–3606. [Google Scholar] [CrossRef]
- Official Journal of the European Union. DIRECTIVE (EU) 2019/944 of the European Parliament and of the Council of 5 June 2019 on Common Rules for the Internal Market for Electricity and Amending Directive 2012/27/EU. Available online: https://eur-lex.europa.eu/legal-content/EN/TXT/PDF/?uri=CELEX:32019L0944 (accessed on 13 August 2023).
- McPherson, M.; Stoll, B. Demand response for variable renewable energy integration: A proposed approach and its impacts. Energy 2020, 197, 117205. [Google Scholar] [CrossRef]
- European Commission. Proposal for a Regulation of the European Parliament and of the Council Amending Regulations (EU) 2019/943 and (EU) 2019/942 as Well as Directives (EU) 2018/2001 and (EU) 2019/944 to Improve the Union’s Electricity Market Design. Available online: https://eur-lex.europa.eu/legal-content/EN/TXT/PDF/?uri=CELEX:52023PC0148 (accessed on 13 August 2023).
- Schneider Electric. The Benefits of Demand Response for Utilities. Available online: https://www.energy-pool.eu/wp-content/uploads/2016/07/The-benefits-of-Demand-Response-for-Utilities.pdf (accessed on 13 August 2023).
- Strbac, G. Demand side management: Benefits and challenges. Energy Policy 2008, 36, 4419–4426. [Google Scholar] [CrossRef]
- AEMO. Wholesale Demand Response Mechanism. Available online: https://aemo.com.au/en/initiatives/trials-and-initiatives/wholesale-demand-response-mechanism (accessed on 13 August 2023).
- Argus. Brazil’s Power Market Welcomes Demand Response Plan. Available online: https://www.argusmedia.com/en/news/2379033-brazils-power-market-welcomes-demand-response-plan (accessed on 13 August 2023).
- International Energy Agency. Reforming Korea’s Electricity Market for Net Zero. Available online: https://iea.blob.core.windows.net/assets/ab5343c6-5220-4154-a88e-750de58b9c8c/ReformingKoreasElectricityMarketforNetZero.pdf (accessed on 13 August 2023).
- Energy Market Authority. Regulatory Sandbox to Promote Energy Demand Management. Available online: https://www.ema.gov.sg/media_release.aspx?news_sid=20221024BUJD4YDq1igs (accessed on 13 August 2023).
- European Commission. Digitalisation of the Energy System. Available online: https://energy.ec.europa.eu/topics/energy-systems-integration/digitalisation-energy-system_en (accessed on 13 August 2023).
- European Commission. Clean Energy for All Europeans Package. Available online: https://energy.ec.europa.eu/topics/energy-strategy/clean-energy-all-europeans-package_en (accessed on 13 August 2023).
- Danish Ministry of Climate, Energy and Utilities. Denmark’s Integrated National Energy and Climate Plan. Available online: https://energy.ec.europa.eu/system/files/2020-01/dk_final_necp_main_en_0.pdf (accessed on 13 August 2023).
- International Energy Agency. IEA Policy Review Commends Germany’s Ambitious Efforts to Advance Its Clean Energy Transition. Available online: https://www.iea.org/news/iea-policy-review-commends-germanys-ambitious-efforts-to-advance-its-clean-energy-transition (accessed on 13 August 2023).
- Gangale, F.; Mengolini, A.; Vasiljevska, J. Smart Grid Baltic: Smart grid challenges and opportunities in the Baltic Region. In Proceedings of the JCR Conference and Workshop Reports, Riga, Latvia, 14–15 November 2016; Publications Office of the European Union: Luxembourg, 2018. [Google Scholar] [CrossRef]
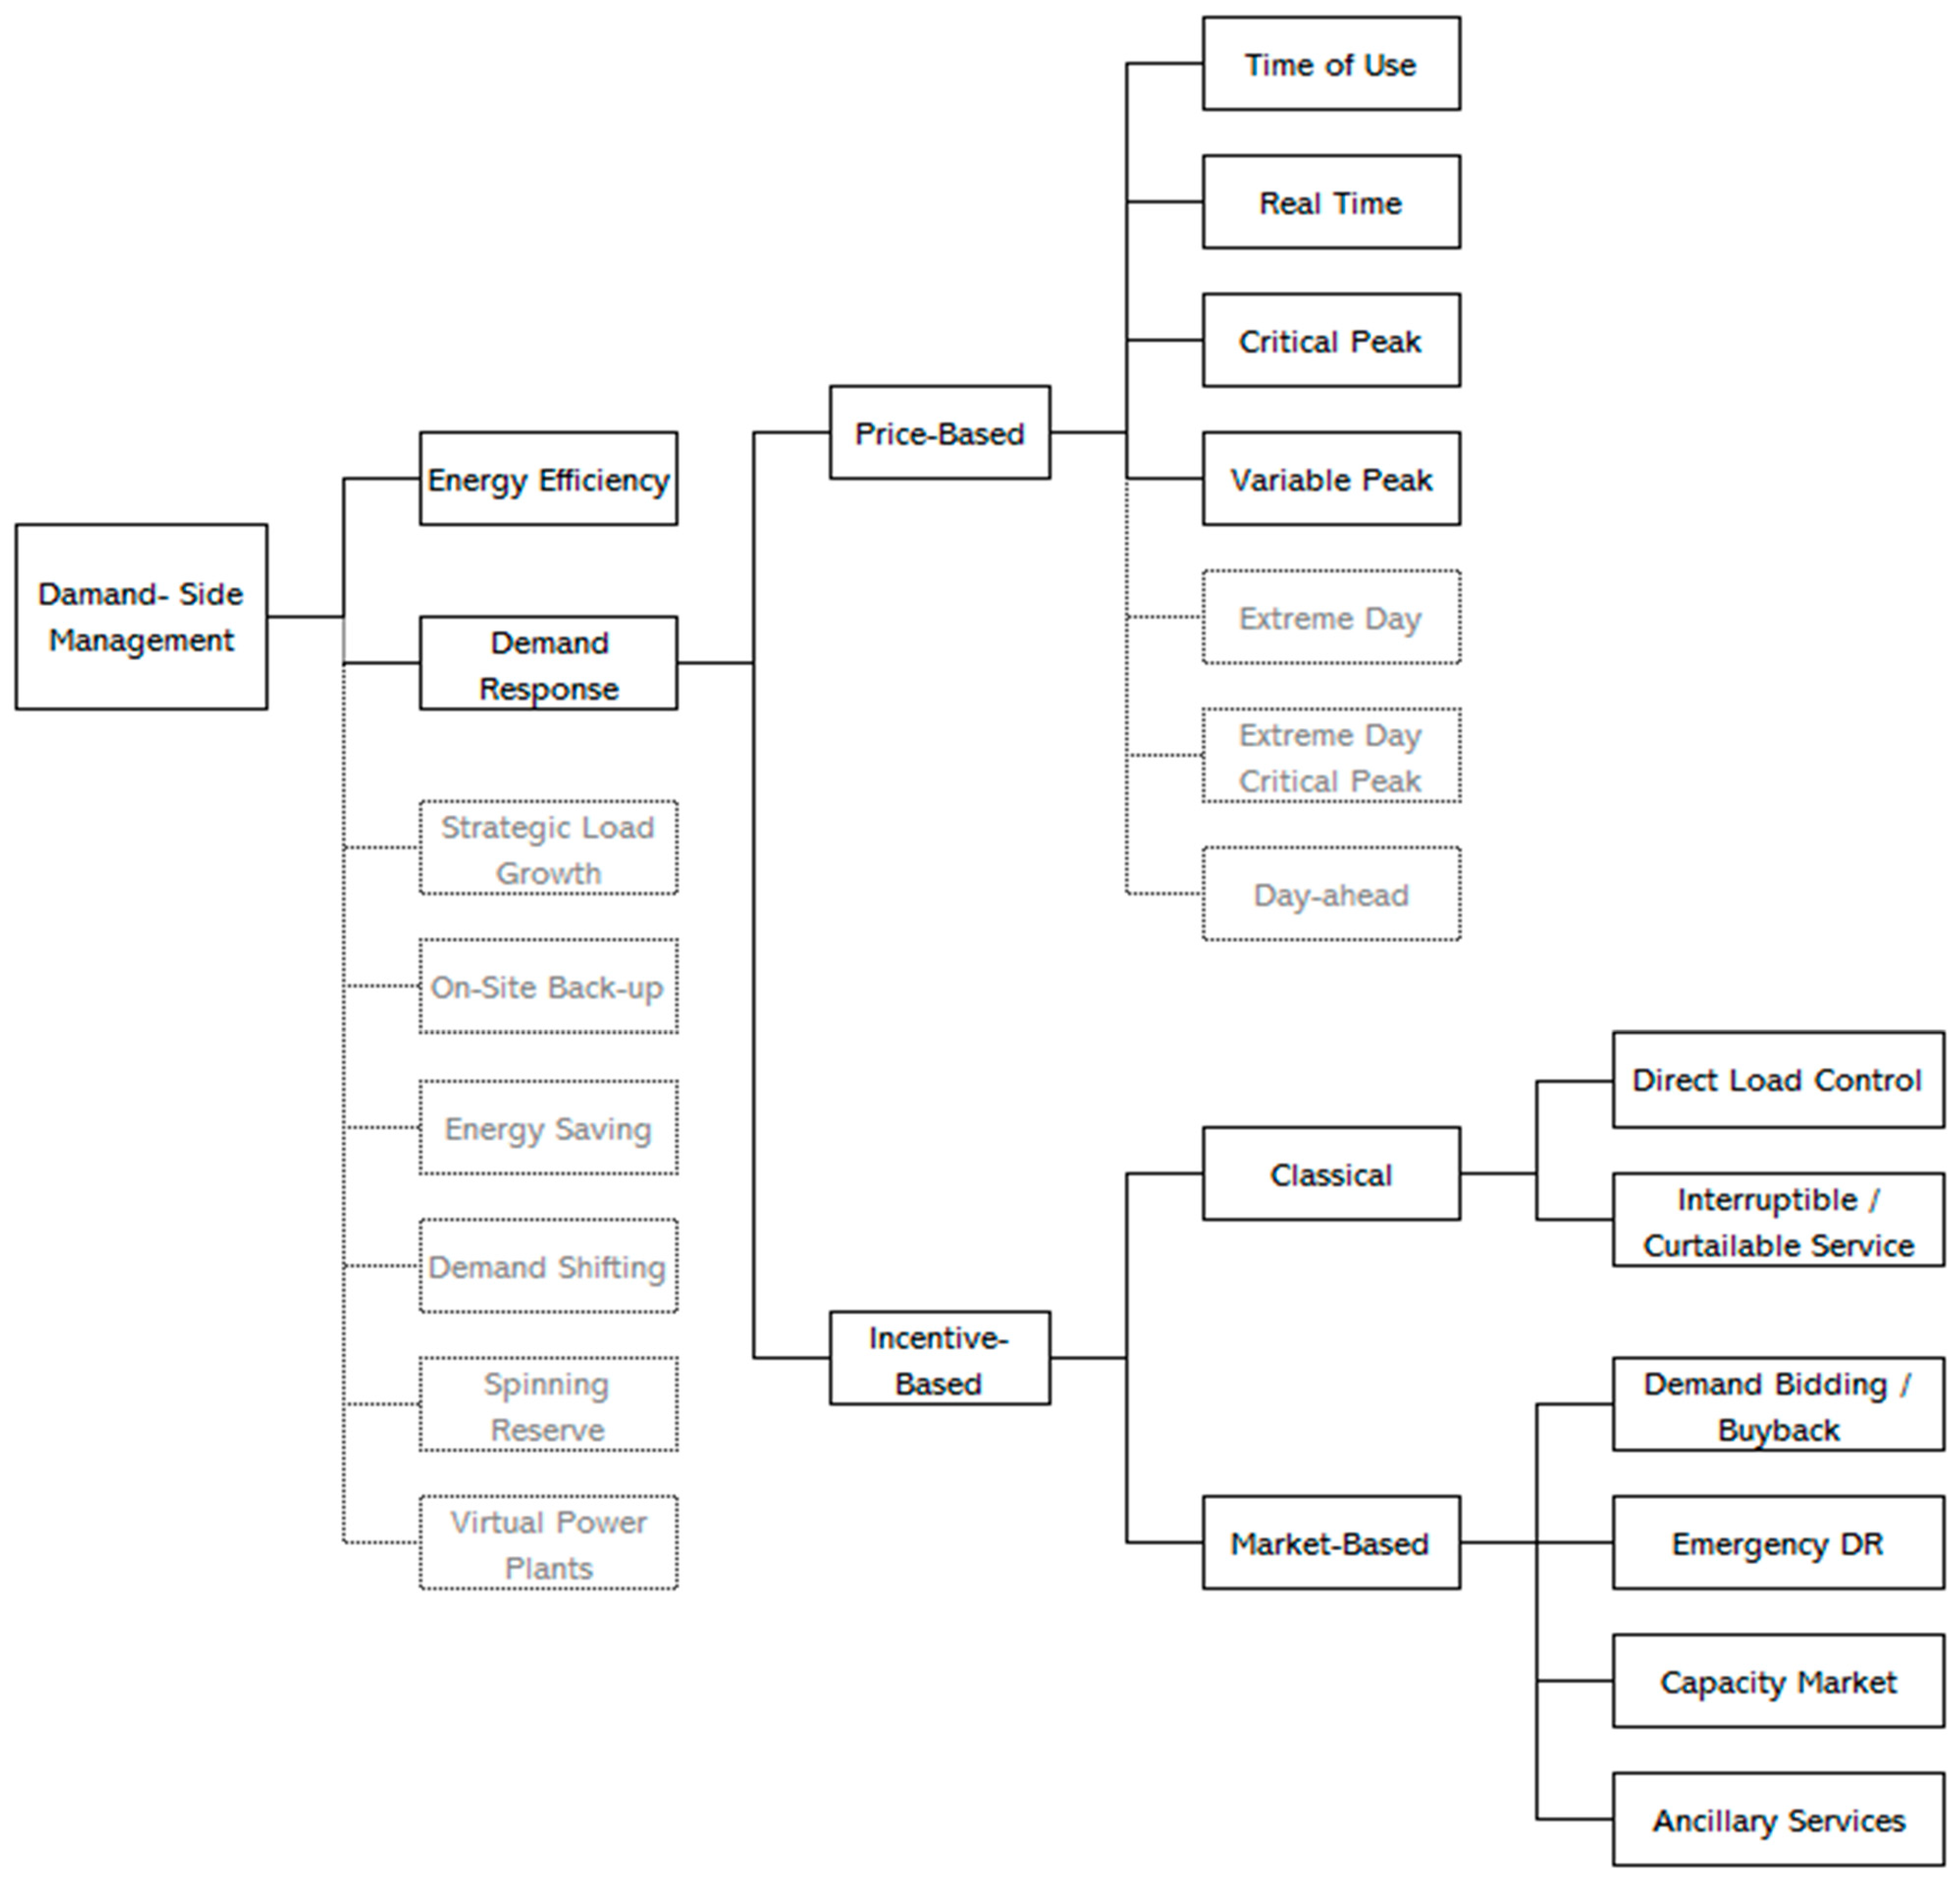


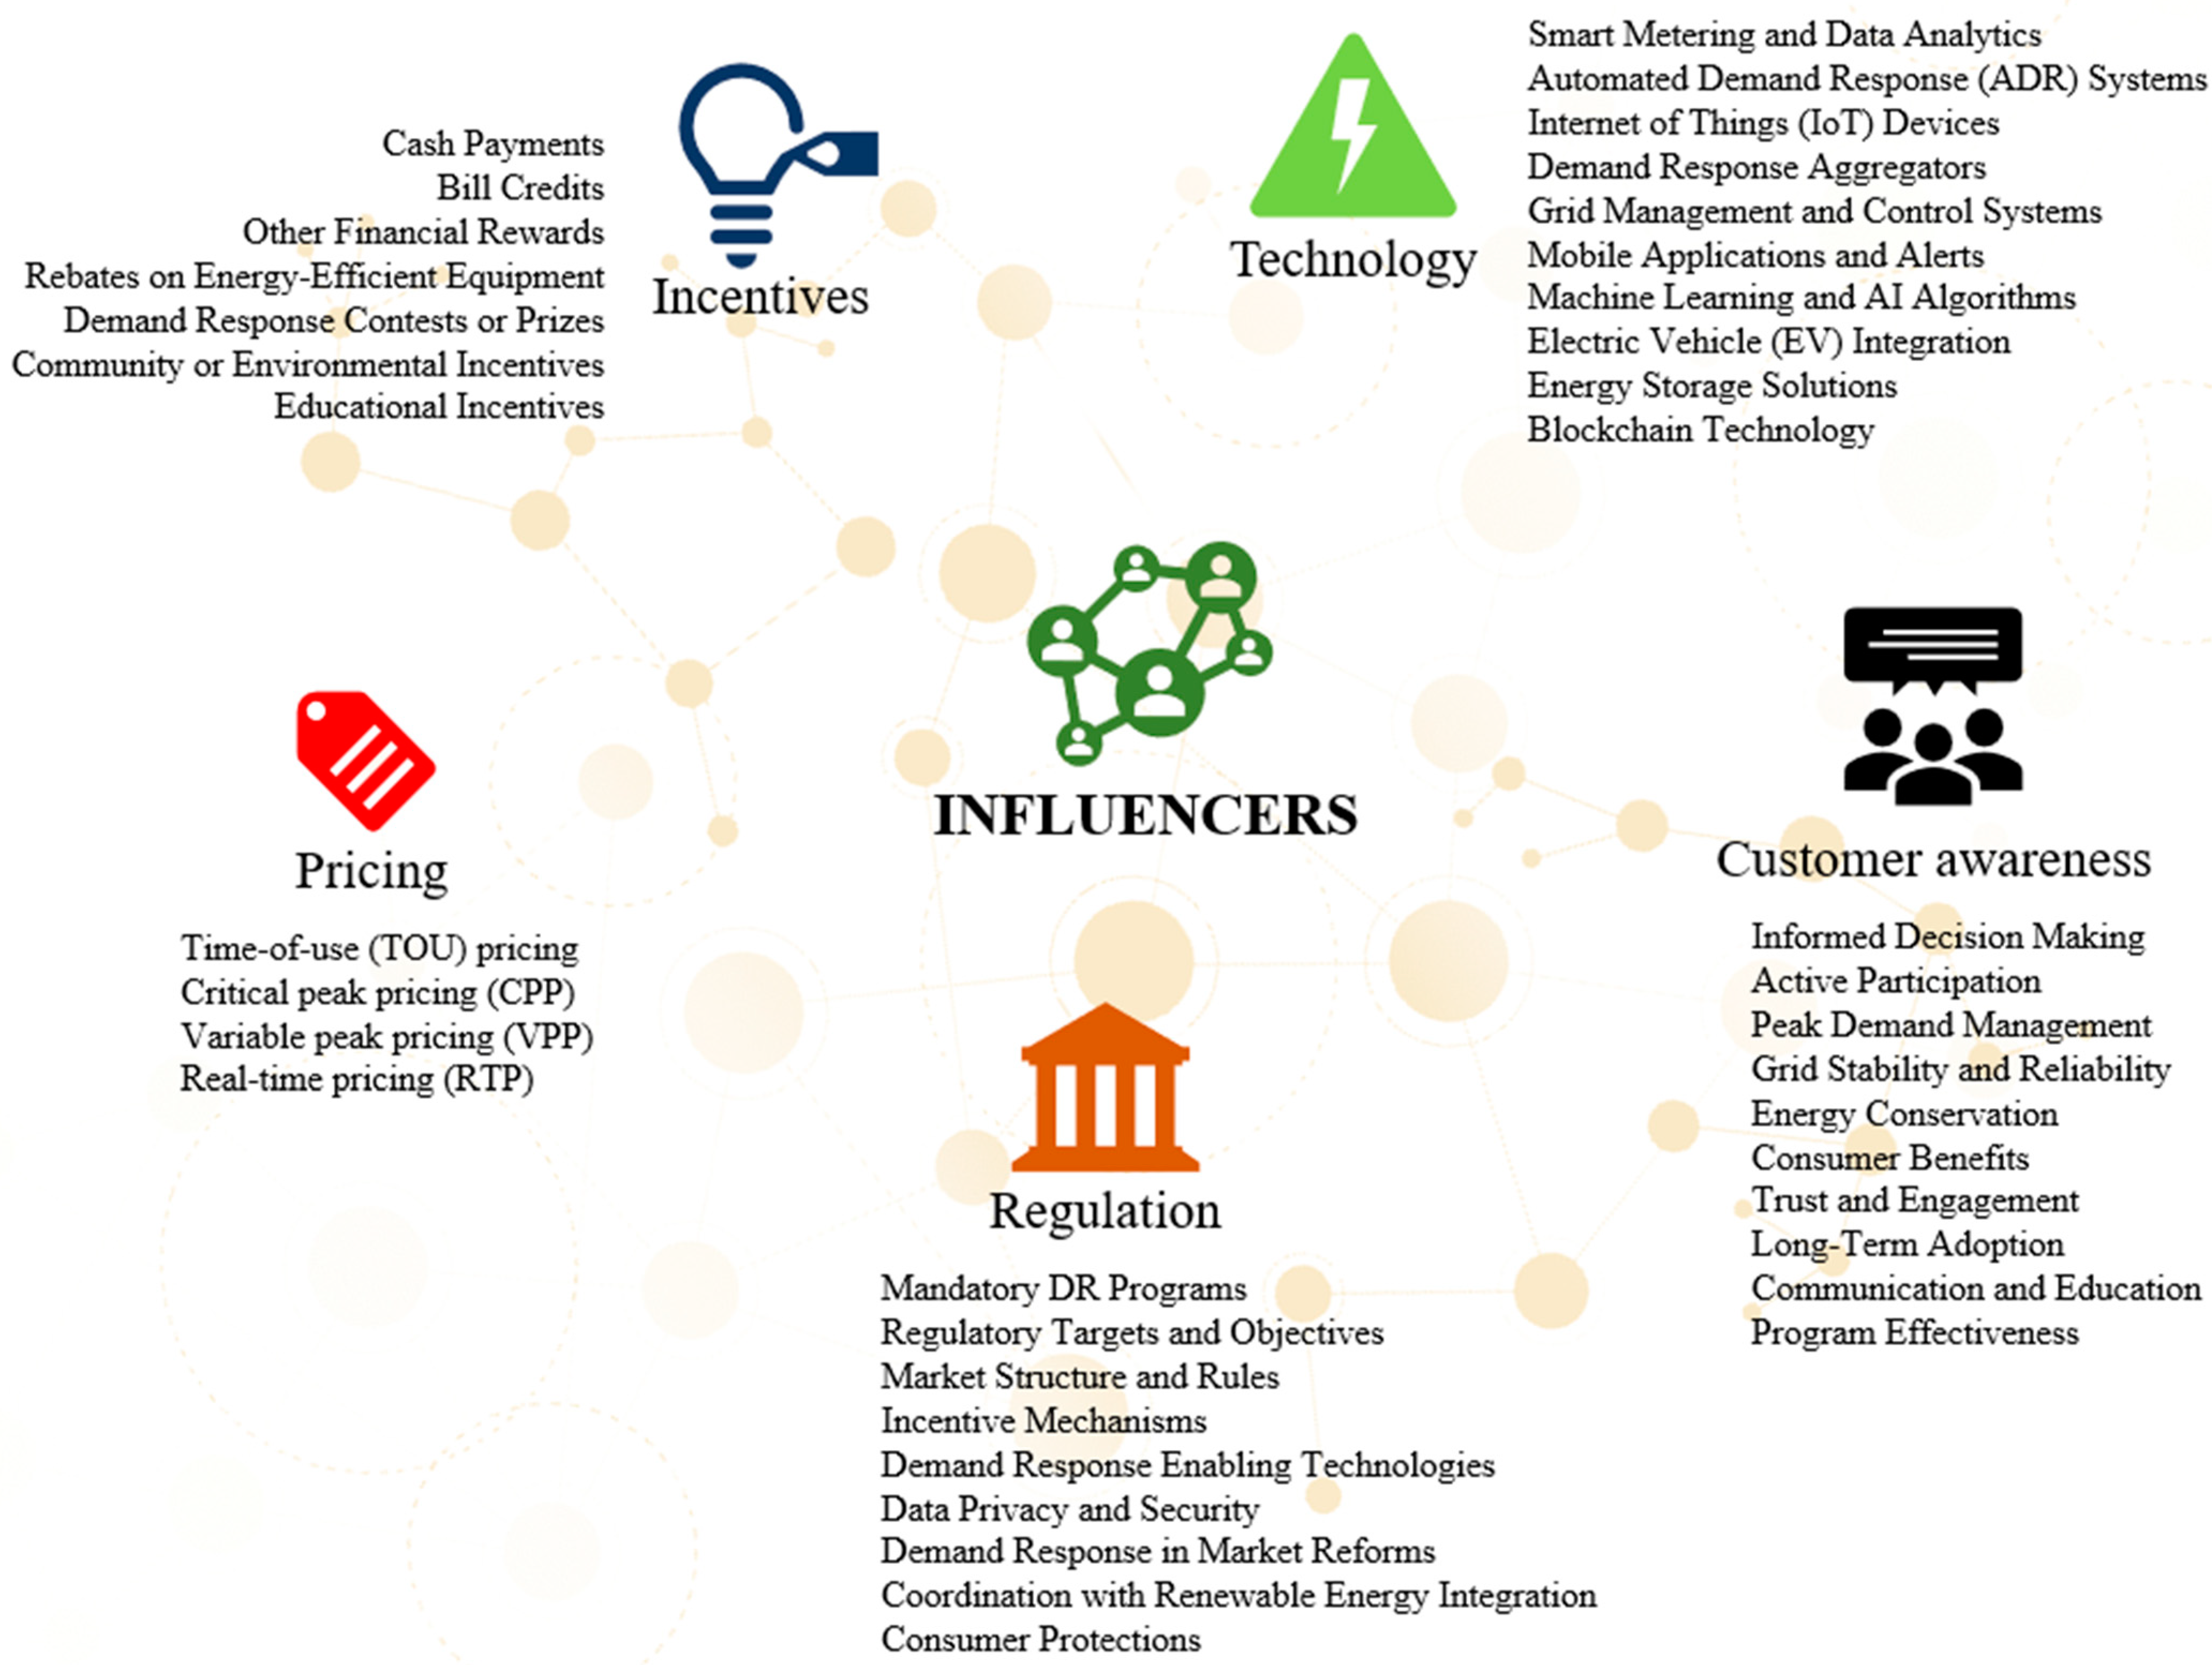
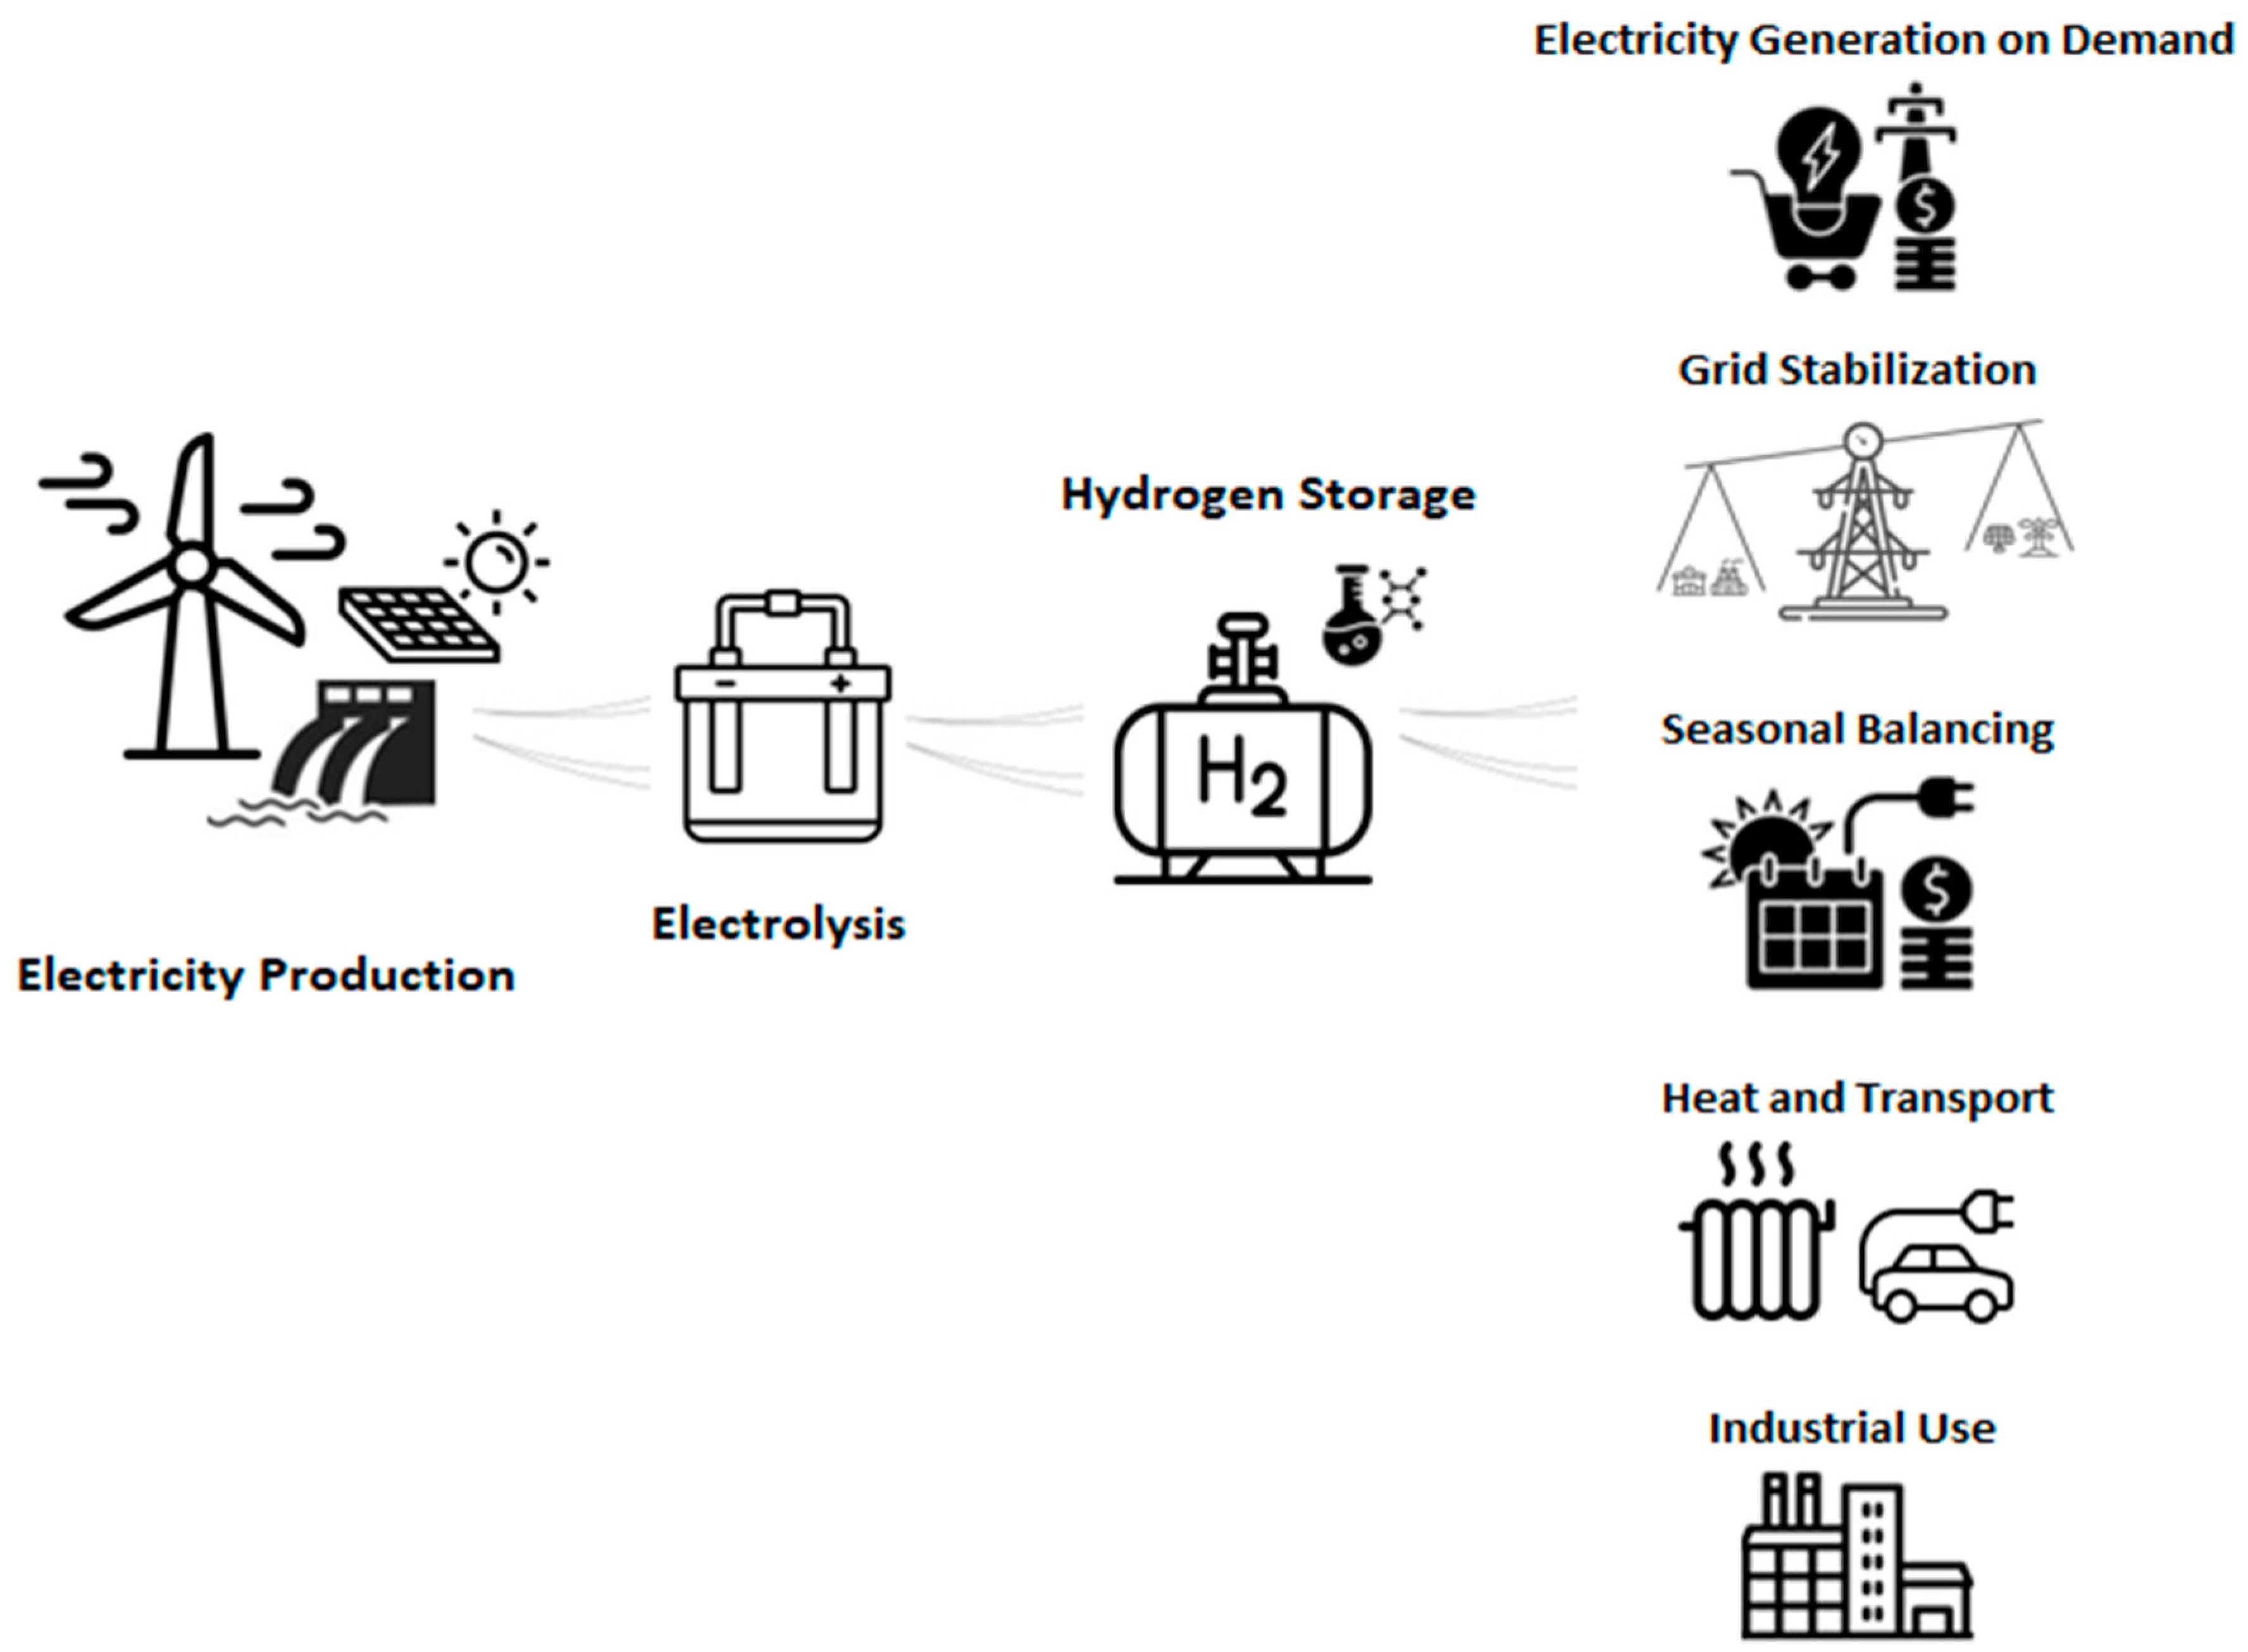
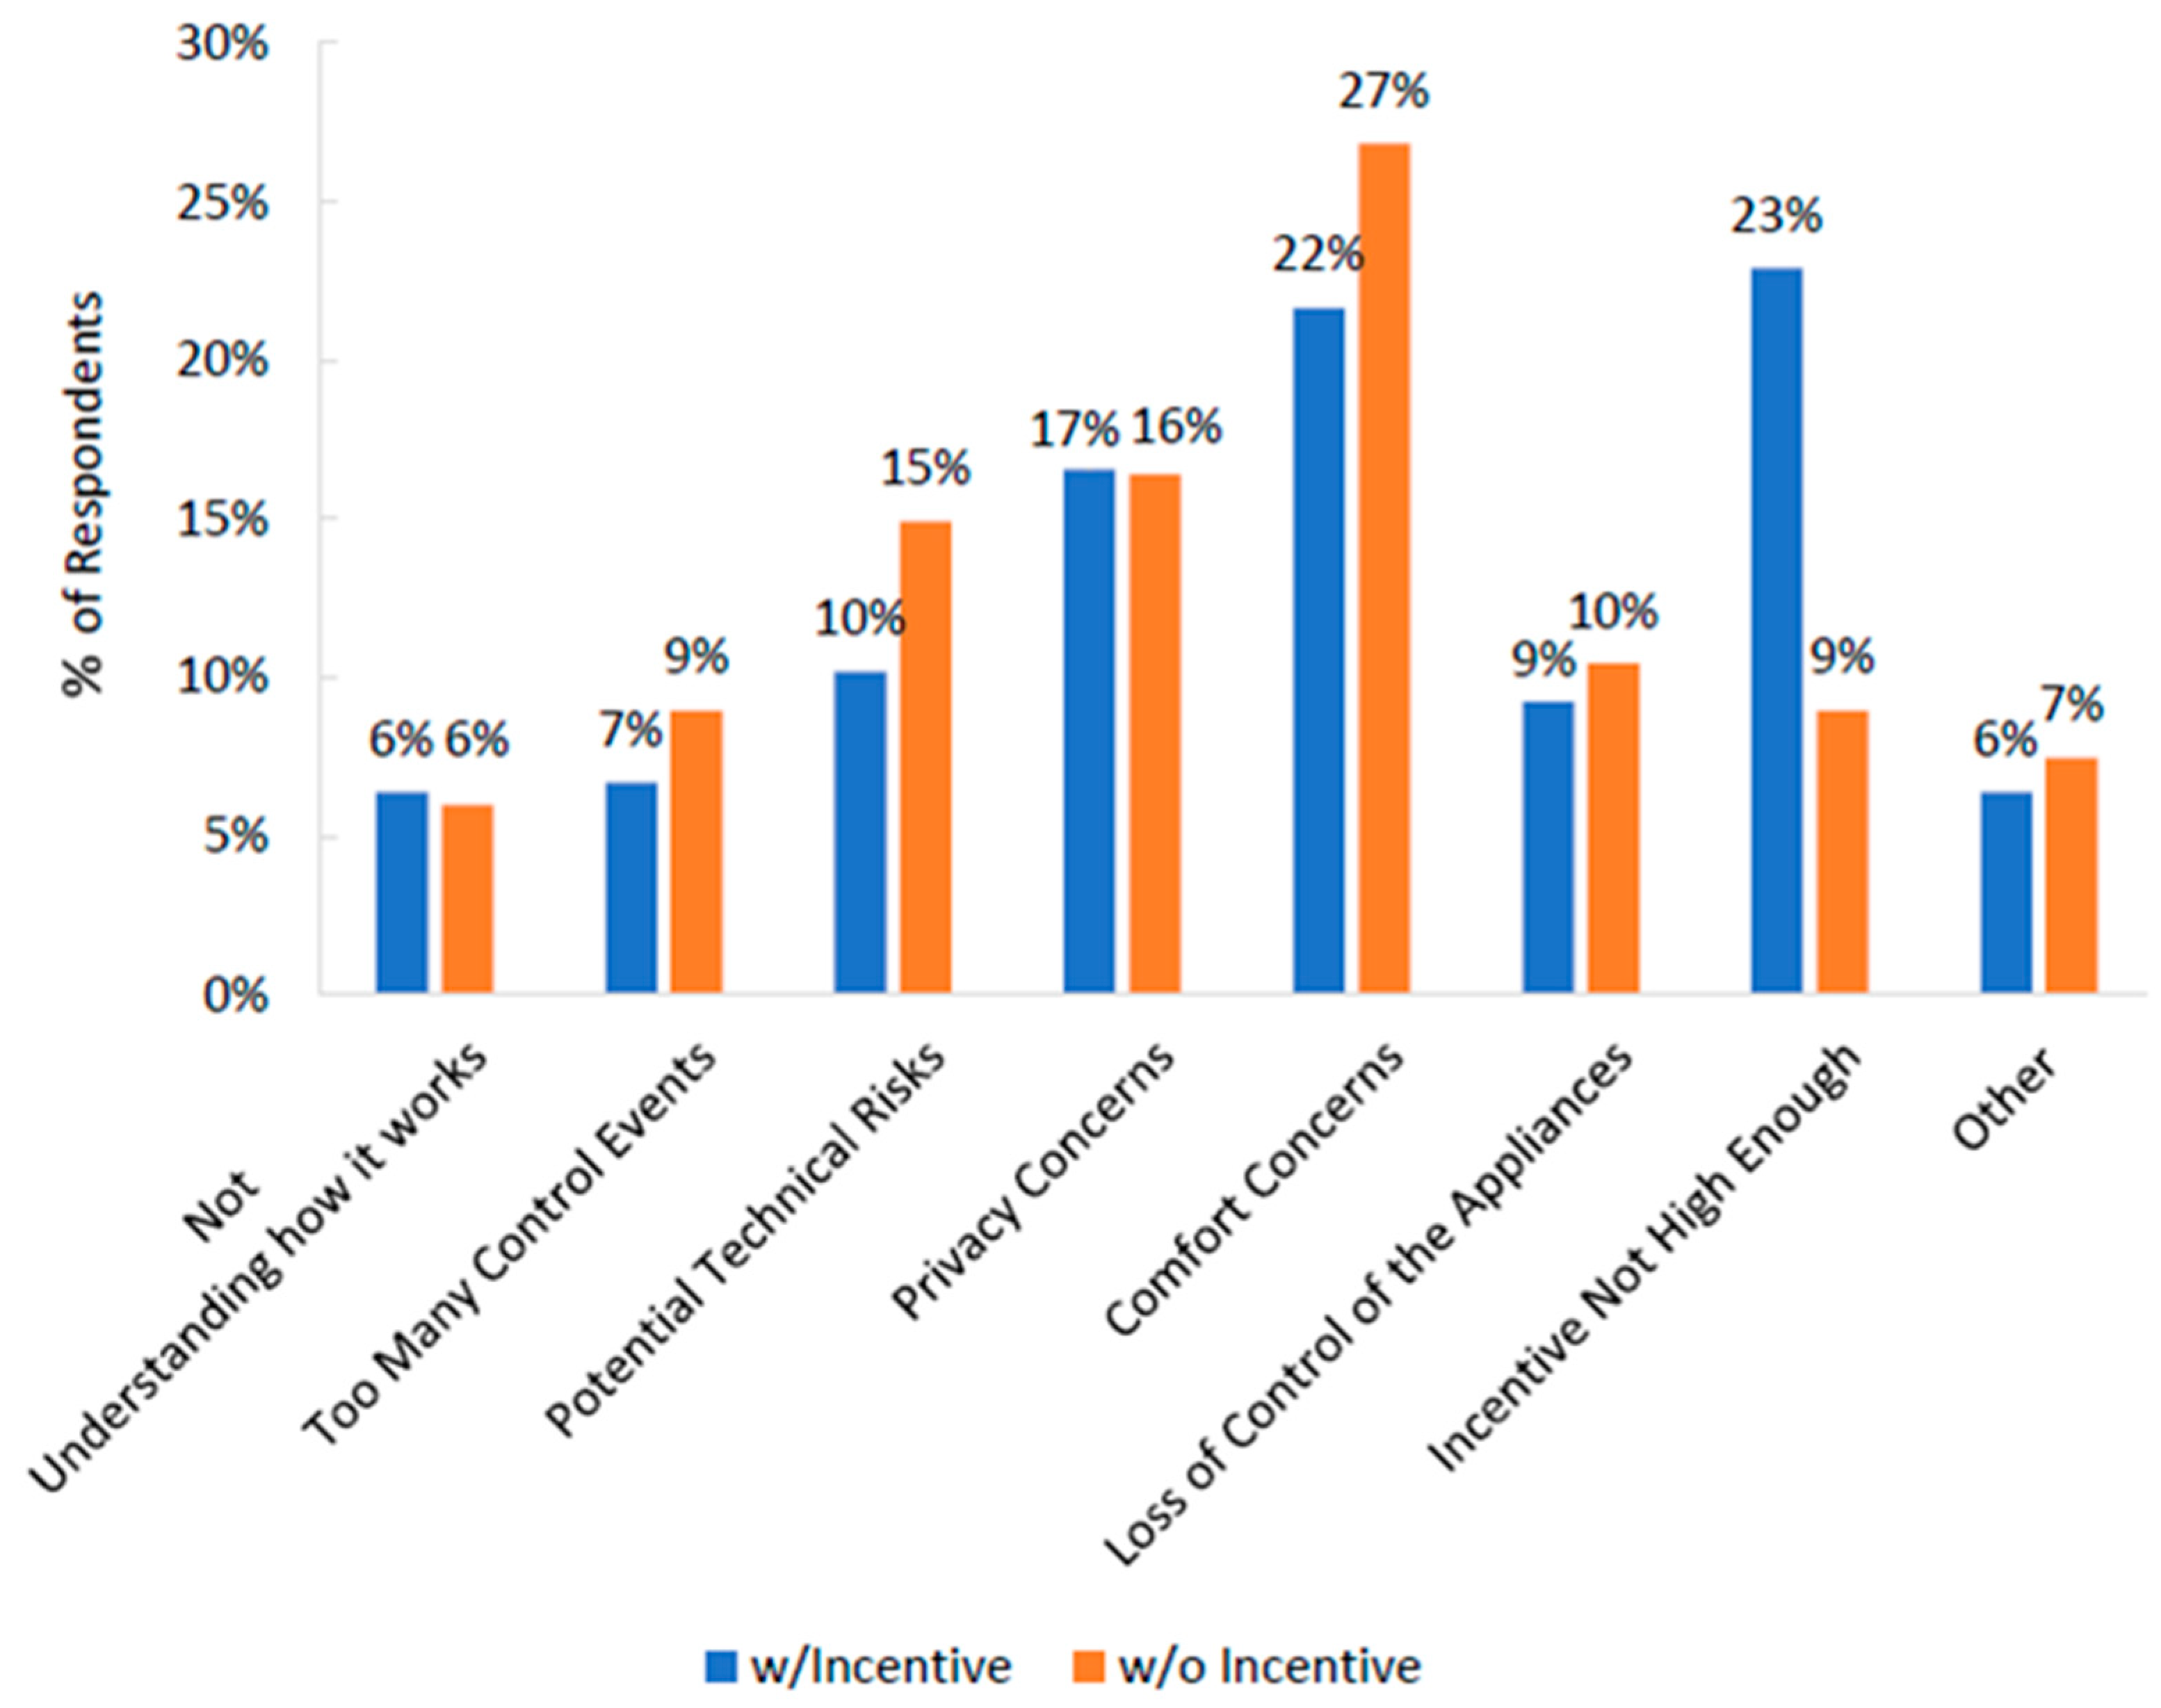
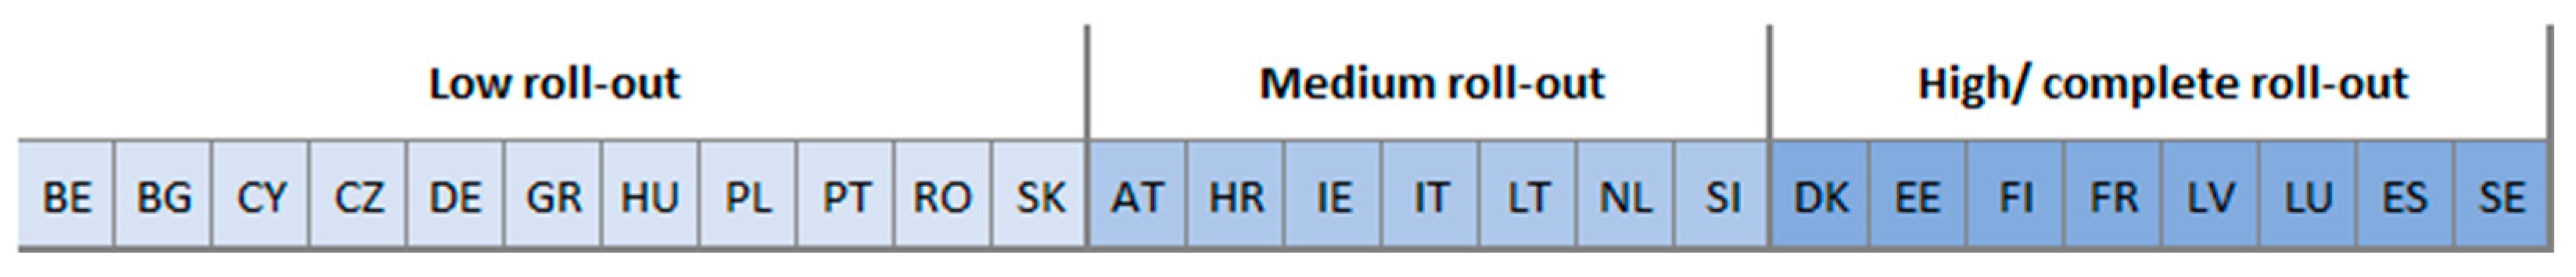
Disclaimer/Publisher’s Note: The statements, opinions and data contained in all publications are solely those of the individual author(s) and contributor(s) and not of MDPI and/or the editor(s). MDPI and/or the editor(s) disclaim responsibility for any injury to people or property resulting from any ideas, methods, instructions or products referred to in the content. |
© 2023 by the authors. Licensee MDPI, Basel, Switzerland. This article is an open access article distributed under the terms and conditions of the Creative Commons Attribution (CC BY) license (https://creativecommons.org/licenses/by/4.0/).