Abstract
South Africa has committed to reducing its greenhouse emissions by sixty-five percent by 2030 in their National Integrated Energy Plan (NEIP). The lack of investment and development for renewable energy sources put the country on an uncertain trajectory in fulfilling its 2030 energy commitments. At the same time, the country has been labeled as a region with one of the highest solar energy potentials. Provinces such as Mpumalanga and Northern Cape are on opposite ends of the matter, with Northern Cape is one of the leading provinces for renewal energy, while the Mpumalanga province remains the host to eighty-five per cent of the country’s coal plants. Solar energy is an abundant renewable energy source and can be assessed using Geographic Information Systems (GIS) techniques. In this paper, the geostatistical technique, Kriging, is employed to predict, estimate, and compare the regional distribution, potential, and variability of annual optimum solar energy (irradiance) between the Mpumalanga Province and Northern Cape Province. Spot-based radiation data are available for solar energy analyses from the GIS Web-based tool Photovoltaic Geographical Information Systems (PVGIS). Kriging was used to estimate the spatial variability of solar energy at an average error of 1.98505% for the Northern Cape Province and 2.32625% for the Mpumalanga Province. It was identified that the Northern Cape receives the highest annual optimum irradiation and has a low overall spatial variation in irradiation over its provincial area. Mpumalanga receives lesser amounts of irradiation but has high overall spatial variation over its provincial area. Most of Northern Cape’s central to northwestern regions have the highest annual optimum irradiation ranging from 2583 kWh/m2 to 2638 kWh/m2, while Mpumalanga’s highest regions of annual irradiation occur primarily on its western and northwestern parts and ranges in highs of 2345 kWh/m2 to 2583 kWh/m2.
1. Introduction
South Africa has been ranked among several other developing and developed countries as one of the world’s leading contributors to greenhouse gas emissions; in fact, the country was ranked as the twelfth largest emitter of carbon dioxide worldwide as of 2006 [1]. In recent years, updated rankings placed the country as the world’s fourteenth-largest greenhouse gas emitter [2,3]. This is because of the country’s high dependence on fossil fuels as the primary source of energy [4,5,6]. At least eighty-three per cent of the coal produced in the country is produced in the Mpumalanga Province [7]. This has led to constant complaints and cases of environmental and social issues in the region [8]. Studies conducted in the area speak on the discontent of residents situated near plants and mines vulnerable to contracting respiratory and pulmonary sicknesses associated with the pollutants released from the plants and mines. Mines will often release particulate matter in the form of dust, which, when inhaled, can cause heart and breathing problems [9]. In addition, the country intends to expand and open new coal plants in the region. Though this is meant to contribute to the current energy crises, it contradicts some of the country’s objectives in fulfilling its sustainable energy mandates. This triggers more concern for the future of energy in the country.
On the other hand, one can also easily look at the country’s potential in some of its green or sustainable energy sources. As the country attempts to transition to greener energy sources, the Northern Cape has been a forerunner for one of South Africa’s possible sustainable energy options, solar energy. The province has the highest number of renewable energy projects, housing about fifty-nine. Among these projects, forty-eight were identified in the 2019 Northern Cape Treasury Policy Brief (2019), where thirty-two of these projects are fully operational, one is fully operational, thirteen are awaiting construction, one is under construction, and one is halted. Most of these projects are funded by private entities or government initiatives. This ranges from banks, groups, organizations and companies [6]. Seeing the evident contrast, specifically between the Northern Cape Province and the Mpumalanga Province, in the energy direction of the country, this research employs geostatistical techniques and the Geographical Information Systems (GIS) database tools to assess the regional solar energy potentials between the two provinces.
The Renewable Energy Independent Power Procurement Producer Programme (REIPPPP) was introduced in South Africa’s Integrated Resource Plan (IRP) of 2010 to promote collaboration between the public and private sectors in the energy market. This initiative aims to foster renewable energy production by creating a competitive environment for alternative energy, mainly through the involvement of independent producers. Despite some success, as noted by van der Merwe and Brent (2020) [10], where over 2900 megawatts of renewable energy have been commissioned through privately funded projects worth approximately 13 billion US Dollars, the government’s slow policy implementation for integrating independent energy sources into the grid raises uncertainty among investors. This lack of clear policy and approach in the renewable energy sector, as highlighted by Kannan and Vakeesan (2016) [11], has rendered the field less appealing. This underscores the importance of enhancing methods, data, and analytical techniques for energy assessments like the Photovoltaic Geographical Information Systems (PVGIS) [12].
The country aims to improve the renewable energy market scene and reduce its greenhouse gas emissions as per the 2003 white paper and the Integrated Resource Plan of 2010, considering renewable energy sources such as solar energy is very important [6,13]. The country has also committed to reducing its greenhouse gas emissions from 398–614 metric tons of carbon dioxide emissions to about 350–420 metric tons of carbon dioxide by 2030 [2]. This a commitment made by the country as part of its mitigation targets in the United Nations (UN) most recent National Determined Contribution (NDC). This climate action plan is part of the Paris Agreement and must be updated every five consecutive years. As such, there is a growing need to explore and invest in renewable energy sources. Analyzing the annual solar irradiance distribution and trends over the two provinces would give an idea of how South Africa can efficiently plan for the development of solar panels or technology in the most effective regions of the country for optimum solar energy harnessing.
South Africa’s “favorable” geographic positioning implies that it may have great potential in using solar energy. Through the development of geodatabases built upon years of remotely sensed data on solar energy, a web-based tool- PVGIS, (version 5.2) presents capabilities of monitoring and assessing the solar potential of different locations [11,14,15]. In this regard, this research attempts to compare and assess the regional potential of solar energy between the two provinces, using data from the PVGIS tool and the Kriging technique, to study how the mentioned provinces could be suited for future solar technologies. To achieve this, this study, therefore, uses geostatistical techniques, specifically Kriging, to create spatially interpolated maps that represent the annual distribution and trends of optimum solar irradiation over the two regions, Mpumalanga and Northern Cape, based on the data acquired from the PVGIS tool (https://re.jrc.ec.europa.eu/pvg_tools/en/) (accessed on 20 June 2022). The interpolated maps will enable the identification of sites that receive relatively high amounts of irradiation annually.
Modern-day advancements in Geographical Information Systems (GIS) and Remote Sensing (RS) techniques enable the effective and efficient analyses of such trends. Photovoltaic Geographical Information Systems (PVGIS) is one of these techniques. The PVGIS system is a web-based tool that assesses solar radiation trends daily, weekly, monthly and yearly [10]. It uses interactive web applications for map-based queries of solar radiation databases and Photovoltaic (PV) performance assessments. The map-based query integrates a geographical database with a solar model, r.sun [16].
The solar data are obtained from a method known as the Heliosat-2 method. The model estimates beam, diffuse, and reflected components of the clear-sky and real-sky global irradiance/irradiation on horizontal and inclined surfaces. The total daily irradiation (Wh/m2) is computed by the integration of the irradiance values (W/m2) that are calculated at a time step of 15 min from sunrise to sunset [16,17]. This database has become an essential part of a constantly developing energy assessment and monitoring sector. Lastly, since this database was developed based on remotely sensed data from satellites and model algorithms, it provides a basis for geographically monitoring and interacting with solar energy over small-scale to large-scale regions.
Using the PVGIS tool combined with geostatistical techniques, the spatial nature of solar radiation and its characteristics can be studied and presented qualitative and quantitatively. The geostatistical technique, Kriging, is used in this study. Kriging, a geostatistical method, estimates values in d-dimensional space while incorporating anisotropy [17,18]. It stands out for providing the best linear unbiased estimate of a variable, achieved through minimizing estimate variance based on statistical principles. This technique has proven advantageous for estimating highly variable spatial data and is particularly relevant for this study’s assessment of irradiation.
Mohd et al. (2021) [17] mention that Kriging is the most successful for phenomena with a very strong random component or for the estimation of statistical characteristics (uncertainty). Its strength lies in countering bias through random functions and statistical techniques, leading to limited bias in estimates due to correlations derived from the semi-variogram pattern. While the user’s choice of theoretical semi-variogram function introduces some subjectivity, selecting functions closely aligned with the mean line of the variogram graph or with lower standard error and deviation can enhance predictions. It is also safe to mention that, in the attempt to predict and estimate highly spatially variable data, it is always safe to expect that specific results could potentially differ significantly and, therefore, be better predicted by a more anisotropic function [19]. Although Kriging’s potential weakness lies in user discretion for function selection and assessing stationarity, it remains a powerful method for spatial data estimation, offering valuable insights for various applications.
Following this section of the article study are five sections: Study Area (Section 2), Materials and Methods (Section 3), Results (Section 4), Discussion (Section 5), and Conclusion (Section 6). The Study Area is a regional and geographic background about the areas in the study. Following Section 2 is the Materials and Methods section (Section 3), where in-depth details about the data collection, PVGIS tool application, and spatial interpolation techniques used are explained. Section 4, the Results section, compiles all the findings and outcomes obtained throughout the study. The Results section is followed by Section 5, the Discussion section, where an assessment and breakdown of the findings in the Results section is made. Lastly, the Conclusion section is the final section, essentially a summarized round-up of the overall study and its findings.
2. Study Area
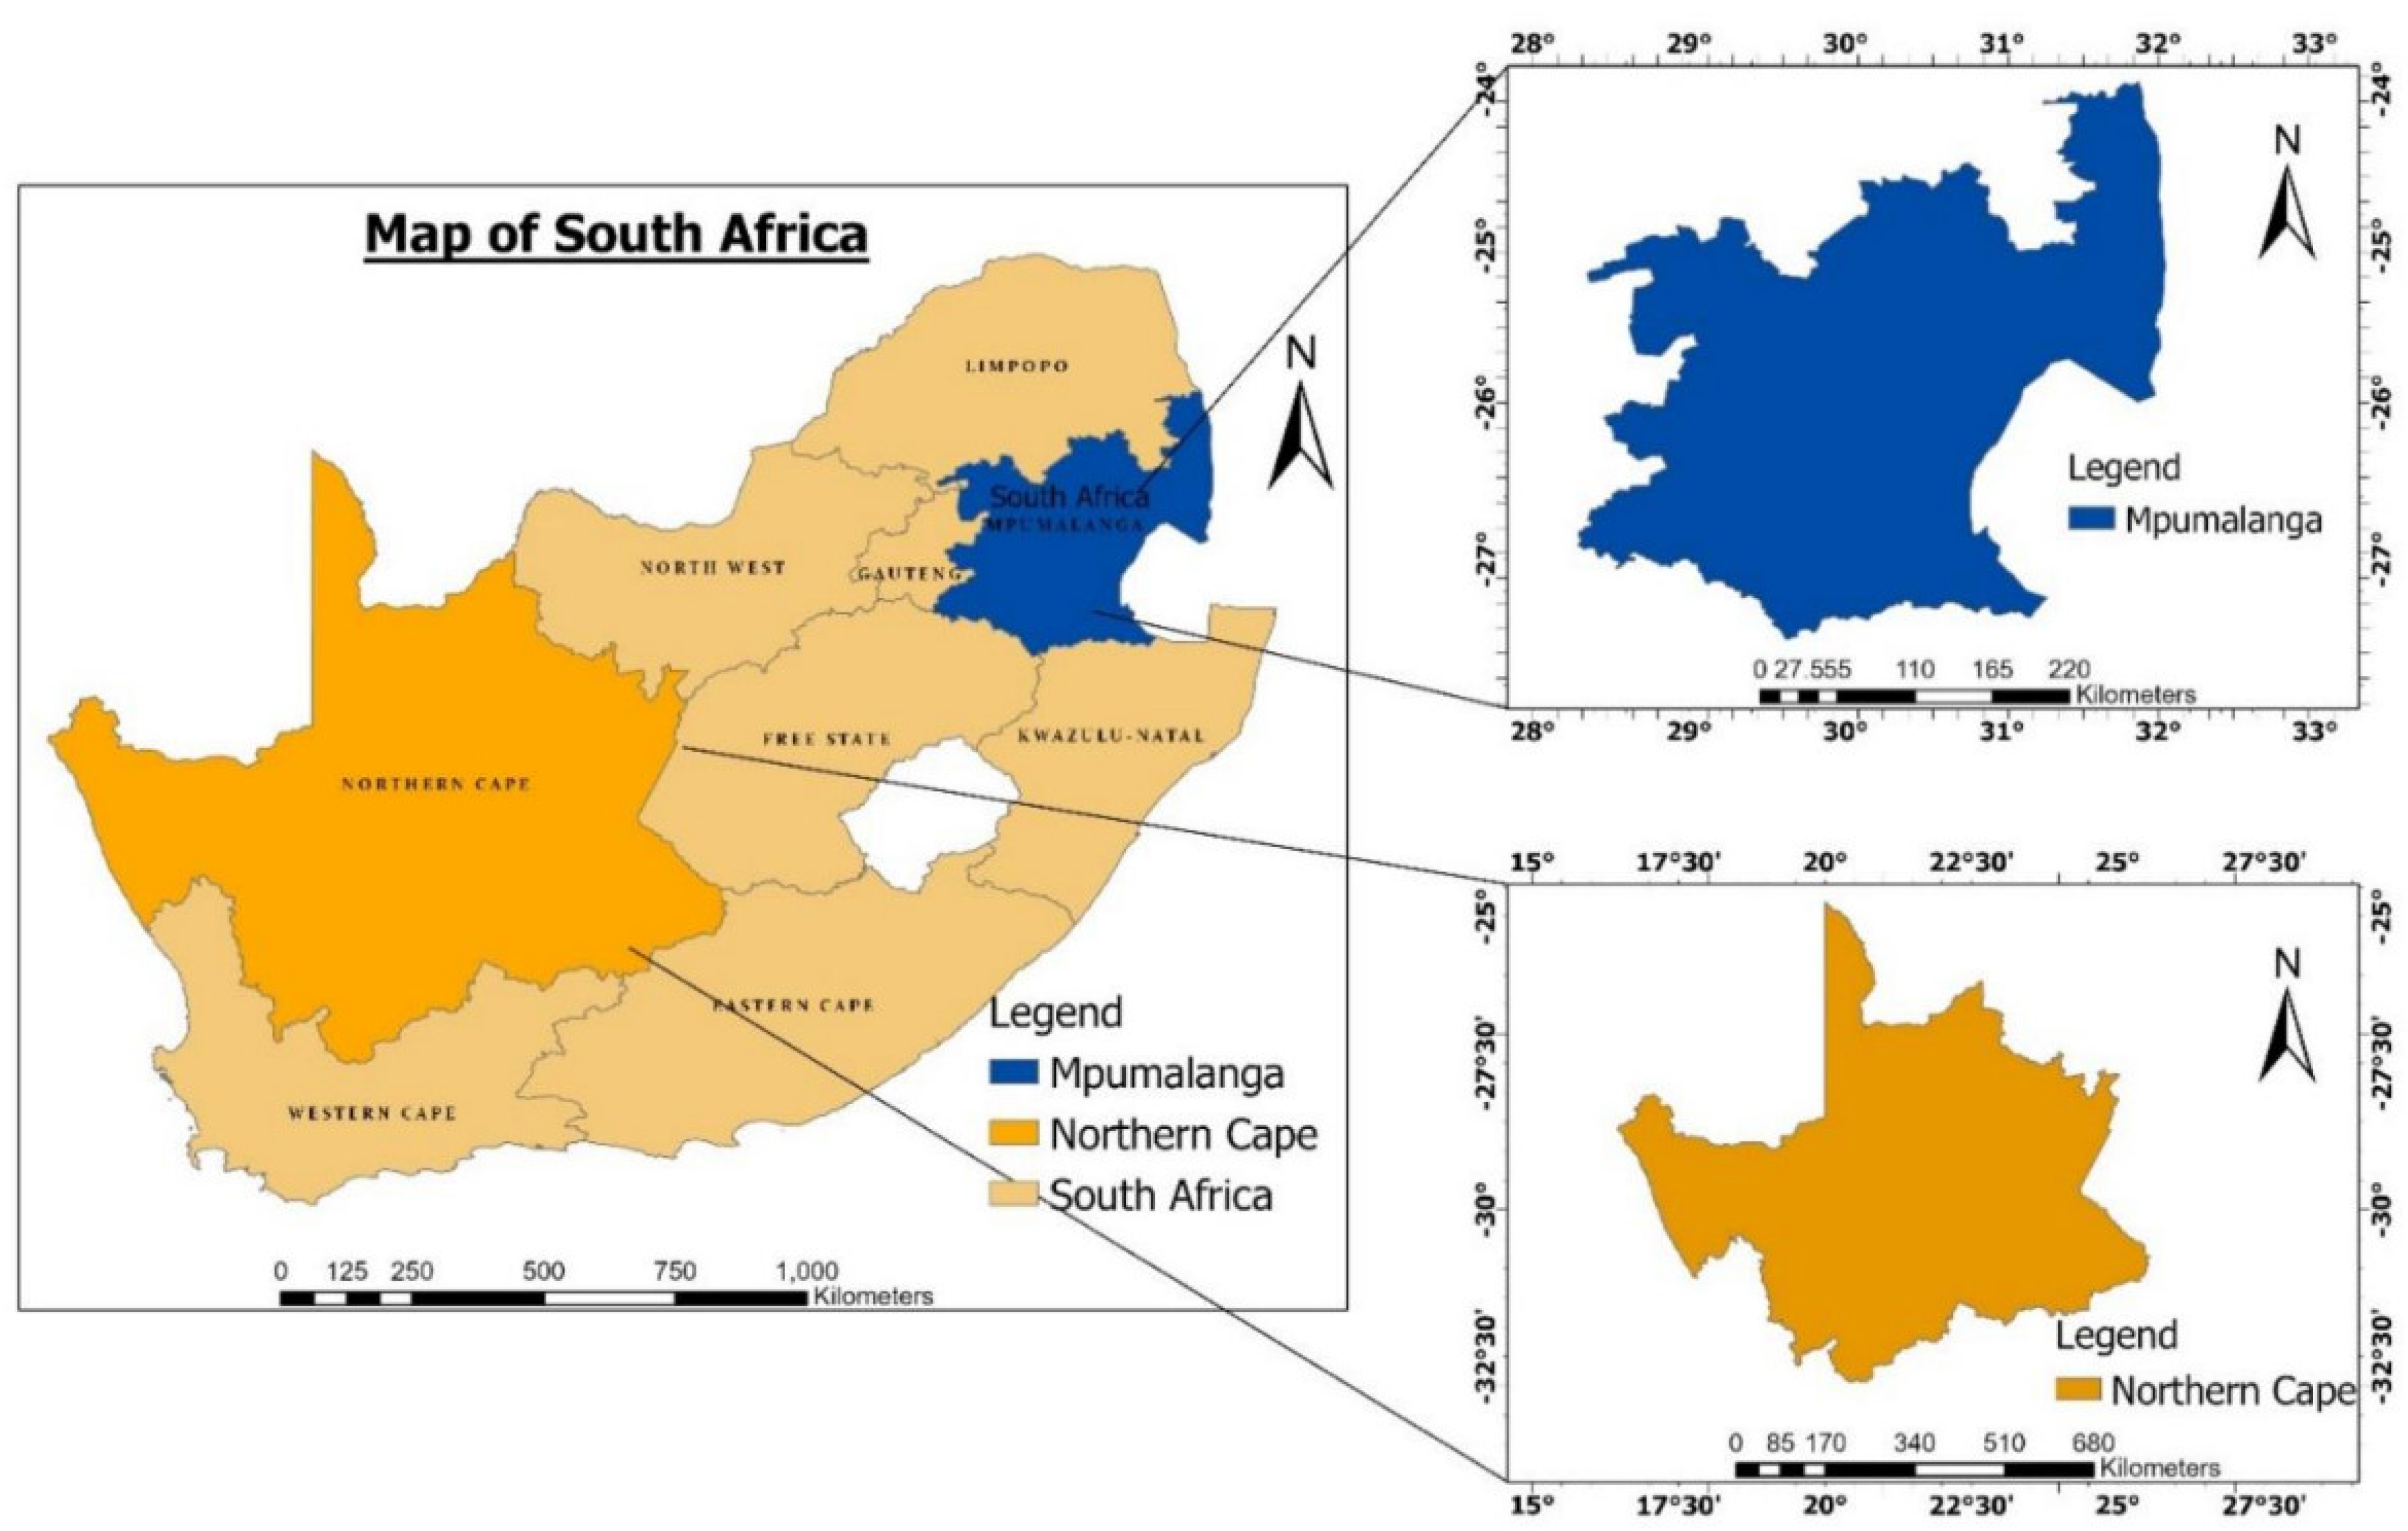
Figure 1 depicts the subjects of this study: the Mpumalanga Province and Northern Cape Province in South Africa, both situated at opposing ends of the country. Mpumalanga, located in the eastern region (25.5653° S, 30.5279° E), is characterized by mountainous terrain and divided into the Highveld and Bushveld. With an elevation ranging from 1700 to 2300 m, it experiences a varied climate, receiving most precipitation during warm, humid summers and minimal rainfall during cold, dry winters. The province houses eighty-five per cent of the country’s coal plants.

Figure 1.
Study Areas—Northern Cape Province and Mpumalanga Province as depicted in South Africa.
In contrast, the Northern Cape Province, South Africa’s largest, spans a vast area (29.0467° S, 21.8569° E) and is sparsely populated. It encompasses flat central regions, a hilly west coast, and the Kalahari Desert to the north. The province’s semiarid climate yields low average annual rainfall of around 200 millimeters, with varied patterns across its east and west. Known for Kimberlite diamonds, the Northern Cape has embraced renewable energy, particularly solar power, due to its favorable location, land cover, and solar exposure. This province’s inclusion in the study offers a comparative basis for assessing solar energy potential.
3. Materials and Methods
3.1. Data Collection Points and Years of Collection
The first step to fulfilling the aims of this spatial analysis is the selection of station points (SP) where irradiance and potential PV performance data will be collected and interpolated. This is achieved by randomly selecting point-based areas within the Northern Cape Province and Mpumalanga Province. These points will act as stations for the various data collected data. The use of Google Earth Pro does the selection of these points. Figure 2 and Figure 3 represent the area points at which all the irradiation data were obtained for the Mpumalanga Province and Northern Cape Province (respectively) for 2016, 2018, and 2020. These points were spread from 55 km to 70 km apart. It is from these points that the interpolation estimates were based on. Figure 2 below shows the spread of these points of data collection. Twenty-five points were, respectively, selected for the two provinces. This, therefore, accounts for a total of 50 measurement points.
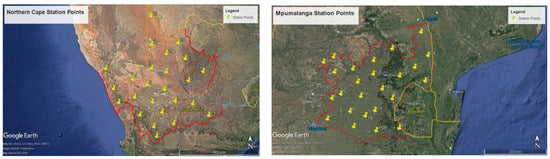
Figure 2.
This image represents all the spatial points in which optimum irradiation data was collected and used for the Northern Cape Province (left) and Mpumalanga Provinces (right). There are 25 points spread across the respective provinces, equating to a total of 50 points.
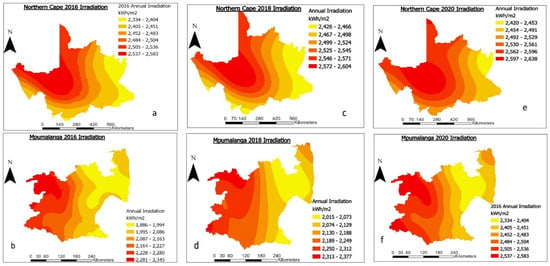
Figure 3.
Spatial variation of interpolated estimations of irradiation (at optimum angle) in Northern Cape Province and Mpumalanga Province for the years 2016 (a,b), 2018 (c,d), and 2020 (e,f).
The selection of the number of points used in this study is primarily dependent on the nature of the data in use, the size of the study area, the outputs of the search neighborhood parameter used, and how well the eventual results of the interpolation fit the semivariogram [20,21]. These conditions are relative to the properties of the Kriging technique as a whole. Irradiation data are relatively coarse and are most spatially variable over a larger surface area than a small area; as such, twenty-five points spread across each respective province are spatially appropriate. Additionally, there is not necessarily the best or most accurate form of the application of Kriging except for the fact that the chosen functional model used produced results with the most acceptable cross-validation statistical outputs [21].
The years used for this study are based on the significance of the period relative to the increasing emission rates at the time, as well as the rolling power outages resulting from the current energy shortfalls of the country. In a study by Shikwambana et al. (2021) [4], this period represents a time of increased greenhouse gas emission rates as the country’s economy progressed over the years. With growing populations and economy, trend analysis showed that South Africa increased its dependence on greenhouse gas emitting sources as its economy grew over the years [4]. However, these very same economic pressures have resulted in high emission rates, which are not in favor of the country’s commitments in the climate action plan of the United Nations Paris Agreement to reduce its overall greenhouse gas emissions by 2030. Furthermore, this period marks a critical time for renewable power organizations, investors, and entities to explore the country’s potential for renewable and alternative energy sources as the country is in a transition phase [3,6].
Monthly Irradiance data and potential PV estimates are collected for every station point from the web-based PVGIS tool (https://re.jrc.ec.europa.eu/pvg_tools/en/) (assessed on 20 June 2022). The PVGIS tool provides all the data for all twelve months of any year of choice. This study selected 2016, 2018, and 2020 to detect and compare any possible annual changes. The two-year separations are also conducted with the intention of a more gradual, reliable, and average-based representation of the data [17]. The section below provides background on the algorithms used by the PVGIS tool.
3.2. PVGIS Data Capture and Methods
The PVGIS algorithms are formulated based on the GRASS GIS software, with their foundation in the solar radiation model denoted as r.sun [22]. This model comprehensively estimates the components of clear-sky and real-sky global irradiance on horizontal or inclined surfaces, encompassing beam, diffuse, and reflected elements [21,23,24]. The PVGIS tool, designed for monthly and irradiation average calculations, incorporates several input factors: Linke atmospheric turbidity, Digital Elevation Model (DEM), monthly averages of global irradiation data from meteorological stations worldwide, and ratios of diffuse to global irradiation from ground stations.
In the context of this research, the derived irradiation estimates are constructed through specific algorithms, accounting for the parameters. The first equation,
introduces the relationship, while the calculation of real-sky global irradiance involves the precise sky index and clear-sky irradiance in the second equation:
where the direct irradiance component is as follows:
Hh = Hhc × (Hhs/Hhc),
Ghc = Gbhc + Gdhc,
Gbhc = G0 exp {−0.8662 TLKmδR(m)}sin h0
It is derived from extra-terrestrial irradiance regular G0 to the solar beam; the term −0.8662 TLK is the air mass 2 Linke atmospheric turbidity. The parameter m is the relative optical air mass, the parameter δR(m) is the Rayleigh optical thickness at air mass m, and h0 is the solar altitude angle [22,24].
The diffuse irradiance component:
is derived by the product of normal extra-terrestrial irradiance G0, a diffuse transmission function Tn determined by the Linke turbidity TLK, and the diffuse solar altitude function Fd, which is only dependent on the solar altitude angle h0. For a more detailed explanation of the algorithms used in the derivation and calculation of irradiance and PV performance, refer to Suri et al. (2005) [22] and Šúri and Hofierka [24], which fully explain all the techniques used in the development of the r.sun model.
Gdhc = G0Tn(TLK)Fd(h0)
3.3. PVGIS Optimum Irradiation Estimation
For this research, the PVGIS tool is directly employed, leveraging pre-calculated components automatically considered when inputting station coordinates. The PVGIS tool requires specific information for irradiation data computation and visualization:
- Longitude and latitude coordinates, indicating the locations of the study stations or points of interest;
- Selection of the study year, with 2016, 2018, and 2020 chosen to provide consistent and averaged radiation and PV data;
- Specification of the irradiation angle, opting for the optimum angle. This choice aims to predict and analyze the potential implementation of PV technology for optimal energy harnessing. The PVGIS tool employs its algorithms from DEM calculations to detect this optimal angle automatically. It defines the irradiation at the optimal angle as the monthly sum of solar radiation energy received by one square meter of a surface facing the equator, positioned at the inclination angle that yields the highest annual irradiation, measured in kWh/m2 [24].
A comma-separated values (CSV) file containing the numerical values of the computed estimate PV and irradiation is created based on the input entry as mentioned above details. The data in the CSV file are opened, ordered and structured using an Excel Sheet to apply the following step, the spatial interpolation process. The annual irradiation, represented in the maps and graphs, is calculated from the mean monthly irradiance acquired from the PVGIS tool. The monthly irradiance is also calculated based on daily mean solar irradiation per reference site or point [24]. However, for the interests of this study, the annual mean irradiance is what is considered.
3.4. General Optimum Irradiance Angle of Both Areas Based on Latitudinal Positioning
The study focuses on estimating spatial irradiation, particularly assessing the potential for irradiation to reach the surface at an averaged optimum angle based on South Africa’s latitude. This optimal angle signifies the monthly accumulation of solar radiation energy on a square meter surface facing the equator, positioned at the angle that maximizes annual irradiation (measured in kWh/m2). Through the application of PVGIS algorithms, the calculated average optimum angle for irradiation striking the surfaces of the mentioned locations is 30 degrees. This implies that solar energy-utilizing PV technology is assumed to be ideally positioned at this angle relative to the sun. Consequently, PV systems, including arrays and modules, are envisioned to be fixed at this specific angle for optimal efficiency.
3.5. Kriging
The geostatistical technique, Kriging, is applied to represent the regional variation of irradiation. Though several methods exist for the spatial estimation and representation of data, the Kriging method is chosen for its prediction capabilities. It is based on estimating areas of unknown relativity to measured points surrounding the estimated points within a dimensionless distance [17]. Kriging allows for the extended regional estimation of the irradiation as the data used in this study are point-based and do not necessarily cover every extent of the study sites. Kriging constructs an interpolated surface using unbiased and minimum variance statistical conditions. This is expressed in the universal Kriging formula:
F(r) = T(r) + ∑ (w i)(Z)(r − ri) n i = 1
T(r) represents its non-random component (drift) as a linear combination of low-order monomials. The monomial and (wi) coefficients are found by solving a system of linear equations [18].
This procedure integrates attribute data from selected station points, featuring diverse irradiance and potential PV values, into ArcGIS Pro software. These points are converted to shapefile format, encapsulating their coordinates alongside irradiance and PV performance data. Through the Geostatistical Wizard, Kriging is implemented, utilizing the point attribute data as input and employing Ordinary Prediction Kriging. This process generates a semi-variogram graph that depicts how minimum and maximum input data values relate to distance. This graph, serving as a best-fit weighted average representation, forms the foundation for spatial predictions.
The Stable model within ArcGIS Pro (version 3.1.0) is chosen to optimize predictions, aligning closely with the standard mean weighting of the semi-variogram estimate graph [20]. The stable model is one of many variations of the Kriging technique. It introduces a power parameter known as the stable power parameter, which controls the model’s sensitivity to outliers and heavy-tailed data [25]. The stable model presents several advantages, such as its robustness to outliers, adaptability, flexibility, spatial smoothing, and uncertainty assessments [19,20]. Of all the mentioned advantages of the stable model, the geostatistical smoothing capability and robustness to outliers make it quite outstanding since this enables a user of the model to smoothen noisy spatial data (to preserve significant spatial trends) as well as control the influence of extreme values on the interpolation results.
Generally, there is no universally superior interpolation model; the selection of the model used depends on the characteristics of the data in use and overall semi-variogram fit [20]. As irradiation is a naturally coarse data type that only tends to vary more over a larger surface area, the stable model worked well as the model of choice [25]. The stable model is therefore used in this study to facilitate the creation of spatially interpolated maps for the years 2016, 2018, and 2020 and an averaged 3-year map. This procedure is executed for both study areas, enabling a comparative analysis of spatial irradiation variation [18].
4. Results
The following chapter presents the organized representations of all the data acquired from this research study. These are represented in the form of graphs showing the measurement collection sites, mean changes in irradiation over the different years (2016, 2018, 2020), maps depicting the regional distribution and trend of the irradiation over the two regions, as well as the geostatistics of the interpolated maps.
4.1. Maps of Spatial Distribution of Irradiation over Both Study Areas
Figure 3 is the resultant interpolated irradiation maps for both provinces for 2016, 2018, and 2020. The maps represent the regional distribution, variation, and trends of irradiation of surface receiving irradiation at an optimum angle (28° North to 30° North) over the two provinces during the mentioned years. The maps were interpolated based on the average annual totals of irradiation at the measured points in the respective provinces.
The comparison of irradiation distribution between Northern Cape Province and Mpumalanga reveals significant differences. As shown in Table 1, Northern Cape has notably higher annual irradiation exposure than Mpumalanga, with a range from about 500 kWh/m2 to 700 kWh/m2. The irradiation in the Northern Cape is mainly concentrated in its central to northwestern regions. At the same time, Mpumalanga displays a broader spread with higher irradiation in its northwestern and small parts of the southwestern regions.

Table 1.
Overall summary of the regional annual and monthly optimum irradiation totals of the interpolated maps.
Regarding variability, the Northern Cape exhibits relatively consistent annual irradiation across its regions, differing by approximately 150 kWh/m2 to 200 kWh/m2 between the lowest and highest points. In contrast, Mpumalanga experiences more significant variability, ranging from about 300 kWh/m2 to 450 kWh/m2 between its lowest and highest points over three years.
Over time, both provinces gradually increase or maintain annual irradiation. In Mpumalanga, there have been noticeable changes in the central and western areas over the years, with an increase from a minimum of 1886 kWh/m2 in 2016 to about 2015 kWh/m2 in 2020. In contrast, the Northern Cape’s irradiation remains relatively consistent, with minimal changes in its central region.
Overall, the Northern Cape receives higher annual irradiation and displays lower variability, implying a more uniform distribution. In contrast, Mpumalanga experiences lower irradiation levels and higher regional variability. Northern Cape’s central to northwestern regions exhibit the highest annual irradiation, ranging from 2583 kWh/m2 to 2638 kWh/m2, while Mpumalanga’s highest irradiation regions mainly lie in its western and northwestern parts, ranging from 2345 kWh/m2 to 2583 kWh/m2. Table 1 below summarizes the main annual and monthly optimum irradiation patterns over the years being studied.
4.2. Optimum Monthly Irradiation over Northern Cape and Mpumalanga Provinces
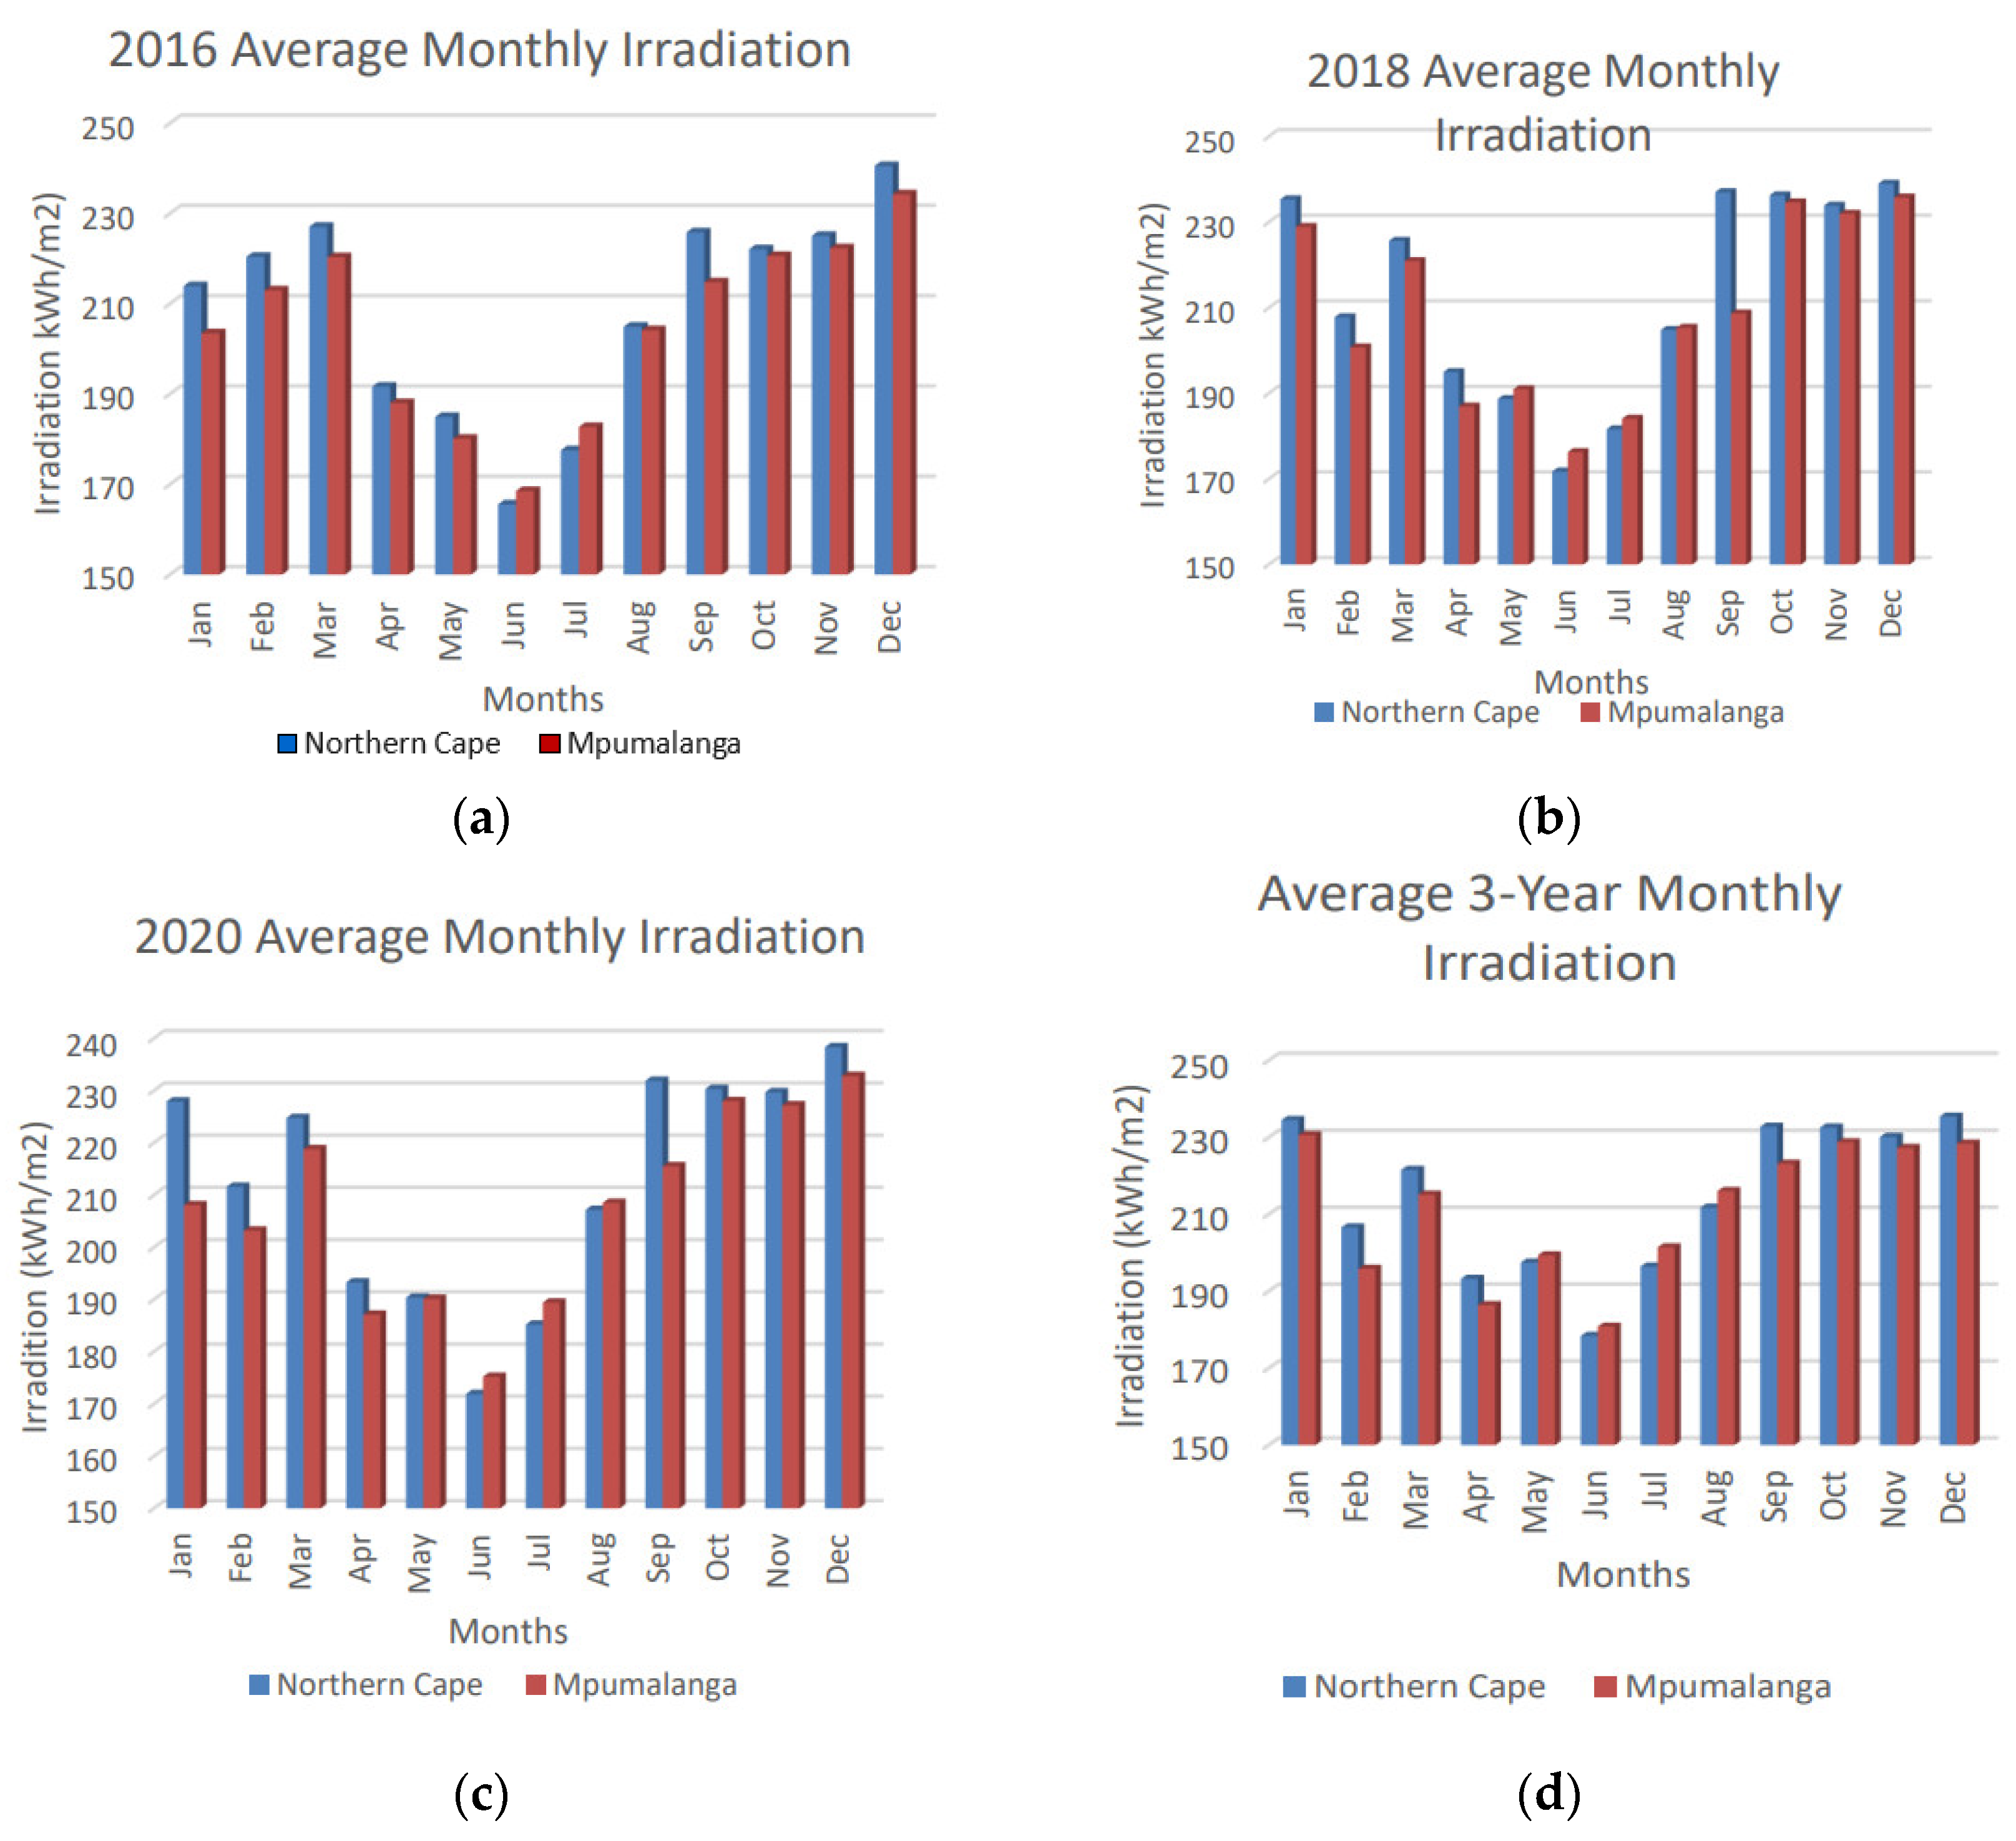
The annual irradiation totals are derived from monthly average irradiance sums. The graphs in Figure 4 illustrate a comparable pattern between monthly and annual irradiance, with Northern Cape Province having more months of higher irradiance. 2016, 2018, and 2020, Northern Cape received elevated irradiance from September to April, while Mpumalanga saw higher levels in June and July. Generally, the Northern Cape had higher irradiance for most years.
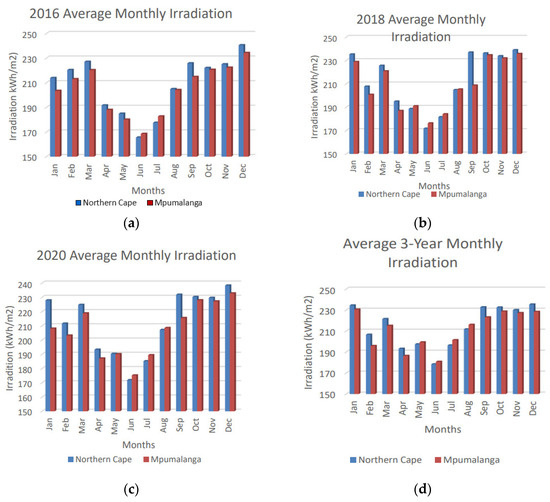
Figure 4.
Monthly optimum irradiation between Northern Cape Province and Mpumalanga Province for the years 2016 (a), 2018 (b), 2020 (c), and average 3-year (d).
December displayed the highest monthly irradiance in both provinces, while June had the lowest. Northern Cape’s highest monthly irradiance was 240.52 kWh/m2 in December 2016, and its lowest was 165.55 kWh/m2 in June 2016 (Figure 4a). Mpumalanga’s highest monthly irradiance was 239.00 kWh/m2 in December 2018, and the lowest was 168.49 kWh/m2 in June 2016. The monthly irradiance difference between the provinces ranged from 4 kWh/m2 to 15 kWh/m2, with occasional higher differences around 20 kWh/m2 to 30 kWh/m2 in September.
Both provinces followed a similar irradiance distribution over the three years, except for August 2018 and 2020, when Mpumalanga received higher irradiance, and May 2018 and 2020, when Mpumalanga also had higher levels. Both provinces displayed a consistent change in irradiance, increasing from July to January and decreasing from February to June, the lowest irradiance month. This trend is evident in the averaged 3-year graph, Graph (d) of Figure 4.
4.3. Geostatistics of Interpolation
4.3.1. Semi-Variogram Properties
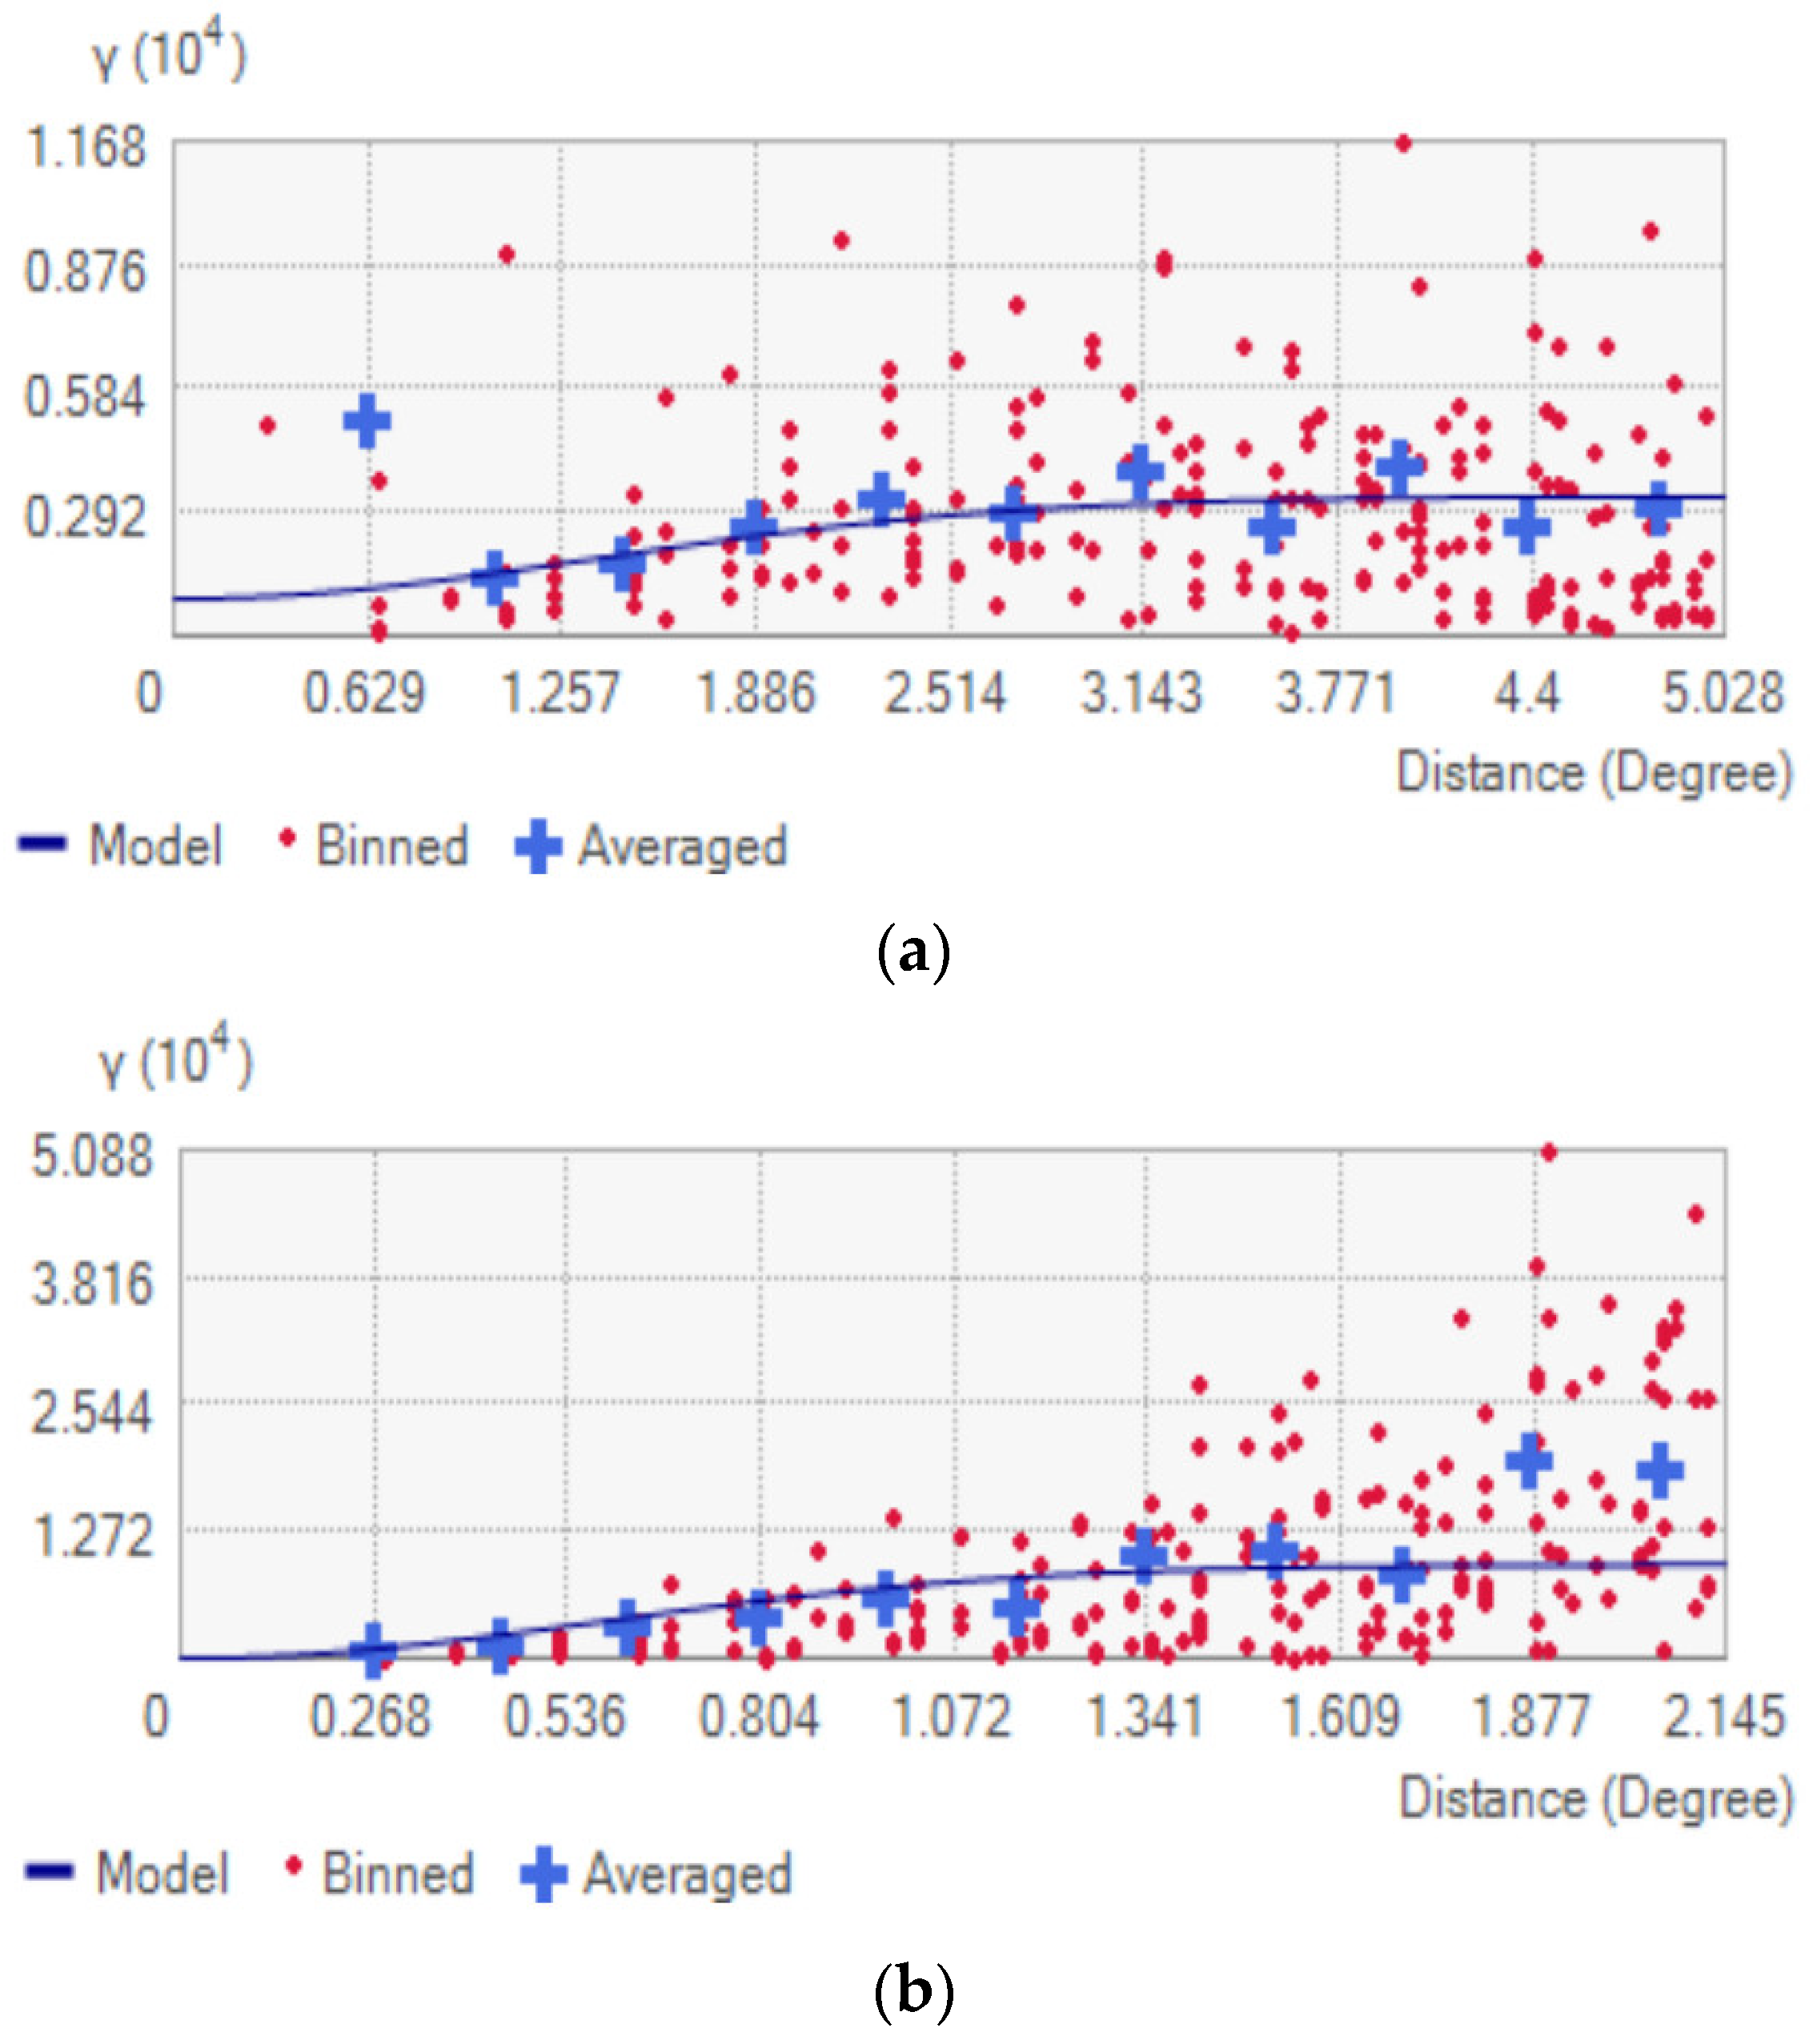
The semi-variograms (Figure 5a,b) indicate a stable model. These semi-variograms demonstrate the dissimilarity between observations based on distance, using the average 3-year optimum annual irradiance. A smaller nugget relative to the sill suggests appropriate sample spacing to reflect variance. Notably, Mpumalanga Province has a nugget of 9.404, while Northern Cape’s nugget is 883.64, revealing a significant difference (as shown in Table 2). This could be due to greater distances between measurement points in the Northern Cape. The nugget ratio suggests moderate spatial dependency for the Northern Cape and strong spatial dependency for Mpumalanga, implying a moderate to strong autocorrelation at short distances. This means that data collected at relatively shorter distances, such as Mpumalanga in this case, will have a higher probability of influencing or relating to each other, having more similarity. The overall summary of the sill and nugget ratios are displayed in Table 2.
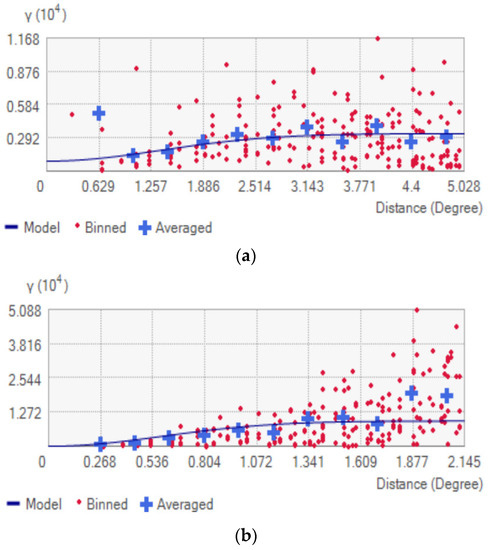
Figure 5.
Semi-variogram for: (a) Northern Cape Province Interpolated Map; (b) Mpumalanga Province Interpolated Map.
Table 2.
Geostatistical properties of semi-variogram for average 3-year interpolation.
In the Northern Cape semi-variogram (Figure 5a), constancy is reached at around 3.8 distance units, whereas Mpumalanga’s semi-variogram achieves constancy at 1.34 units. This indicates more significant local variability in the Northern Cape compared to Mpumalanga. This is further supported by the averaged sample data aligning more closely with the constant line for Mpumalanga (Figure 5b) than for Northern Cape (Figure 5a).
4.3.2. Interpolation Prediction Precision and Error
The study evaluates bias and standard errors in Table 3 regarding sample data. The average error is calculated by finding the difference between predicted and measured data averages through cross-validation. Percentage bias is determined by dividing the average error by the overall measured data average, indicating interpolation accuracy. Interpolated maps generally exhibit bias between 0.89% and 2.67%. Mpumalanga 2018’s interpolated map shows the lowest bias. The interpolated maps are deemed reliable, as their errors closely align with the original measurements. The highest percentage bias is 2.12% for the Mpumalanga 3-year map. The remaining errors fall within the mentioned bias range. Results suggest low error and bias in annual irradiance data, implying high precision in estimates. Minor offsets are inconsequential due to the scale of annual irradiance values ranging in the thousands; therefore, offset changes in the tens are considered less variation [12].
Table 3.
Summary of interpolated map characteristics. The errors reflect the average offset that may have occurred with the spatial estimations during interpolation. These values are the average offset relative to the actual irradiance measurements.
5. Discussion
5.1. Regional Irradiation Trends and Distribution between the Two Provinces
The study utilized PVGIS data to determine the optimal angles for surface placement to receive higher irradiation levels. The latitudinal positioning of the two provinces indicated an estimated optimum angle of 28° to 30° facing north (or toward the equator) for maximum annual irradiation. The Northern Cape Province exhibited greater annual optimum irradiance (ranging from 2300 kWh/m2 to 2638 kWh/m2), mainly from September to December. This region experienced the highest irradiance in its central to northwestern parts, corresponding with the Namib desert’s expanse. While generally having lower annual irradiance than the Northern Cape, Mpumalanga Province still reached significant highs. Its irradiance varied across regions; its highest areas were concentrated in the far west. Notably, Mpumalanga’s irradiance increased annually in 2018, showcasing comparable potential to the Northern Cape despite the latter’s higher average irradiance. This also implies that the region’s annual changes and irradiance fluctuations may favor potential solar energy harnessing as it may have periods of relatively higher irradiation experienced. Most importantly, the results of this study proved that both provinces have considerable solar energy potential comparable to worldwide standards despite both provinces having variable annual and regional irradiation totals.
Most of the world experiences annual irradiation ranging between 1500 kWh/m2 and 1800 kWh/m2 [25]. This implies that the two study areas compare higher to most parts of the world. This supports Mpumalanga Province’s high solar energy potential for future solar technology. Based on the land use and land cover of the Mpumalanga Province, most of its built-up settings are situated toward the northwestern parts, while a considerable portion of the province’s central and eastern parts is characterized by thick forests/plantations and grasslands. These eastern parts are mostly mountainous and, therefore, have higher variability to the sun due to the shading effect [26]. Therefore, in predicting how the Mpumalanga Province may fare for future solar systems, it can be suggested that panels could be placed on buildings or built structures. The existence of built environments at the irradiance hotspots of the province implies that building incorporated panels would be more efficient, while, in the less built areas, solar array farms can be built. However, as mentioned by Sinah et al. (2014) [27], building incorporated panels are preferred over panel or array farms as they would require less environmental reconstruction to design and install.
5.2. Validation of PVGIS Data Quality and Interpolation Reliability
To validate the accuracy and reliability of the maps and results produced, a comparison of the optimum solar irradiation obtained for the Mpumalanga and Northern Cape provinces is made against the optimum tilted solar irradiation obtained from the Global Solar Atlas. The Global Solar Atlas is a web-based tool the World Bank Group developed to simulate different information about solar energy and regional photovoltaic potential. The Solar Atlas tool uses the Solargis database, a sophisticated model calculating solar radiation using Meteosat Prime and IODC satellite data from 1994 (2000). The annual average irradiance obtained for the three years of the two provinces in this research is compared with that of the Solar Atlas data. In this case, the optimum irradiation data from the Solar Atlas will be a comparative “ground truth” measurement to what was obtained using the PVGIS and Kriging technique in this paper.
The first agreement in both results (Kriging and PVGIS used in this research versus Solar Atlas) is that of the optimum angle estimated. Both tools and results estimate that the optimum angle for a plane within the two provinces should be between 28° and 30° north-facing. This is a good result, seeing that there is a common expectation as to what the orientation of a plane in either province should be to receive optimum irradiation.
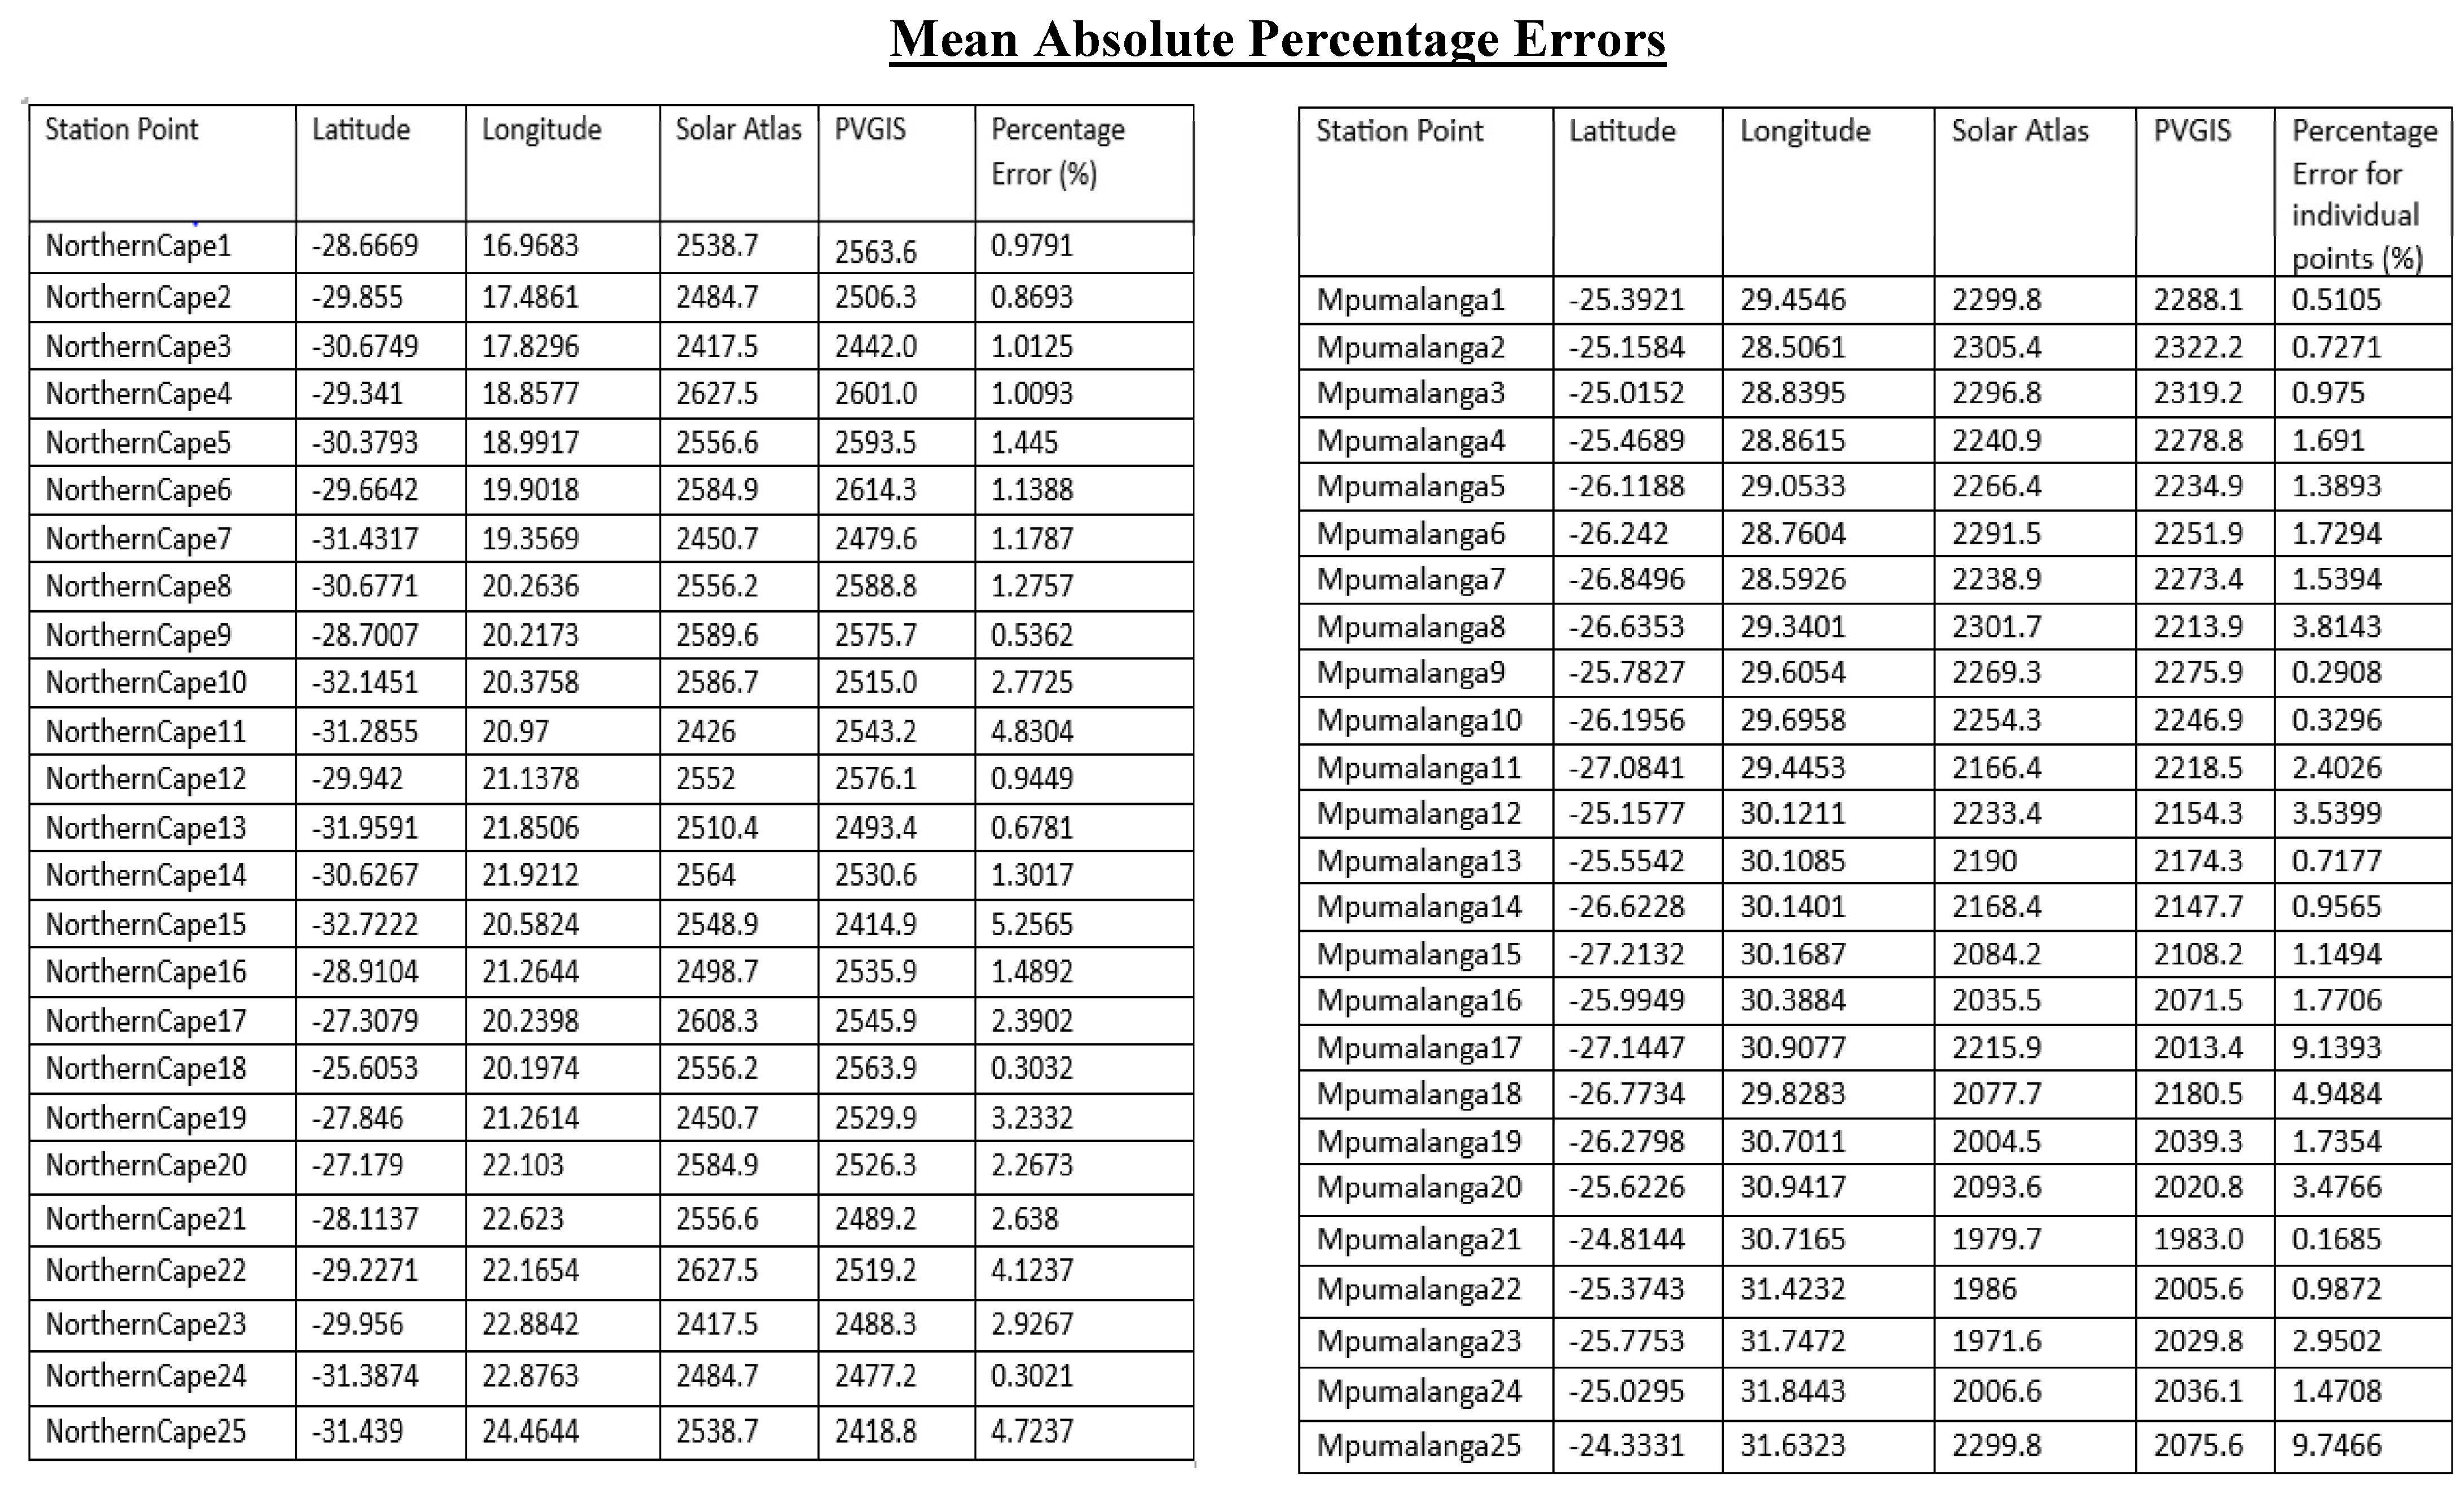
Two evaluation and comparison methods are used for validation: (1) Mean Absolute Percentage Error (MAPE) for the yearly optimum irradiation for the predicted regions; (2) visual comparison of the overall annual optimum irradiation over the 3-year maps between Kriging and PVGIS maps (used in this research) and the maps of the Solar Atlas. The mean absolute percentage error is a common metric that forecasts errors between predicted and actual datasets [26]. The mean absolute percentage error is calculated using the equation:
where n is the total number of points or stations used in the prediction for either province, Ai Fi are the actual values (Solar Atlas) and forecasted or predicted values (PVGIS and Kriging), respectively. The mean optimum annual irradiation results obtained using Kriging and PVGIS in this research will form the predicted data of the equation, while the mean optimum annual irradiation obtained from the Solar Atlas will act as the observed or expected value. The table in Appendix A shows the results of the optimum monthly irradiation from using PVGIS and Kriging for all the measured and predicted points, as well as their Solar Atlas monthly optimum irradiation and the individual percentage errors of those stations/points. The same percentages are summed and averaged to obtain the final and overall mean average percentage error.
Results after the application of the MAPE show that the PVGIS Kriging estimates and prediction used in this research performed very well when evaluated with the Solar Atlas optimum irradiation. This is confirmed by the overall annual error amounting to 1.98505% for the Northern Cape Province and 2.32625% for the Mpumalanga Province. Additionally, the MAPE of the individual stations or points used for the prediction in both provinces shows relatively low errors, ranging from the lowest of 0.3021% to the highest of 9.7466%. The complete tabular summary containing all the information relating to the MAPE of all the individual points can be accessed in Appendix A. Generally, a mean absolute error between 0% and 5% is regarded as a very low error and an accurately acceptable result. In the case of this research, such results are achieved implying that not only are the achieved results closely accurate to that of the solar data, but it also means that the results of this paper associated with the kriging technique are well validated and present relatively minimal offset and reliable results. This further supports the reliability of the performance of the overall estimation conducted using Kriging and PVGIS. Essentially, the prediction algorithm used in this study performed accurately. Improvements to the reliability of the results can, in future, be compared with other databases, including ground-truth data.
Finally, it is also worth mentioning that since Kriging is essentially a spatial interpolation technique used to estimate the relative value of a specific feature in space based on already known points (or areas), slight offset errors may occur between predicted regions versus areas with already known data. However, the results presented in this research imply that the Stable Kriging interpolation method produced acceptable or relatively results since the final interpolation output bias ranged between 0.889721% and 1.679798% when cross-validated with points of known data.
Figure 6 illustrates consistent patterns in both sets of maps, indicating the highest and lowest optimum irradiation areas for the Northern Cape and Mpumalanga provinces. Results from PVGIS (version 5.2) and Kriging closely align with Solar Atlas data, demonstrating a high level of agreement. For Northern Cape, the highest irradiation values are nearly identical (2606 kWh/m2 PVGIS vs. 2611 kWh/m2 Solar Atlas), and lows show minimal variance (2434 kWh/m2 PVGIS vs. 2376 kWh/m2 Solar Atlas). Similarly, both maps exhibit similar spatial trends and closely matched high and low irradiation values for Mpumalanga. This alignment underscores the effectiveness of Kriging interpolation, reinforcing its utility in estimating spatial variables.
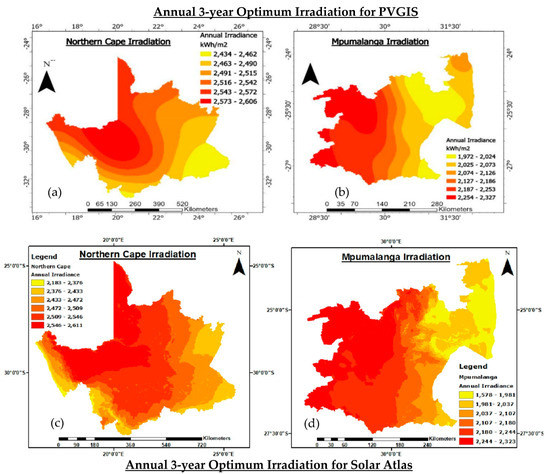
Figure 6.
Annual 3-year optimum irradiance maps for PVGIS and Kriging: Northern Cape (a); Mpumalanga (b), and Solar Atlas: Northern Cape (c); Mpumalanga (d).
5.3. Limitations and Recommendations
The study examined annual optimum irradiation levels and their regional variations. Still, potential influencing factors like diffuse irradiation, temperature, sun exposure hours, and azimuth angle were not isolated due to their automatic deduction by PVGIS algorithms. Future research could benefit from incorporating these factors to enhance understanding of solar irradiance patterns. While solar irradiance reflects sun energy reaching Earth’s surface, it does not directly correspond to actual electrical output due to losses during conversion using different PV materials, energy transfer, and occasional anomalies. Moreover, solar irradiance fluctuates daily.
Interpolation, a method for representing spatial data, has inherent limitations tied to its purpose. The success of variable analysis using Kriging models relies on data quality relative to the semi-variogram, and changing models can yield diverse outcomes. There is not a universally superior model; the optimal choice may also depend on the data [28]. Future studies could explore alternative interpolation techniques to minimize errors and variance, allowing for a more comprehensive representation of the data.
6. Conclusions
This study effectively employed Kriging interpolation to illustrate solar energy distribution and spatial variation in Northern Cape Province and Mpumalanga, generating maps depicting optimum annual irradiation with a low estimate error of 1.25% to 2.27%. The interpolation revealed moderate-to-strong spatial dependency, indicating meaningful autocorrelation among nearby values. In other words, attribute values of the points of data near one another are significantly influential and correlated to each other. This is good because it implies homogeneity of the output as opposed to high randomness. Furthermore, the validation process solidifies the reliability of PVGIS in regional solar irradiation assessment, with the overall Mean Absolute Percentage Error (MAPE) results falling within the range from 1.98505% to 2.32625% for the Northern Cape and Mpumalanga provinces when comparing the PVGIS tool to data from the Solar Atlas.
The annual optimum irradiation patterns offer insights into regional solar energy variability at an optimal angle (28° to 30°), providing estimated expectations for yearly irradiation in the provinces. Comparing both provinces, the Northern Cape exhibited higher irradiation, while Mpumalanga’s northwestern parts displayed comparable potential. Hotspots were identified in Mpumalanga’s western regions and Northern Cape’s central and northern areas, with Northern Cape showing minimal regional variation in optimum irradiation compared to Mpumalanga’s higher variability. Mpumalanga’s high spatial variation in irradiation in optimum irradiation ranges from relatively low to high, while Northern Cape’s spatial variation in irradiation ranges from moderately high to very high. It is for that very reason that the two have significant differences. For future recommendations, assessing actual PV outputs in these regions, potentially using the PVGIS tool, could enhance understanding of PV system performance based on irradiance, contributing to solar energy system insights in these provinces.
Author Contributions
Conceptualization, L.B. and P.M.; methodology, L.B. and P.M.; software, L.B.; validation, L.B. and L.B.; formal analysis, L.B.; investigation, L.B.; resources, L.B.; writing—original draft preparation L.B.; writing—review and editing, L.B. and P.M.; visualization, L.B.; supervision, P.M. All authors have read and agreed to the published version of the manuscript.
Funding
This research received no external funding.
Data Availability Statement
The source of the data used for this study can primarily be accessed from the PVGIS Solar Atlas web site: https://re.jrc.ec.europa.eu/pvg_tools/en/ (accessed on 20 June 2022).
Conflicts of Interest
The authors declare no conflict of interest.
Appendix A
References
- Madubansi, M.; Shakleton, C.M. Changing energy profiles and consumption patterns following electrification in five rural villages, South Africa. Energy Policy 2006, 34, 4081–4092. [Google Scholar] [CrossRef]
- Ayodele, T.R.; Mosetlhe, T.C.; Yusuff, A.A.; Ntombela, M. Optimal design of wind-powered hydrogen refuelling station for some selected cities of South Africa. Int. J. Hydrog. Energy 2021, 46, 24919–24930. [Google Scholar] [CrossRef]
- Akinbami, O.M.; Oke, S.R.; Bodunrin, M.O. The state of renewable energy in South Africa: An Overview. Alex. Eng. J. 2021, 60, 5077–5093. [Google Scholar] [CrossRef]
- Shikwambana, L.; Mhangara, P.; Kganyago, M. Assessing the relationship between economic growth and emissions levels in South Africa between 1994 and 2019. Sustainability 2021, 13, 2645. [Google Scholar] [CrossRef]
- Nakumuryango, A.; Inglesi-Lotz, R. South Africa’s performance on renewable energy and its relative position against the OECD countries and the rest of Africa. Renew. Sustain. Energy Rev. 2016, 56, 999–1007. [Google Scholar] [CrossRef]
- Aliyu, A.K.; Modu, B.; Tan, C.W. A review of renewable energy development in Africa: A focus in South Africa, Egypt and Nigeria. Renew. Sustain. Energy Rev. 2018, 81, 2502–2518. [Google Scholar] [CrossRef]
- Thopil, M.S.; Bansal, R.C.; Zhang, L.; Sharma, G. A review of grid-connected distributed generation using renewable energy sources in South Africa. Energy Strategy Rev. 2018, 21, 88–97. [Google Scholar] [CrossRef]
- Simpson, G.B.; Badenhorst, J.; Jewitt, G.P.W.; Berchner, M.; Davies, E. Competition for land: The water-energy-food nexus and coal mining in Mpumalanga province, South Africa. Front. Environ. Sci. 2019, 7, 1–12. [Google Scholar] [CrossRef]
- Laisani, J.; Jegede, O.A. Impacts of Coal Mining in Witbank, Mpumalanga Province of South Africa: An Eco-Legal Perspective. J. Rev. Glob. Econ. 2019, 8, 1586–1597. [Google Scholar] [CrossRef]
- van der Merwe, W.; Brent, A.C. Evaluating the energy potential of solar PV located on mining properties in the Northern Cape Province of South Africa. Sustainability 2020, 12, 5857. [Google Scholar] [CrossRef]
- Mabunda, N.E. Use of Photovoltaic Energy to Minimize the Impact of Load-shedding in South Africa. In Proceedings of the 2021 International Conference on Electrical, Computer and Energy Technologies (ICECET), Cape Town, South Africa, 9–10 December 2021. [Google Scholar]
- Kannan, N.; Vakeesan, D. Solar energy for future world—A review. Renew. Sustain. Energy Rev. 2016, 62, 1092–1105. [Google Scholar] [CrossRef]
- Krupa, J.; Burch, S. A new energy future for South Africa: The political ecology of South African renewable energy. Energy Policy 2011, 39, 6254–6261. [Google Scholar] [CrossRef]
- Tobiska, W.K.; Woods, T.; Eparvier, F.; Viereck, R.; Floyd, L.; Bouwer, D.; Rottman, G.; White, O.R. The SOLAR2000 empirical solar irradiance model and forecast tool. J. Atmos. Sol. Terr. Phys. 2000, 62, 1233–1250. [Google Scholar] [CrossRef]
- Hammer, A.; Heinemann, D.; Hoyer, C.; Kuhlemann, R.; Lorenz, E.; Müller, R.; Beyer, H.G. Solar energy assessment using remote sensing technologies. Remote Sens. Environ. 2003, 86, 423–432. [Google Scholar] [CrossRef]
- Šúri, M.; Huld, T.A.; Dunlop, E.D. PV-GIS: A web-based solar radiation database for the calculation of PV potential in Europe. Int. J. Sustain. Energy 2005, 24, 55–67. [Google Scholar] [CrossRef]
- Mohd, M.R.S.; Ruslan, F.A.; Johari, J. GIS-aided geographical and meteorological data overview of solar radiation mapping for Malaysia—An explanatory study based on solar radiation prediction modeling using neural network approach. J. Teknol. 2021, 83, 19–33. [Google Scholar]
- Li, J.; Heap, A.D. Spatial interpolation methods applied in the environmental sciences: A review. Environ. Model. Softw. 2014, 53, 173–189. [Google Scholar] [CrossRef]
- Şen, Z.; Şahin, A.D. Spatial interpolation and estimation of solar irradiation by cumulative semivariograms. Solar Energy 2001, 71, 11–21. [Google Scholar] [CrossRef]
- Hughes, J.P.; Lettenmaier, D.P. Data Requirements for Kriging: Estimation and Network Design. Water Resour. Res. 1981, 17, 1641–1650. [Google Scholar] [CrossRef]
- Brus, D.J.; Heuvelink, G.B.M. Optimisation of sample patterns for universal kriging of environmental variables. Geoderma 2007, 138, 86–95. [Google Scholar] [CrossRef]
- Tarai, R.K.; Kale, P. Development of rasterized map using PVGIS for assessment of solar PV energy potential of Odisha. Int. J. Renew. Energy Res. 2016, 6, 61–73. [Google Scholar]
- Huld, T.A.; Šúri, M.; Kenny, R.P.; Dunlop, E.D. Estimating PV performance over large geographical regions. In Proceedings of the Conference Record of the Thirty-First IEEE Photovoltaic Specialists Conference, Lake Buena Vista, FL, USA, 3–7 January 2005; pp. 1679–1682. [Google Scholar]
- Ŝúri, M.; Hofierka, J. A new GIS-based solar radiation model and its application to photovoltaic assessments. Trans. GIS 2004, 8, 175–190. [Google Scholar] [CrossRef]
- Gundogdu, K.S.; Guney, I. Spatial analyses of groundwater levels using universal kriging. J. Earth Syst. Sci. 2007, 16, 49–55. [Google Scholar] [CrossRef]
- Choi, Y.; Suh, J.; Kim, S.M. GIS-based solar radiation mapping, site evaluation, and potential assessment: A Review. Appl. Sci. 2019, 9, 1960. [Google Scholar] [CrossRef]
- Charfi, W.; Chaabane, M.; Mhiri, H.; Bournot, P. Performance evaluation of a solar photovoltaic system. Energy Rep. 2018, 4, 400–406. [Google Scholar] [CrossRef]
- Leirvik, T.; Yuan, M. A Machine Learning Technique for Spatial Interpolation of Solar Radiation Observations. Earth Space Sci. 2021, 8, 1–22. [Google Scholar] [CrossRef]


Disclaimer/Publisher’s Note: The statements, opinions and data contained in all publications are solely those of the individual author(s) and contributor(s) and not of MDPI and/or the editor(s). MDPI and/or the editor(s) disclaim responsibility for any injury to people or property resulting from any ideas, methods, instructions or products referred to in the content. |
© 2023 by the authors. Licensee MDPI, Basel, Switzerland. This article is an open access article distributed under the terms and conditions of the Creative Commons Attribution (CC BY) license (https://creativecommons.org/licenses/by/4.0/).