Article

Impact of the New Electricity Remuneration Scheme on the Waste-to-Energy Recovery Activity in Portugal

1
Electrical Engineering Energy and Automation Department (DEEEA), Instituto Superior de Engenharia de Lisboa (ISEL), Instituto Politécnico de Lisboa (IPL), Rua Conselheiro Emídio Navarro, 1, 1959-007 Lisboa, Portugal
2
Valorsul—Valorização e Tratamento de Resíduos Sólidos das Regiões de Lisboa e do Oeste, Estação Mercadorias Bobadela, Plataforma Ribeirinha CP Lisboa, 2696-801 São João da Talha, Portugal
3
INESC-ID—Instituto de Engenharia de Sistemas e Computadores: Investigação e Desenvolvimento, Rua Alves Redol, 9, 1000-029 Lisboa, Portugal
*
Author to whom correspondence should be addressed.
Energies 2023, 16(18), 6624; https://doi.org/10.3390/en16186624
Submission received: 14 July 2023 / Revised: 7 September 2023 / Accepted: 11 September 2023 / Published: 14 September 2023

Abstract

:
The remuneration scheme for the electricity produced by Waste-to-Energy (WtE) recovery plants has changed recently in Portugal according to 2020 legislation. The new model, linking the electricity remuneration from WtE plants to the spot electricity prices, is expected to bring greater uncertainty in the waste activity, which is a novelty for the sector. In Portugal, Valorsul is the municipal waste treatment entity responsible for the recovery and treatment of municipal solid waste (MSW) produced in 19 municipalities in the Lisbon area. This paper highlights the impact of the new Portuguese electricity remuneration scheme for electricity from waste on Valorsul’s WtE plant. For this purpose, the new remuneration scheme is modeled and simulated based on electricity spot market price scenarios, which are compared with the base case scenario of the former remuneration scheme. Considering different electricity prices for the electricity produced by the WtE plant, the present study anticipates the consequences of the gate-fee of such regulatory changes. Results show that any price changes in the electricity remuneration scheme are offset by equivalent changes in the waste gate-fee. Consequently, the change in the remuneration of the electricity from the WtE plant is, in fact, neutral for the Valorsul accounts and lower revenues from the electricity generation activity of the WtE will negatively impact the gate-fee prices paid by the waste users.

1. Introduction

The European Green Deal set forward ambitious targets to reduce greenhouse gas emissions by at least 55% in 2030, compared to 1990 levels. This emissions reduction will be driven by a 40% contribution of renewable energy in primary energy consumption, a 36% to 39% reduction in energy consumption, and a 55% reduction of emissions from cars [1]. A crucial contribution to achieving the European Green Deal targets is coming from the transformation of a linear economy to a circular economy, decoupling economic growth from the use of resources, and simultaneously, ensuring the European Union’s economic competitiveness. Taking this into account, the European Commission (EC) adopted, in March 2020, the new Circular Economy Action Plan [2] as one of the main building blocks of the European Green Deal. The circular economy action plan has a central role in making sustainable products the standard in the European Union (EU), ensuring less waste production, focusing on sectors that use the most resources, and having a higher potential for circularity. In what concerns waste, the Plan integrates a set of actions devoted to product durability, reusability, and reparability, to increase products’ recycling content and to enable remanufacturing and high-quality recycling. It also takes actions to improve consumers' information regarding the lifespan of products, availability of repair services, and spare parts.
Waste and recycling policy is closely related to the circular economy. In this sense, Directive 2008/98/EC [3] is intended to protect the environment and human health, prevent and reduce the impacts and adverse effects of waste production and management, and establishes a hierarchy in waste prevention and management as follows: prevention, preparation for reuse, recycling, other recovery (e.g., energy recovery), and disposal. It also determines that incineration and co-incineration with energy recovery only occur with a high level of energy efficiency. Later, through Directive 2018/851/EC [4], ambitious recycling targets for municipal waste were set at a minimum of 55% by 2025, 60% by 2030, 65% by 2035, even more ambitious targets for waste of packaging by a minimum of 65% by 2025, and 70% by 2030. Also in 2018, Directive 2018/850/EC [5] established that EU member states must take measures to reduce the amount of urban waste disposed of in landfills to less than 10% of the total amount of Municipal Solid Waste (MSW) produced, by 2035.
In [6], the process of MSW management strategy from the waste sorting perspective was reviewed, which includes source separation, collection and transportation, pre-treatment, and resource utilization. Although positive results have been reported in the transition to sustainable waste management and to a circular economy in some EU countries [6], especially in Germany, in 2016, which has already achieved the EU targets regarding recycling for 2035, in many other countries, quality recycling has to increase, and larger amounts of secondary raw materials must return to manufacture.
In Portugal, the National Climate and Energy Plan for 2021–2030 (Plano Nacional Energia e Clima 2030 para 2021–2030—PNEC 2030) [7] reinforces the need for a larger reuse and recycling focusing on a more circular economy, giving priority to waste reduction followed by selective collection of MSW. Despite that the waste sector only accounted for 7% of total greenhouse gas emissions in 2017, PNEC 2030 identifies a potential for greenhouse gas emissions reduction from the waste sector of 49% by 2030, and 64% by 2040, compared to 2005 levels. One of the measures to achieve this target is the promotion and support of facilities that allow the recuperation of landfill gases and biogases to produce electricity.
Regarding waste management and recycling policy in Portugal, the Strategic Plan for Municipal Solid Waste approved in 1997 (PERSU I), configured a reference planning instrument in the area of MSW, which provided the implementation of a set of actions that proved to be fundamental in the policy of urban waste [8]. This strategic plan aimed at closing more than 360 dumps that existed in the country at the time and the installation of two Waste-to-Energy Recovery Plants (WtE plants) in the two larger urban areas of Portugal, Lisbon (Valorsul), and Porto (Lipor). Both these plants started operating in 2000 since then selling electricity to the national grid.
In 2007, the Strategic Plan for Municipal Solid Waste for the period from 2007 to 2016 (PERSU II) was approved through Ordinance 187/2007 of 12 February [9], continuing the waste management policy, taking into account the requirements formulated at national and European levels, ensuring, in particular, compliance with the European objectives regarding the diversion of biodegradable MSW from landfills and recycling and recovery of packaging waste, and seeking to overcome the limitations pointed out to the implementation of PERSU I.
The General Waste Management Regime, a guideline for the sector and the Strategic Plan for Municipal Solid Waste (PERSU 2020), approved by Ordinance 187-A/2014 on 7 September [10], later adjusted by Ordinance 241-B/2019 [11], which publishes PERSU 2020+, came to implement the National Waste Management Plan 2014–2020 [12] within the scope of the production and management of MSW in Portugal, for the period from 2014 to 2020.
For the integrated management of MSW and the pursuit of priorities that have been defined in the legislation and respective plans, 23 municipal waste treatment systems are set up in Portugal, also involving the municipalities, and thus covering the entire continental territory [13]. Each of these systems has infrastructures to ensure adequate treatment and destination for the MSW produced in the respective area. The Portuguese Autonomous regions of Azores and Madeira also have infrastructures and equipment that ensure the management and treatment of this type of waste.
Continuing the policy of the national waste management plan, both the 2030 document [14] and the PERSU for 2030 (PERSU 2030) were recently published [15]. The newest PERSU 2030 proposes to continue the application of the waste policy in Portugal, guiding the agents involved in the establishment of measures and implementation of actions that allow the country to be aligned with European policies and guidelines, making a significant contribution to improving the environment. Hence, less waste disposed in landfills might be accomplished by using waste to produce energy, the so-called WtE process.
WtE is a broad term that includes several waste treatment processes that have energy as a by-product. This energy might be in the form of electricity or heat, or the form of fuel [16], which has a potential role in the circular economy. According to the European Directive on Renewable Energy Sources, WtE is classified as a renewable energy source, whose definition of biomass includes the biodegradable part of urban and industrial waste and must support the objectives of the circular economy action plan. Also, waste incineration must be redefined to ensure no hindering of the increase in recycling and reuse of waste and that there is no risk of overcapacity. In this regard, EU public funding to increase waste incineration capacity must be limited and well justified [16] as the carbon intensity of the electricity produced by waste incineration is higher than the average carbon intensity of the grid [13].
As a summary of the most important European and Portuguese legislation referred to, Figure 1 presents a timeline of its publishing.
The sustainability of the MSW sector requires a balance between costs and permitted income of the municipal waste treatment systems and municipalities, which, if not achieved, might have the consequence of increasing the waste tariff paid by citizens and other waste producers or the non-accomplishment of the targets set by the EU [13].
Having consequences on the remuneration of WtE plants, Ordinance 244/2020 of 15 October [17] has introduced profound changes in the remuneration model of the electricity produced by WtE plants, setting the price of the energy produced equal to the price of the day-ahead electricity market, to be fully in place from 2025. This change will lead to a higher degree of uncertainty on the permitted income and, consequently, on the waste treatment gate-fee when compared to the electricity-regulated feed-in tariff for electricity sold to the national electricity system that was previously in practice for 20 years.
In this context, the present work is focused on the activity of Valorsul, a company responsible for the recovery and treatment of MSW produced in 19 municipalities of the Portuguese area that includes greater Lisbon and the West region. For the company, the revenue from energy sales represents around 50% of its turnover [18].
In particular, it is aimed by this study to evaluate the impact of the new remuneration scheme set by the 2020 Portuguese legislation on the WtE activity and the gate-fee paid for the waste treatment. It should be taken into account that Valorsul operates in a non-competitive sector and is, therefore, subject to the regulation of waste management activity, specific to the sector, in this case under the supervision of the Water and Waste Services Regulatory Entity (ERSAR, in the Portuguese acronym). Additionally, this setting represents an opportunity to launch the discussion on the interaction between the waste treatment market and the electricity market, as well as their integration into the circular economy concept. The analysis considers ERSAR’s decision on permitted income and regulated tariffs for the regulatory period, estimated values for energy production, amount of waste treated, and amount of waste subject to incineration [19].
The remainder of the paper is organized as follows: Section 2 gives an overview of current situation of WtE activity; Section 3 presents the technical characteristics of the Valorsul’s WtE plant in consideration as well as the regulatory framework for waste and energy under which Valorsul operates; Section 4 presents the methodology used to achieve the objectives of the study; Section 5 presents the results, which are then discussed in Section 6; and, finally, Section 7 draws the major conclusions of this study.

2. Waste-to-Energy Activity

According to [20], WtE meets the two main objectives of waste management. Firstly, the protection of humans and the environment and, secondly, the conservation of resources and the recovery of materials, which are affected by the nature of the WtE plant.
Energy recovery from waste began a long time ago, with the first waste incinerator being built in 1885 in the United States. Since then, the concept has evolved both in terms of quality and quantity. Recent studies related to WtE from MSW [21] revealed that the United States produced more than 260 million tonnes of MSW in 2015, corresponding to approximately 2 kg per day per person, where only 13% of MSW is used for energy recovery and 53% is landfilled. Also, according to [22], in 2016, the number of WtE plants for MSW reached 1618 worldwide, including 512 in Europe, 822 in Japan, 88 in the United States, and 166 in China.
In terms of market value, globally WtE reached 21.41 billion Euros in 2013, with a growth rate of 5.5% compared to the previous year. The WtE technologies based on thermal energy conversion led the market and accounted for 88.2% of total market revenue in 2013. This market should maintain its steady growth until 2023, when it is estimated that it will be worth around 34 billion Euros, at a compound annual growth rate of more than 5.5% from 2016 to 2023 [23].
In the Asia-Pacific region, the market is dominated by Japan, which uses up to 60% of its solid waste for incineration. However, the fastest market growth is China, which more than doubled its WtE capacity in the period 2011–2015 [24]. In the context of waste management plans and legislation in India, [25] discusses several alternatives to incineration, such as gasification technologies. From a technical perspective, they conclude that both gasification and anaerobic digestion are promising alternatives, although the economic efficiency is to be evaluated. Additionally, [26] reviews the process of MSW management strategy from the waste sorting perspective, which includes source separation, collection and transportation, pre-treatment, and resource utilization.
In Europe, according to [22], there were 512 incineration plants in 2016, with 251 plants producing Combined Heat and Power (CHP), 161 producing only electricity and 94 generating only heat. There is no precise information about the type of the remaining 6. This number of incineration plants totaled 93 million tonnes of incineration capacity in 2016 of which Germany with 24 million tonnes, 98 incineration plants, and France with 16 million tonnes, in 121 incineration plants have the largest MSW incineration capacities [22]. Although at the European level, the average European waste incineration capacity is around 170 kilotonnes of waste per year (kt/y), the context for MSW incineration plants can be quite different from country to country. As a matter of fact, in some countries, such as the Netherlands, Portugal, Hungary, Spain, or Austria, large plants with incineration capacities above 400 kt/y are common. In other countries, such as Norway, Denmark, Switzerland, or France, smaller plants with incineration capacities between 80 and 120 kt/y are more common [22].
In terms of the electricity generation capacity in WtE plants, Germany was the leading country, with 1925 MW, followed by the United Kingdom with 925 MW, Sweden with 876 MW, and Italy with 830 MW. The electricity produced in Europe from waste was the largest in Germany with 5768 GWh, followed by the United Kingdom with 2782 GWh, Italy with 2344 GWh, France with 1999 GWh, and the Netherlands with 1997 GWh [22].
The rise of municipal and industrial waste together with strict waste legislation across the EU has been the main drivers of the European market. Germany, with 27 million tonnes of municipal waste incinerated in 2021, France (14.26 million tonnes), UK (13.96 million tonnes), Netherlands (7.57 million tonnes), Sweden (6.89 million tonnes), Italy (6.24 million tonnes), Switzerland (4.07 million tonnes), Denmark (3.66 million tonnes, and Austria (2.6 million tonnes), are the leading countries in Europe as far as municipal waste incinerated is concerned [27]. Some of these EU countries are considered benchmarks and frontrunners in policies and their practices are followed by other countries [28]. Also, regarding the EU, [29] presents the distinct countries' tariffs (taxes/fees) for landfilling MSW.
Recent studies show that the current practices, challenges, and future opportunities in municipal WtE are a worldwide concern showing the topic relevance specifically in the most developed and demographic countries, China [28], India [30], and the United States [31]. This is also true in countries such as Portugal where an environmental evaluation of the waste treatment processes for the area of Greater Porto is presented in [32]. In particular, the recent changes in the regulatory framework in Portugal brought into force by Ordinance 244/2020, presents challenges for municipal waste treatment entities, such as Valorsul, which is the focus of the present study.

3. Technical and Economic Framework

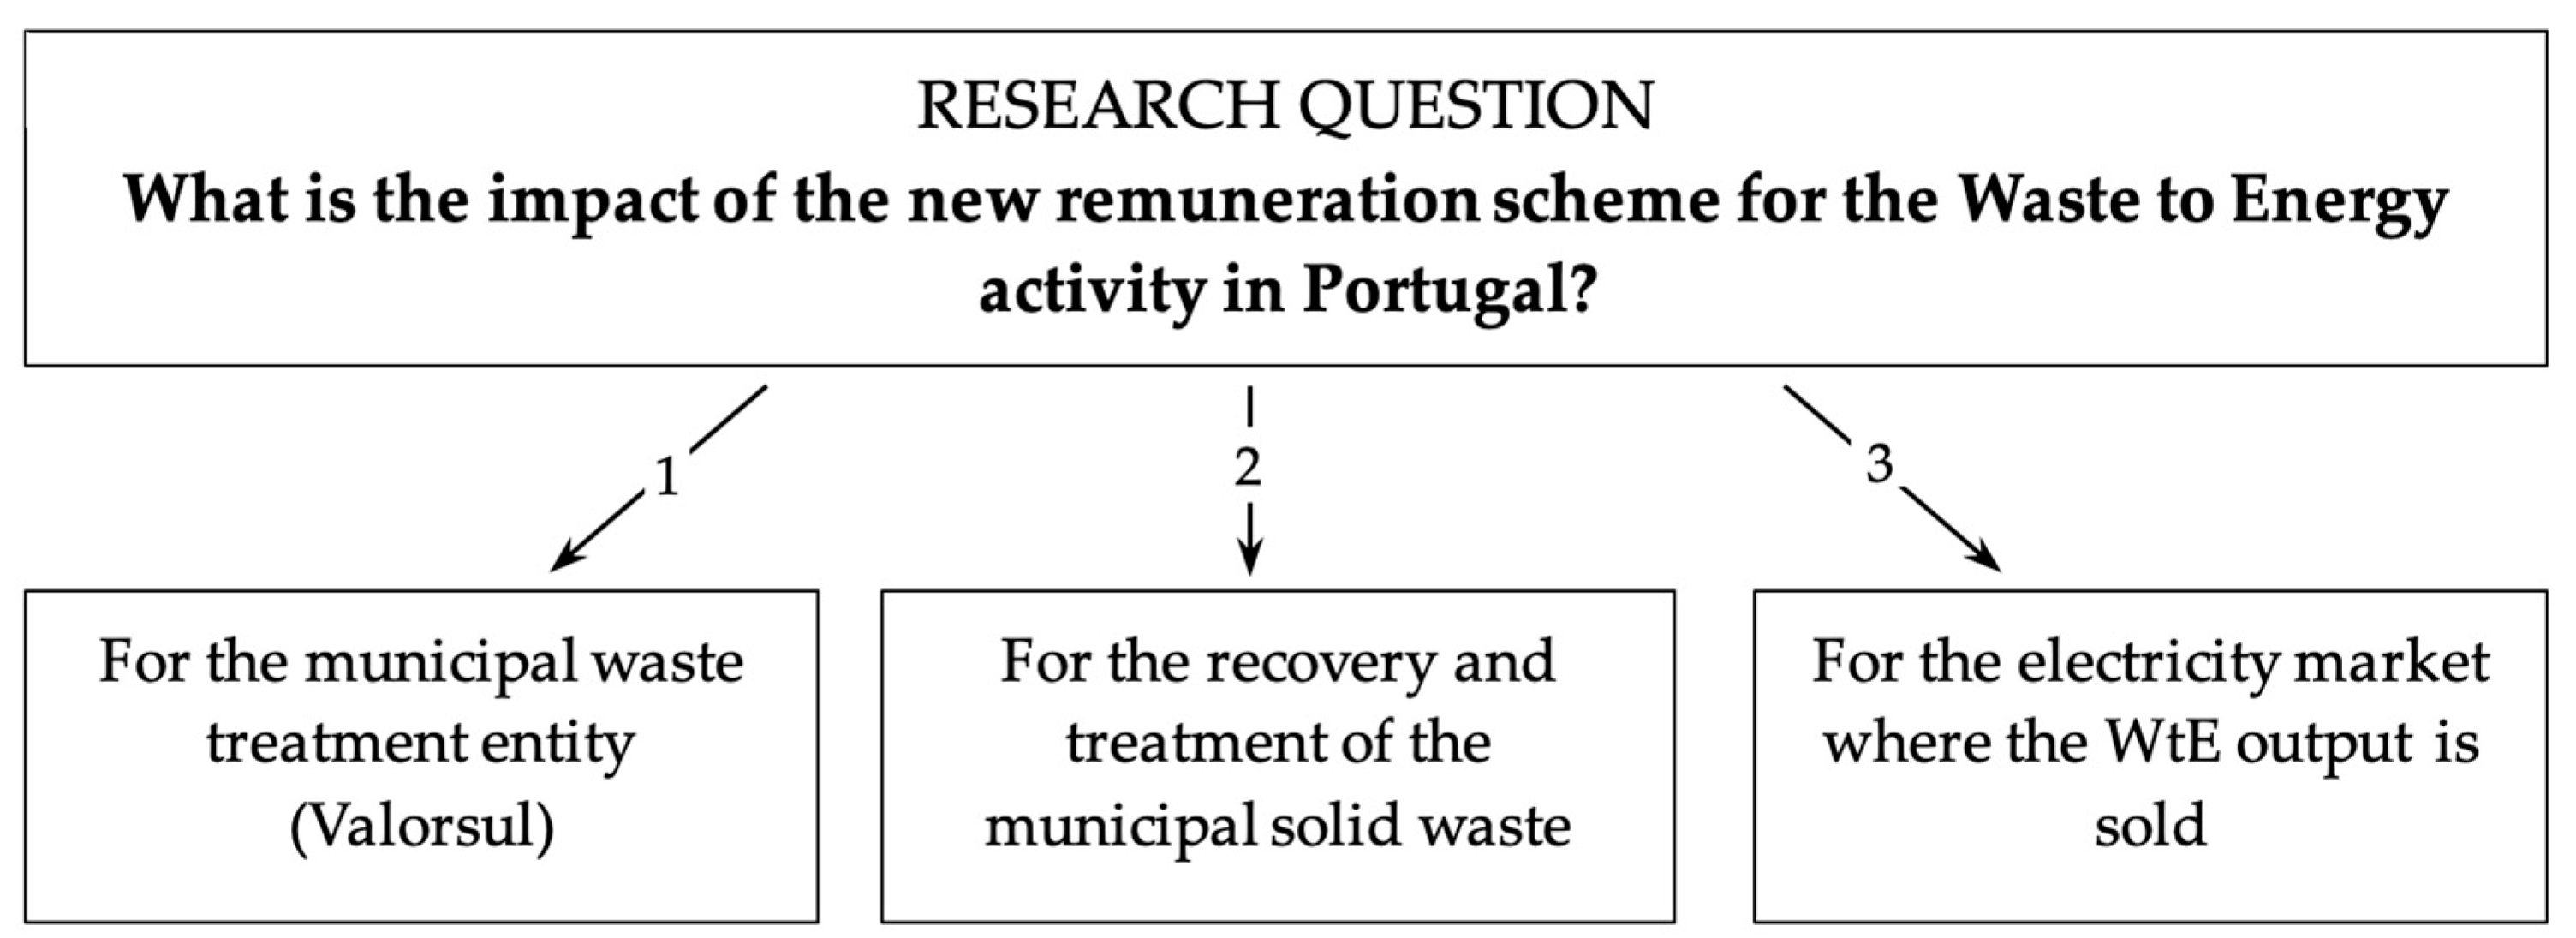
3.1. Valorsul’s WtE Plant

As mentioned earlier, the creation of PERSU I in the mid-1990s made a decisive contribution to the implementation of the concept in Portugal that has become known as Waste-to-Energy. In this context, Valorsul was created as a company with the aim of finding a solution and a destination for the thousands of tonnes of MSW produced in municipalities in the Greater Lisbon area and started operating a WtE activity in 2000. Valorsul’s WtE plant has a processing capacity of 28,000 kg of MSW per hour in each of the three steam-generating grate waste combustion lines responsible for driving an alternator-turbine group capable of providing the public service electrical grid with a capacity of 50 MW.
Valorsul, other than the WtE plant, has two sorting stations for the preparation of sorted waste for recycling, one anaerobic digestion plant for converting biowaste into biogas and producing electricity, and two landfills for waste that is not recovered and transfer stations. Overall, Valorsul treats 0.8 million tonnes of MSW of which around 0.66 million tonnes are in its WtE plant.
The sale of electricity by WtE is the company’s largest source of revenue, representing 52.6% of the company’s turnover [18], as shown in Figure 2.

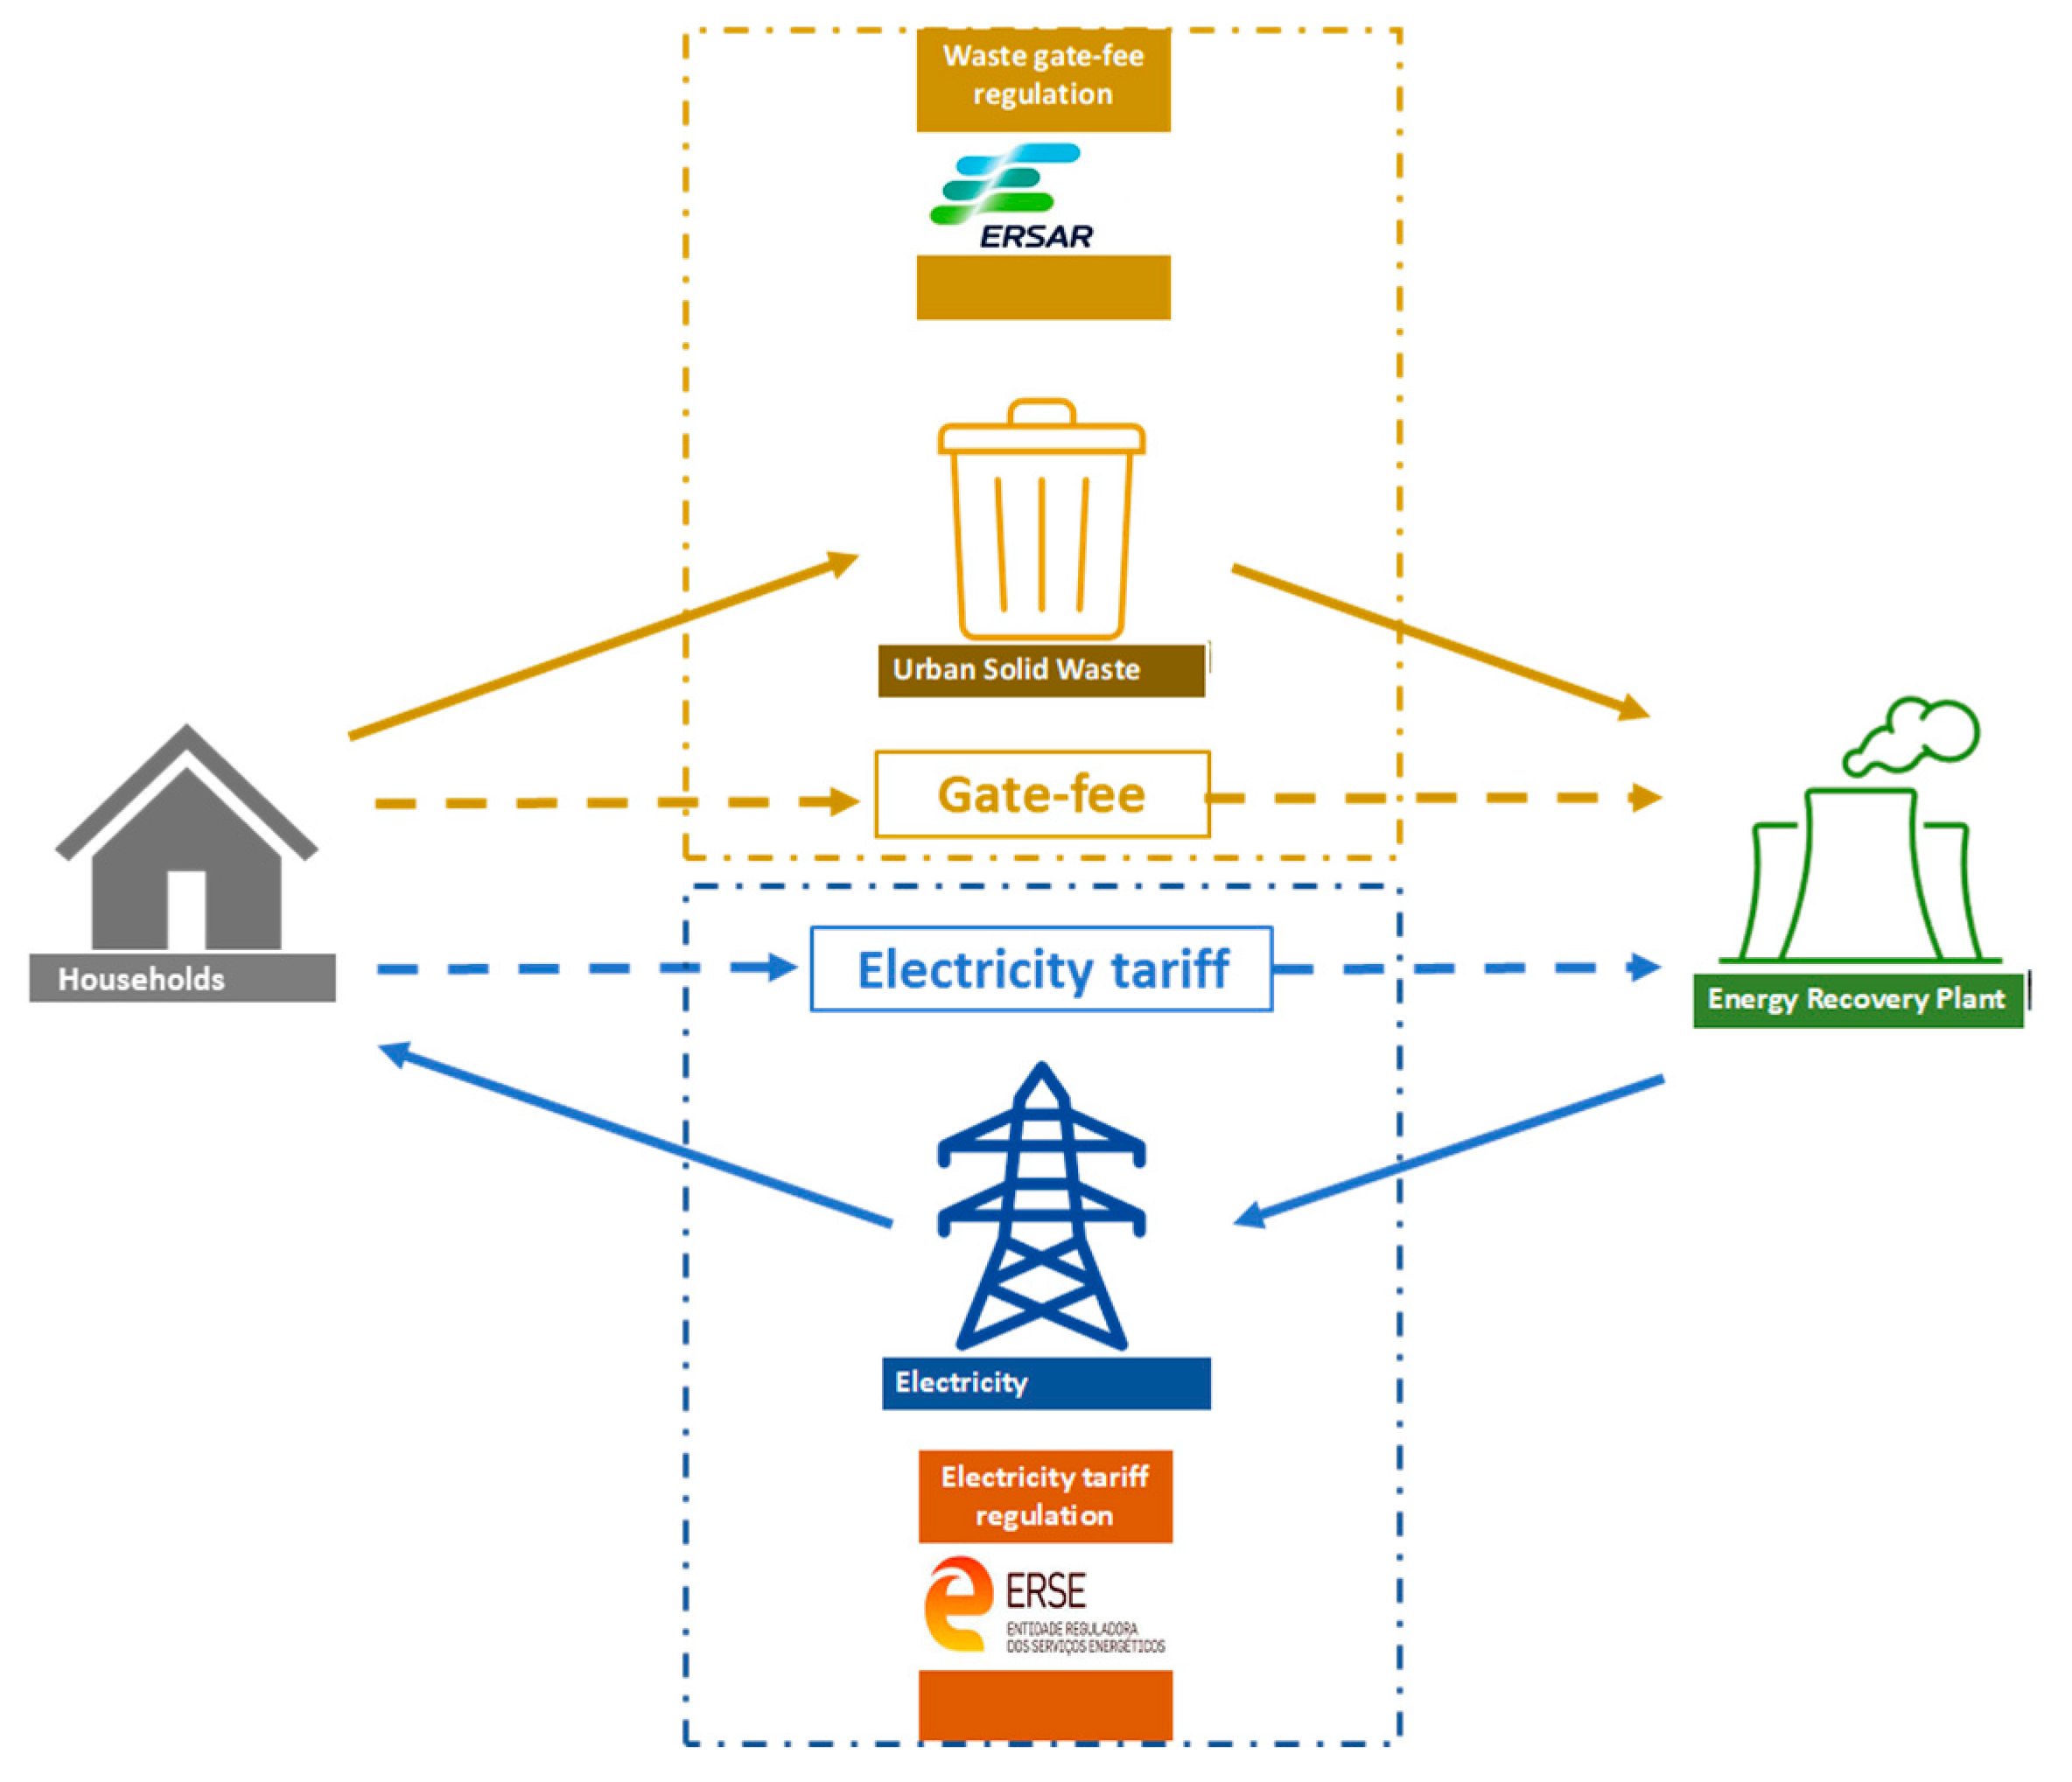
3.2. Regulatory Framework for Electricity and Waste

Valorsul is supervised by ERSAR since it operates in the waste management sector. ERSAR is responsible for setting the gate-fee, based on the definition of total permitted income (TPI), tariff income, and tariffs for each of the years of the regulatory period. According to ERSAR, the gate-fee allows the economic and financial recovery of the costs of the services computed according to an efficiency scenario and also promotes the economic accessibility of users [33]. The gate-fee is set for the whole MSW treatment system and not only for the incineration process. Also, as shown in Figure 3, the main source of additional revenues of Valorsul comes from the electricity generated by the WtE plant, under the supervision of the Energy Services Regulatory Authority (ERSE, in the Portuguese acronym), thus making Valorsul supervised by two different regulatory authorities (ERSAR and ERSE).
Figure 3 summarizes the regulatory frameworks under which Valorsul operates.

3.2.1. Regulatory Framework for Electricity

Concerning the regulatory framework that applies to the electricity generated by WtE plants, the Decree-law 189/1988 established the rules applicable to the production of electricity from renewable resources and to CHP.
Subsequently, Decree-Law 168/1999 established the principles necessary for the internalization of the environmental benefits provided by these facilities, allowing the implementation of tariffs commonly known as feed-in tariffs. Later, in 2005, Decree-Law 33-A/2005 (article 2, nr. 20) determined that the feed-in tariff should be in place for a period of 15 years from the beginning of electricity supplied to the grid, for the WtE plant, which led to the duration of the tariff until March 2015. The formula under which facilities licensed under Decree-Law 189/1988 are remunerated for the supply of electricity delivered to the grid was finally established by Decree-Law 225/2007. The formula is the following as presented in (1):
V R D m = K M H O m × P F V R D m + P V V R D m + P A V R D m × Z × C P I m 1 C P I r e f × 1 1 L E V ,
where VRDm is the remuneration applicable to the electricity produced by the renewable plant, in month m, KMHOm is an optional coefficient, which modulates the values of PF(VRD)m, PV(VRD)m and PA(VRD)m as a function of the time period at which the energy was supplied, in month m, PF(VRD)m is the fixed portion of the remuneration applicable to renewable plants, in month m, which reflects the avoided investment costs by the renewable plant, PV(VRD)m is the variable portion of the remuneration applicable to renewable plants, in month m, which reflects the avoided operation and maintenance costs by the renewable plant, PA(VRD)m is the environmental portion of the remuneration applicable to renewable plants, in month m, which reflects the avoided CO2 emission costs by the renewable plant, CPIm−1 is the consumer price index without housing on mainland Portugal, referring to the month previous to the month m, CPIref is the consumer price index without housing on mainland Portugal, referring to the month prior to the start of the supply of electricity to the grid by the renewable plant, LEV represents the losses, in the transmission and distribution networks, avoided by the renewable plant, and Z is a dimensionless coefficient that reflects the specific characteristics of the endogenous resource and the technology used by the renewable plant, in particular Z assumes the value of 1 for WtE plants using MSW [34].
In 2013, Decree-Law 35/2013 (article 3, nr. 1 b) established that “in the case of non-hydro power plants that were already in operation on the date of entry into force of Decree-Law 33-A/2005, of 16 February, for a period of 15 years from that date”, the period of validity of the feed-in tariff was extended until February 2020. By 2020, on 13 February, Ordinance no. 41/2020 was published, establishing an extension of the feed-in tariff for 6 months until August 2020.
On 15 October, Ordinance 244/2020 was published, which determined a new remuneration model for the sale of electricity from WtE, based on participation in the wholesale market for the sale of electricity. The same Ordinance determined that the applicable tariff corresponds to the closing price of the day-ahead market of the Portuguese area of the MIBEL, plus a bonus corresponding to the difference between this and the tariff established in the Decree-Law 225/2007. The aforementioned bonus should be progressively reduced by applying the following coefficients: 1.0 in 2020; 0.75 in 2021; 0.50 in 2022; and 0.25 in 2023. Finally, on 30 December, Ordinance 308-C/2020 was published, which moved the coefficients one year ahead: 1.0 in 2021, 0.75 in 2022, 0.5 in 2023, and 0.25 in 2024, referring to the entry into the market of energy produced by the WtE plant for the year 2025.

3.2.2. Regulatory Framework for Waste
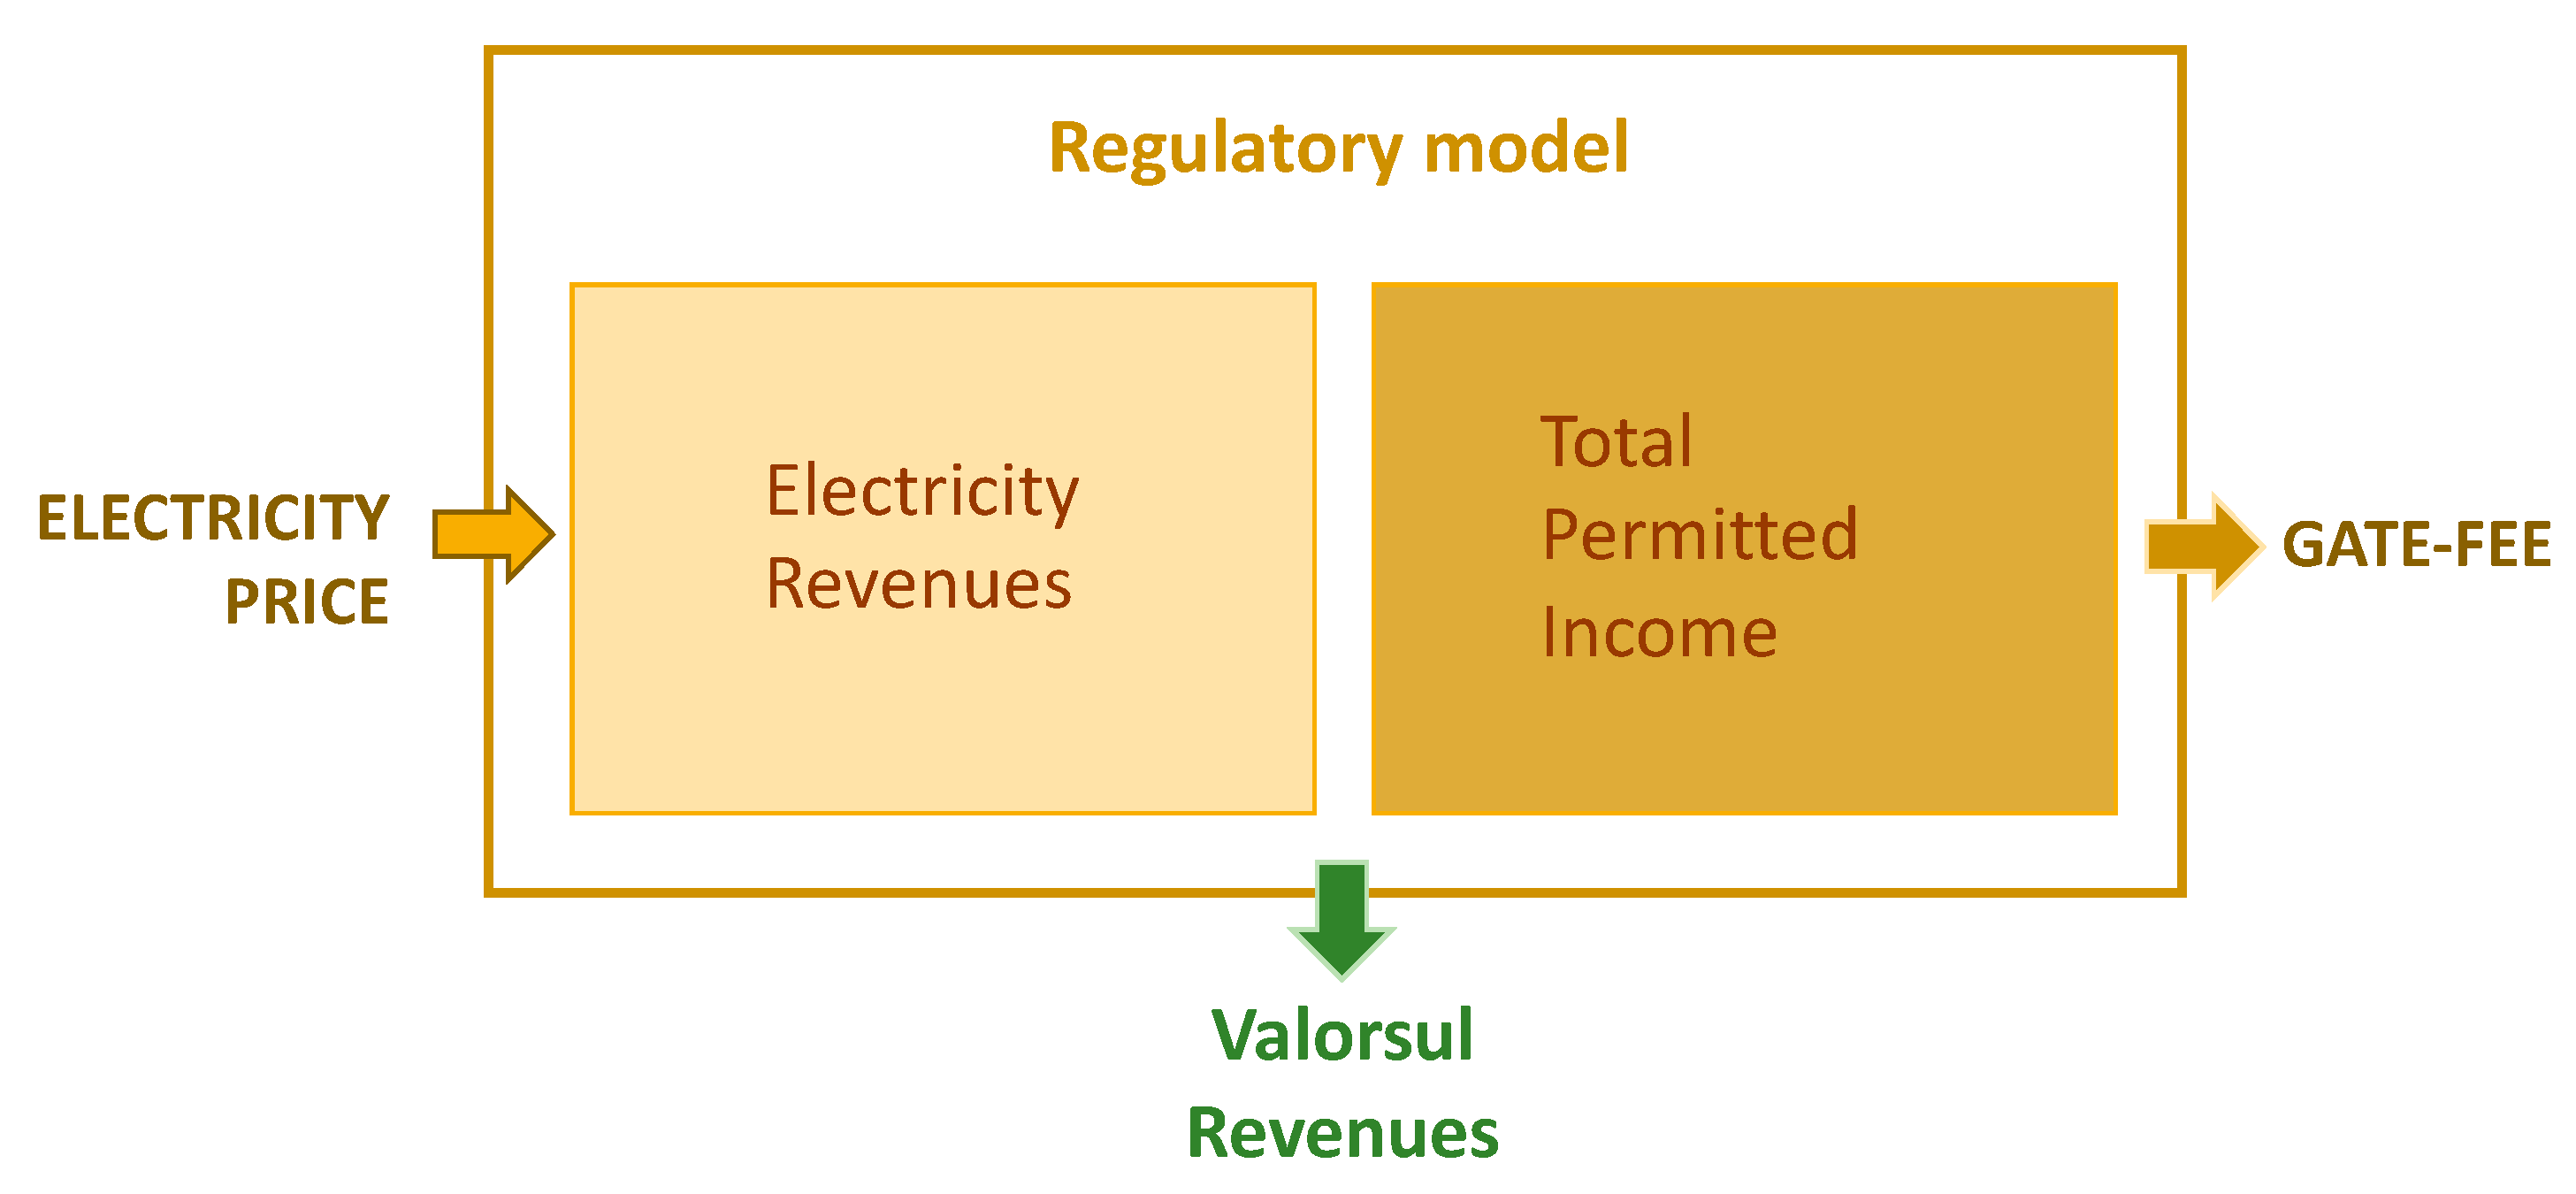
As for the waste regulation, the Tariff Regulation of the Urban Waste Management Service establishes the terms under which gate-fees are set for state-owned systems, managed by private capital entities, which provide MSW management services.
On that basis, the gate-fee that users must pay for the treatment of MSW is based on market prospects and the historical record of quantities of the waste treatment plants.
The calculation of the gate-fee, G F , corresponds to the ratio between the total permitted income of the waste management service, T P I , for a given year and the total quantity of undifferentiated waste to be received from the user entities (mainly municipalities), T Q U W , as presented in Equation (2):
G F t = T P I t T Q U W , t   ,
where G F t is the value for year t, in €/ton, T P I t is the value for year t, in €, and T Q U W , t is estimated for the year t, in tonnes.
In turn, the total permitted income for the urban waste management service is given by Equation (3), as follows:
T P I t = P I U C , t + P I S C , t + P I S T , t + O C s t , t + A d j t 2 + I t t 2 R B t ,
where P I U C , t is the permitted income from the activity of waste treatment resulting from undifferentiated collection, in year t, P I S C , t is the permitted income from the selective collection activity, in year t, P I S T , t is the permitted income from the waste treatment activity resulting from selective treatment, in year t, O C s t , t are the operating costs associated with the structure, accepted in year t, A d j t 2 are the adjustments to the total permitted income, reported two years before year t, I t t 2 is the permitted income from the incentives, reported two years before year t and R B t is a positive or negative variation of the regulatory balance regarding the deferral or anticipation of tariff revenues, in year t. All terms in Equation (3) are in €.
Selective collection comprises the sorting of MSW to guarantee the quality of the material that goes for recycling. Recyclable material is then baled and sent to the recycling industry while contaminants are sent for treatment as unsorted waste. Selective collection includes biowaste that is sent to the anaerobic digestion plant. Undifferentiated waste treatment refers to incineration or landfilling of MSW.
Operating costs incorporate the operating costs associated with each of the waste management activities, as well as the costs associated with the structure of the managing entity, such as costs with the supply of consumables, costs with services provided by external entities, and personnel costs.
The implementation of adjustments aims to mitigate the differences between the results of the activity previously estimated by ERSAR and the effective results achieved by the managing entity. The incentives are established to induce efficient and environmentally sustainable performance, with the aim of surpassing previously established goals.
The regulatory balance should remain at zero and corresponds to the accumulated difference, for one or more years, between the total permitted income defined for each year and those that the competent authority authorizes to be reflected in the tariffs for that same year, aiming at the stability of tariff trajectories and considering the liquidity and financial stability of the managing entities.
The permitted income for the activity of waste treatment resulting from undifferentiated collection is given by Equation (4):
P I U C , t = C C U C , t + O C U C , t A R U C , t B C A U C , t ,
where C C U C , t are the capital costs, given by the remuneration and amortization of investment in assets associated with the activity of waste treatment resulting from undifferentiated collection, O C U C , t are the operating costs directly associated with the waste treatment activity resulting from undifferentiated collection, A R U C , t are the additional revenues allocated to the waste treatment activity resulting from undifferentiated collection, B C A U C , t are the benefits of complementary activities to the waste treatment activity resulting from the undifferentiated collection, public service, or other. All terms in Equation (4) refer to year t and are in €.
The capital costs are calculated based on the sum of the remuneration of the regulated asset base, the amortization of the year, and the incentive to maintain assets at the end of their useful life. Operating costs incorporate the operating costs incurred and accepted associated with the activity of waste treatment resulting from undifferentiated collection.
Additional revenues are those that do not result from the gate-fee tariff but result from the main activities through the sale of products from each activity, such as the electricity resulting from the incineration of the waste resulting from the undifferentiated collection. The benefits of complementary activities are those that are not integrated into the main activity, but that use assets assigned to it, such as the reception and treatment of MSW from other waste management service management entities or private producers. The permitted income for the activity of waste treatment resulting from selective collection is given by Equation (5):
P I S C , t = C C S C , t + O C S C , t A R S C , t B C A S C , t ,
where C C S C , t are the capital costs, given by the remuneration and amortization of investment in assets associated with the activity of waste treatment resulting from selective collection, O C S C , t are the operating costs directly associated with the waste treatment activity resulting from the selective collection, A R S C , t are the additional revenues allocated to the waste treatment activity resulting from the selective collection, B C A S C , t are the benefits of complementary activities to the waste treatment activity resulting from the selective collection, public service, or other. All terms in Equation (5) refer to year t and are in €.
The permitted income for the activity of waste treatment resulting from selective treatment is given by Equation (6):
P I S T , t = C C S T , t + O C S T , t A R S T , t B C A S T , t ,
where C C S T , t are the capital costs, given by the remuneration and amortization of investment in assets associated with the activity of waste treatment resulting from selective treatment, O C S T , t are the operating costs directly associated with the waste treatment activity resulting from selective treatment, A R S T , t are the additional revenues allocated to the waste treatment activity resulting from selective treatment, B C A S T , t are the benefits of complementary activities to the waste treatment activity resulting from the selective treatment, public service, or other. All terms in Equation (6) refer to year t and are in €.
The additional revenues allocated to the waste treatment activity resulting from the undifferentiated collection, contained in (4), are composed of five components as detailed in Equation (7):
A R U C , t = E S R t + S S S R t + S A S R t + N P F M S R t + N F N P M S R t ,
where E S R t is the electricity sales revenue, S S S R t is the revenue from the sale of slag steel, S A S R t is the revenue from the sale of aluminum slag, N P F M S R t is the revenue from the sale of non-packaged ferrous materials, and N F N P M S R t is the revenue from the sale of non-ferrous non-packaging materials. All terms in Equation (7) refer to year t and are in €.
The electricity sales revenue is composed of two components, as detailed in Equation (8).
E S R t = E L S R t + E I S R t ,
where E L S R t is the revenue from the sale of electricity from the landfill, and E I S R t is the electricity sales revenue from the WtE plant, all referring to year t and in €. From Equations (2)–(4), (7) and (8) it can be seen that the higher the electricity sales revenue from the WtE plant, the lower the total permitted income and, thus, the lower the gate-fee that users pay.

4. Methodology

To answer the main research question of the present study it was identified the potential impact that results from the new remuneration scheme set for the WtE activity by the Portuguese Government, as in the 2020 legislation previously described in Section 3.2. Figure 4 identifies the impacts for the municipal waste treatment entity (1), the waste recovery and treatment costs (2), and the day-ahead electricity market (3).
The impact on the electricity market (3) was considered not relevant as the volume of electricity sold by the WtE is insignificant when compared to the overall market trade. This can be, however, addressed in a later research work. The focus on the waste activity has therefore two directions: the impact of the new remuneration scheme on the waste treatment entity (question 1) and the waste recovery and treatment costs, expressed as the gate-fee (question 2).
To address these two questions, the regulatory model for the waste activity presented in Section 3.2.2, was analyzed and modeled. For the application of the model to the questions of interest it was considered the hypothesis that waste quantities remain constant in the simulated scenarios as in the historical reference case of the Tariff Regulation of the Urban Waste Management Service set by ERSAR in the former regulatory period of 3 years.
The expressions presented in Section 3.2.2 were detailed to show the revenue from the sale of electricity, coming from the WtE plant, E I S R t , how it impacts the additional revenues allocated to the waste treatment activity resulting from undifferentiated collection, and, consequently, how it impacts the permitted income for the activity of waste treatment resulting from undifferentiated collection and the total permitted income of the waste management service. For the purpose of this case study, the gate-fee is calculated considering E I S R t , keeping all other components constant. E I S R t is calculated by the product between a constant volume of electricity to be generated by the WtE plant, which was estimated by ERSAR for the year 2019, and a wide range of selling prices of that electricity, obtained in the scope of participation in the wholesale market. For this case study, the formula used to calculate E I S R t is as follows:
E I S R t = G e n 2019 × P t ,
where G e n 2019 is the estimated electricity generated by the WtE plant in 2019 in MWh and P t is the selling price of electricity in year t in €/MWh. Other revenues than E I S R t , resulting from the undifferentiated collection, O R U C , t , in year t and €, are composed of the other terms in (7) and (8), and are given by (10):
O R U C , t = E L S R t + S S S R t + S A S R t + N P F M S R t + N F N P M S R t ,
To better understand the results, the total permitted income excluding electricity sales revenue, T P I E I S R , t , in year t and in €, will also be computed through (11):
T P I E I S R , t = T P I t + E I S R t ,
It must be noted that any additional revenues are subtracted from the permitted income as shown in (4). Thus, to obtain the total permitted income excluding electricity sales revenue, the electricity sales revenue, computed by (9), are added to the total permitted income, as computed by (3).
Figure 5 illustrates the methodology used to compute the gate-fee in several electricity price scenarios which impact the E I S R t .
The impact of the electricity price on the waste gate-fee is evaluated for five specific scenarios of electricity market prices based on the average annual electricity price in the period between January 2019 and July 2022. Each scenario is compared with the reference scenario of the regulated electricity price, established in the previous regulated remuneration model, as in 2019.
More specifically, the five scenarios are characterized as follows:
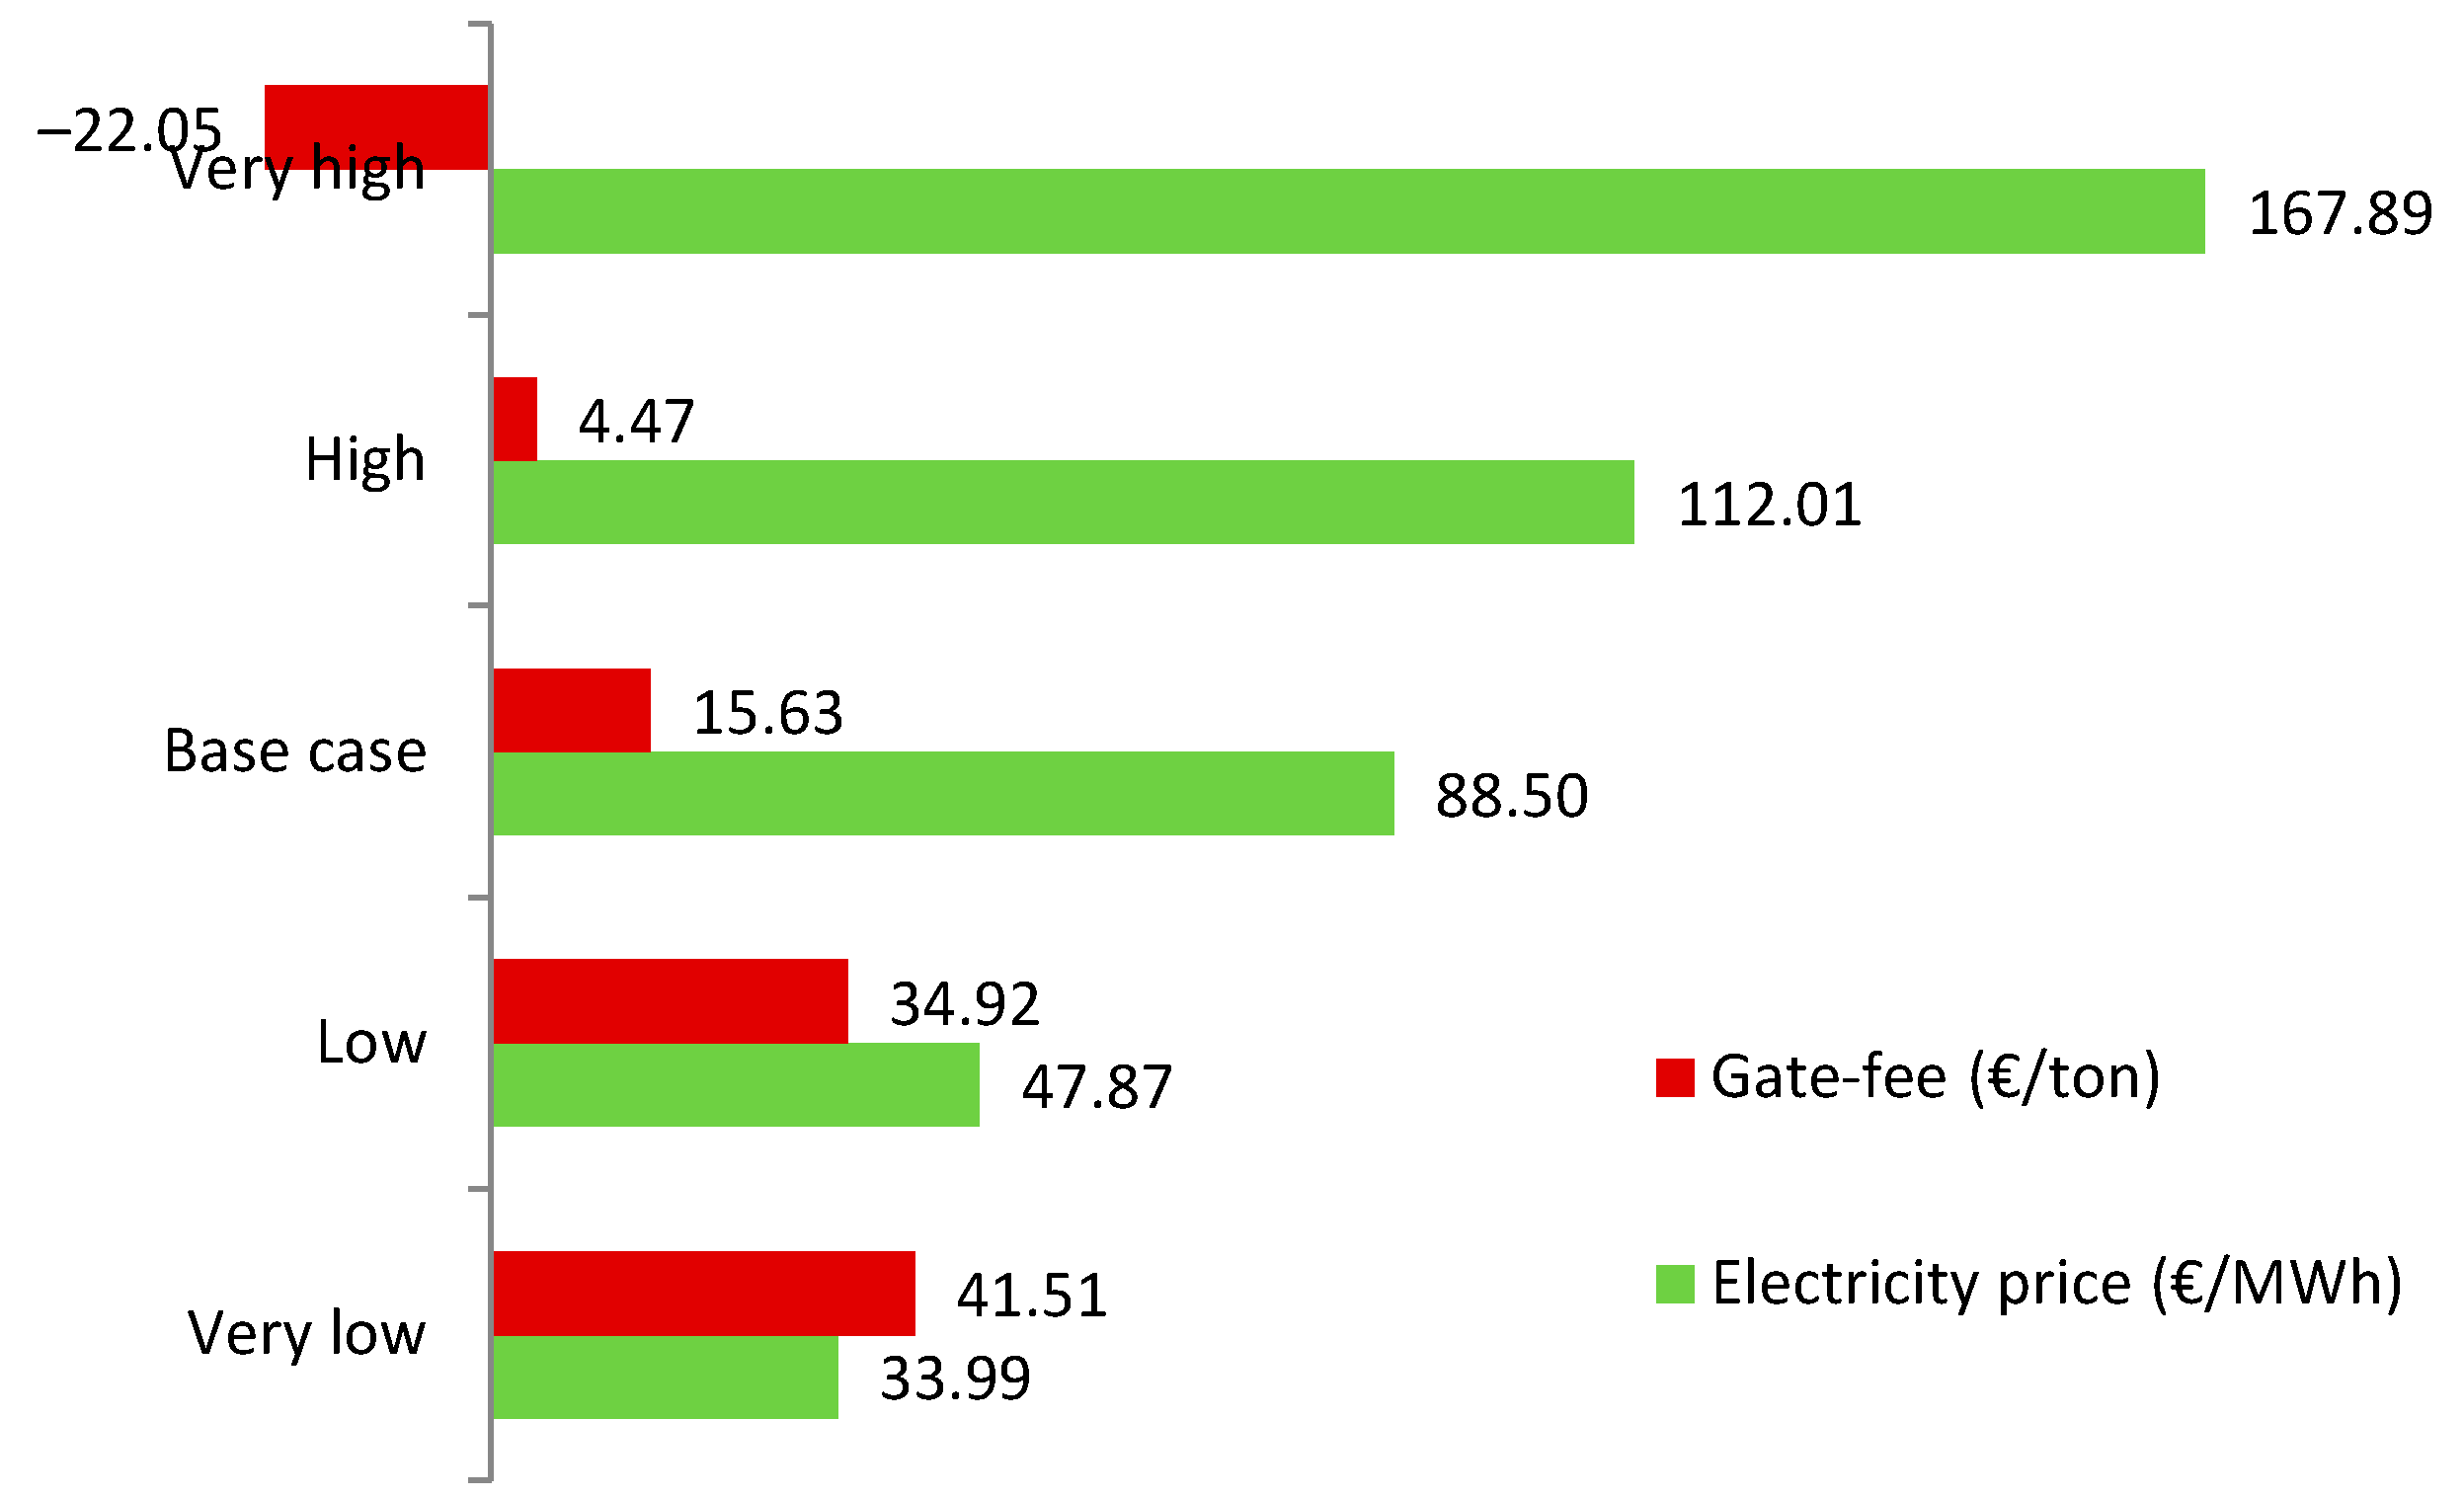
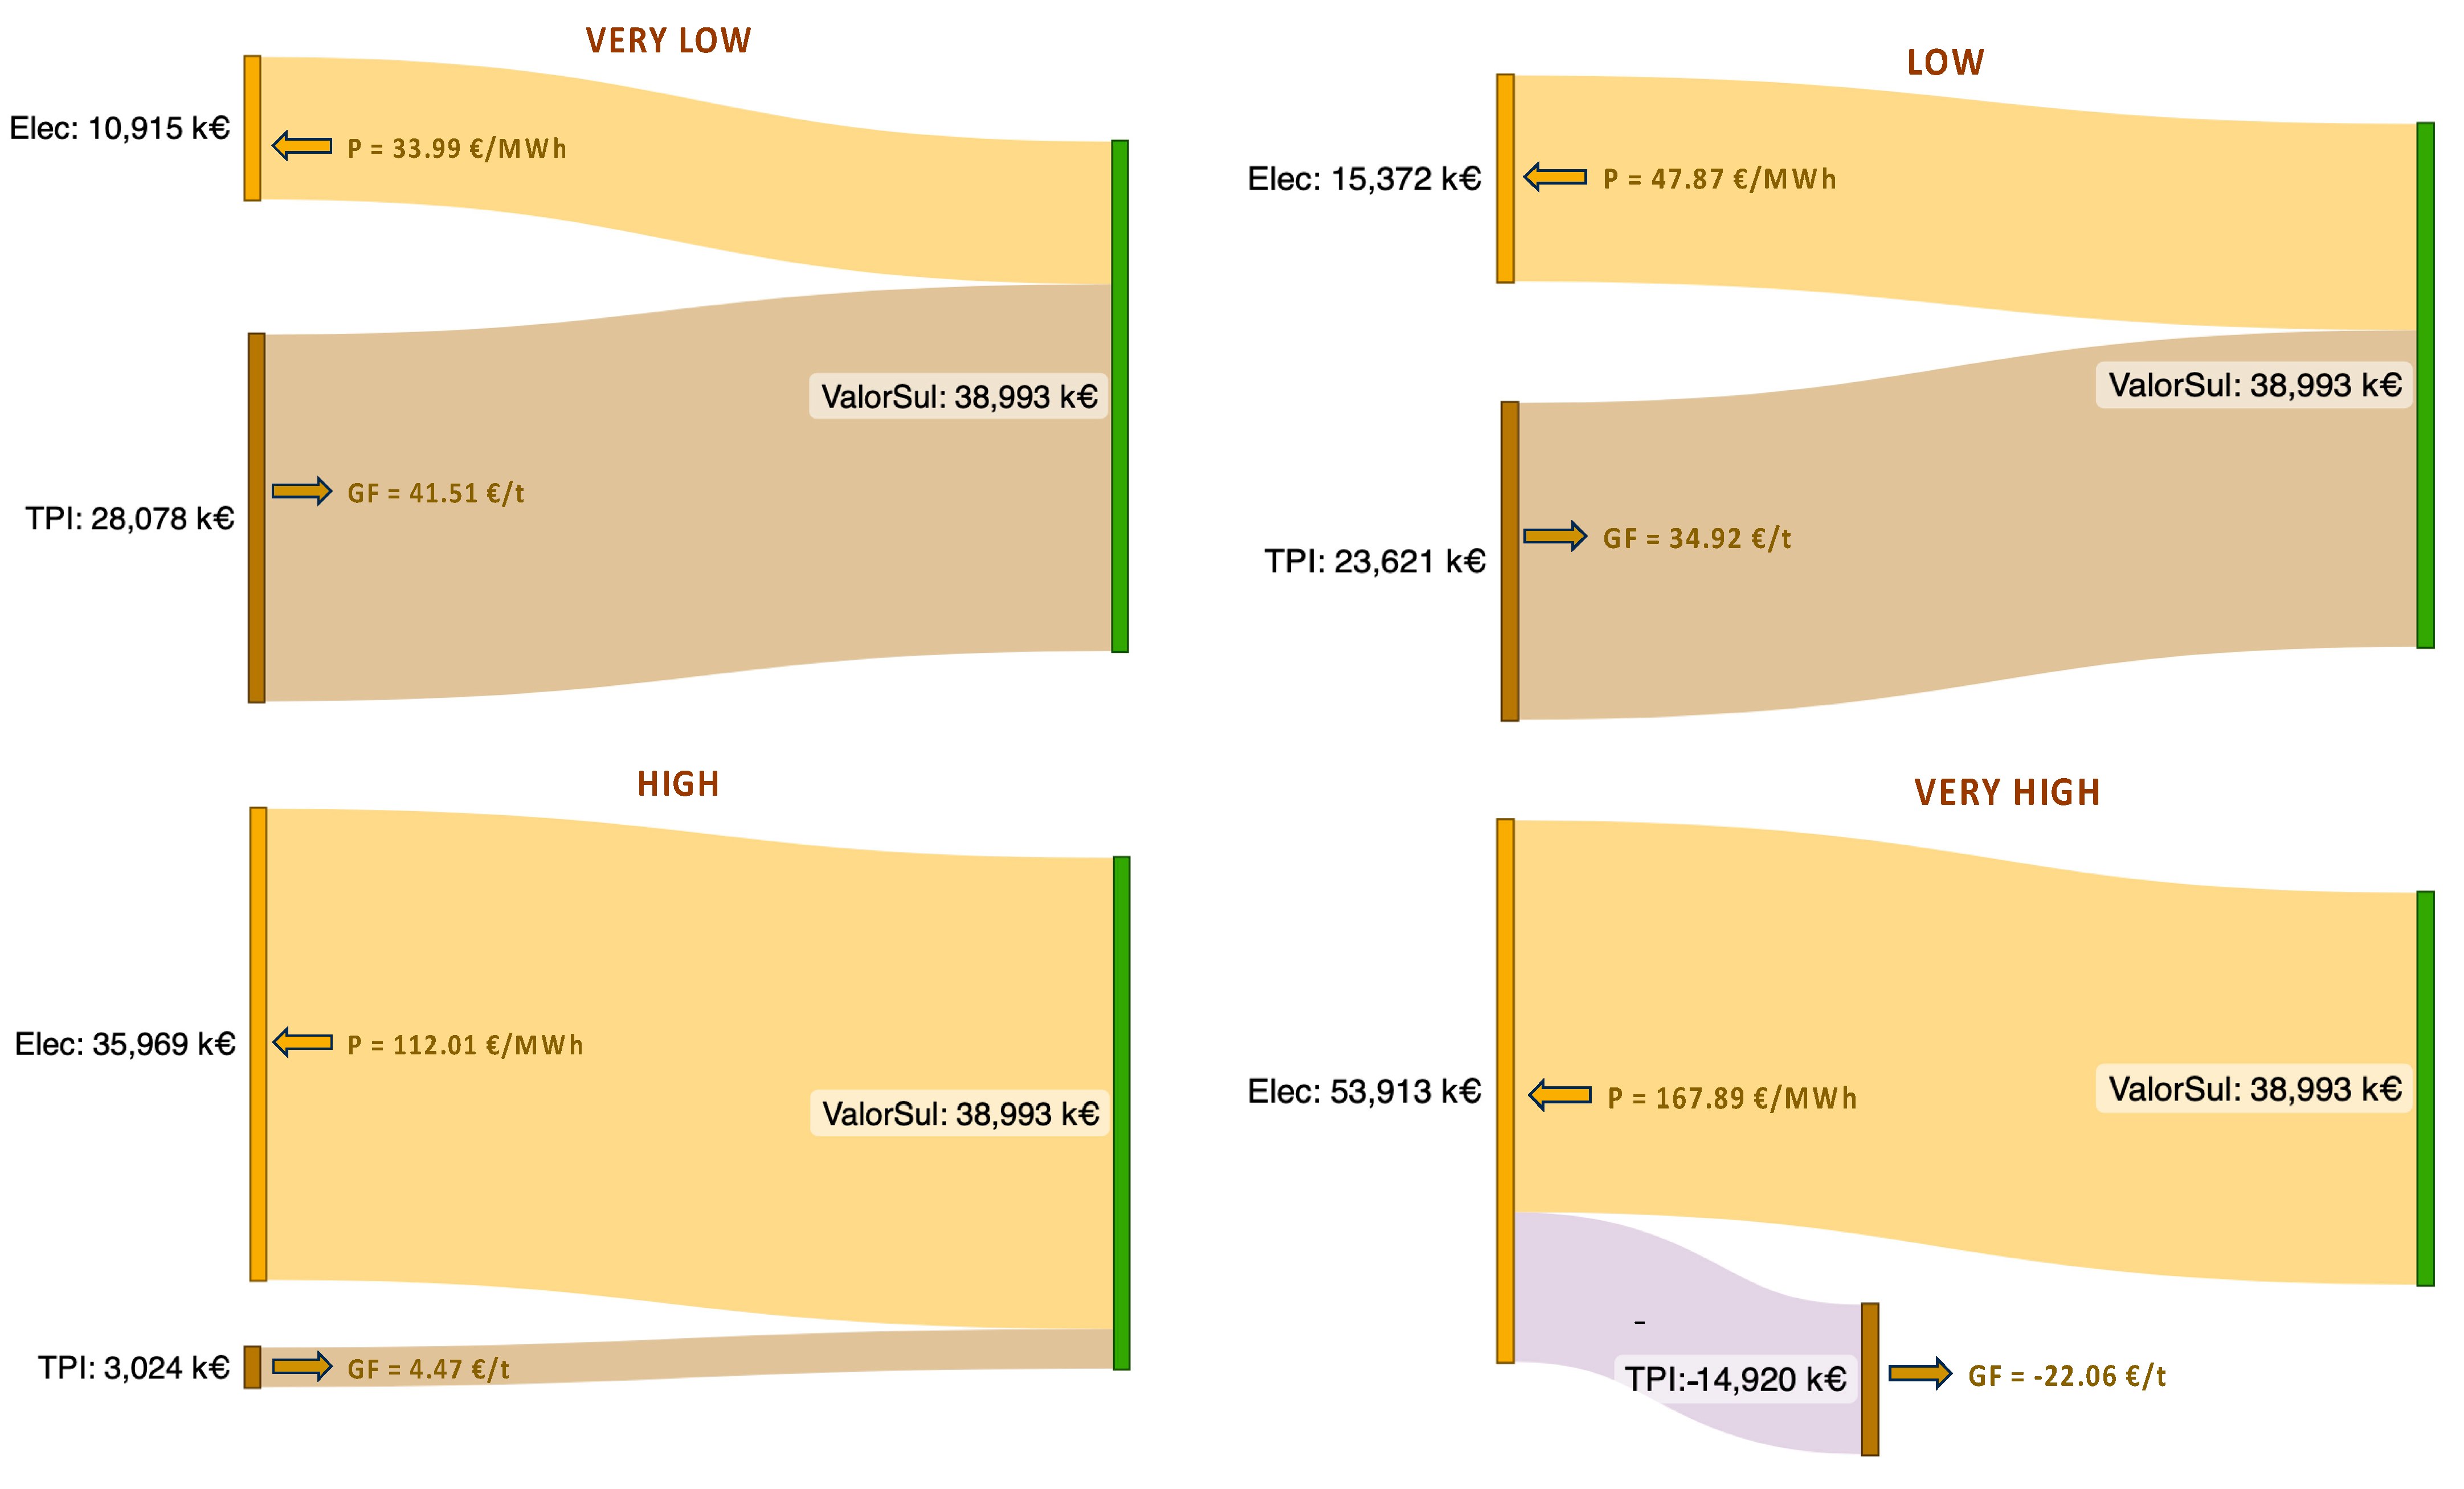
  • Base case scenario: The regulated electricity price considered by ERSAR in the calculation for 2019, of 88.5 €/MWh, which corresponds to the previous remuneration model.
  • Very Low Scenario: The average electricity market price in 2020, of 33.99 €/MWh. This is the lowest electricity price in the period 2019–2022.
  • Low Scenario: The average electricity market price in 2019, of 47.87 €/MWh. This is the second-lowest electricity price in the period 2019–2022.
  • High Scenario: Average electricity market price in 2021, of 112.01 €/MWh. This is the second-highest electricity price in the period 2019–2022.
  • Very High Scenario: Average electricity market price in 2022, of 167.89 €/MWh. This is the highest electricity price in the period 2019–2022.

5. Results

The underlying inputs for the results presented in this section are based on the regulatory rules set by ERSAR regarding the permitted income and the gate-fee to be paid to Valorsul for the period 2019–2021, obtained using the methodology presented in the previous section.
According to the methodology presented, the permitted income for treatment of waste resulting from undifferentiated collection (UC), is calculated in accordance with (4). The permitted income for the other two urban waste treatment activities, selective collection (SC) and selective treatment (ST), are treated as given since the electricity sales from the WtE process only affects the permitted income of waste treatment from UC. Subsequently, according to (3), the total permitted income is calculated for the whole urban waste management system. Finally, with the application of (2), the gate-fee is obtained.
Table 1 presents the results for the base case scenario with detailed data concerning each element of the model and the resulting gate-fee (line 30).
Results presented in Table 1 are computed using the expressions presented in the previous sections. The gate-fee (table line 30) is the result of (2), that is, the total permitted income over the amount of the undifferentiated waste. In turn, the total permitted income is computed by (3), obtained from table lines 20 to 26. In particular, the permitted income resulting from the undifferentiated collection, given by (4), includes the electricity sales revenues of Valorsul’s WtE plant from the additional revenues allocated to the waste treatment activity resulting from the undifferentiated collection ( A R U C , t ). The additional revenues from the treatment of waste resulting from undifferentiated collection are given by (7), which includes the electricity sales revenues ( E S R t ), among other revenues, and are presented in line 3.
The total electricity production of 321.12 GWh corresponds to the 2019 annual production of Valorsul’s WtE plant. The electricity price of 88.5 €/MWh is the average price paid by the regulated feed-in tariff, obtained from the 2019 annual remuneration, given by (1), over the total electricity produced by the WtE plant in 2019. Consequently, the total electricity revenues obtained were 28,419 k€, which is one of the terms of (8), E I S R t . The other term in (8), E L S R t , which corresponds to the revenues from the sale of electricity from the landfill, are included in other revenues (line 7).
Figure 6 presents the electricity price and the corresponding gate-fee for each of the scenarios considered in this analysis, highlighting the impact of the electricity market prices on the gate-fee.
The results show the negative trade-off between the electricity price and the gate-fee for each of the scenarios considered. High-price scenarios for electricity lead to a reduction of the gate-fee, which can become negative, as is observed for the very high-price scenario. On the other hand, decreasing electricity price scenarios bring gate-fee to higher values, which becomes 2.7 higher than in the base case scenario for the very low electricity price scenario (gate-fee increases from 15.63 €/ton to 41.51 €/ton).
A complementary analysis is carried out to emphasize the relationship between the gate-fee and the electricity price. Figure 7 presents the electricity revenues (Elec) and total permitted income (TPI) from the WtE plant for the electricity prices under analysis.
Figure 7 shows the negative trade-off between the electricity market price and the total permitted income of Valorsul, which then translates into the gate-fee to be paid by the municipalities to Valorsul. It also can be seen that the total revenues of Valorsul remains unchanged for the range of electricity prices and accounts for 38,993 k€. This means that the electricity price does not affect the revenues from Valorsul’s WtE plant as additional revenues from selling electricity will be deducted from the remaining permitted income. Moreover, this is the value to be covered by the gate-fee paid by municipalities if there were no revenues from the electricity (e.g., for an electricity price of 0 €/MWh). For increasing electricity prices, the electricity sales revenue also increases (“Elec” in Figure 7) and the total permitted income (“TPI” in Figure 7) that has to be covered by the gate-fee is reduced. For higher electricity prices (“Very High” scenario), the electricity revenues increase in such a way that it exceeds the total permitted income excluding the electricity sales revenue. In this case, the total permitted income becomes negative and Valorsul must return the excess to the municipalities which would correspond to negative gate-fee charges of −22.06 €/t.
To better understand the relationship between the gate-fee paid by the municipalities and the electricity price, Figure 8 presents the gate-fee as a function of the electricity price applicable to value the sale of electricity generated by the WtE plant.
From the analysis of Figure 8, it can be observed that, if no electricity revenues are obtained, the gate-fee would be close to 60 €/ton (more precisely, 57.65 €/ton). However, for increasing electricity prices, the negative trade-off between the gate-fee and the electricity price is clear, with an increase of 1 €/MWh in the electricity price reflecting a decrease of 0.47 €/ton in the gate-fee. In particular, for an electricity price of 121.43 €/MWh, the gate-fee becomes zero, meaning that no payment would be due to Valorsul for the waste delivered by the municipalities, and for electricity prices above 121.43 €/MWh the gate-fee would be negative, meaning a reverse payment from Valorsul to the municipalities.

6. Discussion

The transformation of a linear into a circular economy is seen as an important contribution to the European Green Deal targets. The development of a circular economy policy forcibly considers waste treatment and recycling in which the production of electricity in WtE plants plays a major role. Although caution is needed to prevent the hindering of recycling due to possible deviations of waste from recycling to incineration, the accomplishment of EU targets concerning landfill disposal might be jeopardized if the required balance between revenues and costs of the MSW sector are not attained. Moreover, one of the main sources of additional revenues for some municipal waste treatment systems, such as Valorsul, is the selling of electricity produced by their WtE plant. The change in the remuneration scheme for the WtE set by the new Portuguese legislation of 2020 was studied in the present work. As the day-ahead market prices have greater variations than the feed-in tariff determined by Decree-Law 168/1999, the changes in the WtE remuneration scheme established by Ordinance 244/2020 may have a great influence on the permitted income and, consequently on the gate-fee to be paid by municipalities. In situations where the market price is high, this impact can be positive for municipalities, leading to a low gate-fee. However, when the market price is low, resulting in low additional revenues for the WtE, this may lead to a considerable increase in the gate-fee, which might configure a wealth transfer from waste producers to electricity consumers, since the latter will cease to pay in their electricity tariff in the form of a feed-in tariff, the amount owed to WtE’s by the production of electricity.
One of the objectives proposed in the 2030 national waste management plan is to “Promote the self-sufficiency, competitiveness, and sustainability of the waste sector”, considering that it is essential to ensure revenue, namely with the recovery of waste resulting from the treatment of waste that is reintroduced into the economy, as is the case of electricity [14].
In this context, PERSU 2030 recognizes that the production of electricity from MSW is assumed to be extremely relevant in the scope of municipal waste treatment systems management, given the impact it has on the recovery of waste, as well as on the generation of revenue and, therefore, this way, in the value of the gate-fee with the citizen. In addition, the financial weight of electricity produced from waste is not significant in the context of Special Regime Electricity Production and the same is true of the respective cost over the market price, but the environmental contributions are significant [13].
In accordance with the European guidelines on energy recovery from waste and the sustainable financing taxonomy regulation associated with the European Ecological Pact 23, there is no provision for Community funding to increase energy recovery capacity by incinerating waste [13].
The current guidelines do not call into question the necessary maintenance of national capacities for energy recovery by incineration, and their efficiency can be maximized through synergies with other industries and/or technologies (e.g., surplus heat and exhaust gas). Still, nothing prevents the purposes of forwarding the residual fraction to the sharing of facilities of this nature, or other similar technologies, as long as they comply with the criteria required by law [13].
In this context, the integration of WtE plants into the liberalized market for electricity sales without taking into account its particularities of operation and its purpose, namely with regard to the valuation of deviations from the production program foreseen for market agents operating in the electricity market, could lead to a decline in revenue from the sale of energy, with obvious effects on the gate-fee to be paid by the municipalities.
The impact of the electricity prices on the waste gate-fee has been analyzed using the most recent information on costs and revenues for Valorsul, yet limited to the last regulatory period (2019–2021).
On a broader time scale, there are other aspects that will have a decisive impact on the gate-fee, and related costs, paid by the municipalities, namely the relevant future costs related to the necessary boost in selective collection for recycling to fulfill EU commitments. According to PERSU 2030, the effective recycling rate of Portugal (based on the Eurostat accounting method to apply after 2026) was 13% in 2019 and must reach 60% by 2030. This necessary boost will require very high Capex in the next few years and Opex expenditures thereafter which will have a very important impact on the gate-fee.
However, as shown in this work, scenarios of high electricity prices will, at least, help to mitigate the increase in the gate-fee and the cost of waste management.

7. Conclusions

To study the impact of the new Portuguese electricity remuneration scheme on waste-to-energy activity, the present work models the regulatory framework and simulates different scenarios of electricity market price to compare with the base case scenario of the former regulatory model based on a feed-in tariff.
The results obtained show that the remuneration from the electricity generated by WtE has a strong impact on the cost of waste, with a negative trade-off between the price of electricity and the gate-fee. In particular, it was found that 1 €/MWh of decrease in the electricity price has an impact of 0.47 €/ton increase on the gate-fee. It was also found that the gate-fee will be zero for an electricity price of 121 €/MWh. On the other hand, the gate-fee would be 58 €/ton when the revenues from the electricity generated by the WtE plant are zero.
For a set of studied scenarios, based on historical electricity market prices, it was computed that for an electricity price of 34 €/MWh, as observed in 2020, the value of the gate-fee would rise from 23 €/ton, as in the base case, to 42 €/ton. On the other hand, for an electricity price in line with the average of 2022 of 168 €/MWh, the gate-fee would be negative by 22 €/ton.
It can be concluded that, given the new regulatory framework in force in Portugal, the revenues from the electricity generation by Valorsul have a decisive impact on the gate-fee to be paid by waste users. Also, the analysis performed supports the conclusion that changes in the electricity remuneration of the WtE are offset by an equivalent change in the gate-fee, being the process neutral for the Valorsul accounts. This transfer of welfare between electricity consumers and waste users leads to a cross-subsidy problem in which lower revenues from the electricity generation activity of the WtE will negatively impact the gate-fee prices paid by the waste users.
From the above, the new regulatory model, by making the remuneration of the electricity produced by the WtE plant dependent on electricity market conditions, will bring higher uncertainty to the electricity revenues of Valorsul’s WtE plant and, consequently, to the gate-fee paid by the municipalities. By considering different electricity prices for the electricity produced by the WtE plant, the present study tries to anticipate the consequences of the gate-fee of such regulatory changes.

Author Contributions

Conceptualization, M.S., J.L. and J.S.; methodology, F.M.-H., J.S. and M.S.; validation, M.S., C.V., F.B. and J.L.; writing—original draft preparation, M.S., J.L., J.S., C.V. and F.M.-H.; writing—review and editing, M.S., J.L., J.S., C.V., F.M.-H. and F.B.; All authors have read and agreed to the published version of the manuscript.

Funding

This research received no external funding.

Data Availability Statement

Not applicable.

Conflicts of Interest

The authors declare no conflict of interest.

References

  1. European Commission. ‘Fit for 55’: Delivering the EU’s 2030 Climate Target on the Way to Climate Neutrality (Communication from the Commission to the European Parliament, the Council, the European Economic and Social Committee and the Committee of the Regions No. 550); European Commission: Brussels, Belgium, 2021. [Google Scholar]
  2. European Commission. A New Circular Economy Action Plan. For a Cleaner and More Competitive Europe (Communication from the Commission to the European Parliament, the Council, the European Economic and Social Committee and the Committee of the Regions No. 98); European Commission: Brussels, Belgium, 2020. [Google Scholar]
  3. European Commission. Directive 2008/98/EC of the European Parliament and of the Council of 19 November 2008 on Waste and Repealing Certain Directives; European Commission: Brussels, Belgium, 2008. [Google Scholar]
  4. European Commission. Directive 2018/851/EC of the European Parliament and of the Council of 30 May 2018 Amending Directive 2008/98/EC on Waste; European Commission: Brussels, Belgium, 2018. [Google Scholar]
  5. European Commission. Directive 2018/850/EC of the European Parliament and of the Council of 30 May 2018 Amending Directive 1999/31/EC on the Landfill of Waste; European Commission: Brussels, Belgium, 2018. [Google Scholar]
  6. Chioatto, E.; Sospiro, P. Transition from waste management to circular economy: The European Union roadmap. Environ. Dev. Sustain. 2023, 25, 249–276. [Google Scholar] [CrossRef]
  7. Presidência de Conselho de Ministros. Cabinet Council Resolution No. 53/2020 of 10 July 2020. Plano Nacional Energia e Clima 2030 (PNEC 2030); Presidência de Conselho de Ministros: Lisbon, Portugal, 2020. [Google Scholar]
  8. Ministério do Ambiente. Decree-Law No. 239/97, of 9 September 1997; Ministério do Ambiente: Lisbon, Portugal, 1997. [Google Scholar]
  9. Ministério do Ambiente, do Ordenamento do Território e do Desenvolvimento Regional. Ordinance No. 187/2007 of 12 February 2007; Ministério do Ambiente, do Ordenamento do Território e do Desenvolvimento Regional: Lisbon, Portugal, 2007. [Google Scholar]
  10. Ministério do Ambiente, Ordenamento do Território e Energia. Ordinance No. 187-A/2014 of 17 September 2014; Ministério do Ambiente, Ordenamento do Território e Energia: Lisbon, Portugal, 2014. [Google Scholar]
  11. Ministério do Ambiente e Transição Energética. Ordinance No. 241-B/2019, of 31 July 2020; Ministério do Ambiente e Transição Energética: Lisbon, Portugal, 2020. [Google Scholar]
  12. Presidência de Conselho de Ministros. Cabinet Council Resolution No. 11-C/2015 of 16 March 2015. Plano Nacional de Gestão de Resíduos (PNGR); Presidência de Conselho de Ministros: Lisbon, Portugal, 2015. [Google Scholar]
  13. Agência Portuguesa do Ambiente. Plano Estratégico para os Resíduos Urbanos. 2030. Available online: https://participa.pt/pt/consulta/persu-2030 (accessed on 15 February 2023).
  14. Presidência do Conselho de Ministros. Cabinet Council Resolution No. 31/2023; Presidência do Conselho de Ministros: Lisbon, Portugal, 2023. [Google Scholar]
  15. Presidência de Conselho de Ministros. Cabinet Council Resolution No. 30/2023; Presidência do Conselho de Ministros: Lisbon, Portugal, 2023. [Google Scholar]
  16. European Commission. The Role of Waste-to-Energy in the Circular Economy. (Communication from the Commission to the European Parliament, the Council, the European Economic and Social Committee and the Committee of the Regions No. 34); European Commission: Brussels, Belgium, 2017. [Google Scholar]
  17. Ministério do Ambiente e Ação Climática. Ordinance No. 244/2020 of 15 October 2020; Ministério do Ambiente e Ação Climática: Lisbon, Portugal, 2017. [Google Scholar]
  18. Valorsul, Relatório e Contas. 2019. Available online: http://www.valorsul.pt/pt/seccao/a-valorsul/planos-e-relatorios/ (accessed on 15 February 2023).
  19. ERSAR, Entidade Reguladora dos Serviços de Águas e Resíduos. Decisão Sobre os Proveitos Permitidos e Tarifas Reguladas para o Período Regulatório 2019–2021. Available online: https://www.ersar.pt/pt/o-que-fazemos/decisoes-e-pareceres/fixacao-de-tarifas (accessed on 15 February 2023).
  20. Brunner, P.H.; Rechberger, H. Waste to energy—Key element for sustainable waste management. Waste Manag. 2014, 37, 3–12. [Google Scholar] [CrossRef] [PubMed]
  21. US Department of Energy. Waste-to-Energy from Municipal Solid Wastes. Available online: https://www.energy.gov/eere/bioenergy/articles/waste-energy-municipal-solid-wastes-report (accessed on 15 February 2023).
  22. Scarlat, N.; Fahl, F.; Dallemand, J.F. Status and Opportunities for Energy Recovery from Municipal Solid Waste in Europe. Waste Biomass Valori 2019, 10, 2425–2444. [Google Scholar] [CrossRef]
  23. World Energy Council. World Energy Resources: Waste to Energy. 2016. Available online: https://www.worldenergy.org/assets/images/imported/2016/10/World-Energy-Resources-Full-report-2016.10.03.pdf (accessed on 15 January 2023).
  24. Hicks, M.; Rawlinson, S. Cost Model: Energy from Waste. Building Magazine. Available online: https://www.building.co.uk/cost-model-energy-from-waste/3162156.article (accessed on 11 December 2022).
  25. Paul, T.; Soren, N. An overview of municipal solid waste-to-energy application in Indian scenario. Environ. Dev. Sustain. 2018, 22, 575–592. [Google Scholar] [CrossRef]
  26. Zhang, X.; Liu, C.; Chen, Y.; Zheng, G.; Chen, Y. Source separation, transportation, pretreatment, and valorization of municipal solid waste: A critical review. Environ. Dev. Sustain. 2021, 24, 11471–11513. [Google Scholar] [CrossRef] [PubMed]
  27. CEWEP, Confederation of European Waste-to-Energy Plants. Landfill Taxes and Restrictions—Overview. Available online: https://www.cewep.eu/wp-content/uploads/2021/10/Landfill-taxes-and-restrictions-overview.pdf (accessed on 15 February 2023).
  28. Zhang, D.; Huang, G.; Xu, Y.; Gong, Q. Waste-to-Energy in China: Key Challenges and Opportunities. Energies 2015, 8, 14182–14196. [Google Scholar] [CrossRef]
  29. Aziz, S.A.; Astrini, N.; Rianawati, E.; Halog, A.; Al Irsyad, M.I. Challenges in Adopting Successful Waste-to-Energy Policies in EU Countries: Indonesia study case. In Proceedings of the 2022 IEEE Electrical Power and Energy Conference (EPEC), Victoria, BC, Canada, 5–7 December 2022; pp. 278–283. [Google Scholar]
  30. Malav, L.C.; Yadav, K.K.; Gupta, N.; Kumar, S.; Sharma, G.K.; Krishnan, S.; Rezania, S.; Kamyab, H.; Pham, Q.B.; Yadav, S.; et al. A review on municipal solid waste as a renewable source for waste-to-energy project in India: Current practices, challenges, and future opportunities. J. Clean. Prod. 2020, 277, 123227. [Google Scholar] [CrossRef]
  31. Mukherjee, C.; Denney, J.; Mbonimpa, E.G.; Slagley, J.; Bhowmik, R. A review on municipal solid waste-to-energy trends in the USA. Renew. Sustain. Energy Rev. 2020, 119, 109512. [Google Scholar] [CrossRef]
  32. Ramos, A.; Afonso Teixeira, C.; Rouboa, A. Environmental Analysis of Waste-to-Energy—A Portuguese Case Study. Energies 2018, 11, 548. [Google Scholar] [CrossRef]
  33. Entidade Reguladora dos Serviços de Águas e Resíduos. Revisão do Regulamento Tarifário do Serviço de Gestão de Resíduos Urbanos. Available online: https://www.ersar.pt/pt/site-o-que-fazemos/site-consultas-publicas/documents/rtr.pdf (accessed on 15 February 2023).
  34. Ministério da Economia e Inovação. Decree-Law No. 225/2007, of 31 May 2007; Ministério da Economia e Inovação: Lisbon, Portugal, 2007. [Google Scholar]
Figure 1. Timeline of the European and Portuguese legislation related to MSW.
Energies 16 06624 g001
Figure 2. Shares of Valorsul’s revenues by activity [18].
Energies 16 06624 g002
Figure 3. Regulatory framework of the WtE concerning waste and electricity.
Energies 16 06624 g003
Figure 4. The main research question and the derivative focus of the application.
Energies 16 06624 g004
Figure 5. A diagram that illustrates the methodology used to study the impact of the new remuneration scheme on the WtE activity.
Energies 16 06624 g005
Figure 6. Changes in the gate-fee because of varying electricity market prices in the different scenarios.
Energies 16 06624 g006
Figure 7. Electricity revenues (Elec) and total permitted income (TPI) from the WtE plant for the electricity prices under analysis.
Energies 16 06624 g007
Figure 8. Gate-fee as a function of the electricity price.
Energies 16 06624 g008
Table 1. Gate-fee calculation procedure with application to the base case scenario.
Treatment of Waste Resulting from Undifferentiated Collection (UC)
1Capital costs (k€) C C U C , t 10,307
2Operating costs associated with the activity (k€) O C U C , t 20,412
3Additional revenues (k€) A R U C , t 31,784
4Electricity price (€/MWh) P t 88.5
5Electricity generated by the WtE (GWh) G e n 2019 321.12
6Total electricity revenues from WtE (k€) E I S R t 28,419
7Other revenues (k€) O R U C , t 3365
8Benefits of complementary activities (k€) B C A U C , t 1900
9Permitted Income UC (k€) P I U C , t −2965
Selective Collection (SC)
10Capital costs (k€) C C S C , t 738
11Operating costs associated with the activity (k€) O C S C , t 9800
12Additional revenues (k€) A R S C , t 0
13Benefits of complementary activities (k€) B C A S C , t 0
14Permitted Income SC (k€) P I S C , t 10,538
Treatment of Waste Resulting from Selective Collection (ST)
15Capital costs (k€) C C S T , t 1857
16Operating costs associated with the activity (k€) O C S T , t 8369
17Additional revenues (k€) A R S T , t 15,463
18Benefits of complementary activities (k€) B C A S T , t 0
19Permitted Income ST (k€) P I S T , t −5237
20Permitted Income UC (k€) P I U C , t -2965
21Permitted Income SC (k€) P I S C , t 10,538
22Permitted Income ST (k€) P I S T , t −5237
23Operating costs associated with the structure (k€) O C s t , t 1701
24Adjustments (k€) A d j t 2 2037
25Incentives (k€) I t t 2 0
26Use of regulatory balance (k€) R B t −4500
27Total permitted income (k€) T P I t 10,574
28Total permitted income excluding electricity revenues (k€) T P I E I S R , t 38,993
29Amount of undifferentiated waste (ton) T Q U W , t 676,438
30Gate-fee (€/ton) G F t 15.63
Disclaimer/Publisher’s Note: The statements, opinions and data contained in all publications are solely those of the individual author(s) and contributor(s) and not of MDPI and/or the editor(s). MDPI and/or the editor(s) disclaim responsibility for any injury to people or property resulting from any ideas, methods, instructions or products referred to in the content.

