Article

Massive Multi-Source Joint Outbound and Benefit Distribution Model Based on Cooperative Game

School of Electrical Engineering, Guizhou University, Guiyang 550025, China
*
Author to whom correspondence should be addressed.
Energies 2023, 16(18), 6590; https://doi.org/10.3390/en16186590
Submission received: 5 July 2023 / Revised: 10 August 2023 / Accepted: 18 August 2023 / Published: 13 September 2023
(This article belongs to the Topic Advances in Power Science and Technology)

Abstract

:
In light of the challenges posed by the widespread distribution of new energy sources in China and their distance from load centers, the power system must effectively integrate both new energy and thermal power transmission. To address this issue, we propose a dynamic coordinated scheduling model that combines wind, photovoltaic, and thermal power to optimize the profit of the energy complementary delivery system. Additionally, we present an improved ant lion optimization algorithm to investigate the coordinated scheduling and benefit distribution of these three power sources. This paper introduces a cooperative mode for benefit distribution and utilizes an enhanced Shapley value method to allocate the benefits of joint operation among the three parties. The distribution of benefits is based on the contribution of each party to the joint proceeds, considering the profit levels of joint outbound and independent outbound modes. Through our analysis, we demonstrate that the upgraded ant lion optimization algorithm facilitates finding the global optimal solution more effectively within the feasible zone. Furthermore, our suggested three-party combined scheduling model and profit-sharing approach are shown to be superior and feasible.

1. Introduction

Currently, there are evident challenges in the power system, including uneven load distribution, intricate path selection, and implementation complexities [1]. Consequently, the investigation of outbound dispatching operations necessitates the integration of various types of power supplies [2].
In Ref. [3], a static optimization method is proposed for configuring wind power transmission capacity, considering the convergence characteristics of wind farms of varying scales. Ref. [4] analyzes the fluctuation characteristics of a wind power transmission project in Jiu Quan and provides technical insights for planning and researching wind power base transmission projects. In Ref. [5], an equivalent power model for a photovoltaic power station is constructed, and a planning method for optimizing the configuration of its external tie line is proposed, taking into account the output convergence characteristics. To implement this novel approach, Ref. [6] efficiently and reliably transmits locally centralized grid-connected wind and solar power generation to the load center. The authors develop a wind–thermal capacity ratio calculation model, providing valuable insights for wind power transmission research. It is worth noting that most of the preceding literature focuses on capacity allocation for individual energy transmission, neglecting the combined integration of renewable energy sources [7,8,9].
Numerous scholars have dedicated their research efforts to the optimization of joint delivery scheduling involving wind power, thermal power, and other types of power supply, instead of considering wind power and photovoltaic power separately. Ref. [10] thoroughly examines the scheduling mechanism for the combined operation of wind power and hydropower, shedding light on the interdependent relationship between hydropower capacity and new energy sources. Furthermore, in the context of joint operation involving wind power, photovoltaic power, and hydropower, References [11,12] propose a comprehensive method for optimizing transmission capacity, taking into account factors such as power loss due to transmission restrictions, the potential adverse effects of bundled transmission on thermal power, and the construction costs of transmission and transformation projects. The above-mentioned literature primarily focuses on the integration of wind power and thermal power, as well as the technical and economic analyses of wind–thermal complementarity. Their collective aim is to address the challenges posed by multi-type energy joint large-scale delivery.
Ref. [13] introduces a control strategy designed to ensure system stability for wind–thermal bundled delivery coordination. In Ref. [14], a novel solar–wind–natural gas hybrid system is proposed, emphasizing synergistic complementarity to enhance the economics of new energy sources. Furthermore, Ref. [3] examines the present state of hydropower, wind power, and solar combined operation and identifies critical issues. To accommodate wind generation and PV grid hookup, thermal power units are required for frequent deep peaking and start–stop peaking [15], thereby freeing up grid space. Additionally, under the carbon emission trading mechanism, Ref. [16] develops a wind–solar–heat joint delivery scheduling optimization model. While the preceding literature thoroughly explores and proposes solutions for various aspects of multi-source systems, it nearly overlooks the willingness of thermal power units to participate as auxiliary peak shaving units in large-scale multi-source power joint delivery systems. The critical issue of profit distribution within these systems is scarcely addressed. As cooperative entities, thermal power units must adjust their start–stop status and output in real time to ensure the stable delivery of wind and photovoltaic units, inevitably affecting their own interests to some extent.
In cooperative games, players have the opportunity to form alliances, share earnings, and cooperate through side payments and payoffs [17]. For instance, the cooperative income points of power generation alliances involving wind–thermal systems [18], and the cooperative gain power allocation of wind–solar–hydro multi-agent energy systems [19] have been studied. In the realm of cooperation mode, References [20,21] explored the Owen value [22] and Shapley value [23] techniques to allocate profits based on cooperation, and they concluded that the replacement of power generation rights could serve as a viable cooperation mode for alliances comprising different scale generating units. Furthermore, Ref. [24] utilized the Shapley value allocation technique within a cooperative mode for comparison. Employing the Nash bargaining theory, [25] established a cooperative scheduling model for a wind–solar–hydrogen multi-energy system, aiming to achieve both individual benefits for members and overall benefits for the alliance. Additionally, Ref. [26] introduced regulations for on-grid electricity by bundling hydrogen energy storage on the wind power side, proposing a two-way electricity price compensation mechanism to encourage hydropower’s participation in wind power consumption, thereby fostering positive growth within the cooperative alliance. In the context of cost allocation, Ref. [27] meticulously studied, analyzed, and compared various cooperative game theory approaches, ultimately adopting the Shapley method for an effective cost distribution to achieve the best allocation. Furthermore, Ref. [28] employed traditional cooperative game theory to allocate cascade hydropower compensation benefits, leading to fair and equitable outcomes.
The Shapley value allocation technique, as a classic method in cooperative game theory, is renowned for its fairness and reasonability. It serves as a powerful motivator for alliance members to engage in cooperation, fostering positive growth in their individual operational benefits. However, the symmetry inherent in the Shapley value assumes that all alliance members are of the same nature and possess consistent standings within the alliance, disregarding the influence of preferences, discursive power, and market policies among the diverse members. Consequently, the original Shapley value necessitates improvements to address this limitation, wherein the alliance members’ weights are assigned differently. This leads to the development of an enhanced Shapley value allocation strategy known as the M-Shapley value method [29].
The Ant Lion Optimizer (ALO) is a novel meta-heuristic algorithm, conceptualized by Australian scholar Seyedali Mirjalili, drawing inspiration from the natural hunting behavior of ant lions [30]. Nevertheless, within the ALO algorithm’s iterative optimization process, the presence of ant lions with relatively low fitness levels poses a challenge. When ants traverse alongside ant lions, it could potentially diminish the search efficiency. Additionally, the ant’s random walk process, though facilitating exploration ability, may also hinder the full utilization of discovered optimal solutions, consequently impacting the optimization performance and convergence efficiency of the ALO algorithm to a certain extent. To address these issues, this paper proposes an enhanced ant lion optimization algorithm (MALO) to address the mathematical model at hand. By integrating the vortex convergence method into the modeling, the improved algorithm not only enhances the utilization capability compared to the original algorithm, but also adheres to the biological mechanism of an ant lion preying on ants. This synergistic improvement not only enables better utilization of resources, but also aligns more closely with the natural predator–prey relationship observed in ant lions.
The main contributions of this paper are outlined below:
(1)
An advanced three-party joint delivery operation model, integrating wind, photovoltaic, and thermal power, is established utilizing mixed-integer linear programming (MILP), and a novel improved ant lion algorithm is introduced to effectively solve this model;
(2)
To address the mathematical model presented in this paper, an enhanced ant lion optimization algorithm (MALO) is proposed. By incorporating the vortex convergence method into the modeling, the improved algorithm not only enhances the utilization ability compared to the original algorithm, but also aligns seamlessly with the biological mechanism of an ant lion preying on ants;
(3)
The incremental benefits derived from the joint operation of wind, photovoltaic, and thermal power are allocated using the M-Shapley value method, overcoming the limitations observed in the conventional Shapley value method. This leads to a more equitable and efficient benefit distribution strategy for the three-party joint operation.
The subsequent sections of this paper are structured as follows:
In Section 2, a comprehensive three-party joint delivery optimization operation model is established, employing the principles of MILP. Section 3 puts forward an enhanced ant lion optimization method dedicated to resolving the model developed in Section 2. To address the issue of incremental benefit distribution, Section 4 delves into the cooperative game theory and the M-Shapley value method. The numerical simulation results are presented and analyzed in Section 5, shedding light on their implications. Finally, Section 6 provides a concise summary encapsulating the key findings and conclusions of the entire discourse.

2. Joint Wind, Photovoltaic, and Thermal Power Delivery Model

2.1. Optimal Target Function

The rationale behind the alliance of wind, photovoltaic, and thermal power lies in the geographical distribution of wind energy resources in China, which are located far from the load centers. Additionally, the intermittent and volatile nature of renewable energy sources, such as wind and solar, poses potential risks to the stability of the vast power system. To address this challenge, the output of thermal power plants needs to be finely adjusted to complement and coordinate with the delivery of wind and photovoltaic energy, ensuring the overall power output remains relatively stable.
The joint delivery system’s optimization goal can be achieved through the optimization of three key factors. Firstly, taking advantage of the favorable on-grid electricity prices for new energy sources, wind power and solar firms can maximize the utilization of wind energy. Secondly, by fully utilizing the peak shaving benefits of thermal power in the partnership, the system’s overall efficiency can be enhanced. Thirdly, optimizing the scheduling combination of the alliance’s units can lead to a reduction in power generation costs. It is important to note that wind power incurs no variable cost as it does not rely on fuel consumption. However, optimizing the three aforementioned factors can present conflicting objectives. If the primary aim is to minimize wind and photovoltaic curtailment, new energy resources would be utilized more efficiently. However, the unpredictable and intermittent nature of wind power may result in larger power fluctuations on the transmission line. On the other hand, if the optimization goal is to minimize power fluctuation on the transmission line or minimize coal consumption in thermal power units, it may contradict the original intention of establishing a clean energy joint delivery system.
To ensure the long-term and coordinated development of the alliance, a comprehensive approach incorporating the three criteria is adopted. The optimization model for the wind–thermal joint energy delivery system is built on the premise of satisfying the power fluctuation requirements of the transmission line while ultimately maximizing the benefits for the alliance.
The objective function for optimization is as follows:
max F
F = π c p c + π w p w + π s p s c c c w c s
where F is the total profit of the combined system; π c is the on-grid price of thermal power in the sending end area; π w   and π s are the benchmark price of wind power and solar power in the sending end area, respectively; p c , p w , and p s are the on-grid electricity of thermal power, wind power, and photovoltaic power generation, respectively; c c , c w ,   and c s are the total power generation costs of thermal power units, wind farms, and solar electric fields, respectively.
The power generation cost of each power plant consists of two components: the real-time power generation cost and the fixed cost. The real-time cost is determined by the fuel consumption necessary for power generation, while the fixed cost encompasses operation and maintenance expenses as well as depreciation costs. Hence, the following components are involved:
c c = c c v + c c f
c w = c w v + c w f
c s = c s v + c s f
where c c v and c c f   are the real-time output cost and fixed cost of thermal power units, respectively; c w v and c w f are the real-time output costs of wind farms and solar electric fields, respectively, which can be set to zero because they do not consume traditional energy; c s v and c s f are the fixed costs of wind farm and solar electric field, respectively. Due to their high construction costs, they can be converted into constants according to the design operating years.
c c v is expressed as:
c c v = λ c t = 1 T i = 1 N [ u i t f i ( P i t c ) + u i t ( 1 u i ( t 1 ) ) S U i ]
f i P i t c = a i + b i P i t c + c i P i t c 2
where λ c is the price of coal; u i t   is a 0–1 variable, indicating the start–stop state of the unit—1 is the operating state and 0 is the shutdown state; S U i is the starting consumption of the unit; a i , b i , and c i are the fuel cost coefficients of unit output of thermal power units; P i t c is the real-time output of the i -th unit in t period; f i ( P i t c ) is the total coal consumption of unit i in t period.

2.2. Constraint Condition

To guarantee the secure and stable electricity supply, it is imperative to impose constraints on the technical parameters of the energy complementary system.

2.2.1. Maximum Transmission Power Constraint

P t t r P max t r
i N P i t c 1 μ i c + P t r e w 1 μ w + P t r e s 1 μ s = P t t r
where P t t r   is the amount of electricity transmitted from the transmission line during the t period; P t w and P t s are the actual output of wind farm and photovoltaic electric field int t period, respectively; P max t r   is the maximum transmission capacity of the transmission line; μ i c , μ w , μ s , and μ s are the auxiliary power consumption rates of thermal power plants, wind farms, and solar electric fields, respectively.

2.2.2. Transmission Power Stability Constraint

To avert significant fluctuations in the transmission power of the energy complementary system and mitigate potential risks to the receiving end power system’s stability, strict constraints are imposed on the variation range of the transmission power.
Δ P P t t r P t 1 t r Δ P +
where Δ P and Δ P + are the upper and lower limits of the fluctuation amplitude of transmission power, respectively, which are determined by the reserve capacity of the power system in the receiving area. The constraint requirement on transmission power fluctuations is inversely proportional to the magnitude of the peak regulation margin within the receiving area power grid. A larger peak regulation margin results in a lower constraint requirement for transmission power fluctuations, while a smaller peak regulation margin necessitates a higher constraint on transmission power fluctuations.

2.2.3. Thermal Power Unit Output Constraint

Equation (11) is the upper and lower limits of real-time output power of thermal power units. Equation (12) is the climbing constraint of the unit.
u i t P i c min P i t c u i t P i c max
η i c P i t c P i t 1 c P i c min
where P i c max and P i c min are the maximum and minimum output power of thermal power unit i , respectively. P i c min and η i c are the response speed limits of power increase and decrease in coal–thermal units, respectively.

2.2.4. Start–Stop Time Constraint of Thermal Power Unit

The time constraints for start-stop operations of thermal power units are mathematically represented by Equations (17) and (18):
T i , t 1 on   T M , i on   u i , t 1 u i , t 0
T i , t 1 off   T M , i off   u i , t u i , t 1 0
where Formula (13) is the minimum start-up time constraint of unit i , T i , t 1 on   is the running time of unit i at time t −1. T M , i on   A is the shortest running time of unit i . Equation (14) is the minimum downtime constraint of unit i , T i , t 1 off   is the downtime of unit i at time i −1. T M , i off   is the minimum downtime of unit i .

2.2.5. Wind Farm and Solar Electric Field Output Constraints

Equations (15) and (16) are utilized to delineate the association betwixt the real potency of renewable energy and the forsaken wind and solar energy, as well as the projected potency.
P t r e w + P t a b w = P t p r w
P t r e s + P t a b s = P t p r s
where P t r e w and P t a b w are the actual output and wind curtailment power of the wind farm in t period, respectively, P t r e s and P t a b s are the actual output and abandoned photovoltaic power of the solar electric field in period t , respectively. P t p r w and P t p r s are the predicted output of wind farm and solar electric field, respectively.

2.2.6. Generation Reserve Constraint

By employing Equation (17), one can obtain the constraint conditions for power generation reserve.
i = 1 I P i c m a x γ c i I P i , t c 1 μ i c + γ w P t re w 1 μ w + γ s P t re s 1 μ s
where γ c , γ w , and γ s are the reserve coefficients of thermal power and wind power, respectively.
The dynamic optimization scheduling model for a large-scale multi-source joint distribution system has been presented in this study. Building upon this foundation, it is possible to develop a profit maximization scheduling model for independent delivery of wind power, as well as a coordinated scheduling model for wind power, thermal power, and photovoltaic power, through appropriate adjustments to the objective function and constraint conditions.

3. Improved ALO Algorithms

3.1. The Original Ant Lion Optimization Algorithm

The ant lion belongs to the ant lion family and undergoes two distinct stages in its life cycle: the larvae and the adult stages.
In the context of optimization algorithms, the ant lion algorithm mimics the hunting behavior of ant lion larvae in nature. As depicted in Figure 1, the ant lion creates a cone-shaped trap using its massive jaws before initiating the predation process. It positions itself at the bottom of the trap, patiently awaiting the arrival of ants and other small insects [31]. Once the prey falls into the trap, the ant lion skillfully throws sand at the edge of the pit, burying the trapped ants and subsequently preying on them. After consuming the prey, the ant lion disposes of the remaining remnants of the ants outside the pit, and then proceeds to modify the pit for future hunting endeavors.
There are six steps to use ALO to solve the optimization problem:
The ant population moves in a random manner following the guidelines specified by Equation (18). However, to guarantee that the ants traverse the feasible region in a randomized fashion, certain adjustments are applied based on Equation (20):
X ( t ) = [ 0 , c u m s u m ( 2 r ( t 1 ) 1 , , c u m s u m ( 2 r ( t k ) 1 ) ]
where X ( t ) is the step set of ant random movement. k is the number of steps that move randomly. The mathematical expression of r is:
r = 1 , r a n d > 0.5 0 , r a n d 0.5
where r a n d is a random number between [0, 1].
X i t = X i t a i × d i t c i t b i a i + c i
where a i and b i represent the maximum and maximum values of the random movement of the i-dimensional variable, respectively; c i and d i represent the minimum and maximum values of the i-dimensional variable in the t generation, respectively.
As the ant moves in a random manner, it becomes subject to the influence of the trap set by the ant lion. This interaction is mathematically expressed as follows:
c t = A l j t + c t
d t = A l j t + d t
where c t and d t represent the minimum and maximum values of all variables at the t -th iteration, respectively. c j t and d j t represent the minimum and maximum values of the j -th ant in the t -th iteration, respectively. A l j t is the position of the j -th ant lion in the t -th iteration.
If an ant falls into the trap, the ant lion will promptly respond by hurling sand towards the trap’s edge, effectively hindering the ant from escaping. As a consequence, the ant’s activity range progressively diminishes over time. This phenomenon can be mathematically represented as follows:
c t = c t I
d t = d t I
I = 1 , t 0.1 T 10 ω t T , t > 0.1 T
where I is the proportional coefficient, T is the maximum number of iterations, ω is a constant representing the number of iterations that increase with the number of iterations.
Each ant can only be captured by a single ant lion, and the specific ant lion to capture an ant is determined using the Roulette Wheel approach. Ant lions that are more fit have a higher likelihood of capturing ants. To make this determination, the individual fitness of each ant lion is compared to the individual fitness of the ant. If the individual fitness of the ant surpasses that of the ant lion, the ant lion preys on the ant, and its position is then replaced with the position of the ant. This process concludes with the update of the ant lion’s position. The mathematical formula representing this process is as follows:
A l j t = A n t i t , i f : f A n t i t > f A l j t
where A n t i t is the position of the i -th ant at the t -th iteration. f A n t i t is the fitness of the i -th ant, f A l j t is the fitness of the j -th ant lion. In the single objective optimization problem, only the individual with the best fitness function is selected.
The elite strategy of the ant lion involves the calculation of the fitness for each individual ant lion. The ant lion that exhibits the highest fitness value emerges as the elite ant lion. This winning ant lion is designated as the elite member of the population. The mathematical expression representing this process is as follows:
f A l e l i t e t = min f A l 1 t , f A l 2 t f A l m t
where f A l e l i t e t is the fitness of the elite ant lion.
The update of the ant population is performed to preserve the global diversity of ants after each iteration. This update is carried out based on the mathematical expression (28).
A n t i t = A l elite t + A l select t 2
where A l elite t is the elite ant lion position at the t -th iteration. A l select t is the ant lion position selected at the t -th iteration. The average value of the two is the ant individual in the new generation of ant population.

3.2. Ant Lion Algorithm Enhancement

3.2.1. Improve the Roulette Selection Values

The ALO method utilizes roulette selection to randomly choose ant lions for random wandering, aiming to enhance the diversity of the ant population. However, this approach may inadvertently select ant lions with low fitness, leading to a potential reduction in the algorithm’s overall optimization efficiency. To address this issue, a constraint mechanism is imposed on the roulette fitness selection value to ensure that the selection process adheres to specific limitations. The constraint mechanism is as follows:
f A l j t 1 N i = 1 N f A l j t
If A l j t is less than the ant lion’s average fitness value, it participates in roulette selection; otherwise, it does not.

3.2.2. Vortex Convergence

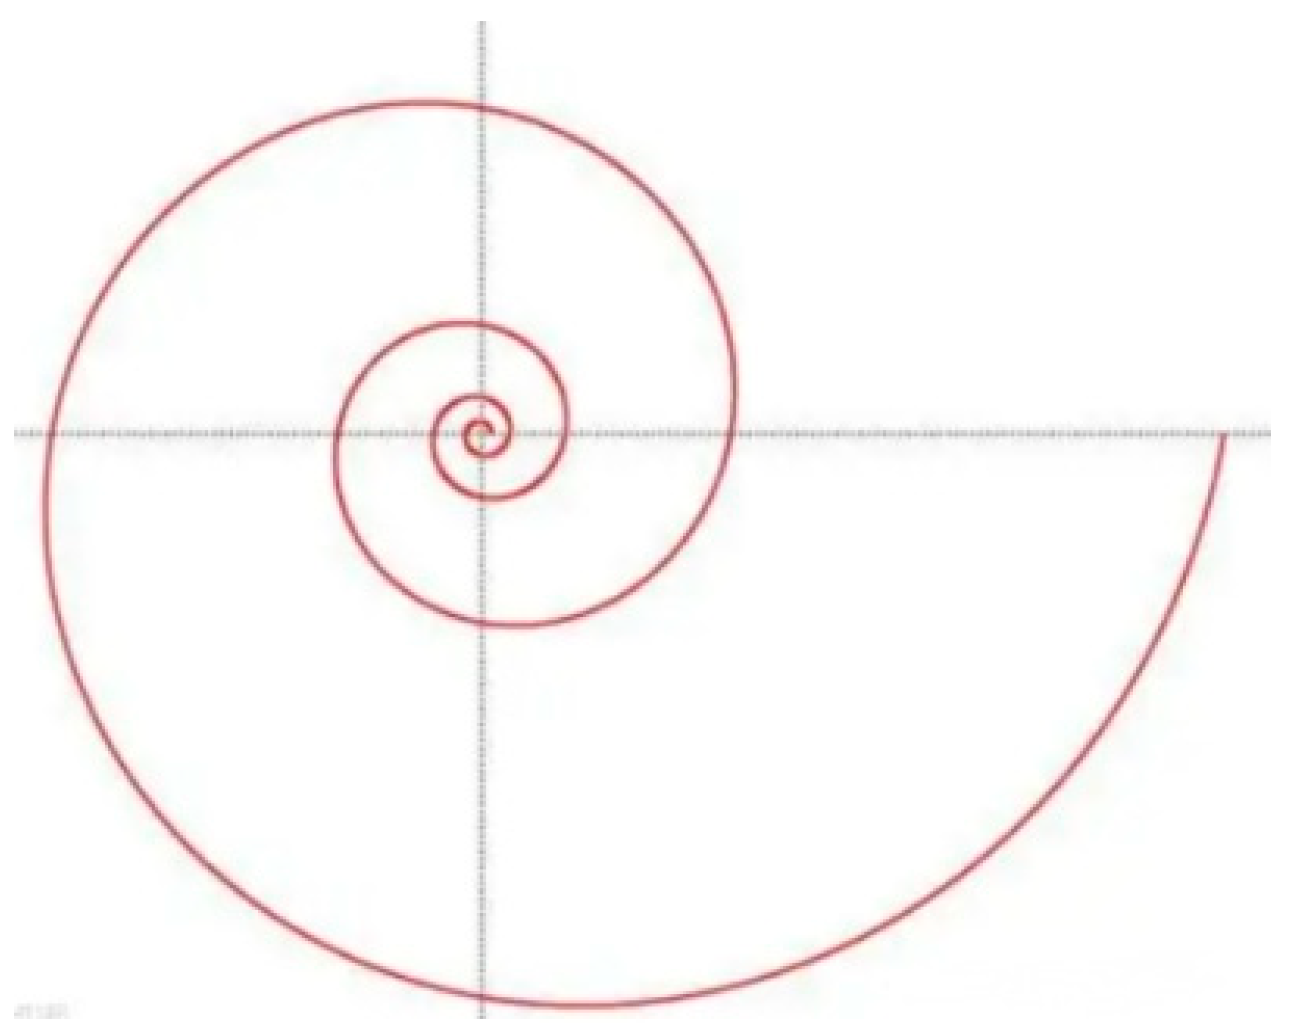
The random walk exhibits significant divergence, ensuring the algorithm’s search capability, yet it fails to fully exploit the optimal solution. Moreover, the original program inadequately simulates the process of an ant lion collecting ants, merely updating the ant lion’s position based on Formula (26). To enhance the algorithm’s utilization capacity and more accurately emulate the scenario when ants are trapped in the ant lion’s trap, the improved algorithm induces the ants to spiral towards the ant lion positioned at the trap’s center. This behavior is simulated using the logarithmic spiral [32] (Figure 2), and the ants’ positions are updated through the following formula:
A n t i j t + 1 = E A l j t + D i j t A e t cos ( 2 π t )
t = 2 t T r a n d + 1
where E A l j t is the j-dimensional position of the ant lion capturing ants of the t -th generation. D i j t = A n t i j t E A l j t is the distance on dimension j between the ant i and the ant lion that captured it. A is a constant that determines the spiral’s shape, it is 0.5 in this paper.
This enhancement offers two significant advantages. Firstly, it more accurately replicates the biological behavior of an ant lion preying on ants, thus enhancing the algorithm’s biological plausibility. Secondly, the process of ants spiraling into the ant lion trap enhances the algorithm’s utilization capacity, achieving a balance between search exploration and efficient utilization in the ant lion algorithm.

3.3. Improved Antlion Algorithm Steps

In summary, the steps for the improved Ant Lion algorithm are outlined as follows:
(1)
Input the original data and various constraints, determine the size and dimension of ants and ant lions, randomly initialize the positions of ants and ant lions within the feasible region, and calculate their respective fitness values;
(2)
Select the ant lion with the highest fitness level in the ant lion population as the elite ant lion;
(3)
Conduct random walks for the chosen ant lion, optimizing the Roulette Wheel approach and the current optimal ant lion, and then update the position of the ant using Formula (30);
(4)
Calculate and compare the fitness of the ants after the position update with the fitness of the ant lion. If it is lower than the ant lion’s fitness, the ant lion is replaced, and the finest fitness ant lion within the ant lion population becomes the new elite ant lion. The new step update formula generates a new population, calculates the fitness values, directly compares them to the fitness of the elite ant lion, and selects the value with the best fitness as the elite ant lion;
(5)
Determine if the maximum number of iterations has been reached; if so, conclude the iteration; otherwise, continue with Step (3).
These steps have been enhanced to better imitate the ant lion’s hunting behavior and strike a balance between exploration and utilization, resulting in a more efficient and effective Ant Lion algorithm.

4. Cooperative Game and Profit Distribution Model

4.1. Cooperation Game Model

Cooperative game theory is an effective mathematical modeling technique used to address the problem of benefit distribution arising from the collaborative efforts of multiple stakeholders [33,34]. When multiple stakeholders’ actions collectively determine the outcome of a situation and their coordinated behavior leads to greater advantages, it is considered cooperation. The fundamental challenge in cooperative game research is to establish a method of allocating benefits that promotes cooperation among all stakeholders. Notably, fairly distributing the benefits of the alliance to each member is a crucial issue. Dissatisfaction with the distribution can hinder alliance formation and potentially lead to the failure of the alliance, even if it is initially established. Therefore, a key assumption in N-person cooperation is to engage in advance discussions to determine the structure of the alliance and the mechanism for distributing benefits resulting from cooperation [35]. N = { 1 , n } is the player set and 2 N is the power set of N , i.e., each and every subset S of N is regarded as a coalition and assigned a real value via the characteristic function v . Note that normally, there holds v ( ϕ ) = 0 which is referred to as normalization in cooperative game theory. Obviously, any payoff allocation x = ( x 1 , , x n ) should normally meet two requirements: [36]
x i v ( { i } ) ( i = 1 , 2 , , n )
i = 1 n x i = v ( N )
where x i denotes the share of the i -th member of the alliance. The Formula (32) is known as the individual rationality condition, stating that the income of each member must be greater than that of a single member. Similarly, Formula (33) is called efficiency.

4.2. Shapley Profit Distribution Model

The Shapley Value [23] is the most widely used point-valued solution concept for cooperative game problems. One key benefit of utilizing the Shapley value is its ability to allocate benefits based on the marginal contribution rate of alliance members. In other words, member i ’s share of the benefits is equal to the average of the marginal benefits they bring through their participation in the alliance. Suppose the cooperative game system is comprised of n members, with the set N= {1, 2, 3, … n } serving as an indicator. The Shapley value x ( v ) of a game v G N is the average of the marginal vectors of the game. The specific expression can be formulated as follows [23]:
x i ( v ) = S : i S | S | ! n 1 | S | ! n ! v S { i } v S
| S | ! ( n 1 | S | ) ! n ! = 1 n n 1 | S | 1
where for each i N , the i -th coordinate x i ( v ) of x ( v ) is the expected payoff of player i according to this random procedure. S is a subset of N not containing i . Create a subset S with i S in the following way. To begin, randomly select a number from the urn containing potential sizes ranging from 0 to ( n −1), where each number (i.e., size) has probability 1 n to be drawn. If size s is chosen, draw a set out of the urn consisting of subsets of N\{ i } of size s, where each set has the same probability n 1 s 1 to be drawn. If S is drawn, then one gives player i the amount v S { i } v S . Subsequently, it becomes evident that considering Equation (35), the expected payoff for player i within this stochastic procedure corresponds to the Shapley value assigned to player i in the game v G N .

4.3. M-Shapley Profit Distribution Model

According to the Shapley value, all alliance members are considered to have the same nature, and their status within the alliance remains constant, without considering the influence of individual preferences, willingness to participate, and market policies among different members. However, to account for such factors and enhance the original Shapley value, a modified Shapley value allocation approach has been proposed [29]. In this modified approach, various weights are assigned to alliance members. Let us assume that the weight assigned by the alliance members is denoted as follows:
M i = M 1 , M 2 , , M n
Furthermore:
i = 1 n M i = 1
Since the default members of the Shapley value strategy have the same affecting factors, that is, M ¯ = 1 / n , the distinction is:
Δ M i = M i 1 n
Furthermore:
i = 1 n Δ M i = 0
When the difference value indicates the correction factor while taking into account the real influencing factors, the correction amount of member benefit distribution is:
Δ x i ( v ) = v ( N ) × Δ M i
The updated M-Shapley value is as follows:
x i ( v ) = x i ( v ) + Δ x i ( v )

5. Example Analysis

5.1. Simulation Setup

The total installed capacity of the wind farm participating in energy delivery at the sending end area is considered to be 3300 MW. Table 1 presents the comparable usage efficiency of the wind farm at each phase of a typical day. The photovoltaic electric field is equipped with an equivalent usage efficiency of [19], with an auxiliary power consumption rate of 2%, and incurs a fixed cost of 8 million yuan. Additionally, there are six thermal power units serving as supplementary power sources, and their parameters can be found in Ref. [18]. The power receiving area is expected to provide a specific amount of peak regulation reserve for the transmission system, while the technical constraints of the transmission line are as follows: P max t r = 200   MW , Δ P + = 100   WM , Δ P = 100   WM . In the sending end area, the on-grid price of wind power is 570 yuan/(MWh), the on-grid price of photovoltaic electricity is 950 yuan/(MW h), the on-grid price of thermal power is 320 yuan/(MWh), and the coal price is 600/t. The modified ant lion algorithm includes 100 ant populations and 100 ant lion populations, with the maximum number of iterations set to 200.

5.2. Power Transmission Simulation Results

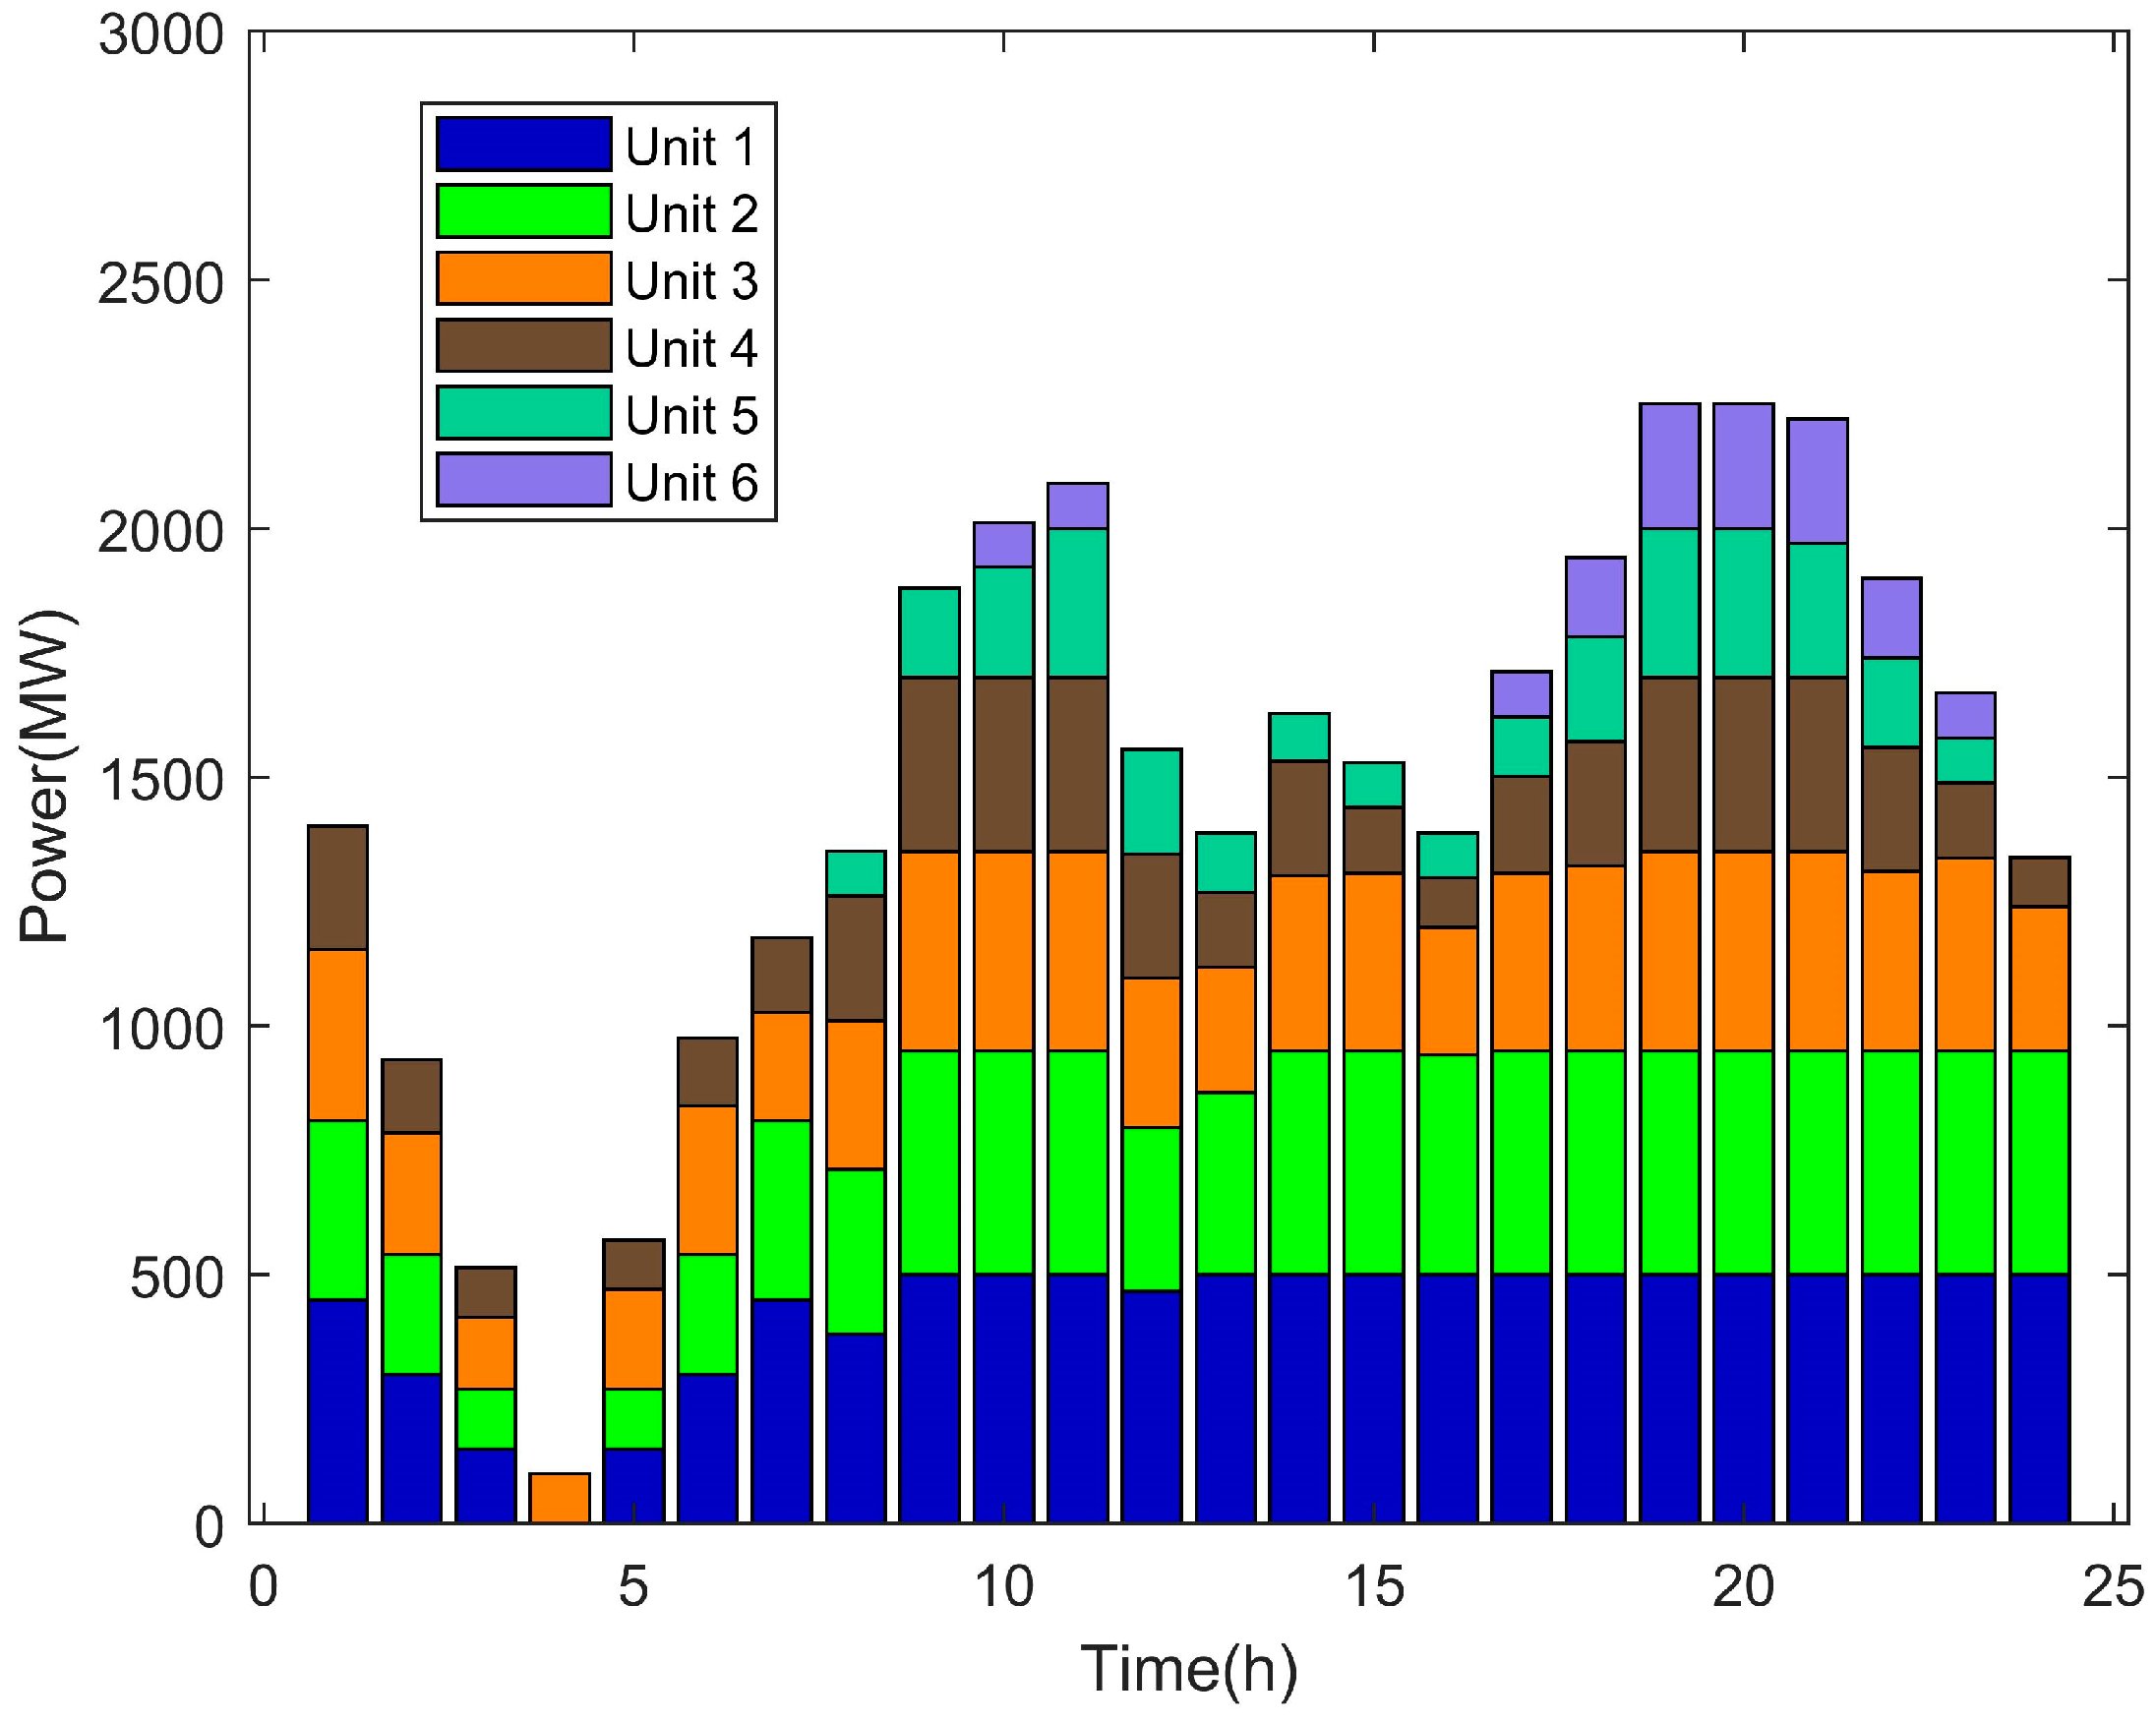
Figure 3 illustrates the real-time output scheduling results of each thermal power unit under the three-party joint delivery mode. It is evident that, to maintain the economic efficiency of the joint delivery system, the No.5 and No.6 units, characterized by lower capacity and higher coal consumption levels, play a more significant role in providing the overall system’s peak shaving reserve.
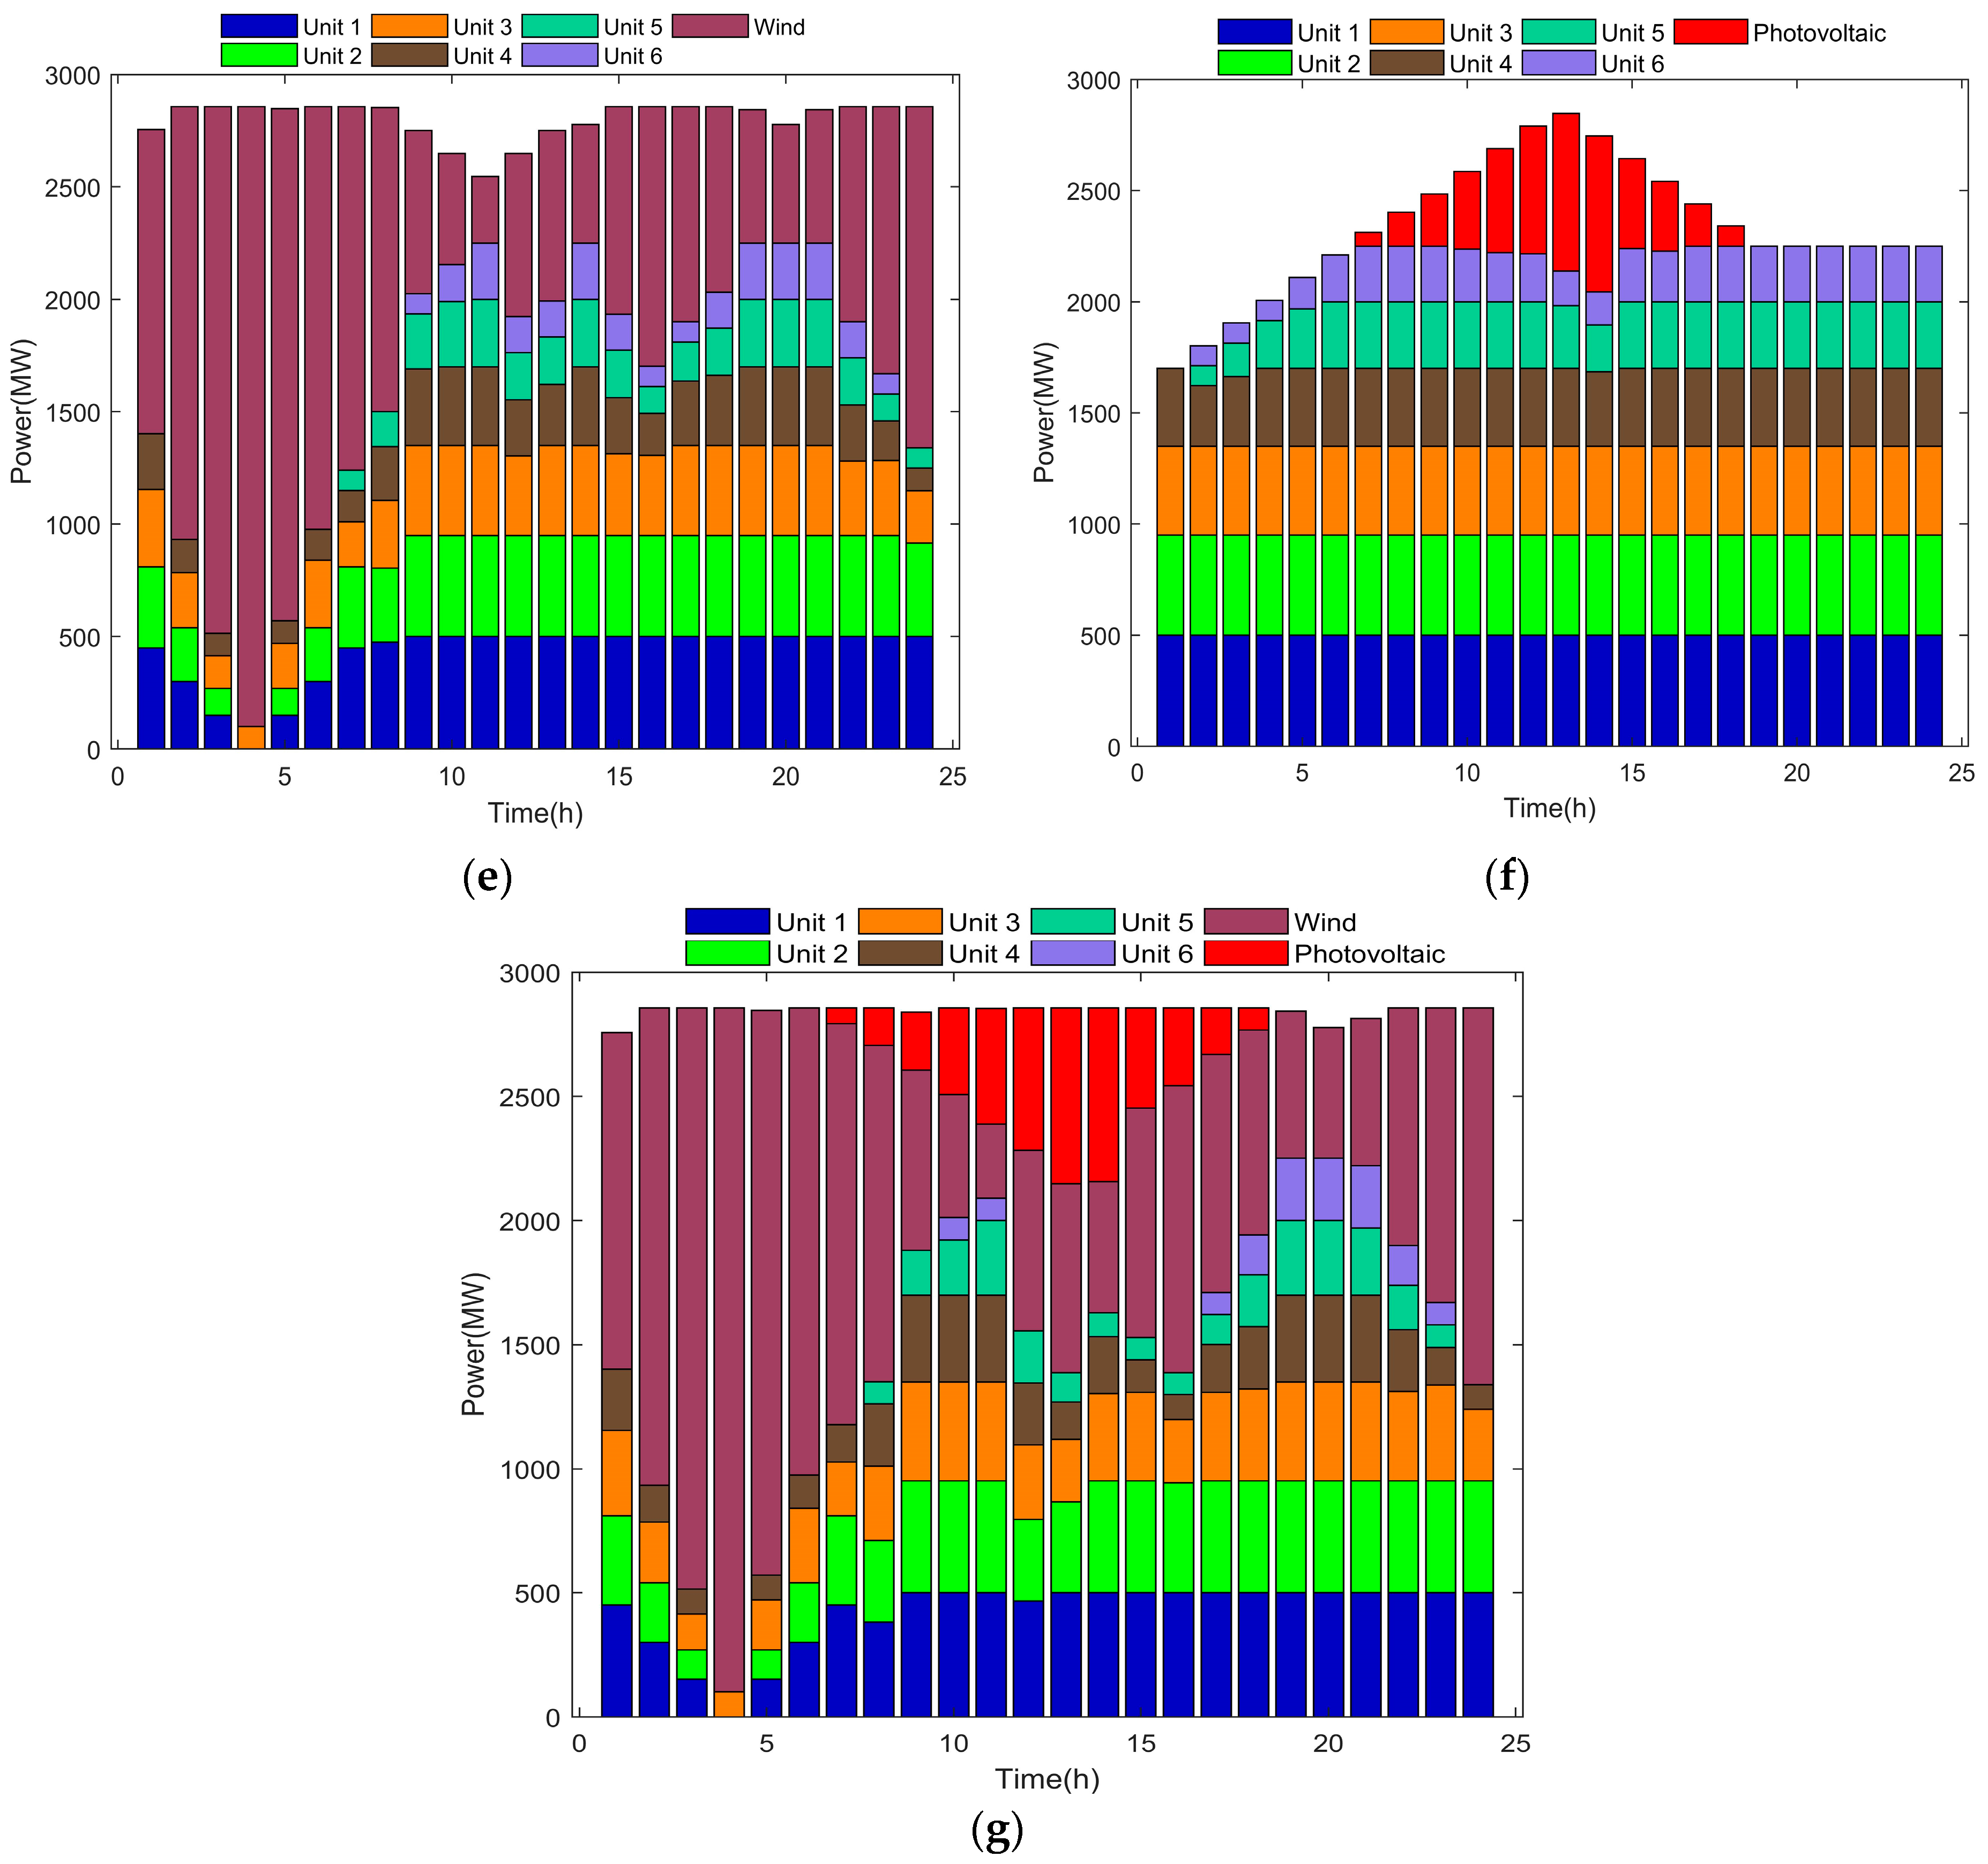
Figure 4 depicts the power fluctuation of transmission lines under various transmission modes.
The aforementioned operational results reveal significant variations in the total transmission power of the system between the independent transmission mode of wind power and photovoltaic power and the combined transmission mode of wind power and photovoltaic power, especially when the thermal power unit is not included in the combined transmission system. While independent delivery of thermal power units ensures stable delivered power, it contradicts the environmental trend of energy conservation and emission reduction, and the higher coal consumption cost diminishes the system’s economic profit. Conversely, joint delivery operations involving the thermal power unit, such as the three-party joint delivery mode, the thermal–thermal joint mode, and the thermal–photovoltaic joint mode, result in relatively low power fluctuation and ensure the stability of the delivery system.
In Table 2, the wind and photovoltaic abandonment rates are presented for different operation modes. Notably, in the combined operation mode of wind, solar, and thermal power, wind power abandonment is only 1.6%, while solar electric field abandonment is 0%. This three-party cooperative delivery system, including thermal power units, significantly enhances the utilization rate of wind and solar energy, as evidenced by the lower rates of abandoned wind and photovoltaic energy compared to their respective rates in the independent operation mode of wind farms and solar electric fields.
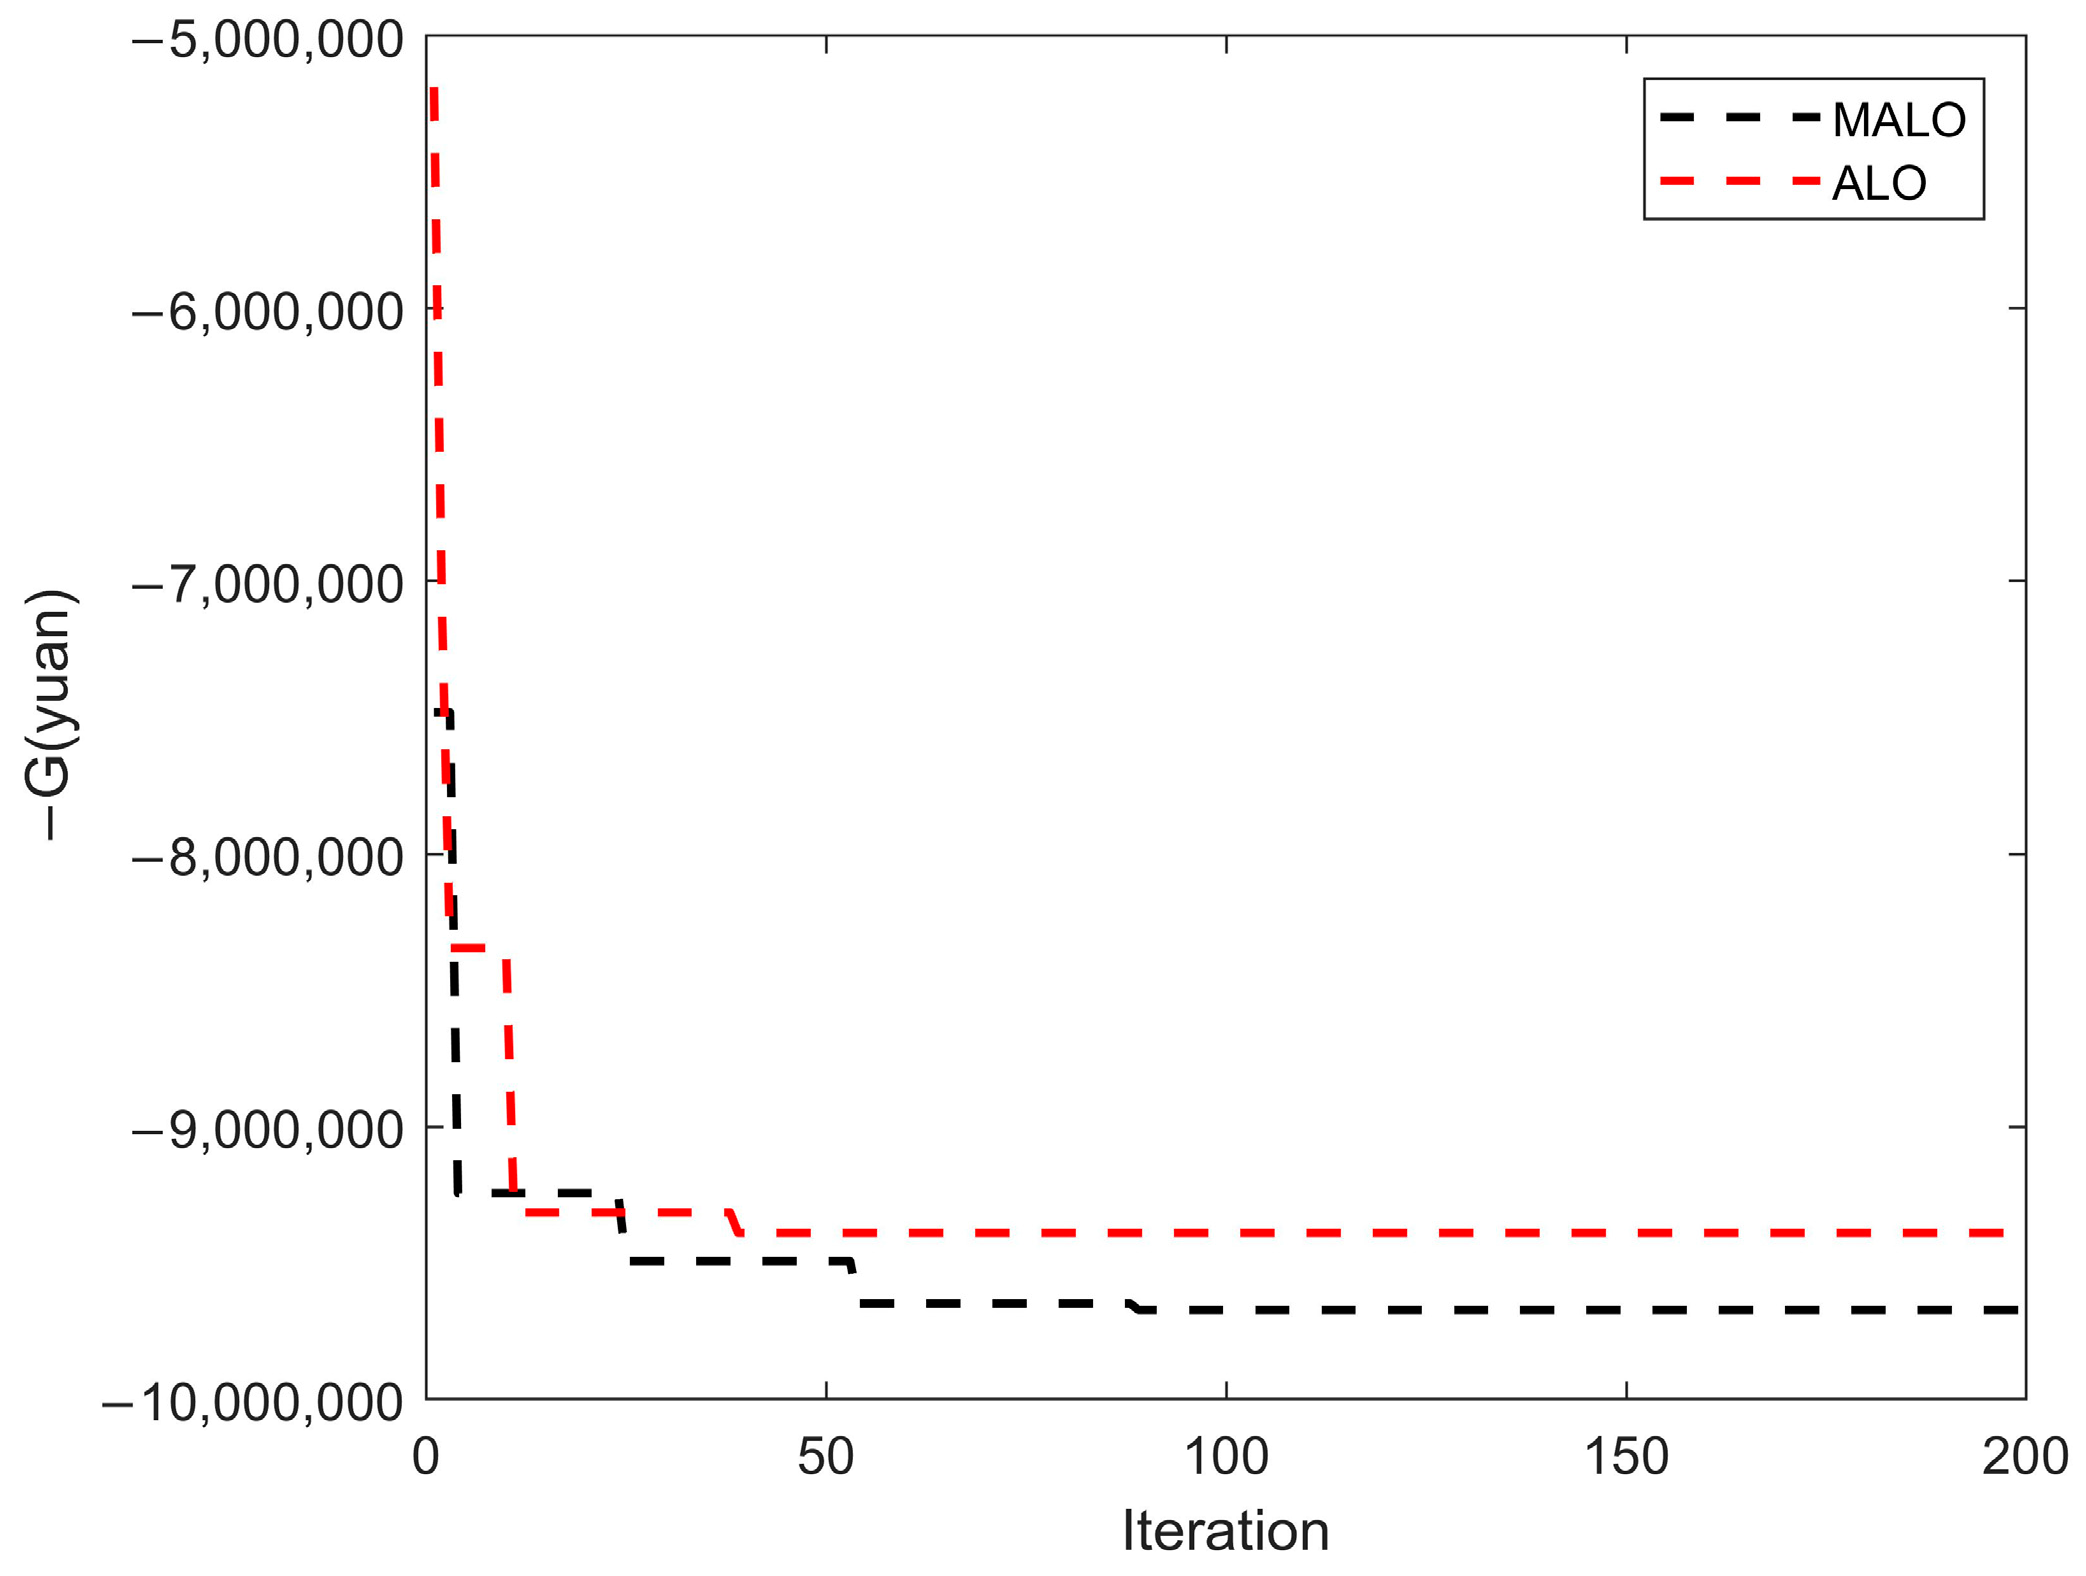
In Figure 5, the optimization iteration diagram showcases the process of solving the objective function using both the ant lion algorithm and the modified ant lion algorithm. From the graph, it is evident that the modified ant lion method has the potential to yield a superior solution, while also maintaining the option for further optimization, thanks to its improved balance between search and utilization.
Table 3 provides a comprehensive comparison between ALO, MALO, and other literature in terms of profitability. Remarkably, the energy complementary system based on MALO achieves a profit of 9,669,273 yuan, surpassing the literature’s profit by 154,621 yuan [19]. This result demonstrates the superior performance and effectiveness of the MALO method in optimizing the profitability of the system.
In this research, we employ the enhanced ant lion optimization algorithm to determine the maximum profits under seven distinct operating modes, utilizing the proposed three-party joint delivery model. The specific profits for each mode are presented in Table 4. The results provide valuable insights into the profitability of the system under various scenarios, highlighting the effectiveness of the enhanced algorithm in optimizing the energy delivery process.
The data presented in the analysis table clearly illustrate that the joint operation of the participating electric fields in the three-party system yields additional profits due to mutual cooperation. Notably, the income from joint operation significantly surpasses the sum of the incomes obtained from individual operations, making the profit generated by the three-party joint delivery the highest among all scenarios. This outcome underscores the substantial benefits of collaborative efforts and joint optimization in enhancing overall profitability.
The combined operation of thermal power units alongside wind power and solar energy in the energy complementary system plays a crucial role in significantly increasing the overall output power. When the income of wind farms and solar power plants is determined by the on-grid pricing of wind power and photovoltaic electricity, their revenues rise in tandem. However, as complementary power sources, thermal power units must adjust their output to match the levels of wind turbines to prioritize the delivery of wind and solar power. Consequently, the output power of thermal power units in the energy complementary system is limited, and the economic benefits of each unit become uncertain due to frequent power adjustments.
If the revenue of thermal power units is based on the benchmark price of thermal power, it becomes challenging for these units to achieve optimal returns, with some units even failing to break even. To properly reflect the synergistic value of thermal power units as complementary power sources, a fair and rational profit distribution mechanism is essential. This mechanism should distribute profits according to the contribution rate of wind farms, photovoltaic power plants, and thermal power units to the overall benefits of the energy complementary system.
To ensure cooperation among individuals participating in the energy complementary system, it is crucial to establish a profit distribution approach that encourages alliance cooperation by promising higher profit income compared to non-cooperation scenarios. In this context, the M-Shapley value distribution technique can effectively address the profit distribution challenge of an energy complementary system. By adopting the M-Shapley value, the system can achieve an equitable distribution of profits, considering the contributions of each participant to the overall benefits of the cooperative alliance. This approach encourages mutual cooperation and maximizes the profitability of the energy complementary system.

5.3. M-Shapley Value Allocation Strategy

The contribution of each participant to the alliance and the income of various alliance formation procedures must be considered when calculating the Shapley value. To simplify the concept, suppose that {1,2,3} represent a vast alliance of wind power, photovoltaic power, and thermal power. {1,2}, {1,3}, and {2,3} represent an alliance of three parties. {1}, {2}, and {3} denotes a coalition of one party. The profit distribution of the three power generation enterprises can be calculated using Formula (32), as follows:
x 1 ( v ) = 2 ! 3 ! × ( v { 1 } ) + 1 ! 3 ! × v 1 , 2 v 2 + 1 ! 3 ! × v 1 , 3 v 3 + 2 ! 3 ! × v 1 , 2 , 3 v 2 , 3 = 4 , 421 , 592.33
x 2 ( v ) = 2 ! 3 ! × ( v { 2 } ) + 1 ! 3 ! × v 1 , 2 v 1 + 1 ! 3 ! × v 2 , 3 v 3 + 2 ! 3 ! × v 1 , 2 , 3 v 1 , 3 = 1 , 356 , 481.17
x 3 ( v ) = 2 ! 3 ! × ( v { 3 } ) + 1 ! 3 ! × v 1 , 3 v 1 + 1 ! 3 ! × v 2 , 3 v 2 + 2 ! 3 ! × v 1 , 2 , 3 v 1 , 2 = 3 , 891 , 199.5
Profits can be obtained from three power generation firms, but the Shapley value is increased by taking into account the contribution of thermal power units to the system to ensure their willingness to participate in joint operation. Set M= (M1, M2, M3) = (0.33,0.333,0.34) for each of the three parties. And, according to Equations (38) and (40), the profit distribution correction for each member is as follows:
Δ x 1 ( v ) = v 1 , 2 , 3 × Δ M 1 = 32 , 230.91
Δ x 2 ( v ) = v 1 , 2 , 3 × Δ M 2 = 32 , 230.91
Δ x 3 ( v ) = v 1 , 2 , 3 × Δ M 3 = 64 , 461.82
The modified improved Shapley value is obtained by Formula (41):
x 1 ( v ) = x 1 v × Δ x 1 ( v ) = 4 , 389 , 361.42
x 2 ( 2 ) = x 2 v × Δ x 2 ( v ) = 1 , 324 , 250.26
x 3 ( v ) = x 3 v × Δ x 3 ( v ) = 3 , 955 , 661.32
Conclusively, the wind farm has yielded a substantial profit of 4,389,361.42 million yuan, while the photovoltaic power plant has recorded a commendable profit of 1,324,250.26 million yuan. Additionally, the thermal power plant has demonstrated its profitability with an impressive earning of 3,955,661.32 million yuan.
Following the implementation of the M-Shapley strategy for profit distribution, a noteworthy outcome emerges. Wind farm’s share of the alliance’s profit stands at 45.39%, a considerable decrease from the pre-M-Shapley value distribution level of 77.92%. Similarly, the photovoltaic power plant’s share accounts for 13.70% of the alliance’s profits, reflecting a decrease compared to the previous level of 15.87%. This adjustment aims to effectively capture the cooperative value of thermal power units within the energy complementary export system. A portion of the economic income generated by wind power units and photovoltaic power plants is allocated as a subsidy to offset the opportunity cost associated with thermal power. Nevertheless, despite the reduction in profit share, both wind farms and photovoltaic power plants experience significant enhancements when compared to their independent operation. Notably, the profit obtained by wind farms after M-Shapley value distribution amounts to a substantial 438,936,142,000 yuan, surpassing the independent operation profit of 1,936,098 yuan. Similarly, the profit attained by photovoltaic power plants after M-Shapley value distribution reaches an impressive 132,425,026,000 yuan, significantly exceeding the independent operation profit of 629,670 million yuan. Thus, there exist compelling justifications for wind farms and photovoltaic power plants to actively engage in the joint delivery system. Additionally, by amalgamating the distribution outcomes of the M-Shapley value method with the installed capacity and actual output of each electricity field, along with the profit levels associated with different combinations outlined in Table 5, it becomes evident that participants who contribute more to the alliance’s interests secure greater profits through the M-Shapley value distribution. This serves as a means to attract their continued involvement in the alliance, thereby fostering the creation of even more substantial profits.

6. Conclusions

To address the paradox of China’s new energy distribution, which is concentrated in certain areas but far from the power load centers, this study employs cooperative game theory to explore the coordinated scheduling and benefit distribution of wind power, photovoltaic, and thermal power during delivery. The cooperative model can be divided into two sub-problems: cooperation optimization and benefit distribution. Based on the analysis, the following conclusions can be drawn.
This paper introduces a novel large-scale multi-source joint export model based on cooperative game theory, integrating new energy and thermal power generation concepts. The model is effectively solved using the enhanced ant lion optimization technique proposed in this study. The improved ant lion algorithm enhances the feasibility of obtaining the global optimal solution, making the formation of a grand alliance among wind power plants, solar power plants, and thermal power plants conceivable. Such an alliance promises tremendous economic and social benefits.
The enhanced ant lion optimization algorithm greatly facilitates the attainment of the global optimal solution. It is now possible to form a large alliance comprising a wind farm, a photovoltaic electric field, and a thermal power plant, leading to tremendous economic and social benefits.
A well-structured benefit distribution mechanism plays a pivotal role in the sustainable development of the wind, photovoltaic, and thermal energy delivery alliance. In this study, the M-Shapley value method is employed to allocate the benefits of the joint operation among the three parties. The key finding is that participants who contribute more to the alliance’s benefits are rewarded with higher profits in the M-Shapley value approach, making alliance participation more attractive and enabling the creation of greater profits.
In the investigated multi-source joint delivery model, wind power, solar power, and thermal power all contribute to the power supply side. Moreover, the inclusion of additional elements, such as photothermal power plants and energy storage, can be explored further in this context. While addressing the benefit distribution among alliance members in this study, we assume all entities to be completely rational. However, in real-world scenarios, firms often exhibit “incomplete rationality” as they seek to maximize their own interests. Therefore, it becomes imperative to research and modify the preconditions for the distribution of alliance benefits, ensuring greater applicability of the benefit distribution scheme in real market settings.

Author Contributions

Conceptualization, methodology, software, writing—original draft preparation, writing—review and editing, visualization, W.H.; formal analysis, investigation, supervision, M.L.; supervision, validation, C.Z.; supervision, validation, K.W. All authors have read and agreed to the published version of the manuscript.

Funding

This research received no external funding.

Data Availability Statement

The research data has been described in Section 5, along with the corresponding references. The data is derived from reference [19].

Conflicts of Interest

The authors declare no conflict of interest.

References

  1. Cui, Y.; Li, C.; Zhao, Y. Source-grid-load multi-period optimal scheduling method considering wind-photovoltaic-photothermal combined DC transmission. Proc. CSEE 2022, 42, 559–573. [Google Scholar]
  2. He, W.; Liu, M.; Wang, K.; Pan, B. Massive Multi-source Joint Outbound and Benefit Distribution Model Based on Cooperative Game. In Proceedings of the 2023 IEEE International Conference on Power Science and Technology (ICPST), Kunming, China, 5–7 May 2023; pp. 519–527. [Google Scholar]
  3. Shen, J.; Wang, Y.; Cheng, C. Research status and prospect of water-wind-solar multi-energy complementary power generation scheduling problem. Proc. CSEE 2022, 42, 3871–3885. [Google Scholar]
  4. Zhang, B.; Yu, J.; Huang, W. Challenges and thinking of large-scale new energy transmission power grid in Gansu. Grid. Clean. Energy 2020, 36, 81–89, 96. [Google Scholar]
  5. Mei, H.; Gao, B.; Cao, Z. Optimal configuration of wind-solar-thermal-storage combined delivery system with CSP power station. J. Solar. Energy 2022, 43, 124–133. [Google Scholar]
  6. Alassi, A.; Bañales, S.; Ellabban, O.; Adam, G.; MacIver, C. HVDC Transmission: Technology Review, Market Trends and Future Outlook. Renew. Sustain. Energy Rev. 2019, 112, 530–554. [Google Scholar] [CrossRef]
  7. Li, Q.; Zhao, D.; Yin, J. Sediment Instability Caused by Gas Production from Hydrate-bearing Sediment in Northern South China Sea by Horizontal Wellbore: Evolution and Mechanism. Nat. Resour. Res. 2023, 32, 1595–1620. [Google Scholar] [CrossRef]
  8. Wang, F.; Liu, X.; Jiang, B.; Zhuo, H.; Chen, W.; Chen, Y.; Li, X. Low-loading Pt nanoparticles combined with the atomically dispersed FeN4 sites supported by FeSA-N-C for improved activity and stability towards oxygen reduction reaction/hydrogen evolution reaction in acid and alkaline media. J. Colloid Interface Sci. 2023, 635, 514–523. [Google Scholar] [CrossRef]
  9. Li, Q.; Zhang, C.; Yang, Y.; Ansari, U.; Han, Y.; Li, X.; Cheng, Y. Preliminary experimental investigation on long-term fracture conductivity for evaluating the feasibility and efficiency of fracturing operation in offshore hydrate-bearing sediments. Ocean Eng. 2023, 281, 114949. [Google Scholar] [CrossRef]
  10. Xie, J.; Zhang, Y.; Pan, X. A short-term optimal scheduling model for wind- solar- hydro hybrid generation system with cascade hydropower considering regulation reserve and spinning reserve requirements. IEEE Access 2021, 9, 10765–10777. [Google Scholar] [CrossRef]
  11. Zhang, G.; Zhu, Y.; Xie, T.; Zhang, K.; He, X. Wind Power Consumption Model Based on the Connection between Mid- and Long-Term Monthly Bidding Power Decomposition and Short-Term Wind-Thermal Power Joint Dispatch. Energies 2022, 15, 7201. [Google Scholar] [CrossRef]
  12. Xu, D.; Guo, J.; Ding, X. Co-evolutionary genetic algorithm based joint economic dispatch of wind-solar-storage in distribution network. New Technol. Electr. Energy 2020, 39, 51–57. [Google Scholar]
  13. Li, F. Study on Improving Transient Stability of Wind-Thermal-Bundled System by Current-Limiting SSSC; Northeast Electric Power University: Jilin, China, 2021. [Google Scholar]
  14. Xu, J.; Liu, L.; Wang, F. Equilibrium strategybased economic- reliable approach for day ahead scheduling towards solar wind gas hybrid power generation system: A case study from China. Energy 2022, 240, 122728. [Google Scholar] [CrossRef]
  15. Rana, M.M.; Atef, M.; Sarkar, M.R.; Uddin, M.; Shafiullah, G. A Review on Peak Load Shaving in Microgrid—Potential Benefits, Challenges, and Future Trend. Energies 2022, 15, 2278. [Google Scholar] [CrossRef]
  16. Tan, Q.; Ding, Y.; Li, Y. Multi-objective optimization of wind-solar-thermal joint dispatch strategy considering economic-environmental balance. Power Const. 2020, 41, 129–136. [Google Scholar]
  17. Contreras, J. A Cooperative Game Theory Approach to Transmission Planning in Power Systems. Ph.D. Thesis, University of California, Berkeley, CA, USA, 1997. [Google Scholar]
  18. Tan, Z.; Song, Y.; Zhang, H.; Shang, J. Large-scale wind power and thermal power combined delivery system and its profit distribution model. Power Syst. Auto 2013, 37, 63–70. [Google Scholar]
  19. Wu, D.; Yu, A. Profit allocation based on nucleolus theory in large-scale multi-source joint delivery coordination scheduling. Power System Technol. 2016, 40, 2975–2981. [Google Scholar]
  20. Chen, C.; Wu, C.; Kang, K.; Lin, X.; Ma, Y.; Sui, Q.; Xu, H. Optimal Strategy of Distributed Energy Storage Two-layer Cooperative Game Based on Improved Owen-Value Method. Proc. CSEE 2022, 42, 3924–3936. [Google Scholar]
  21. Ye, G.; Gao, F. Coordinated Optimization Scheduling of Data Center and Electricity Retailer Based on Cooperative Game Theory. CPSS Trans. Power Electr. App. 2022, 9, 273–282. [Google Scholar] [CrossRef]
  22. Owen, G. Values of Games with a Priori Unions. In Mathematical Economics and Game Theory; Springer: Berlin/Heidelberg, Germany, 1977; Volume 141, pp. 76–88. [Google Scholar]
  23. Shapley, L.S. A Value for n-Person Games. Contributions to the Theory of Games II; Princeton University Press: Princeton, NJ, USA, 1953; pp. 307–317. [Google Scholar]
  24. Xie, J.; Zhang, L.; Chen, X. Incremental benefit allocation for joint operation of multi-stakeholder wind-PV-hydro complementary generation system with cascade hydro-power: An Aumann-Shapley value method. IEEE Access 2020, 8, 68668–68681. [Google Scholar] [CrossRef]
  25. Ma, T.; Pei, W.; Xiao, H. Cooperative operation method for wind-solar-hydrogen multi-agent energy system based on Nash bargaining theory. Proc. CSEE 2021, 41, 25–39. [Google Scholar]
  26. Li, X.; Yang, Y. Joint optimal dispatch of wind power and cascade hydropower with hydrogen storage based on bi-directional electricity price compensation. Power Syst. Technol. 2020, 44, 3297–3305. [Google Scholar]
  27. Shandilya, S.K.; Izonin, I.; Singh, K.K. Modeling and Comparative Analysis of Multi-Agent Cost Allocation Strategies Using Cooperative Game Theory for the Modern Electricity Market. Energies 2022, 15, 2352. [Google Scholar] [CrossRef]
  28. Zhang, L.; Xie, J.; Chen, X. Cooperative game-based synergistic gains allocation methods for wind-solar-hydro hybrid generation system with cascade hydropower. Energies 2020, 13, 3890. [Google Scholar] [CrossRef]
  29. Shi, H. Research on the Mechanism of Wind-Thermal Energy Delivery and Benefit Distribution Based on Cooperative Game; Xian University of Technology: Xi’an, China, 2019. [Google Scholar]
  30. Mirjalili, R. The ant lion optimizer. Adv. Eng. Soft. 2015, 83, 80–98. [Google Scholar] [CrossRef]
  31. Wang, Y.; Ni, Y.; Zheng, Y. Remaining useful life prediction of lithium-ion battery based on ALO-SVR. China J. Electr. Eng. 2021, 41, 1445–1457. [Google Scholar]
  32. Liu, S.; Gao, Z.; Li, M. A closed-form logarithmic spiral method for seismic passive earth pressure in anisotropic sand. Comput. Geotech. 2022, 152, 105052. [Google Scholar] [CrossRef]
  33. Xie, Y.; Yao, Y.; Wang, Y.; Cha, W.; Zhou, S.; Wu, Y.; Huang, C. A Cooperative Game-Based Sizing and Configuration of Community-Shared Energy Storage. Energies 2022, 15, 8626. [Google Scholar] [CrossRef]
  34. Wu, W.; Zhu, J.; Chen, Y. Modified Shapley Value-Based Profit Allocation Method for Wind Power Accommodation and Deep Peak Regulation of Thermal Power. IEEE Trans. Ind. App. 2023, 59, 276–288. [Google Scholar] [CrossRef]
  35. Devi, N.N.; Thokchom, S.; Singh, T.D.; Panda, G.; Naayagi, R.T. Multi-Stage Bargaining of Smart Grid Energy Trading Based on Cooperative Game Theory. Energies 2023, 16, 4278. [Google Scholar] [CrossRef]
  36. Branzei, R.; Dimitrov, D.; Tijs, S. Models in Cooperative Game Theory; Springer Science & Business Media: Berlin/Heidelberg, Germany, 2008. [Google Scholar]
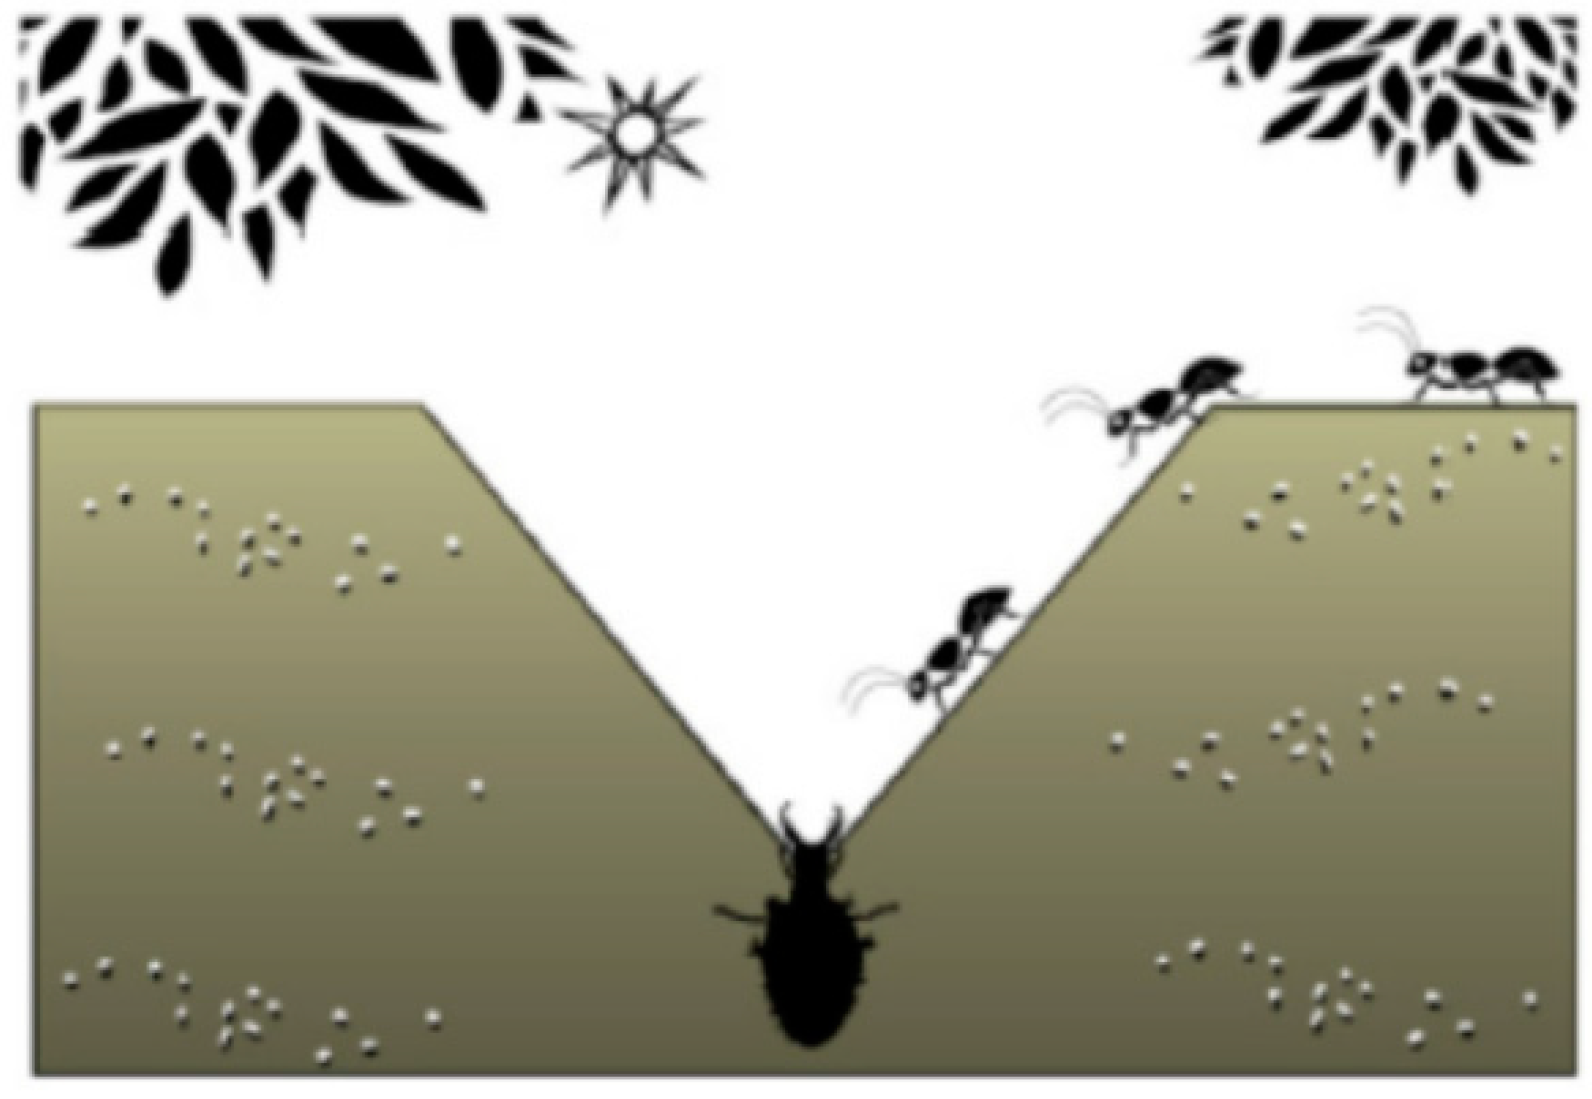
Figure 1. Foraging behavior of ant lions.
Energies 16 06590 g001
Figure 2. Logarithmic spiral.
Energies 16 06590 g002
Figure 3. Real-time output of three-party combined thermal power unit.
Energies 16 06590 g003
Figure 4. The system transmits power in several modes. (a) Independent wind power transmission. (b) Photovoltaic independent delivery. (c) Thermal power independent delivery. (d) Joint delivery of wind and photovoltaic. (e) Combined delivery of thermal and wind. (f) Photovoltaic and thermal power joint delivery. (g) Tripartite joint delivery.
Energies 16 06590 g004aEnergies 16 06590 g004b
Figure 5. Comparison of ant lion algorithm and improved ant lion iteration diagram.
Energies 16 06590 g005
Table 1. Equivalent utilization rate of wind power plant.
Time PeriodUtilization RatioTime PeriodUtilization RatioTime PeriodUtilization Ratio
10.4190.2217029
20.59100.15180.25
30.71110.09190.18
408412o.22200.16
50.69130.23210.18
60.57140.16220.29
70.49150.28230.36
80.41160.35240.46
Table 2. Comparison of wind and photovoltaic abandonment under three-party joint and independent modes.
Mode of OperationAbandoned Wind Rate/%Photovoltaic Curtailment Ratio/%
Tripartite Union1.600
Wind power independence37.82-
Photoelectric independence-9.82
Table 3. Comparison of joint total profit of three parties.
Solving AlgorithmProfitLiterature
ALO9,484,652/Yuan--
LINGO optimizer9,514,652/YuanLiterature [19]
MALO9,669,273/Yuan--
Table 4. Profit comparison under different modes.
Operating ModeTripartite UnionCombined Thermal and Wind PowerCombined Thermal Power and PhotovoltaicWind Power, Photovoltaic Joint
Profit/Yuan9,669,2738,856,4413,276,3104,165,790
Operating modeThermal power independenceWind power independencePhotoelectric independence
Profit/Yuan2,521,1291,936,098629,670
Table 5. Comparison of direct allocation and M-Shapley value allocation results.
Distribution ModeWind PowerPhotovoltaicThermal Power
Profit/Ten Thousand YuanProfit Ratio/Ten Thousand YuanProfit/Ten Thousand YuanProfit Ratio/Ten Thousand YuanProfit/Ten Thousand YuanProfit Ratio/Ten Thousand Yuan
Direct distribution7,534,297.5277.92%1,534,513.6315.87%600,461.856.21%
M-Shapley strategy4,389,361.4245.39%1,324,250.2613.70%3,955,661.3240.91%
Disclaimer/Publisher’s Note: The statements, opinions and data contained in all publications are solely those of the individual author(s) and contributor(s) and not of MDPI and/or the editor(s). MDPI and/or the editor(s) disclaim responsibility for any injury to people or property resulting from any ideas, methods, instructions or products referred to in the content.