
Incentive Mechanisms to Integrate More Renewable Energy in Electricity Markets in China

 ,
,
Abstract
:1. Introduction
2. Policy and Integration Situation of Renewable Energy in China
2.1. Policies to Encourage Consuming Renewable Energy
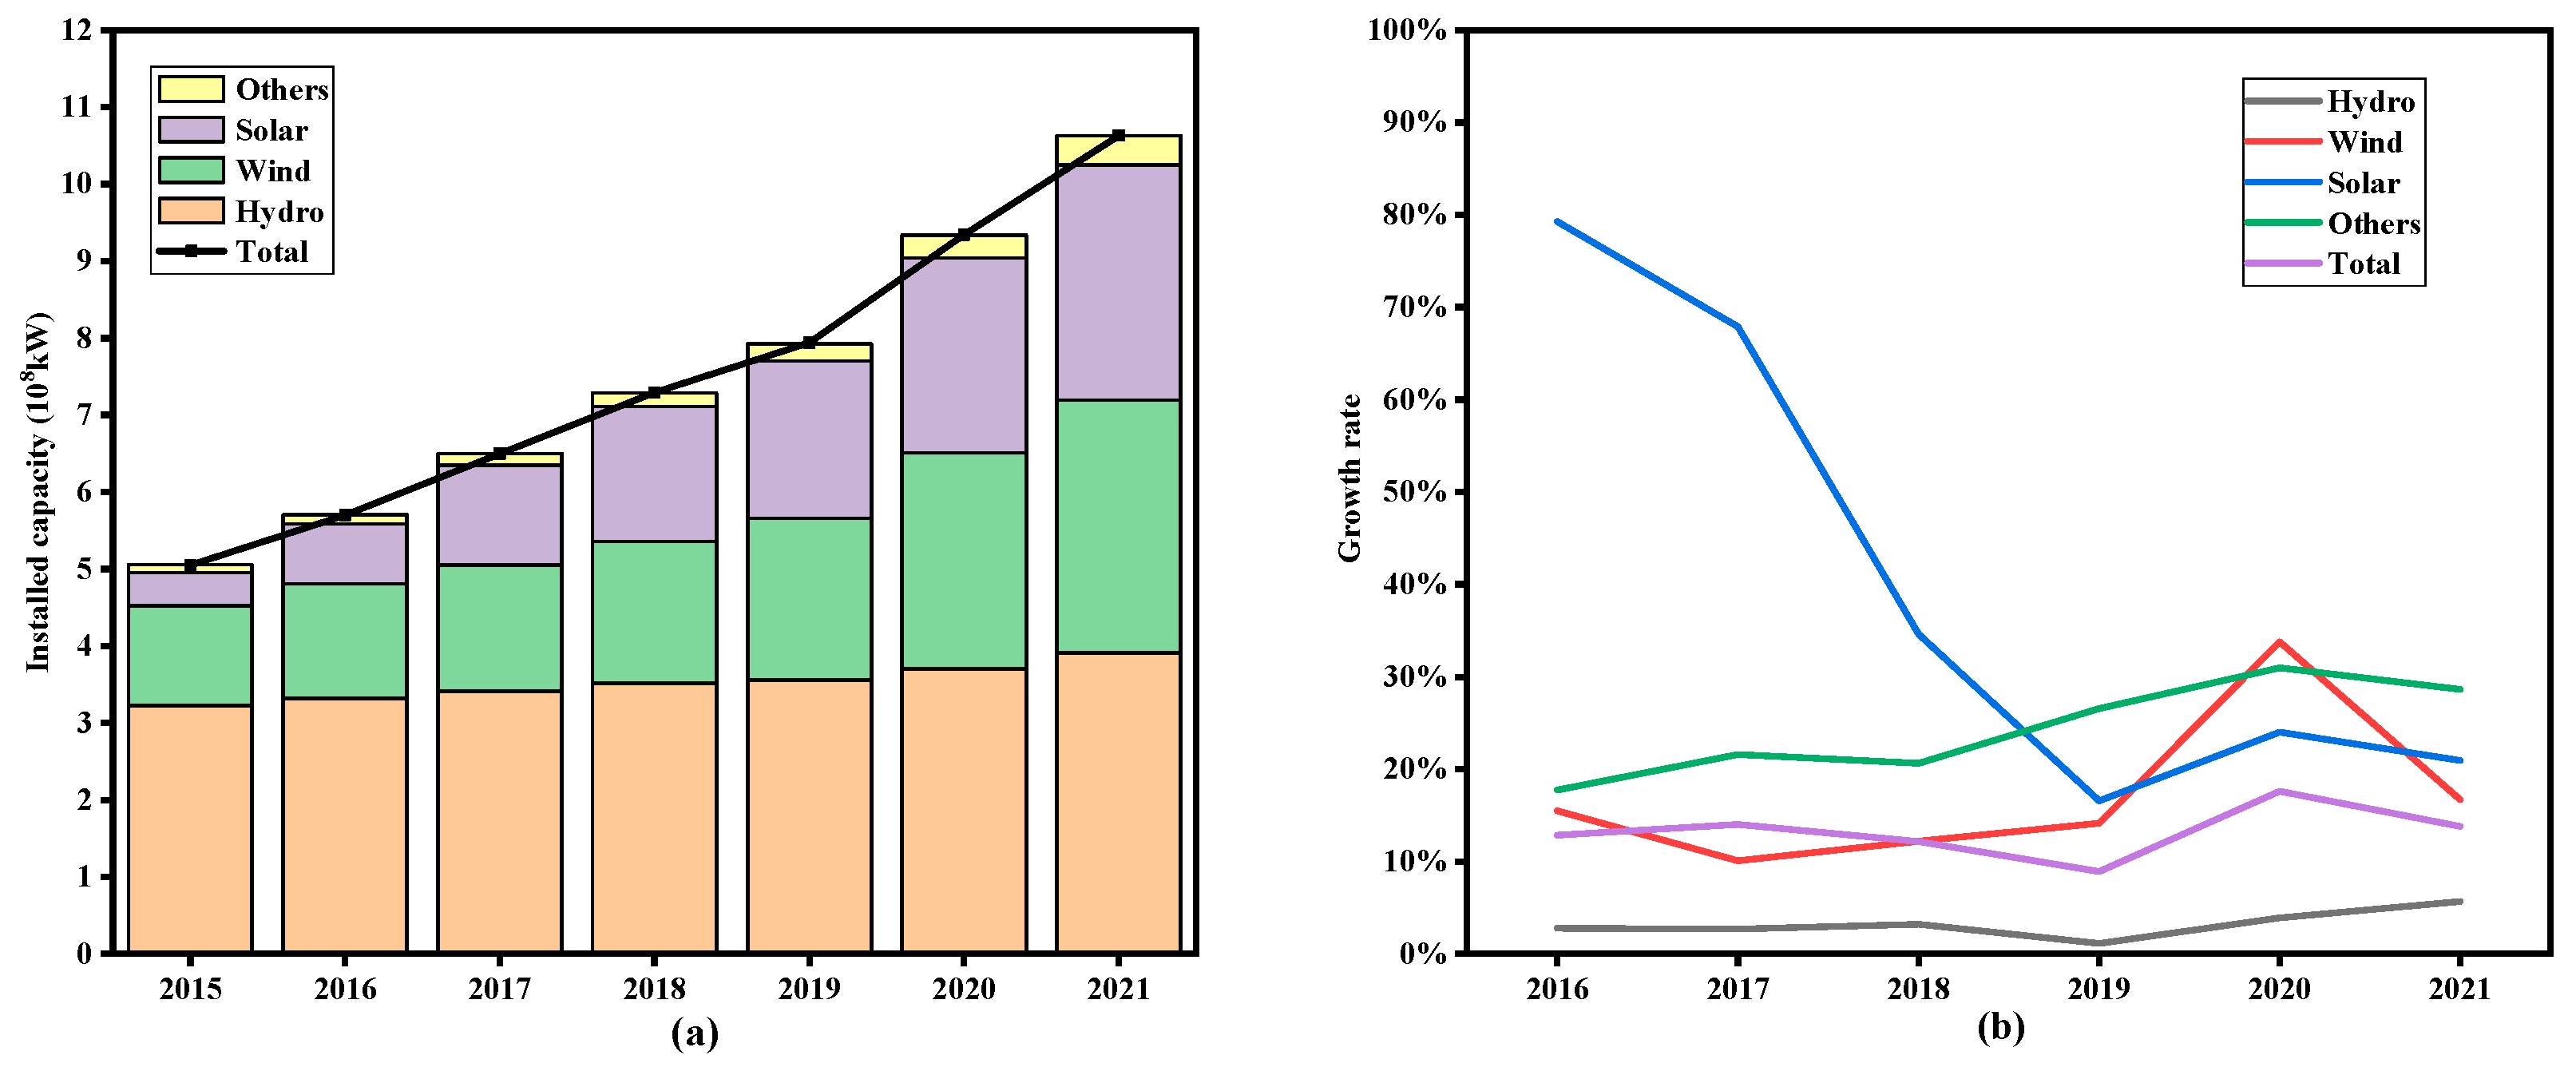
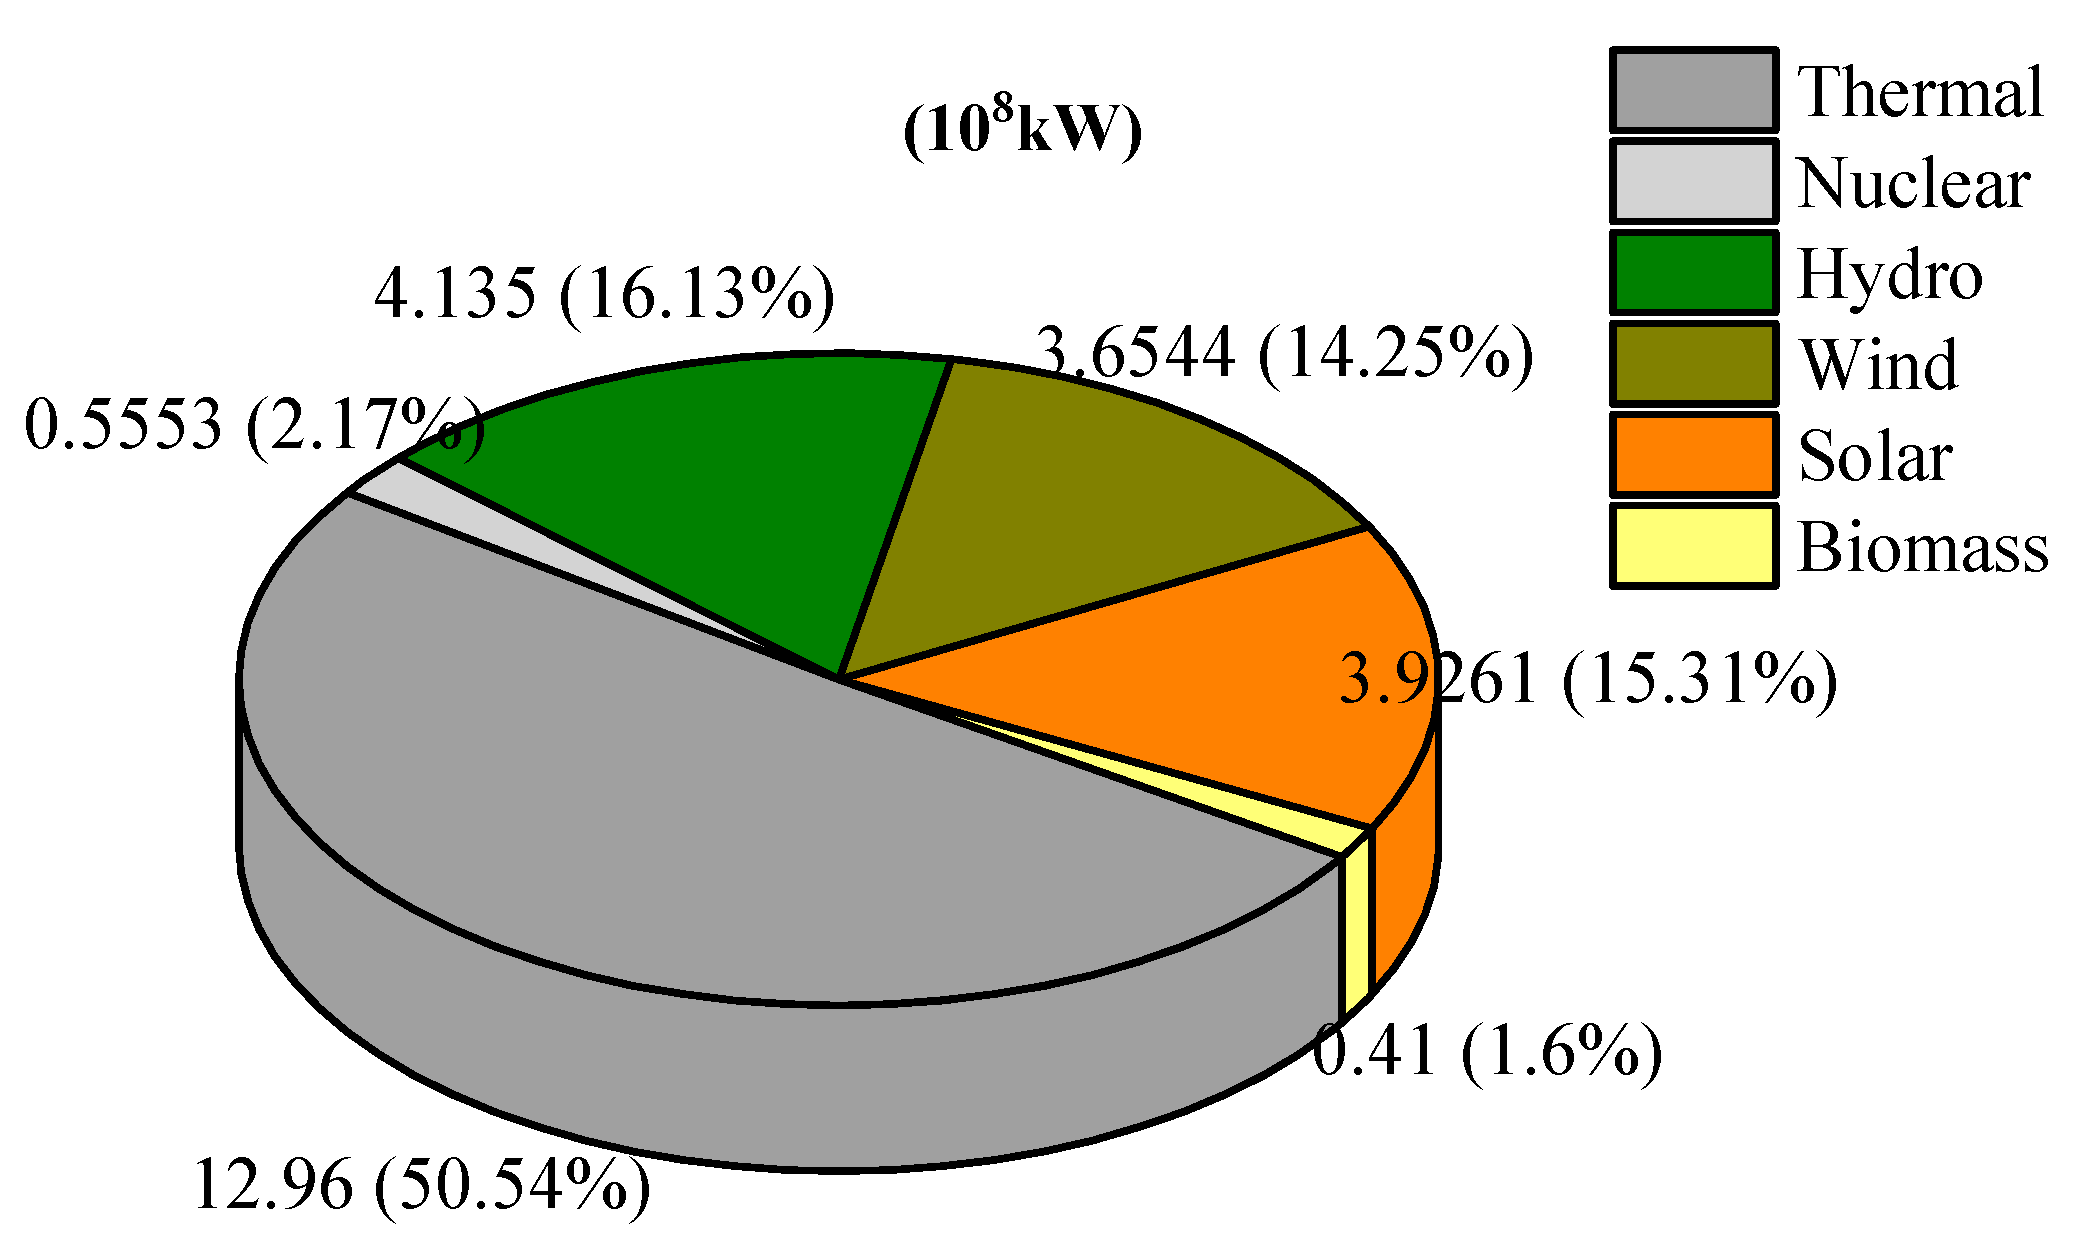
2.2. Development of Renewable Energy
2.3. Integration of Renewable Energy
2.3.1. Hydropower
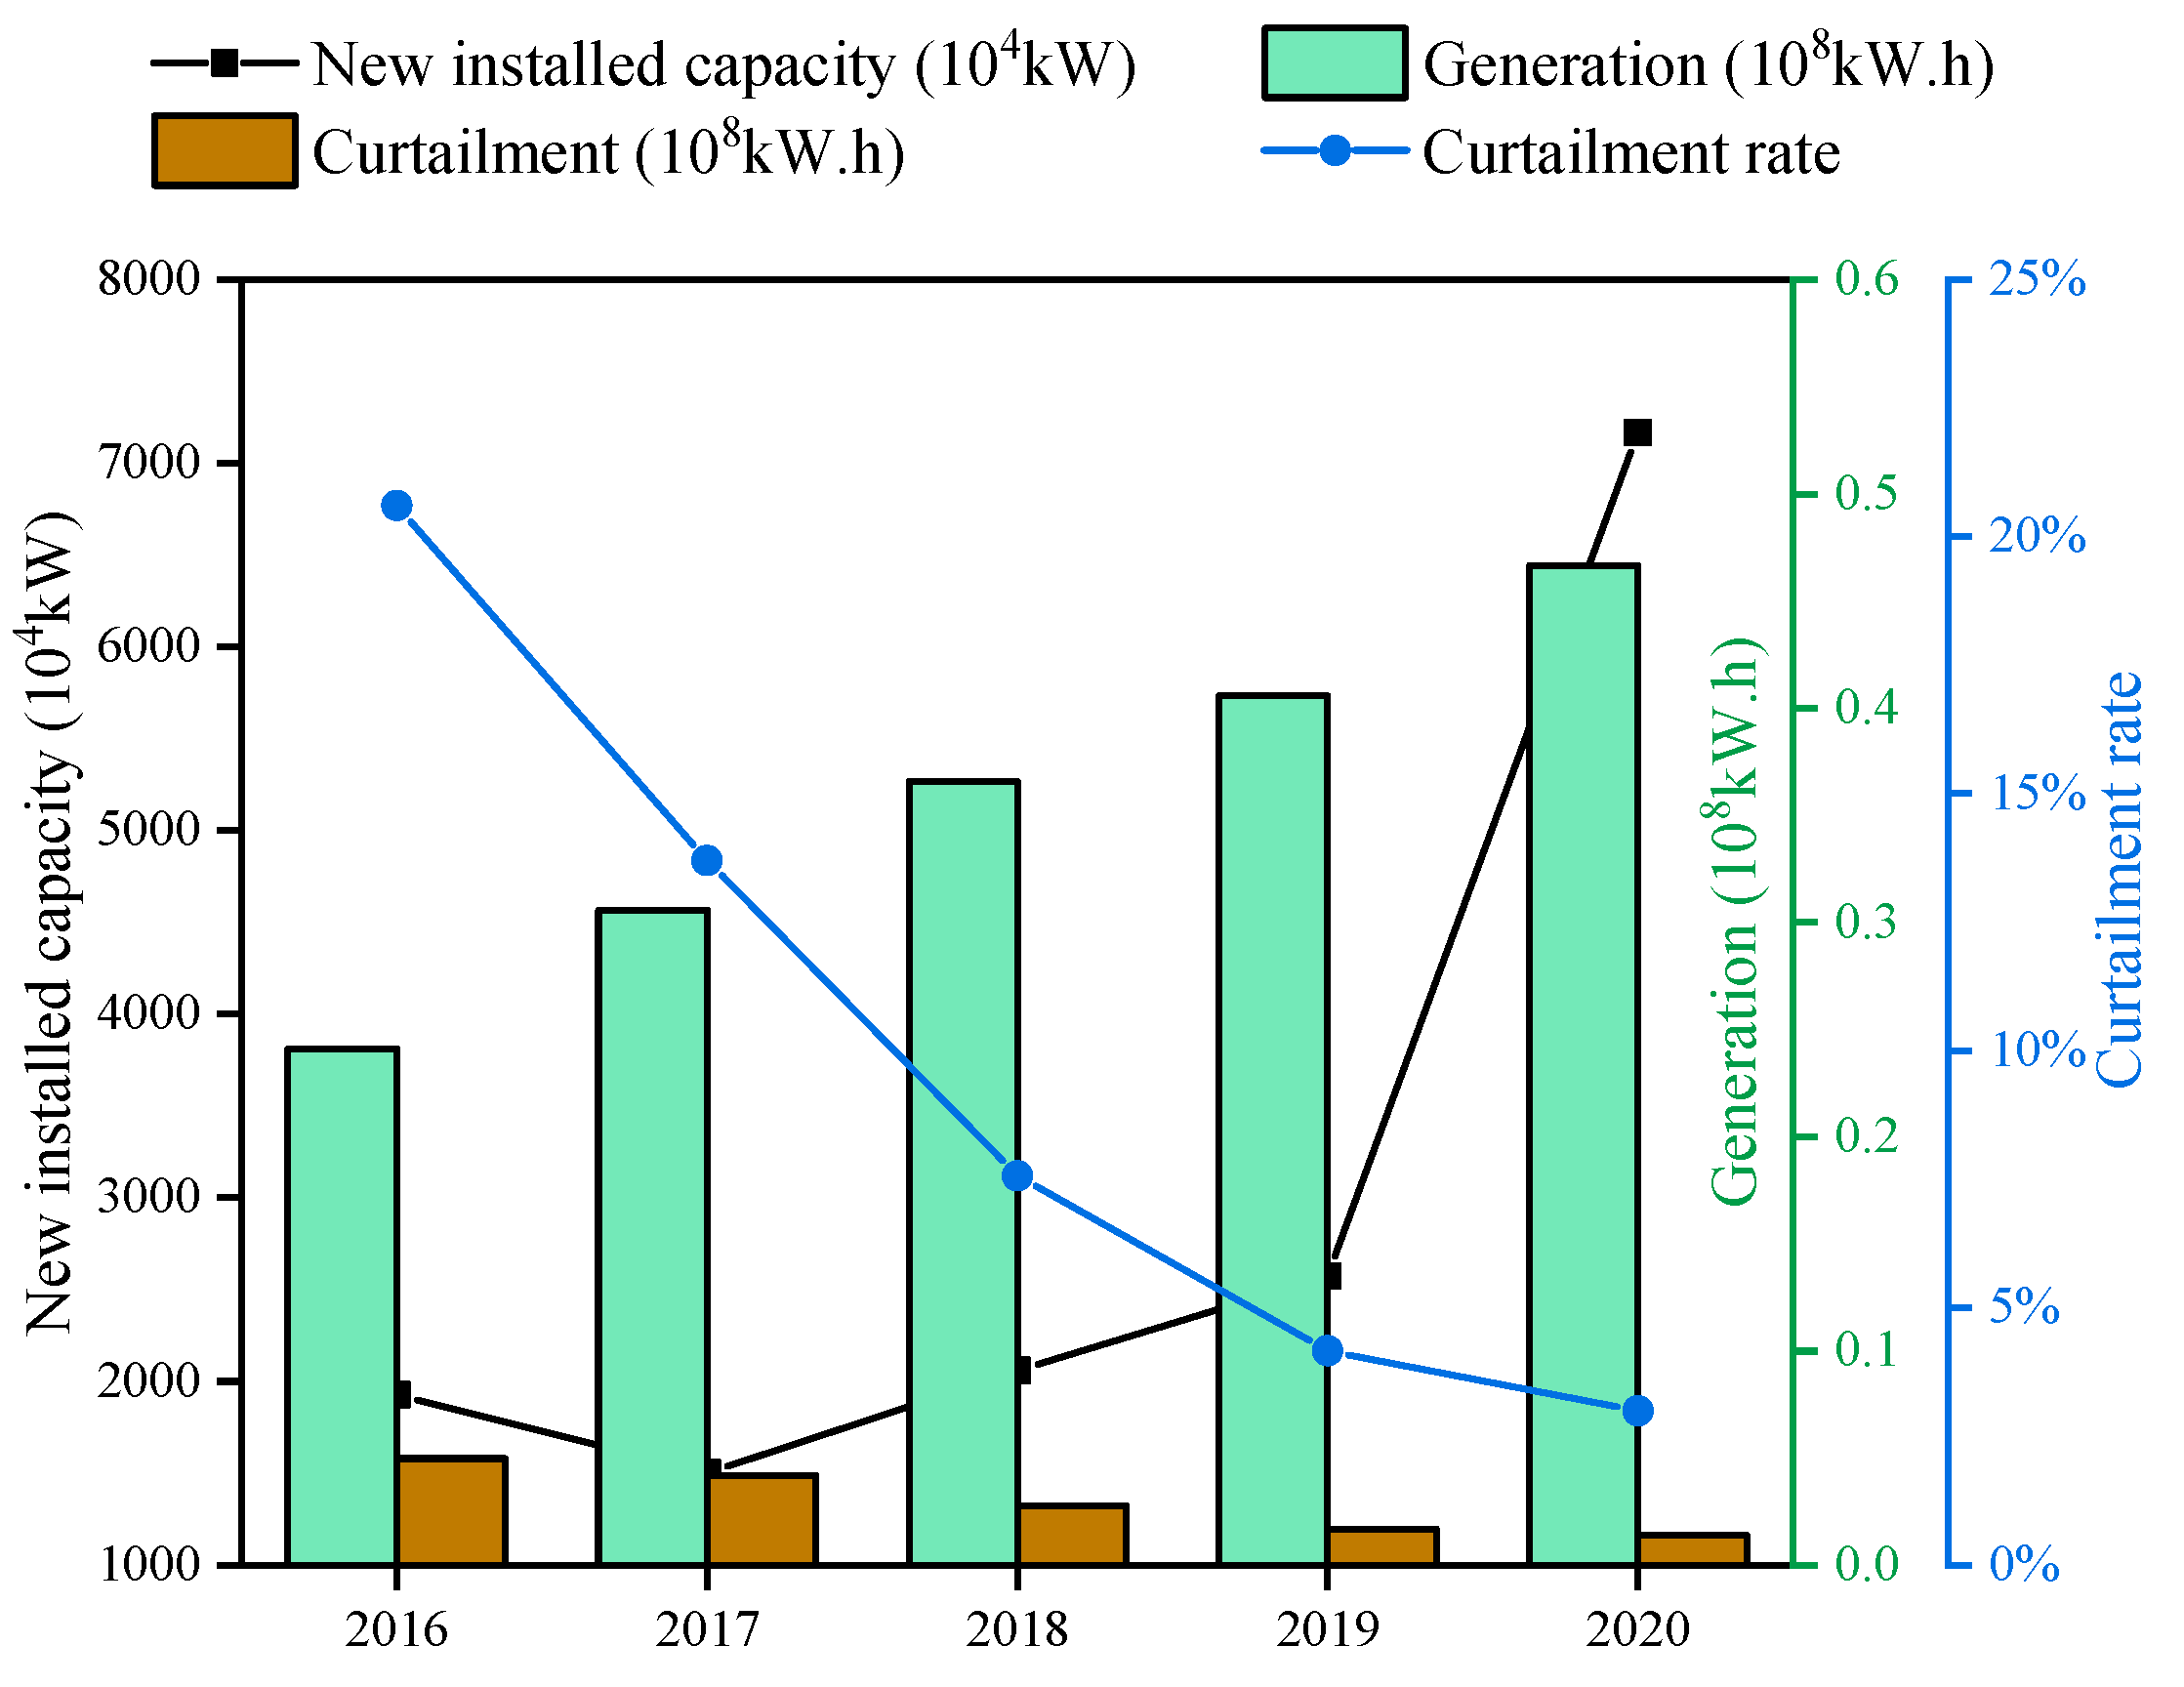
2.3.2. Wind Power
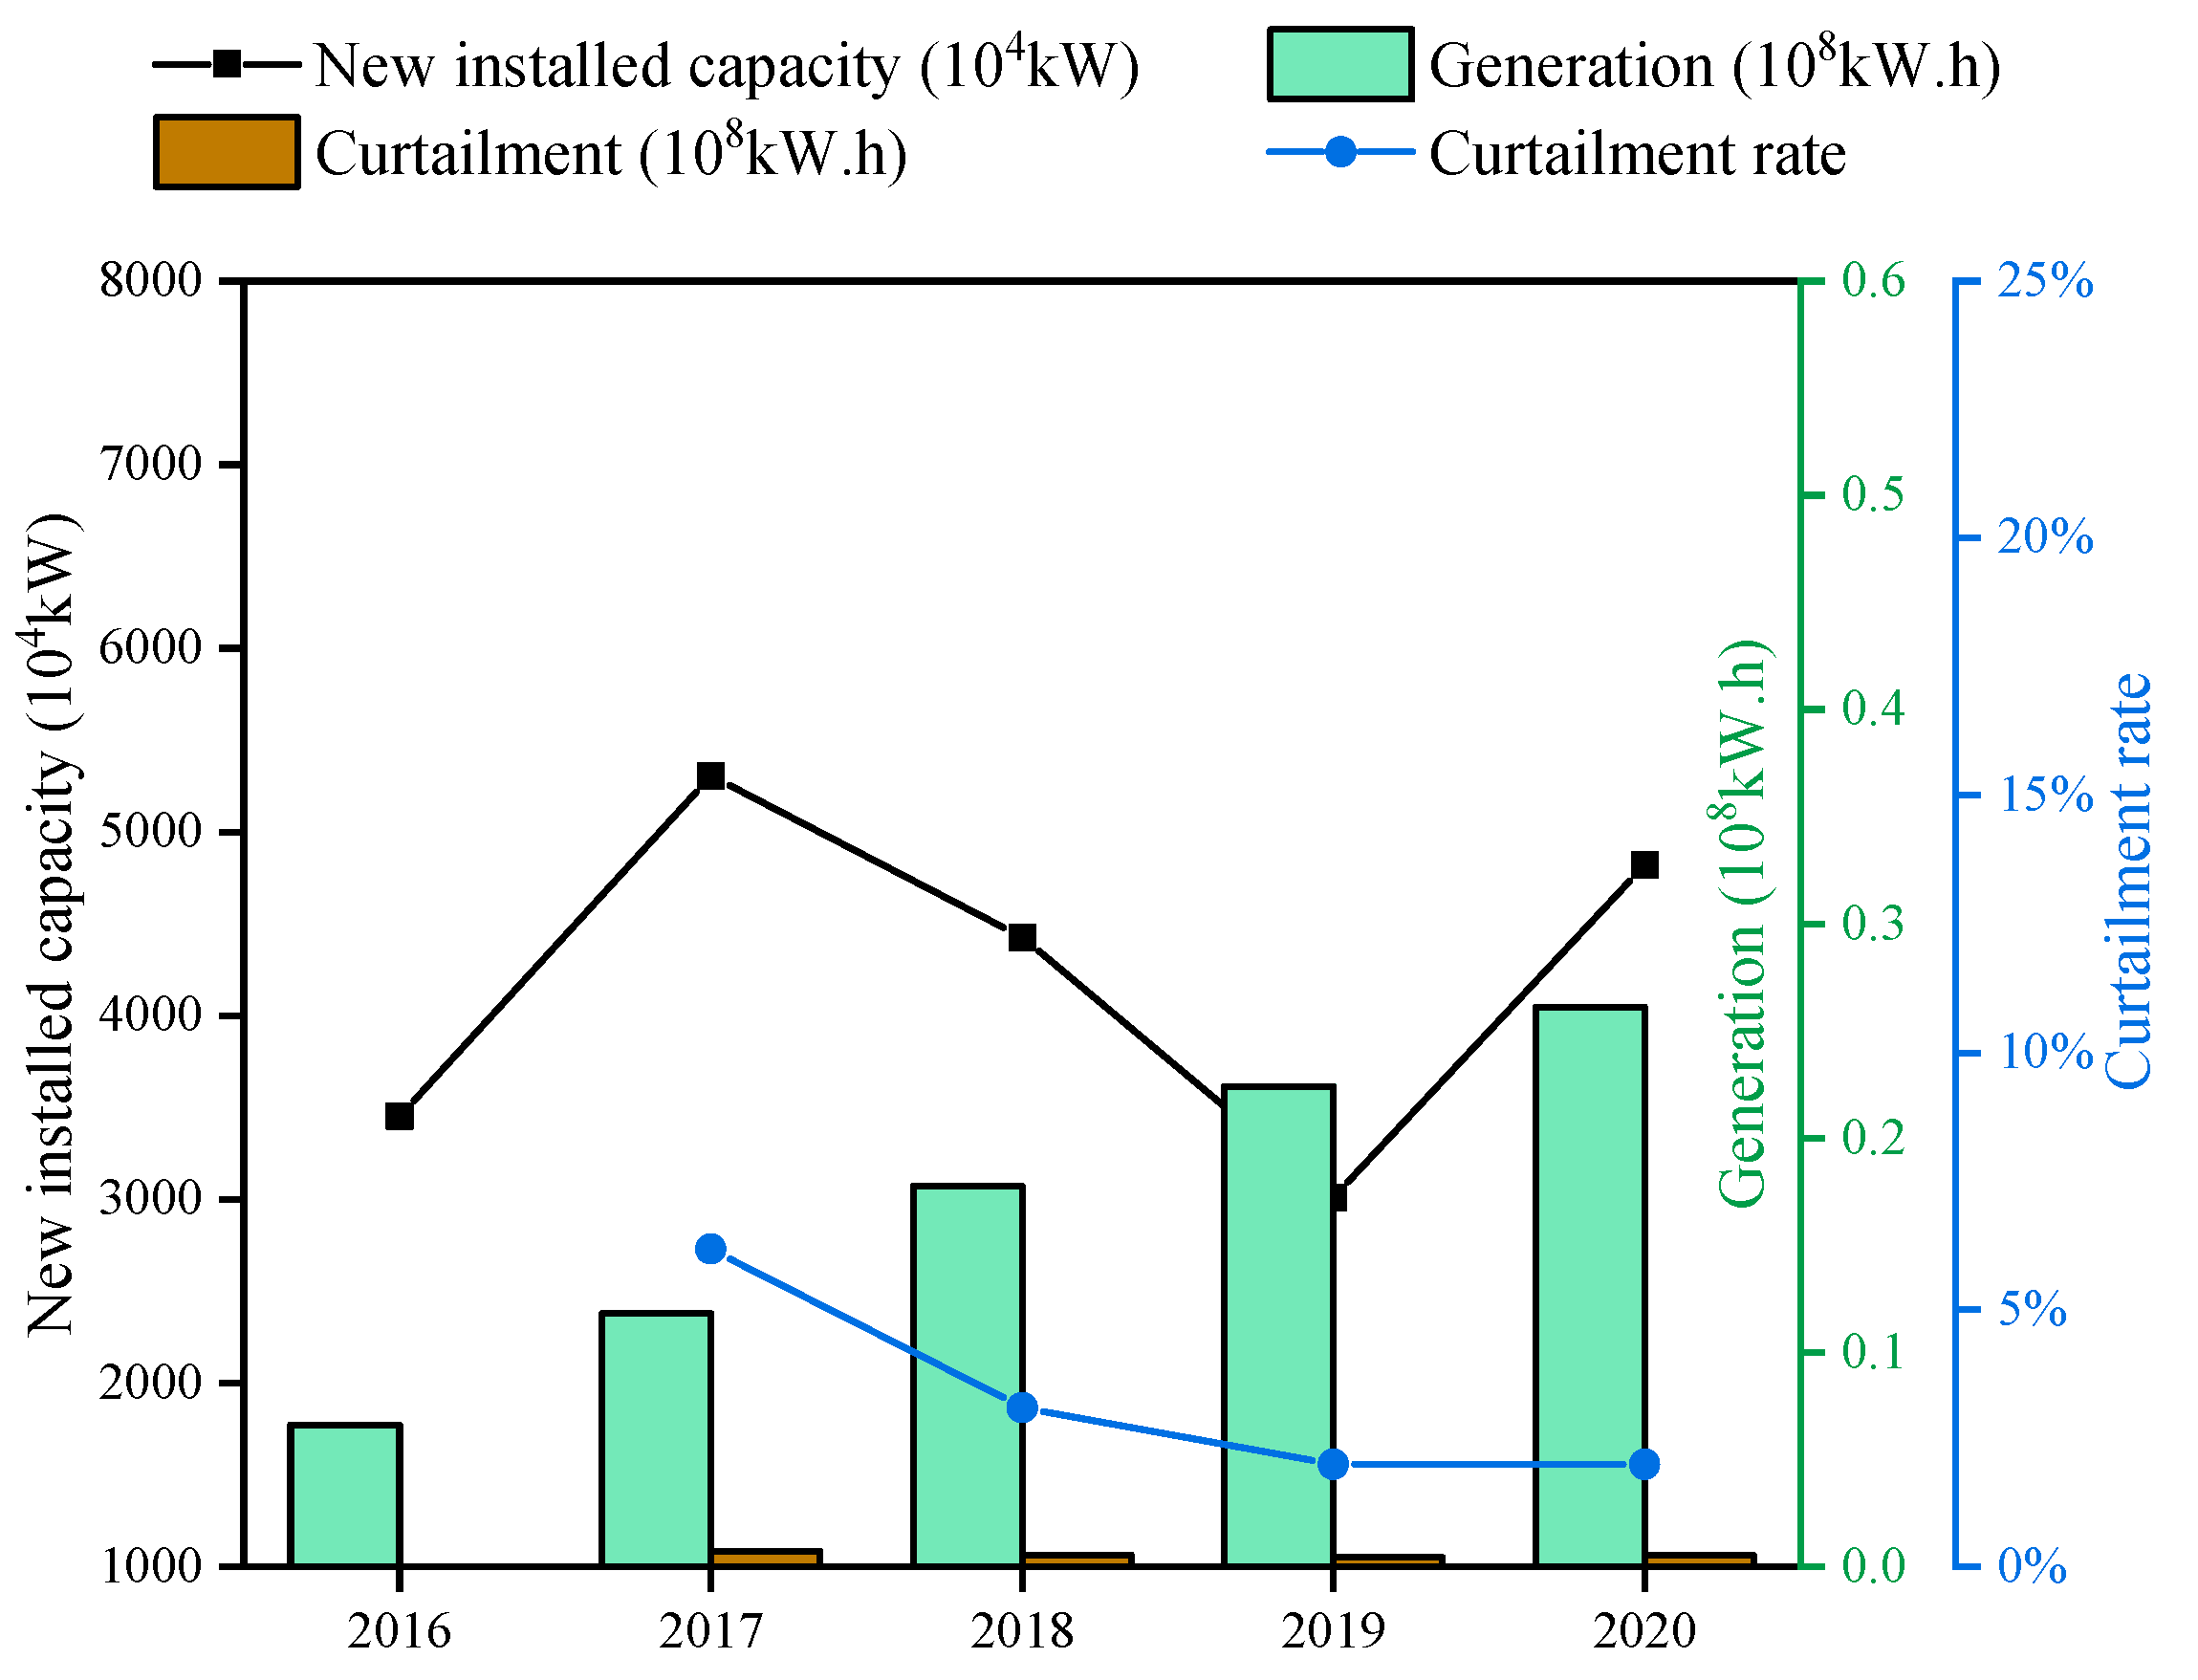
2.3.3. Solar Power
3. International Practice to Integrate More Renewable Energy through Market Mechanisms
3.1. Brazil
3.1.1. Basic Situation of Brazilian Electric Power
3.1.2. Brazilian Market Mechanisms to Promote Renewable Energy Integration
3.2. Nordic Countries
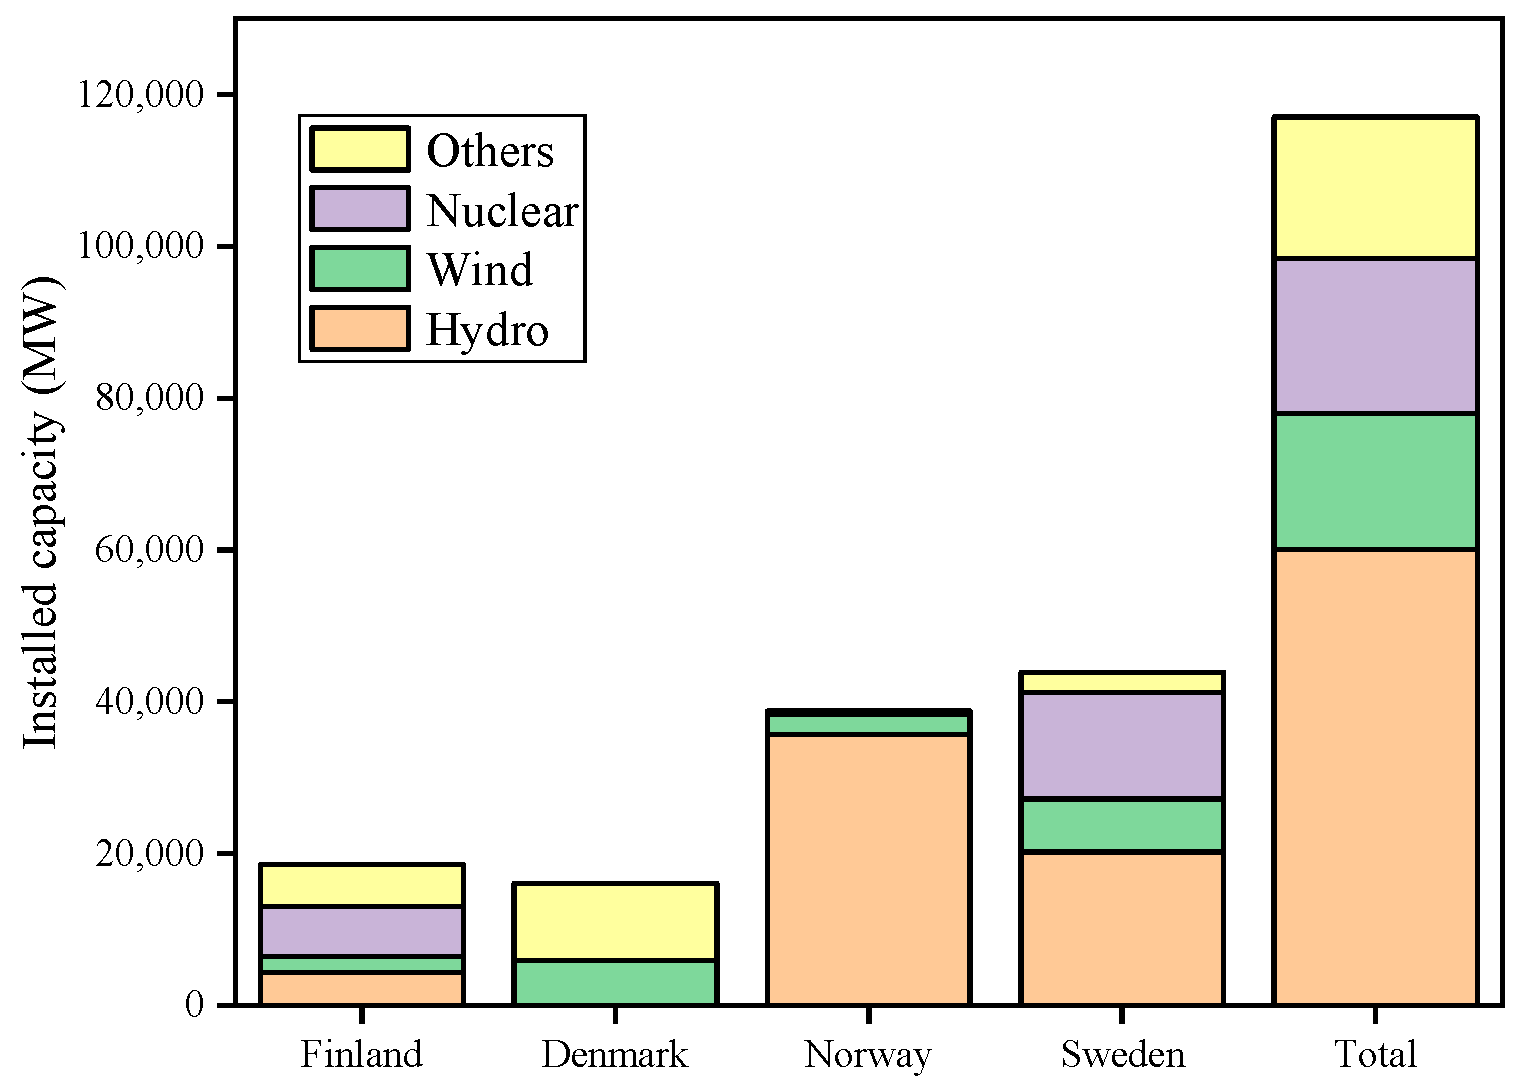
3.2.1. Overview of Electricity in the Nordic Region
3.2.2. Nordic Mechanisms to Promote Integrating More Renewable Energy
3.3. The United States
3.3.1. Electric Power Development in the USA
3.3.2. The Mechanisms in California to Promote More Renewable Energy Integration
3.3.3. The Mechanisms in Texas to Promote Renewable Energy Integration
4. Some Comments on Integrating More Renewable Energy in China
4.1. Planning and Regulatory Strategies
4.1.1. Demand-Guided Planning and Grid Enhancement
4.1.2. Long-Term Planning and New Energy Quotas
4.1.3. Build a Strong Reliability Network Frame
4.2. Local Consumption and Integration
4.2.1. Promote Nearby Consumption of Renewable Energy
4.2.2. Build a Demonstration Zone for the Industry
4.2.3. Build Energy Storage Equipment in Load Centers
4.3. Market Mechanisms and Technological Advancements
4.3.1. Enhance System Flexibility and Mechanism Design
4.3.2. Improve the Market Mechanism and Policy System
5. Conclusions
- (1)
- Brazil, which integrates renewable energy through medium- and long-term contract markets, free contract markets, and an electricity redistribution mechanism, enhancing cooperation among hydropower plants and reducing uncertainties in hydropower revenue.
- (2)
- The Nordic system, which promotes renewable energy integration through a well-developed spot market with day-ahead, intraday, and real-time markets, an ancillary service market, financial markets, and transnational mechanisms for peak-shaving and power exchange.
- (3)
- The USA, where California’s CAISO electricity market implements a mechanism with negative pricing to balance excess power supply and encourage timely responses from suppliers, promoting renewable energy integration, while Texas’s ERCOT uses deviation assessment and regional transmission line construction to address wind power unpredictability and grid congestion and advance renewable energy development goals.
Author Contributions
Funding
Data Availability Statement
Conflicts of Interest
References
- Liu, S.; Bie, Z.; Lin, J.; Wang, X. Curtailment of renewable energy in Northwest China and market-based solutions. Energy Policy 2018, 123, 494–502. [Google Scholar] [CrossRef]
- He, Y.; Xu, Y.; Pang, Y.; Tian, H.; Wu, R. A regulatory policy to promote renewable energy consumption in China: Review and future evolutionary path. Renew. Energy 2016, 89, 695–705. [Google Scholar] [CrossRef]
- Cheng, C.; Chen, F.; Li, G.; Ristić, B.; Mirchi, A.; Qiyu, T.; Madani, K. Reform and renewables in China: The architecture of Yunnan’s hydropower dominated electricity market. Renew. Sustain. Energy Rev. 2018, 94, 682–693. [Google Scholar] [CrossRef]
- Liu, T.; Xu, J. Equilibrium strategy based policy shifts towards the integration of wind power in spot electricity markets: A perspective from China. Energy Policy 2021, 157, 112482. [Google Scholar] [CrossRef]
- Punda, L.; Capuder, T.; Pandžić, H.; Delimar, M. Integration of renewable energy sources in southeast Europe: A review of incentive mechanisms and feasibility of investments. Renew. Sustain. Energy Rev. 2017, 71, 77–88. [Google Scholar] [CrossRef]
- Guo, H.; Davidson, M.R.; Chen, Q.; Zhang, D.; Jiang, N.; Xia, Q.; Kang, C.; Zhang, X. Power market reform in China: Motivations, progress, and recommendations. Energy Policy 2020, 145, 111717. [Google Scholar] [CrossRef]
- Zhang, S.; Andrews-Speed, P.; Li, S. To what extent will China’s ongoing electricity market reforms assist the integration of renewable energy? Energy Policy 2018, 114, 165–172. [Google Scholar] [CrossRef]
- National Development and Reform Commission. China’s 14th Five-Year Plans on Renewable Energy Development. Available online: https://www.ndrc.gov.cn/xxgk/zcfb/ghwb/202206/P020220602315308557623.pdf (accessed on 1 June 2022).
- National Energy Administration. 2015 National Renewable Energy Power Development Monitoring and Evaluation Report. Available online: http://zfxxgk.nea.gov.cn/auto87/201608/t20160823_2289.htm (accessed on 16 August 2016).
- National Energy Administration. 2016 National Renewable Energy Power Development Monitoring and Evaluation Report. Available online: http://zfxxgk.nea.gov.cn/auto87/201704/t20170418_2773.htm (accessed on 10 April 2017).
- National Energy Administration. 2017 National Renewable Energy Power Development Monitoring and Evaluation Report. Available online: https://www.gov.cn/zhengce/zhengceku/2018-12/31/content_5433577.htm (accessed on 11 May 2018).
- National Energy Administration. 2018 National Renewable Energy Power Development Monitoring and Evaluation Report. Available online: https://www.gov.cn/zhengce/zhengceku/2019-09/29/content_5434697.htm (accessed on 4 June 2019).
- National Energy Administration. 2019 National Renewable Energy Power Development Monitoring and Evaluation Report. Available online: https://www.gov.cn/zhengce/zhengceku/2020-05/16/content_5512148.htm (accessed on 6 May 2020).
- National Energy Administration. 2020 National Renewable Energy Power Development Monitoring and Evaluation Report. Available online: http://zfxxgk.nea.gov.cn/2021-06/20/c_1310039970.htm (accessed on 20 June 2021).
- National Energy Administration. 2021 National Renewable Energy Power Development Monitoring and Evaluation Report. Available online: http://www.nea.gov.cn/2022-09/16/c_1310663387.htm (accessed on 16 September 2022).
- National Development and Reform Commission. Development of Renewable Energy in China in 2022. Available online: https://www.ndrc.gov.cn/fggz/hjyzy/jnhnx/202302/t20230215_1348799.html (accessed on 15 February 2023).
- National Energy Administration. China’s Installed Capacity of Renewable Energy Exceeds that of Coal-Fired Power. Available online: https://www.gov.cn/lianbo/bumen/202307/content_6895756.htm (accessed on 31 July 2023).
- National Energy Administration. China’s Cumulative Installed Capacity of Renewable Energy Power Generation Has Exceeded 1 Billion Kilowatts. Available online: http://www.nea.gov.cn/2021-11/20/c_1310323021.htm (accessed on 20 November 2021).
- National Energy Administration. Operation Status of Wind Power Grid Connection in 2016. Available online: https://www.gov.cn/xinwen/2017-01/29/content_5164027.htm (accessed on 29 February 2017).
- National Energy Administration. Operation Status of wind Power Grid Connection in 2017. Available online: https://www.gov.cn/xinwen/2018-02/02/content_5263096.htm (accessed on 2 February 2018).
- National Energy Administration. Operation Status of Wind Power Grid Connection in 2018. Available online: https://www.gov.cn/xinwen/2019-01/29/content_5361945.htm (accessed on 29 January 2019).
- National Energy Administration. Operation Status of Wind Power Grid Connection in 2019. Available online: http://www.nea.gov.cn/2020-02/28/c_138827910.htm (accessed on 28 February 2020).
- National Energy Administration. 2016 Solar Power Generation Statistics. Available online: http://www.nea.gov.cn/2017-02/04/c_136030860.htm (accessed on 4 February 2017).
- National Energy Administration. In 2017, the Newly Installed Capacity of Photovoltaic Power Generation Reached 53.06 Million Kilowatts, Ranking First among Renewable Energy Sources. Available online: http://www.nea.gov.cn/2018-01/24/c_136920159.htm (accessed on 24 January 2018).
- National Energy Administration. 2018 Solar Power Generation Statistics. Available online: http://www.nea.gov.cn/2019-03/19/c_137907428.htm (accessed on 19 March 2019).
- National Energy Administration. 2019 Solar Power Generation Statistics. Available online: http://www.nea.gov.cn/2020-02/28/c_138827923.htm (accessed on 28 February 2020).
- Feng, H. Research on Current Situation and Countermeasures of Renewable Energy Consumption in China. China Electr. Equip. Ind. 2017, 10, 6–19. [Google Scholar]
- International Hydropower Association. 2020 Hydropower Status Report [EB/OL]. Available online: https://www.hydropower.org/statusreport (accessed on 11 July 2023).
- BPSTATS. BP Statistical Review of World Energy Statistical Review of World, 69th ed.; BP Statistical Review of World Energy: London, UK, 2020. [Google Scholar]
- Rego, E.E.; Parente, V. Brazilian experience in electricity auctions: Comparing outcomes from new and old energy auctions as well as the application of the hybrid Anglo-Dutch design. Energy Policy 2013, 55, 511–520. [Google Scholar] [CrossRef]
- De Souza Dias, V.; Pereira da Luz, M.; Medero, G.M.; Tarley Ferreira Nascimento, D. An Overview of Hydropower Reservoirs in Brazil: Current Situation, Future Perspectives and Impacts of Climate Change. Water 2018, 10, 952. [Google Scholar] [CrossRef]
- Qu, Q.; Sun, X.; Wang, X. Brief Introduction to the Mutual Economic Mechanism of Hydropower and Electricity in Brazil’s Electricity Market. China Power Enterp. Manag. 2019, 34, 103–105. [Google Scholar]
- Barroso, L.A.; Rudnick, H.; Moreno, R.; Bezerra, B. Ensuring Resource Adequacy with Auctions of Options and Forward Con-tracts. In Proceedings of the 2007 IEEE Power Engineering Society General Meeting, Tampa, FL, USA, 24–28 June 2007; pp. 1–6. [Google Scholar]
- Liu, F.; Zhang, L.; Li, X.; Han, B. Brazil’s Electricity Market Research: Electricity Market Reform Process and Market Trading Mechanism. Proc. CSEE 2020, 40, 2501–2514. [Google Scholar]
- Ren, X.C. Brazil electricity price mechanism and its influence on hydropower project investment. Technol. Mark. 2020, 27, 153–154. [Google Scholar]
- Martins Peixoto, G.; Bambirra Pereira, R.; da Silva Amorim, L.; Melo Machado-Coelho, T.; Luís Soares, G.; Guimarães Parma, G. Análise da Participação de Pequenas Centrais Hidrelétricas no Mecanismo de Realocação de Energia. In Proceedings of the Anais do 14º Simpósio Brasileiro de Automação Inteligente, Ouro Preto, Brazil, 27–30 October 2019. [Google Scholar]
- Zhu, Y.; Chen, T. Research on Brazilian Electricity Market Transaction Mechanism and Its Enlightenment to China. Electric. Power. 2020, 53, 124–132. [Google Scholar]
- Zhang, L.; Liu, F.; Wang, B.; Ding, W.; Chen, Q. Brazil’s Electricity Market Research: The Internal Logic Analysis of Market Mechanism and its Enlightenment to China’s Power Market Construction. Proc. CSEE 2020, 40, 3201–3214. [Google Scholar]
- Lianjun, S.; Fang, H. Nordic power market and its operation. Int. Electr. Power China 2000, 2, 4–9. [Google Scholar]
- Norsk Energiforsyning Kraftproduksjon Page. Available online: https://energifaktanorge.no/norsk-energiforsyning/kraftforsyningen/ (accessed on 11 July 2023).
- Energimyndigheten. Nuläget på Elmarknaden [EB/OL]. Available online: http://www.energimyndigheten.se/om-oss/press/prenumerera/laget-pa-energimarknaderna/nulaget-pa-elmarknaden/ (accessed on 11 July 2023).
- Bao, M.; Ding, Y.; Shao, C.; Song, Y. Review of Nordic Electricity Market and Its Suggestions for China. Proc. CSEE 2017, 37, 4881–4892+5207. [Google Scholar]
- Zou, P.; Chen, Q.; Xia, Q.; He, C.; Ge, R. Logical analysis of electricity spot market design in foreign countries and enlightenment and policy suggestions for China. Autom. Electr. Power Syst. 2014, 38, 18–27. [Google Scholar]
- Wangensten, I. Power System Economics: The Nordic Electricity Market; Tapir Academic Press: Trondheim, Norway, 2012. [Google Scholar]
- Zhang, X.; Chen, Z.; Ma, Z.; Xia, Q.; Dai, X.J. Study on Electricity Market Trading System Adapting to Renewable Portfolio Standard. Power Syst. Technol. 2019, 43, 2682–2690. [Google Scholar]
- California Energy Commission. California Installed Renewable Capacity Report [EB/OL]. Available online: https://www.energy.ca.gov/sites/default/files/2019-12/renewable_ada.pdf (accessed on 30 December 2019).
- Ercot. 2019 Reports and Presentations [EB/OL]. Available online: http://www.ercot.co-m/news/presentations/2019 (accessed on 11 July 2023).
- Xu, Z.; Zeng, M. Analysis on Electricity Market Development in US and Its Inspiration to Electricity Market Construction in China. Power Syst. Technol. 2011, 35, 161–166. [Google Scholar]
- Yu, J.; Liu, Y.; Yang, J.; Gao, C.; Yang, Y.; Ding, Q. Analysis of Development of California Ancillary Service Market and Its Enlightenment to China’s Power Market. Power Syst. Technol. 2019, 43, 2711–2717. [Google Scholar]
- Woo, C.K.; Moore, J.; Schneiderman, B.; Ho, T.; Olson, A.; Alagappan, L.; Chawla, K.; Toyama, N.; Zarnikau, J. Merit-order effects of renewable energy and price divergence in California’s day-ahead and real-time electricity markets. Energy Policy 2016, 92, 299–312. [Google Scholar] [CrossRef]
- Orans, R.; Olson, A.; Moore, J.; Hargreaves, J.; Jones, R.; Kwok, G.; Kahrl, F.; Woo, C.K. Energy Imbalance Market Benefits in the West: A Case Study of PacifiCorp and CAISO. Electr. J. 2013, 26, 26–36. [Google Scholar] [CrossRef]
- Sharma, S.; Annunzio, C.D.; Badri, S.; Huang, S.H.; Sarma, N.D.R.; Flores, I.; Blevins, B.; Surendran, R. ERCOT tools used to handle wind generation. In Proceedings of the 2012 IEEE Power and Energy Society General Meeting, San Diego, CA, USA, 22–26 July 2012; pp. 1–7. [Google Scholar]
- Ge, J.; Zhang, L. Experiences in ERCOT market of Texas and a good reference for electricity market in China. Electric. Power 2004, 12, 17–21. [Google Scholar]
- Wang, X.; Ma, L.; Qu, H. Market Mechanisms for Wind Generation in ERCOT Market and the Inspiration for China. Electric. Power. 2017, 50, 10–18+27. [Google Scholar]


| Aspect | China | Brazil | USA | Nordic Countries |
|---|---|---|---|---|
| 4.1. Planning and Regulatory Strategies | ||||
| 4.1.1. Demand-Guided Planning and Grid Enhancement. | Feasibility assessments for renewable energy deployment and alignment with actual demands. | Medium- and long-term contract markets. | State-level renewable energy quotas. | Data-driven cross-border energy trading. |
| 4.1.2. Long-Term Planning and New Energy Quotas. | Renewable energy electricity quota system. | Long-term planning framework. | State-level renewable energy quotas. | Strategic planning for the energy transition. |
| 4.1.3. Build a Strong Reliability Network Frame. | Enhancing grid structure and security. | High-voltage DC channel development. | Advanced grid management practices. | Expertise in high-voltage direct current. |
| 4.2. Local Consumption and Integration | ||||
| 4.2.1. Promote Nearby Consumption of Renewable Energy. | Nearby consumption and demand-side response. | Energy-intensive industries’ proximity. | Residential photovoltaic power generation. | Localized energy storage solutions. |
| 4.2.2. Build a Demonstration Zone for the Industry. | Development of renewable energy consumption industry zones. | Industry support and innovation. | PV roof programs for consumers. | Innovations in localized consumption. |
| 4.2.3. Build Energy Storage Equipment in Load Centers. | Configuring energy storage for user-side consumption. | Energy storage integration in load centers. | Residential photovoltaic power generation. | Experience in energy storage solutions. |
| 4.3. Market Mechanisms and Technological Advancements | ||||
| 4.3.1. Enhancing System Flexibility and Mechanism Design. | New power system, flexible resources, and adjustable load technologies. | Advanced system flexibility and virtual power plants. | Demand-side response initiatives. | Nordic innovation in energy management. |
| 4.3.2. Improve the Market Mechanism and Policy System. | Diversification of trading mechanisms and expansion of contract markets. | Market-oriented trading mechanisms. | Innovative trading patterns and scope. | Robust spot market and cross-border trading. |
Disclaimer/Publisher’s Note: The statements, opinions and data contained in all publications are solely those of the individual author(s) and contributor(s) and not of MDPI and/or the editor(s). MDPI and/or the editor(s) disclaim responsibility for any injury to people or property resulting from any ideas, methods, instructions or products referred to in the content. |
© 2023 by the authors. Licensee MDPI, Basel, Switzerland. This article is an open access article distributed under the terms and conditions of the Creative Commons Attribution (CC BY) license (https://creativecommons.org/licenses/by/4.0/).
Share and Cite
Liu, S.; Huang, Y.; Wang, Y.; Shao, Q.; Zhou, H.; Wang, J.; Chen, C. Incentive Mechanisms to Integrate More Renewable Energy in Electricity Markets in China. Energies 2023, 16, 6573. https://doi.org/10.3390/en16186573
Liu S, Huang Y, Wang Y, Shao Q, Zhou H, Wang J, Chen C. Incentive Mechanisms to Integrate More Renewable Energy in Electricity Markets in China. Energies. 2023; 16(18):6573. https://doi.org/10.3390/en16186573
Chicago/Turabian StyleLiu, Shuangquan, Yanxuan Huang, Yue Wang, Qizhuan Shao, Han Zhou, Jinwen Wang, and Cheng Chen. 2023. "Incentive Mechanisms to Integrate More Renewable Energy in Electricity Markets in China" Energies 16, no. 18: 6573. https://doi.org/10.3390/en16186573
APA StyleLiu, S., Huang, Y., Wang, Y., Shao, Q., Zhou, H., Wang, J., & Chen, C. (2023). Incentive Mechanisms to Integrate More Renewable Energy in Electricity Markets in China. Energies, 16(18), 6573. https://doi.org/10.3390/en16186573