1. Introduction
Optimizing the performance of an electric powertrain requires taking into account the different elements that interact with each other to ensure an overall optimum [
1,
2]. One of the most crucial components in an electric powertrain is the electric battery. It is the sole source of energy in a battery electric vehicle, providing the required autonomy for the vehicle, and is responsible for powering the electric traction motor, the vehicle’s thermal system, and low-power auxiliary tools.
The choice of battery composition, specifically the cathode material, plays a crucial role in determining the performance characteristics of the battery. NMC batteries (lithium nickel manganese cobalt oxide) offer a balanced combination of high energy density, good power output, and long cycle life. They are commonly used in electric vehicles and portable electronics [
3]. Batteries with higher nickel content, such as NMC 811, provide even higher energy density [
3]. However, factors such as cost and safety must be considered.
On the other hand, LFP batteries (lithium iron phosphate) are known for their excellent thermal stability, long cycle life, and high tolerance to overcharging or overdischarging. They are widely used in applications where safety and longevity are critical, such as electric buses and energy storage systems [
4].
LTO batteries (lithium titanate oxide) excel in exceptional power capability, rapid charging, and long cycle life, despite having a lower energy density compared to NMC or LFP batteries. They are suitable for applications requiring high-power bursts and frequent charging cycles, such as electric buses, forklifts, and some fast-charging stations [
5].
Lastly, LCO batteries (lithium cobalt oxide) provide high energy density but are more prone to thermal runaway and have a shorter cycle life compared to other lithium-ion chemistries. They are commonly used in consumer electronics, medical devices, and applications prioritizing high energy density [
6].
It is important to note that a battery is composed of various parts, including a cathode, anode, electrolyte, and separator. However, in this discussion, we have focused on the cathode composition, as it plays a significant role in determining battery performance.
Finite element modeling techniques are used to model the thermal behavior of batteries. A study by the IEEE Xplore Digital Library presented a finite element thermal model and simulation for a cylindrical Li-ion battery. The study showed that the finite element method is an effective tool for predicting the temperature distribution of the battery [
7].
Another study by the ASME Digital Collection presented a novel finite element model for simulating lithium-ion batteries. This model incorporates parameters for battery structure, thermodynamics, kinetics, and ageing effects. Experiments showed that the ageing-aware model predicts battery performance more accurately than previous models. By including ageing factors, the advanced model provides enhanced precision and realistic degradation modeling over battery lifetime [
8].
For other types of modeling, a study by Springer presented an optimization of thermal and structural design in lithium-ion batteries using multiphysics COMSOL and its equivalent electro-thermal model using Matlab version R2021b, developed by MathWorks, Inc., sourced from Laval, France. The study showed that the optimization of thermal and structural design can improve the performance of lithium-ion batteries [
9].
The benefits of using finite element modeling techniques include accurate prediction of temperature distribution and accurate prediction of battery performance. However, the finite element method requires a large amount of computational time [
7]. The benefits of using other types of modeling include improved performance of lithium-ion batteries. However, these models may not be as accurate as finite element models [
9,
10].
Several prior studies have developed calendar ageing models for lithium-ion batteries, but with certain limitations that this work aims to address. For example, Krupp et al. [
11] presented a model based on NMC cathode chemistry and tested at only two temperatures. Their model was fitted to a maximum of 422 days of calendar ageing data. As the reviewers noted, expanding the cathode chemistries, temperature ranges, and time durations tested would improve generalizability of the model. Redondo-Iglesias et al. [
12] also developed a calendar ageing model for NMC batteries using only accelerated ageing tests up to 250 days. Their model does not separate the different reversible and irreversible ageing mechanisms. However, a more mechanistic model validated across wider conditions and ageing durations would provide better robustness. The present study seeks to build on these and other prior works by expanding the modeling to more important ageing durations, and by providing more mechanistic insights into the calendar ageing processes. A rigorous model validated across broader ranges is needed to improve predictions over the entire service life in real-world applications.
In order to accurately capture battery behavior while maintaining computational efficiency for system-level optimization, an equivalent circuit model (ECM) approach is adopted. ECMs model battery dynamics through electrical components representing phenomena like charge transfer, diffusion, and self-discharge [
13,
14]. Unlike finite element methods, ECMs can simulate cell performance and degradation with reduced computational load, enabling integration into a full powertrain model. For this study’s focus on lifetime interactions between battery and other powertrain components, using an ECM-based battery model provides the required physics fidelity without the immense costs of finite element techniques when running lengthy optimization loops.
When optimizing the traction chain, we focus on optimizing two key parameters: the battery capacity and the motor’s geometrical parameters. There are other studies that have addressed powertrain optimization before [
15], which optimized the battery and motor analytically. However, both the battery and the motor model in that study considered ageing and thermal behavior, which will give unreal results due to neglecting thermal impact. In our study, multiphysical modeling is used for both the battery and the electric motor for the optimization; the battery capacity is optimized to strike a balance between providing sufficient energy for a desired range while minimizing size, weight, and cost [
16,
17]. The motor’s geometrical parameters, such as rotor/stator diameters and magnet size, are optimized to improve performance and efficiency while taking maintenance costs into account.
By optimizing these parameters, we aim to reduce the overall price of the drivetrain and maximize its lifespan. The objective is to achieve a cost-effective solution that offers both high performance and durability.
To ensure reliable performance, optimization should be performed not only for nominal operating points but also for a wide operating range that includes all possible scenarios that a driver can face while on a given mission. However, it is important to note that it may be possible that we cannot account for every scenario, and this way, the optimization may converge on a powertrain that is cheaper but does not fully satisfy all user usage cases (high speed in uphill slope, for example). For our study, we are optimizing the powertrain components to obtain 3 times the autonomy of the WLTP or the Artemis driving cycles while ensuring a high efficiency at their higher torque/speed points. Several studies in the literature have addressed the optimization of an electric battery from the point of view of the type, duration, and intensity of its recharging [
18,
19]. Other studies have addressed reducing the price of an electric vehicle by optimizing the size of the motor, the battery’s capacity, and the technology [
20]. However, these studies fail to consider an important criterion, which is the life of the components, mainly that of the battery, which constitutes a significant element in the total price of the vehicle.
This article addresses the issue of optimizing a powertrain by taking into account the electric motor and the battery, two components crucial in terms of price development and performance, and on which the rest of the powertrain depends. We will evaluate the many physical behaviors that can affect the two components’ performance and lifetimes and aim to maximize the life durations of the two components while minimizing their final costs as illustrated in
Figure 1.
We will then compare the different technologies of the components we are interested in and explain the choices made. The article will address the modeling of the components, highlighting the chosen modeling technique. We will then focus on the optimization algorithm used and its parameterization, concluding with the optimization results obtained and a comparison for two different WLTP and Artemis missions to confirm the stability and convergence of the optimization process.
2. Materials and Methods
2.1. Battery Technology Used in the Automobile Industry
Before embarking on the construction of the optimization process, it will indeed be interesting to look at the different technologies used in the powertrains of modern electric vehicles and to make a comparison between the different possibilities of possible choices. Among the battery choices examined, lithium technology is highlighted for electromobility [
21]. It has the highest specific power and energy density, as well as the lowest self-discharge rate [
22]. In addition, the voltage per cell is higher, which is a significant disadvantage due to its low overload tolerance. Therefore, for this type of battery, a specially designed charging method is required. As lithium ions are transported from the cathode to the anode (charge) and vice versa through a separator, lithium is the material basis of this type of battery (discharge). Lithium-ion (Li-Ion) batteries, on the other hand, can be divided into several types based on other factors, including the chemical composition of the cathode. According to the literature, the
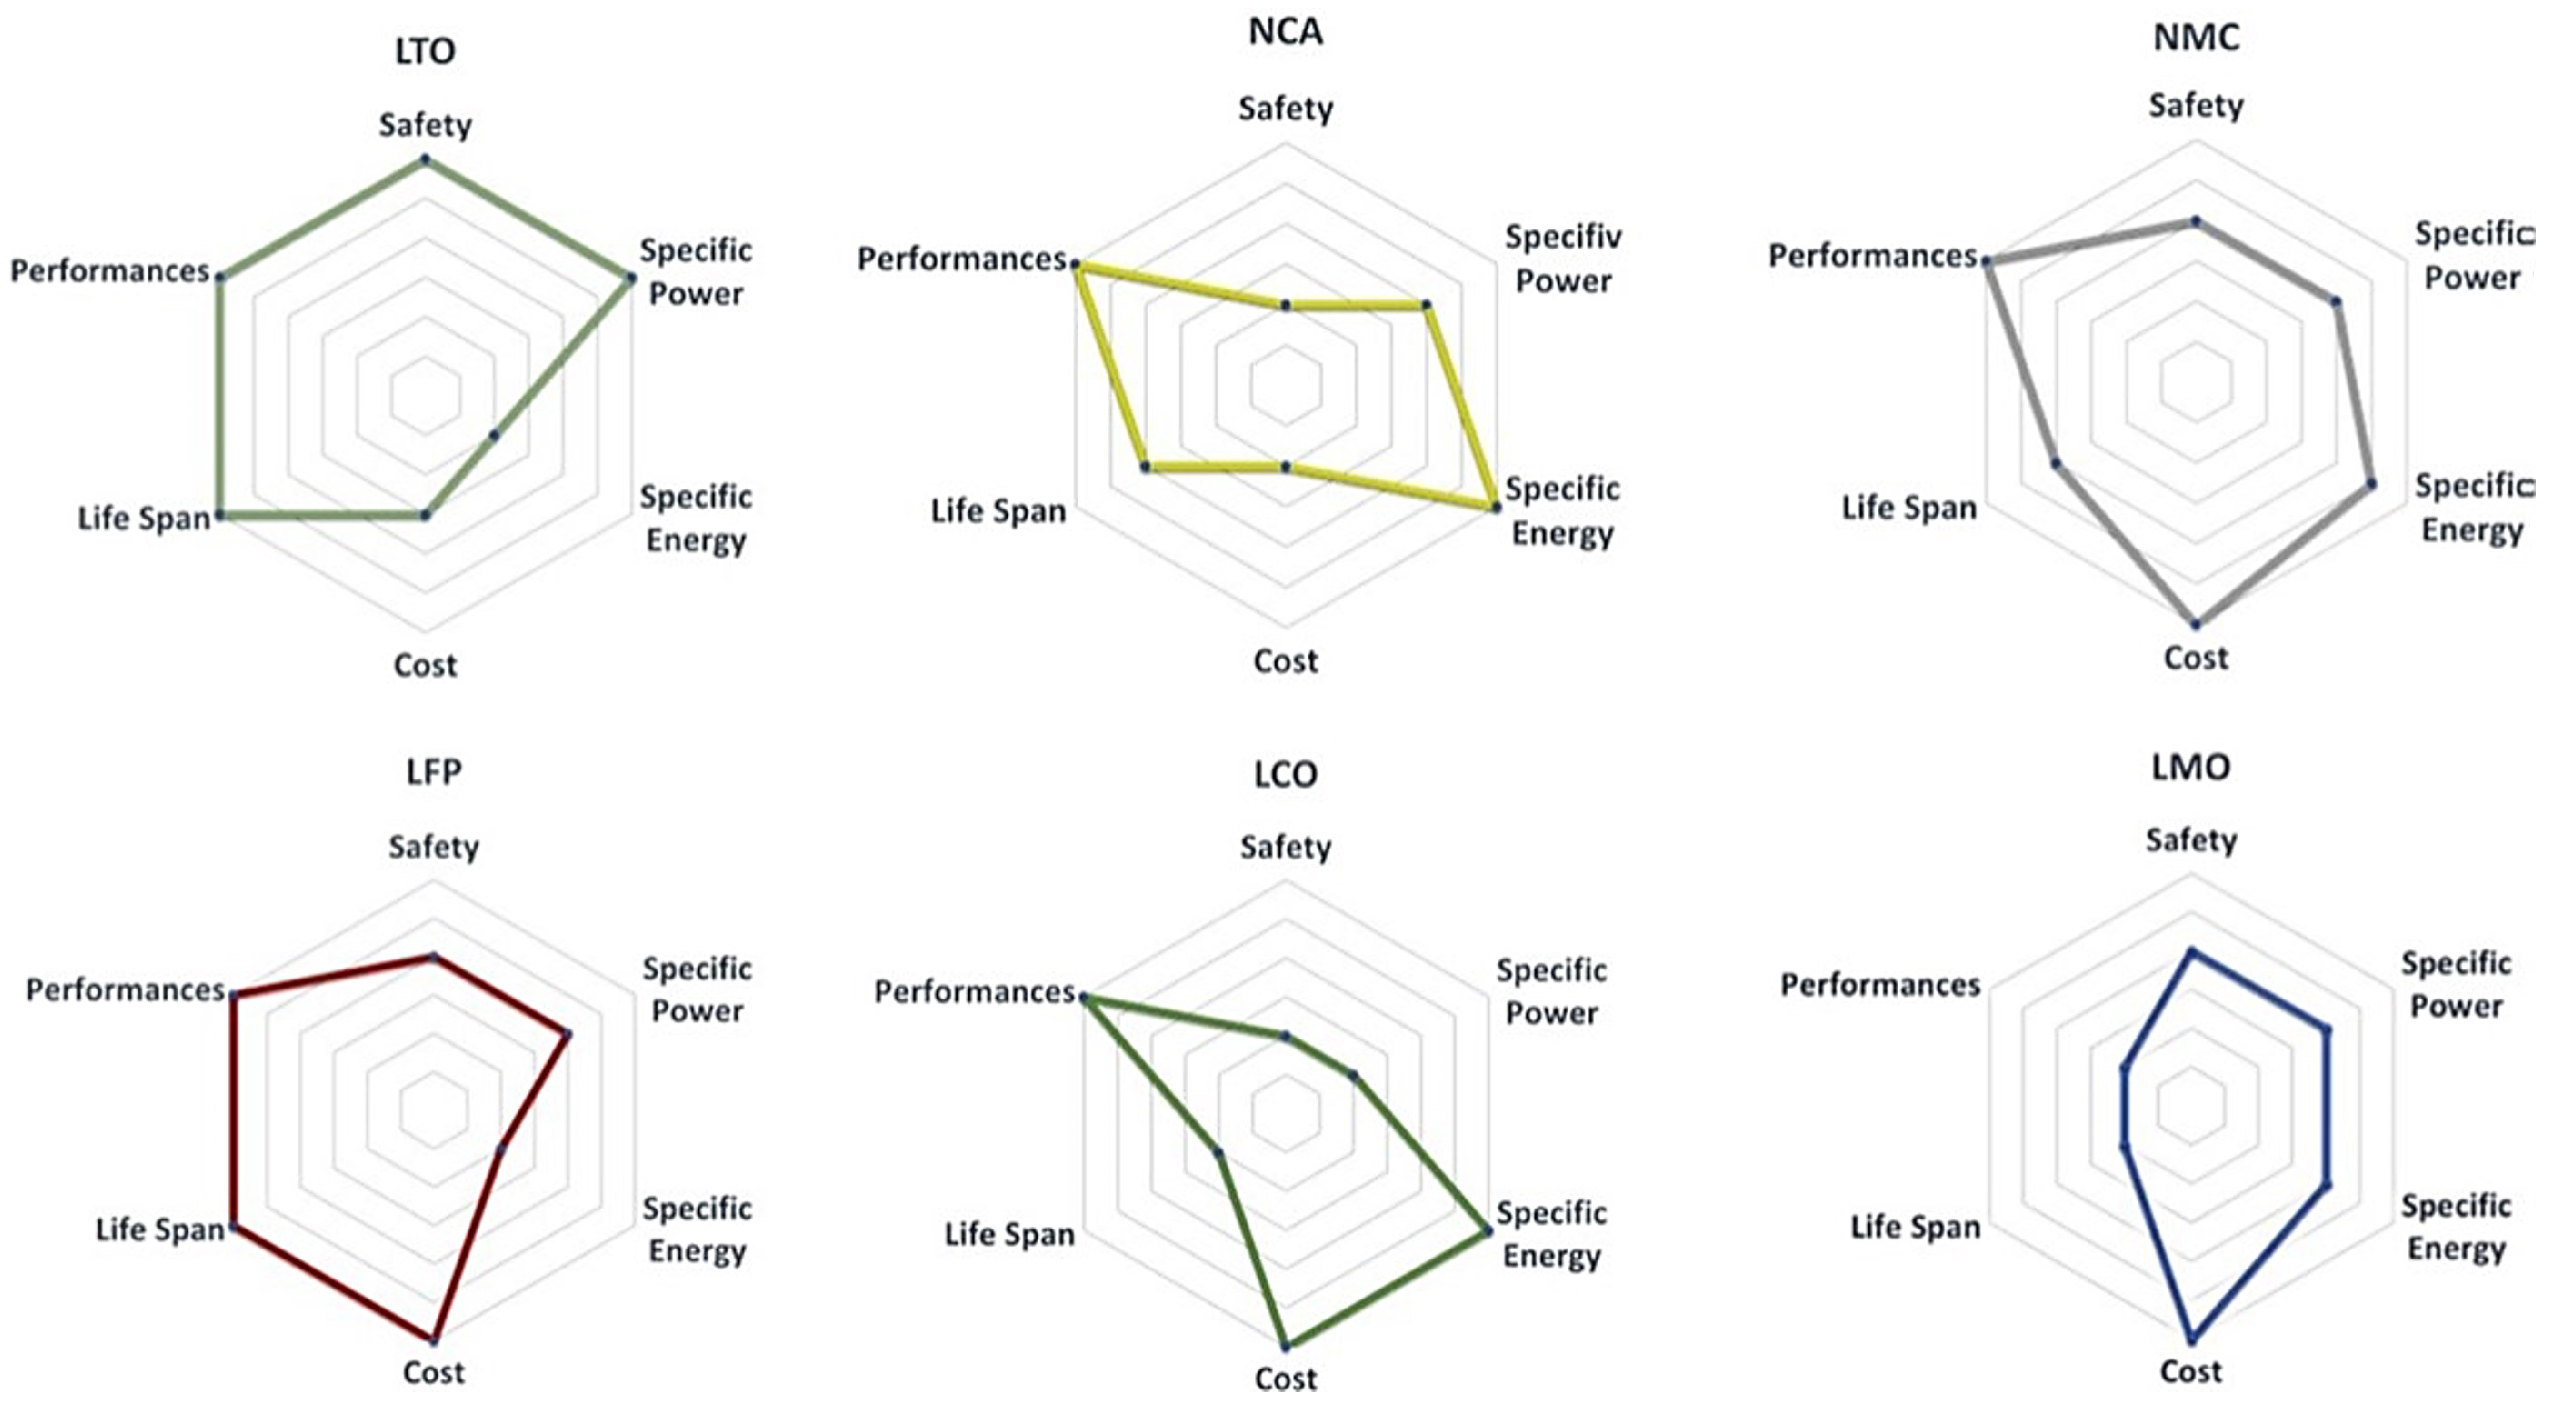
Figure 2 shows a comparison of the most well-known lithium-ion batteries in terms of performance, specific power, specific energy, cost, lifespan and safety (thermal runway, overcharge and overdischarge, short circuit tests).
In order to meet the specifications of maximum autonomy with a small size and good performance, we conducted an evaluation of different lithium-ion battery technologies illustrated in
Figure 2.
When considering the specific energy, which directly influences the range of an electric vehicle, we determined that NMC was the most suitable choice. NMC technology offers a balanced combination of high energy density and excellent performance, making it ideal for applications where maximizing the range is of utmost importance.
In contrast, although LCO technology exhibits high specific energy, its utilization is hindered by concerns regarding its toxicity. As a result, it is generally avoided in favor of other alternatives [
26].
While NCA technology also provides high specific energy, we ultimately selected NMC due to our industrial client specification notes and due to its superior balance between energy density, performance, and safety considerations. By choosing NMC, we were able to achieve the desired maximum autonomy in a compact size without compromising on performance or introducing potential toxicity concerns associated with LCO technology.
2.2. Comparison of the Main Motors Used in Electric Automotive
A comparison of the major electric motor designs employed in electric vehicles (EVs) is provided in
Table 1. The goal of this comparison is to analyze and contrast characteristics including efficiency, speed range, power density, peak torque, reliability, cost, and technological maturity. The motors examined represent the five predominant types used currently in EVs. Each attribute is graded on a scale of 1 (poor) to 5 (excellent) based on [
10,
27].
An analysis of
Table 1 indicates that the Brushless PM and PM SYN motors obtained the highest total scores of 35 points, reflecting their superior attributes across the factors examined. Both motors scored favorably in power density, efficiency, reliability, and technological maturity. However, the PM SYN motor received a slightly lower controllability and noise rating. Ranking second was the Induction motor, with a score of 35, owing to its high reliability, controllability, and ease of maintenance ratings. In contrast, the SR and PM DC motors achieved relatively lower overall scores of 30 and 25 points.
Despite its lower total score compared to other designs, the DC motor still retains certain advantages, such as cost-effectiveness, straightforward maintenance, and excellent controllability.
In summary, the optimal EV motor choice depends on intended application, cost considerations, and desired performance needs.
2.3. Critical Motor Features for the Automobile Industry
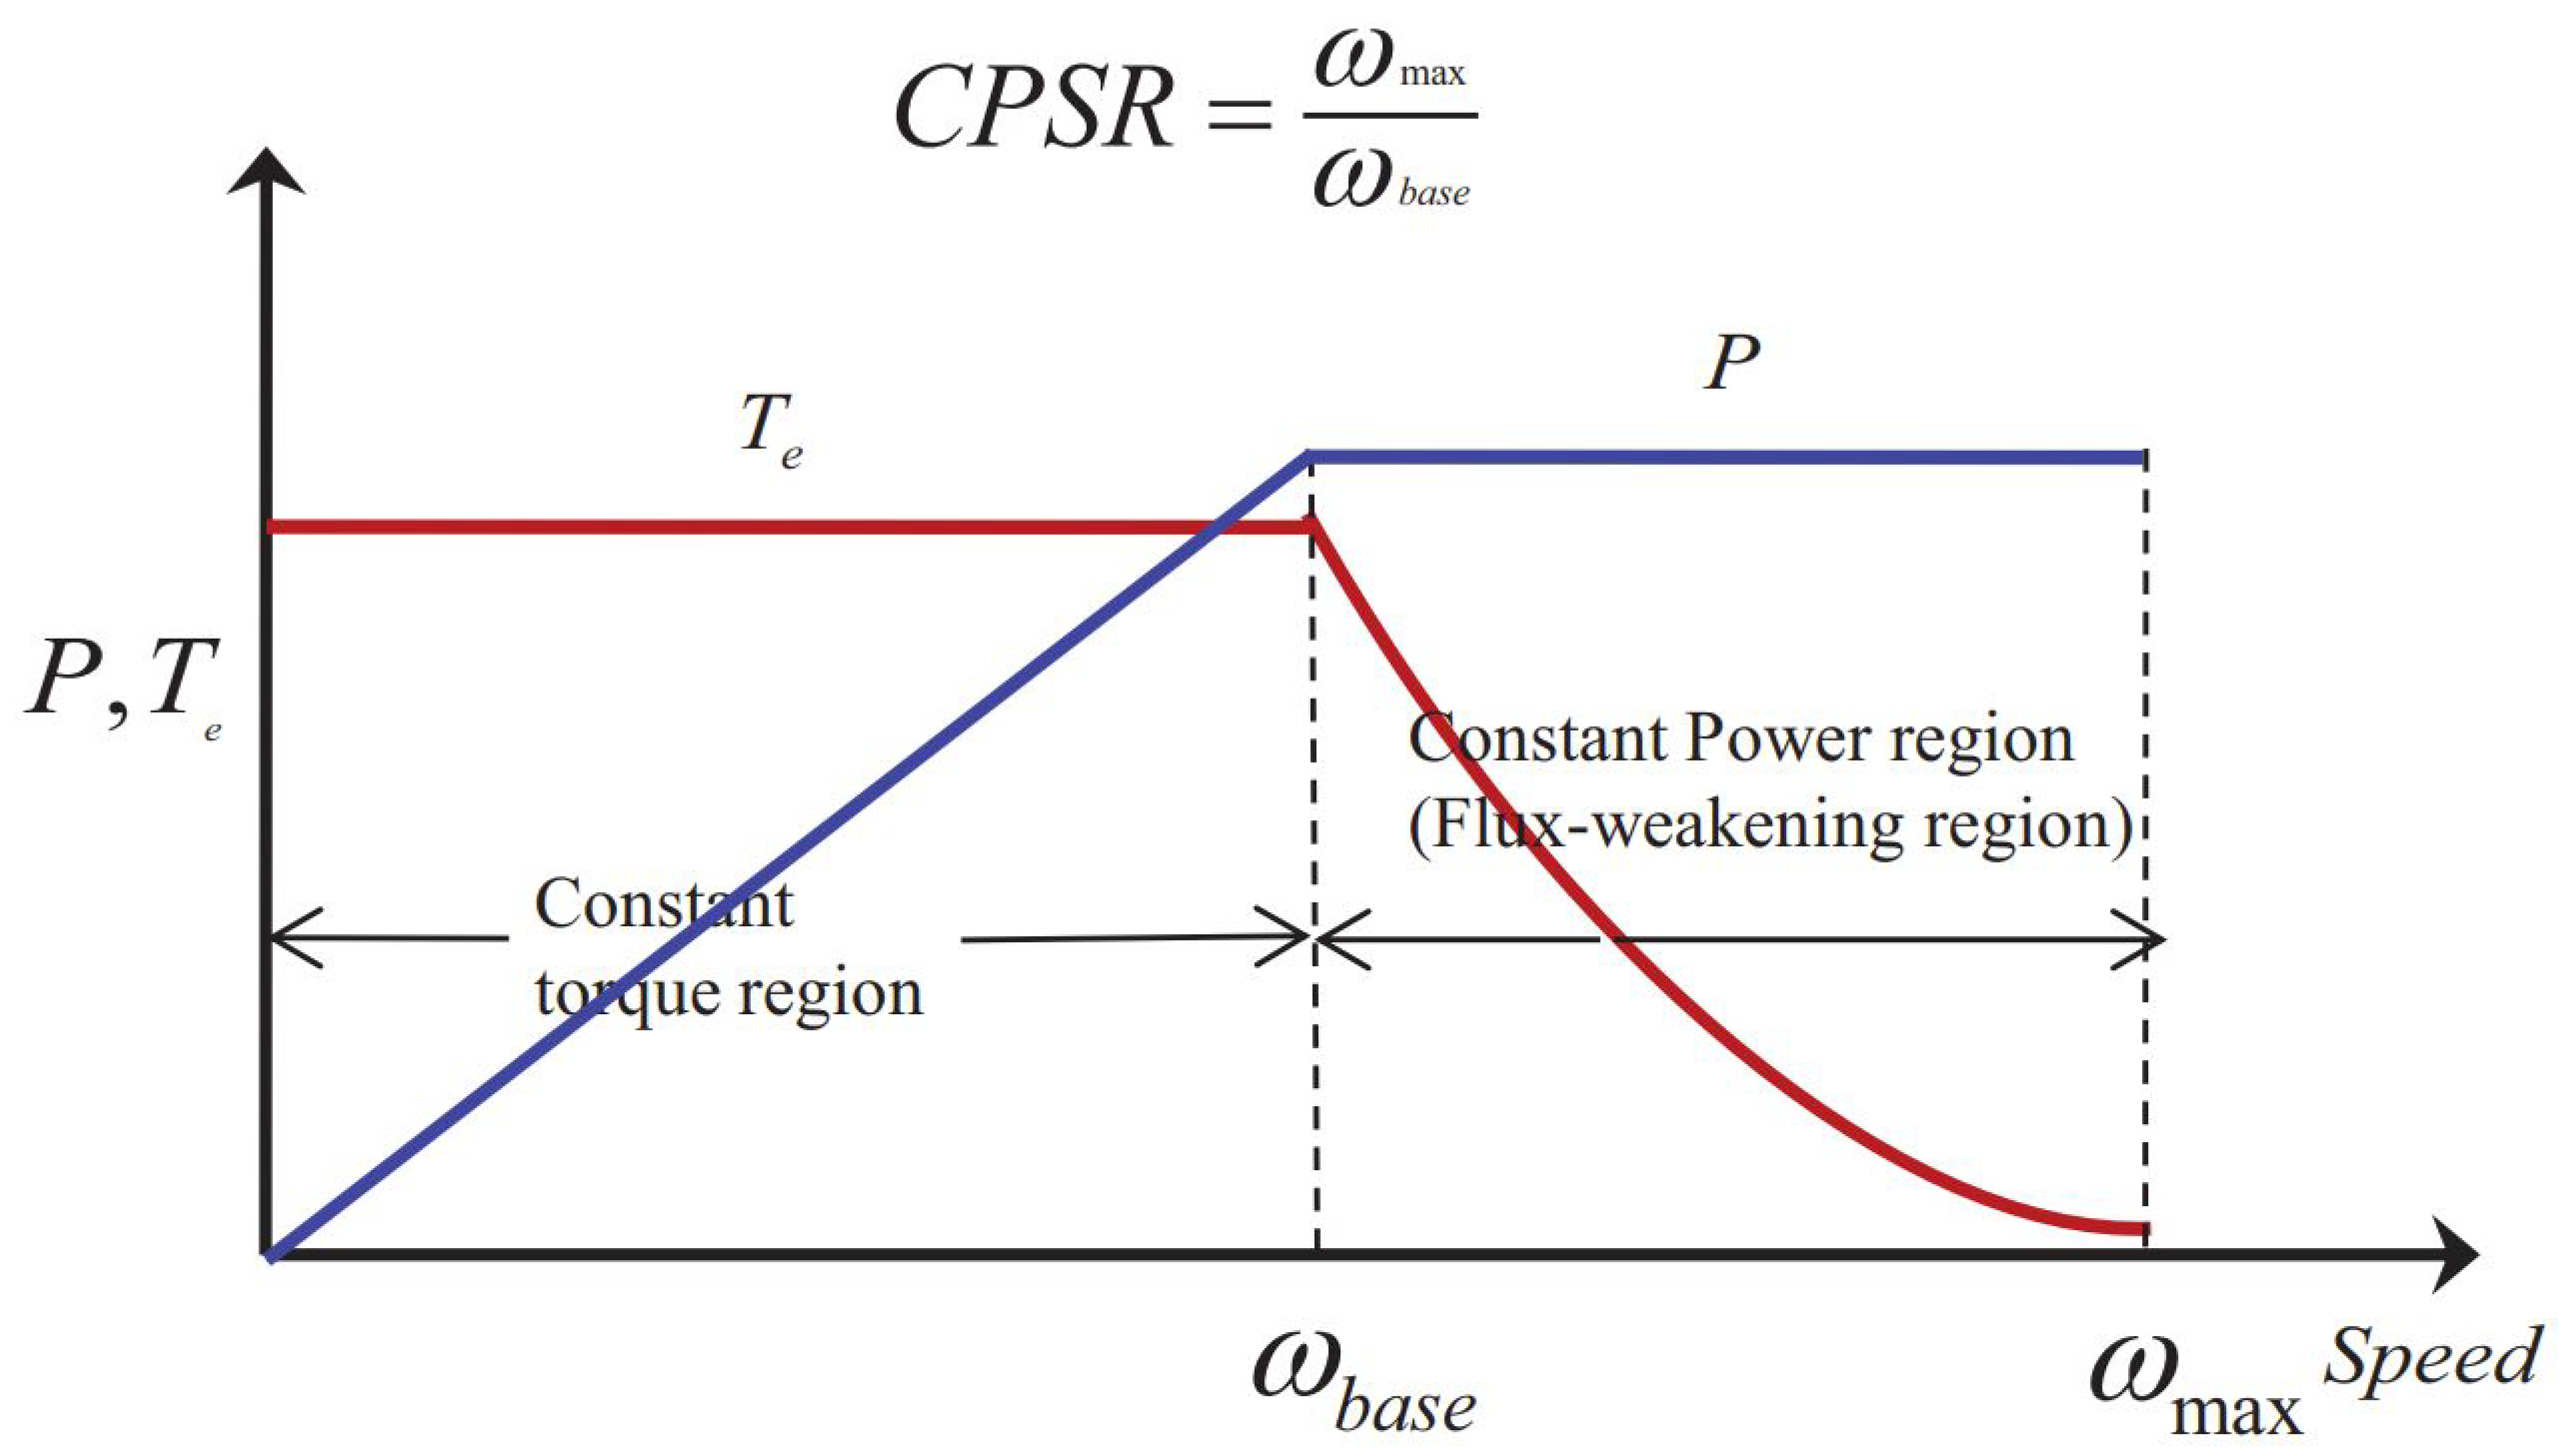
One crucial electric vehicle component is the electric drive, which must exhibit optimal speed-torque properties, as shown in
Figure 3. This entails two operating zones: constant torque and constant power (labeled CPSR). Maximum torque is vital for starting, accelerating, and inclines. Thus, the motor functions in the constant torque region. Here, armature voltage is varied to regulate speed, while keeping armature and excitation currents fixed to generate the required torque. Above base speed, the motor switches to the constant power zone.
In the constant power region, excitation current is adjusted to control velocity. Meanwhile, armature voltage and current remain at nominal values. As excitation current decreases, speed rises so that counter electromotive force stays nearly constant, resulting in steady power output. As described in [
28], these optimized speed–torque characteristics are essential for electric vehicle motors.
The torque required to rotate the wheels of electric vehicles (EVs) is supplied by electric motors. Thus, the capabilities of EVs depend greatly on their motors, which need to have these features [
29,
30]:
High power generation relative to motor size (power density);
Preserving high energy efficiency over a wide range of velocity and torque;
Quick reaction to variations in velocity or torque (dynamic response);
Dependable operation under different conditions;
The constant torque and steady power modes must work over a broad velocity range, with high torque at low rpm and great power at high rpm;
Affordable cost.
Advancements in high-power converters, sophisticated control methods, and high-energy permanent magnet materials have led to improvements in electric motor capabilities. As a result, numerous motor types may now be employed in EVs. However, the most widely adopted options are those discussed in the following section.
2.4. Characteristics of the Chosen Vehicle
This research utilized the Bluecar Beloré as the basis for the dynamic vehicle model. Specific details of the electric vehicle incorporated into the model can be found in
Table 2.
2.4.1. Features of the Chosen Driving Patterns and Modes
Test cycles with standardized speed and elevation vectors were used to compare pollution emissions from different cars on the same foundation. Following this initial application, it was discovered that the same cycles are useful for comparing fuel economy. The duty cycles are implemented on roller test benches in real-world conditions, with the load on the wheels chosen to simulate the vehicle’s energy losses throughout the driving of this specific cycle. These tests are carried out in tightly controlled environments (temperature, humidity) and according to strict procedures in order to achieve exactly defined starting thermal conditions for the vehicle (hot soaking, cold soaking, and so on).
For this study, two significant driving cycles with real-world characteristics are considered.
WLTP (Worldwide Harmonised Light Vehicles Test Procedure): The previous test driving cycle standard, the NEDC, was based on theoretical speed variations, but the WLTP cycle, which it replaced, was produced using driving data captured in real-world scenarios and collected globally. As a result, this new driving cycle best represents the conditions that an average driver may face. To simulate various driving settings such as urban, rural, extra-urban, and highways, the WLTP driving cycle is divided into four distinct portions with varying average speeds according to these specifications:
In urban areas, the average speed typically ranges from 20 to 50 km/h, with acceleration values between 0.5 to 3 m/s2.
In rural areas, the average speed is higher, ranging from 60 to 90 km/h, with acceleration values between 1 to 4 m/s2.
Extra-urban settings, such as highways or intercity roads, have higher average speeds ranging from 80 to 120 km/h or more, with acceleration values between 2 to 5 m/s2.
Artemis (CADC): Artemis Common Driving Cycles are roller dynamometer processes established as part of the European Artemis project) that are based on statistical analysis of a larger library of European driving models in real-world settings. There are three driving patterns in the cycles: (1) urban, (2) country road, and (3) highway. The motorway cycle comes in two models, with top speeds of 130 and 150 km/h. The characteristics of the two driving cycles are shown in
Figure 4.
2.4.2. Attributes of the Chosen Battery Technologies
In our research, we utilized a lithium-ion battery with an NMC cathode. Specifically, we employed NMC 622 as the cathode material. NMC cathodes encompass a wide range of compositions, each with distinct electrochemical properties depending on the specific ratio of nickel, manganese, and cobalt.
The selection of NMC 622 was based on careful considerations aimed at achieving optimal battery performance for electric vehicle applications. NMC 622 consists of approximately 60% nickel, 20% manganese, and 20% cobalt. This composition was chosen for several reasons:
High Energy Density: The inclusion of significant nickel content (60%) in NMC 622 enables the battery to store a higher amount of energy per unit weight. This results in improved energy density, allowing electric vehicles to achieve longer driving ranges.
Enhanced Stability: The presence of 20% manganese in NMC 622 contributes to the stability and durability of the battery. Manganese helps mitigate capacity degradation during repeated charge and discharge cycles, leading to improved cycling stability and an extended lifespan for the battery.
Safety Considerations: The cobalt content in NMC cathodes can impact the thermal stability and safety of the battery. By limiting the cobalt content to 20% in NMC 622, we aimed to strike a balance between high-performance characteristics and reduced safety risks, ensuring the overall safety of the battery system.
Cost Optimization: Cobalt is a relatively expensive material. By minimizing its proportion in the NMC composition, we sought to optimize cost-effectiveness without compromising the desired electrochemical properties.
The battery electrical characteristics and specifications are listed in
Table 3.
2.4.3. Chosen Electric Motor Technology
A permanent magnet synchronous motor (PMSM) was selected for this study owing to its ruggedness, minimal maintenance needs, and superior performance across a wide speed–torque range. More precisely, the motor design examined was the proven Toyota Prius hybrid vehicle geometry, the motor geometry is illustrated in
Figure 5.
2.5. Vehicle Dynamic Model
The vehicle’s powertrain produces energy that is stored in the vehicle itself; however, the various resistant forces consume this stored energy.
Energy can be stored in different forms:
At the time of acceleration, it is stored as kinetic energy;
When surpassing altitudes beyond the reference level, potential energy is accumulated.
When driving the vehicle, the mechanical energy “ consumed” depends on three effects:
Influence of aerodynamic drag;
Impact of rolling resistance;
Energy dissipation during braking.
The behavior of the road vehicle can be articulated using Equation (
1), derived from Newton’s second law:
The forces implicated in the vehicle momentum are represented in
Figure 6, where
represents aerodynamic friction forces,
denotes rolling resistance,
accounts for gravitational forces when driving on non-flat roads, and all other non-repetitive effects are contained in
. The pulling force is calculated as the drive motor force minus the force used to accelerate rotating powertrain components and minus any powertrain frictional losses.
2.6. Battery Sizing and Modeling
2.6.1. Battery Sizing Algorithm
To tackle the constraints imposed by battery characteristics and driving patterns, a study was undertaken to design a system addressing these limitations. The goal is to ascertain suitable storage capacity by following key steps.
Firstly, the power and energy needs for electric vehicle operation are projected using a dynamic model, omitting storage weight. Hence, the total weight (
M) only accounts for vehicle mass (
), excluding battery weight (
). Further aspects of appropriate storage sizing will be elaborated in upcoming sections.
Initial Battery Sizing
The first step of the sizing algorithm entails calculating the number of cells in series, represented as
. This can be achieved using equations that leverage the cell voltage (
) and bus voltage (
). The bus voltage value is chosen based on particular system needs.
Calculating the number of parallel cells necessitates using an equation incorporating the chosen battery’s specific energy (
), weight (
), and internal resistance (
). To account for battery weight during sizing, a 40% increase is applied to the weight, as outlined in the reference [
33].
Moreover, the number of parallel branches is derived from the solution of the quadratic equation:
The solution to this equation and the number of parallel branches is equal to:
represents the number of battery cells in parallel.
represents the energy consumption of the electric vehicle (EV) in Watt-hours per kilometer.
denotes the number of battery cells in series.
is the nominal energy capacity of an individual battery cell in Watt-hours.
represents the weight of a single battery cell in kilograms.
refers to the internal resistance of the battery pack in ohms.
represents the nominal voltage of a single battery cell in volts.
denotes the bus voltage in volts.
Revising the Vehicle’s Mass and Predicting Battery Energy Consumption
By calculating the series and parallel configurations of the cells, the vehicle weight can be adjusted excluding the mass of the storage system.
Additionally, sizing the battery involves establishing its energy capacity, calculated taking into account the depth of discharge (DOD) and initial battery capacity. The equation for determining battery capacity is:
Once the vehicle’s weight has been modified, the energy and power requirements for the cycle must be recalculated, taking into account the weight of the storage system. This can be accomplished by using the following equation:
represents the vehicle’s mass-specific energy consumption, which is the energy required per unit of mass to move the vehicle.
g represents the acceleration due to gravity.
Determining Battery Size with Consideration for Weight
The final step in the battery sizing process involves reiterating the computations, now including storage system weight and its influence on power/energy needs. This iterative procedure continues until set criteria are fulfilled, such as battery capacity being sufficient for cycle energy requirements, and weight being within maximum vehicle load. By pursuing these steps, a suitably sized battery meeting driving cycle demands and technology constraints can be chosen.
2.6.2. Battery Ageing Testbench
Our battery ageing test bench shown in
Figure 7 serves as a comprehensive platform for conducting precise and controlled ageing cycling and calendar cycling tests on battery cells. It incorporates advanced technologies and tools to ensure accurate and reliable results.
Control System: National Instrument CRio 9024: The National Instrument CompactRIO 9024 control system is specifically utilized to control the converter and execute the cycling current profile during our battery ageing test. This specialized hardware, in combination with the LabVIEW software, enables precise command over the converter’s operation, allowing it to follow the designated current profile accurately throughout the testing procedure. This level of control ensures the desired current cycling is achieved in a controlled and consistent manner.
Ageing Cycling: Simulating Real-World Usage: The test bench enables ageing cycling by subjecting the battery cells to repetitive charging and discharging cycles that emulate real-world usage patterns. This process allows us to analyze the battery’s performance degradation over time, helping us evaluate its long-term reliability.
Calendar Cycling: Evaluating Time-Based Effects: In addition to ageing cycling, our test bench supports calendar cycling. By imposing different time-based conditions on the battery cells, we can assess the effects of prolonged periods of inactivity on the battery’s performance and ageing characteristics.
Multibranch Converter for Precise Current Generation: To generate the cycling current profile conforming to automotive industry norms like CEI 6266, we employ a multibranch converter within the test bench. This converter ensures accurate and controlled current flow during the cycling process.
Temperature Control: Maintaining Ambient Conditions: Maintaining a consistent ambient temperature is crucial for reliable battery testing. The battery cells are placed within a controlled temperature chamber, maintaining an ambient temperature of 24 degrees Celsius while allowing for a wide temperature range from 0 to 100 degrees Celsius.
Real-Time Data Acquisition: Voltage and Temperature Sensors: To monitor the battery’s performance during the tests, voltage and temperature sensors are integrated directly onto the battery cells. These sensors enable real-time data acquisition, providing valuable insights into the battery’s behavior and characteristics throughout the cycling processes.
2.6.3. Multiphysics Battery Modeling
The battery’s health can be predicted by examining internal parameter changes during usage or rest periods.
In this context, a multiphysics model can monitor diverse phenomena effects throughout a driving cycle (charge/discharge) considering the storage system’s environment, like temperature and air exchange.
Two sub-models are required to assess battery temperature and SOC:
An electrical model accounting for electrical phenomena during the cycle;
A thermal model estimating storage temperature using external conditions (ambient temperature) and internal parameter variations from electrical phenomena (charge/discharge).
Combining these sub-models enables the estimation of battery health degradation by re-evaluating electrical parameters each iteration over the driving cycle. Multiphysics model interaction and data exchange are depicted in
Figure 8; all thermal, electrical and ageing models are created on MATLAB Simulink environment using equivalent electrical circuit modeling type, as explained in the following sections.
Various electrical, thermal, and ageing models exist, from most general to application-specific. With numerous accumulator, format, energy, and composition technologies, tailored models are often needed. Here, the goal is simulating NMC electrochemical cells using a multiphysics approach.
Nicolas Damay’s work deals with the advanced thermal study of an accumulator identical to that of our case study [
34]. In addition to this method also used in other articles [
35], different approaches for the thermal modeling of accumulators are possible, such as partial differential equations [
36], linear systems with varying parameters, or equivalent electrical circuits [
37,
38].
As mentioned earlier, instead of using a complicated and advanced thermal model, which would make our overall modeling more complex and exponentially increase our simulation time, we opted for an equivalent electrical circuit modeling approach. This involves representing thermal sources as power sources and convection and conduction as capacitors and resistances. This will give us a more flexible model that produces results similar to experimental results quickly.
The parameters for various battery types were obtained through optimization to minimize discrepancies compared to previously collected experimental data, as depicted in
Figure 9. This optimization process was executed using the built-in optimization toolbox within the Matlab library. The primary objective was to minimize the sum of squared errors between the model’s predictions and the actual experimental data, as represented by the following equation:
Electrical Model
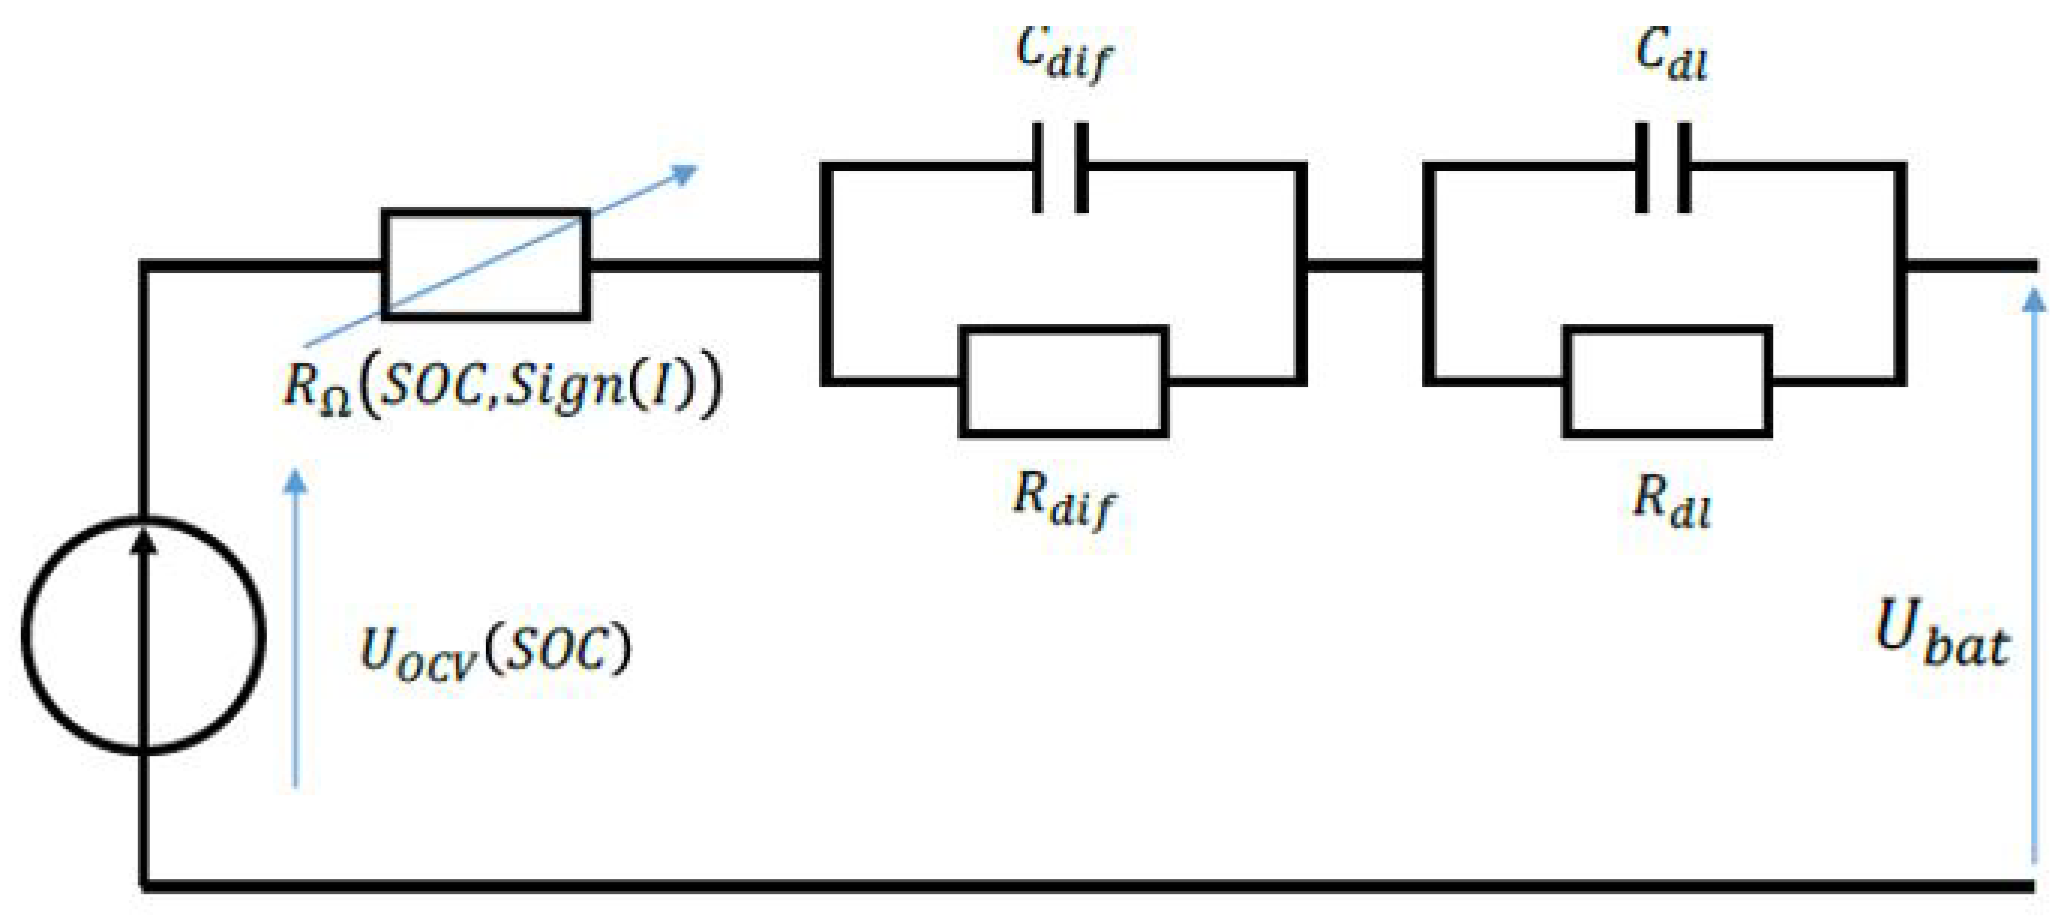
The modeling of the electrical phenomena of the battery is carried out by building an electrical model with an equivalent electrical circuit [
39,
40] (
Figure 10), comprising a voltage source (
), an internal resistance (
), and two parallel RC branches (
,
) and (
,
), which, respectively, model the double-layer effect and the diffusion of ions in the battery. The characteristic parameters of the model are deduced based on experimental results already acquired.
The voltage source corresponds to the no-load amplitude of the voltage at the electrochemical cell and depends on the SOC, as described in Equation (
16).
: the ith optimization parameter (no unit);
hl: the ith exponential time constant parameter (no unit);
SOC: state of charge (percent);
: battery open circuit voltage (volts).
The behavior of the internal resistance and the double layer behavior and the diffusive behavior of the battery cell are, respectively, characterized by (Rdll, Cdll), and can be described by equations from (
17)–(
21).
Electrical Model Parameter Identification
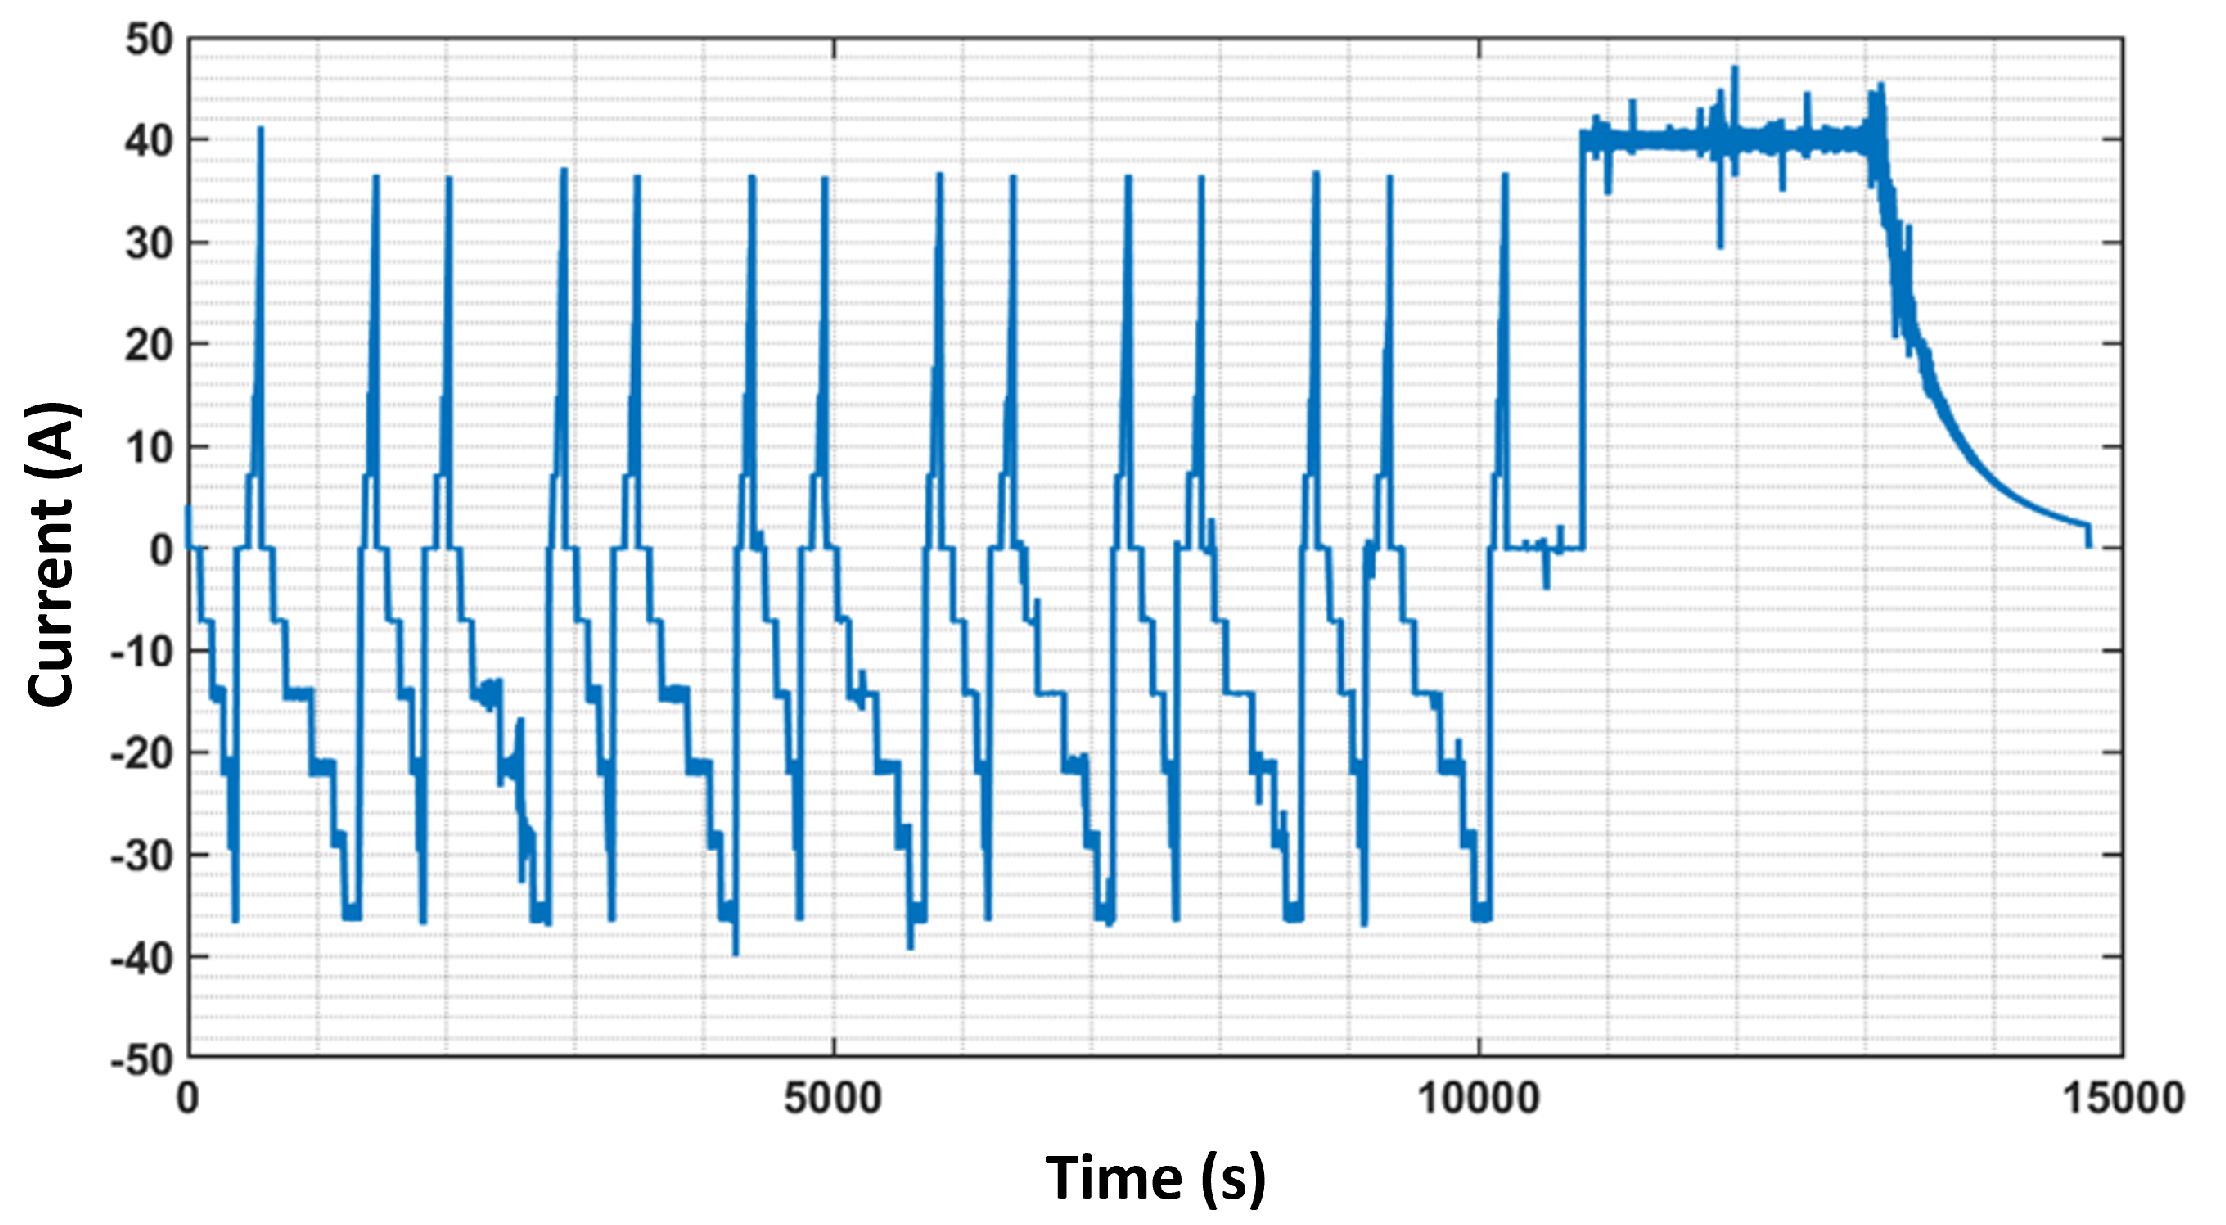
The process of identifying parameters remained uniform throughout the experiments. In order to assess the performance of the battery models, the batteries underwent a series of charge/discharge cycling tests (
Figure 11. During these tests, the voltages and states of charge of the batteries were monitored and recorded for comparison with the model outputs. The various cycling profiles for the three batteries under investigation are depicted in the figures below.
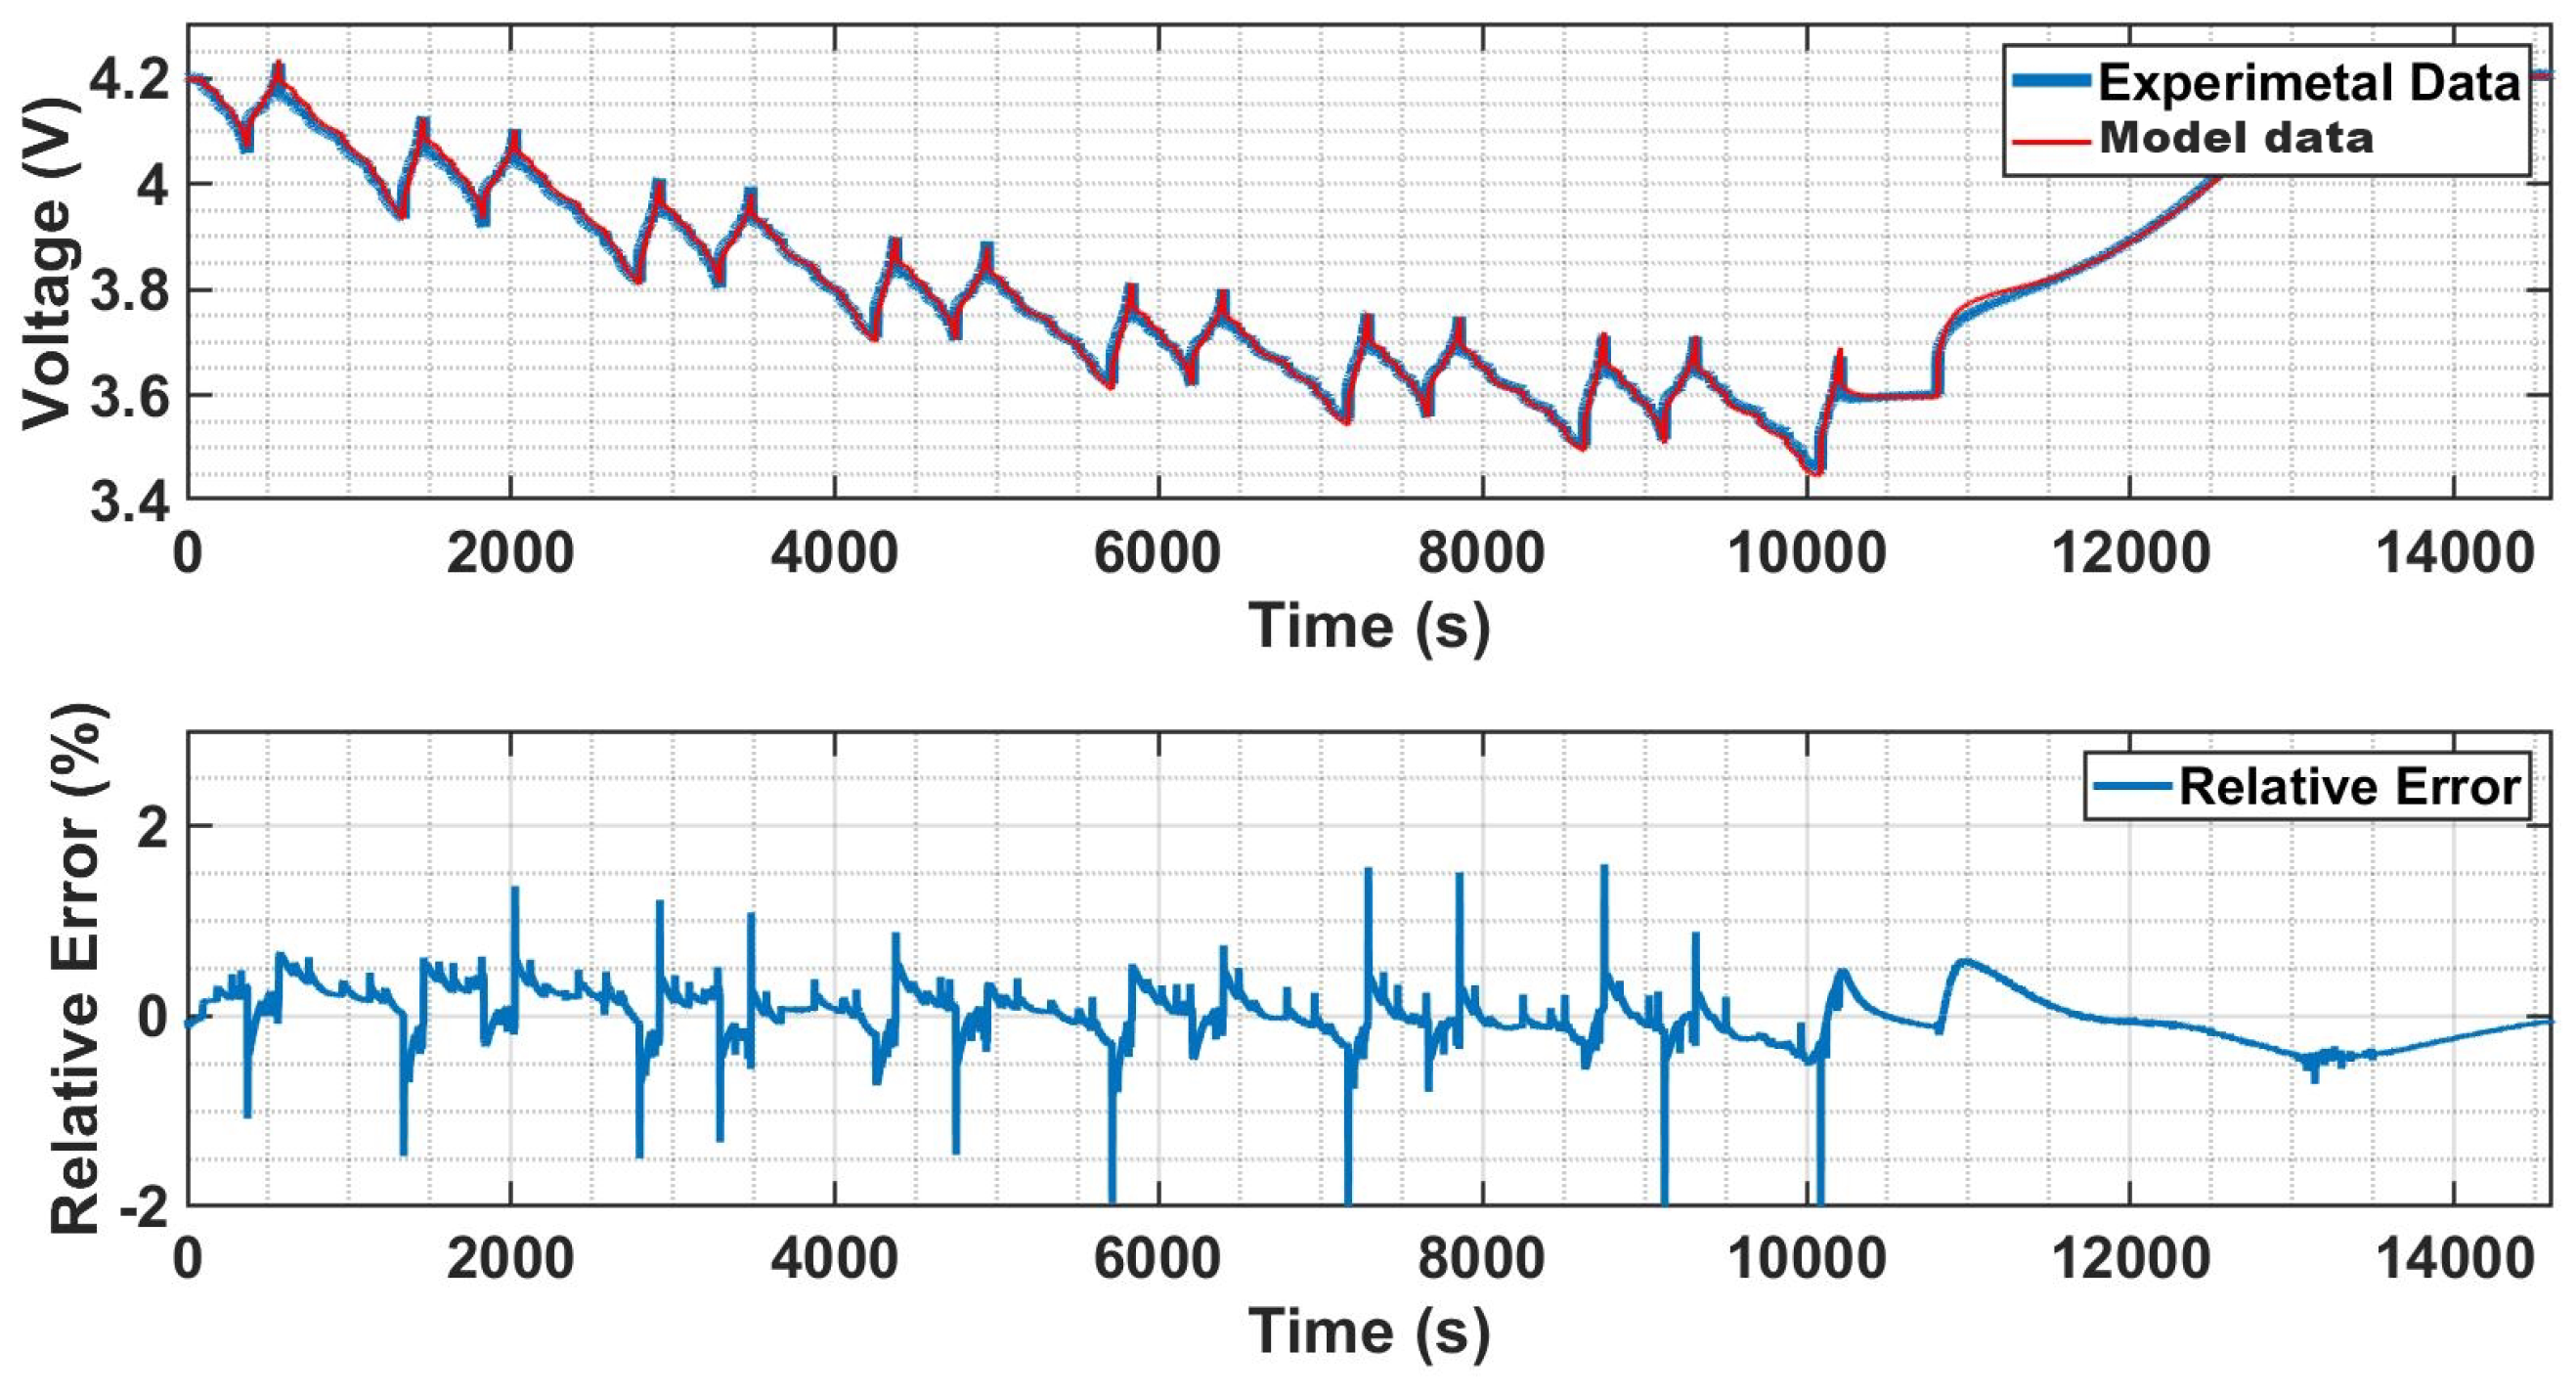
The voltage of the NMC battery for both high energy is illustrated in the
Figure 12. This figure depicts the voltage values obtained during the charging/discharging cycle of the batteries. The voltage is an important parameter that affects the performance and behavior of the battery, as it indicates the energy level of the battery at a given moment. By comparing the voltage values obtained from the actual batteries with those predicted by the model, the accuracy of the model can be assessed (
Figure 12) and the optimization of the model parameters can be performed.
The final optimization parameter values for the battery electrical model can be found in the
Table 4.
Thermal Model
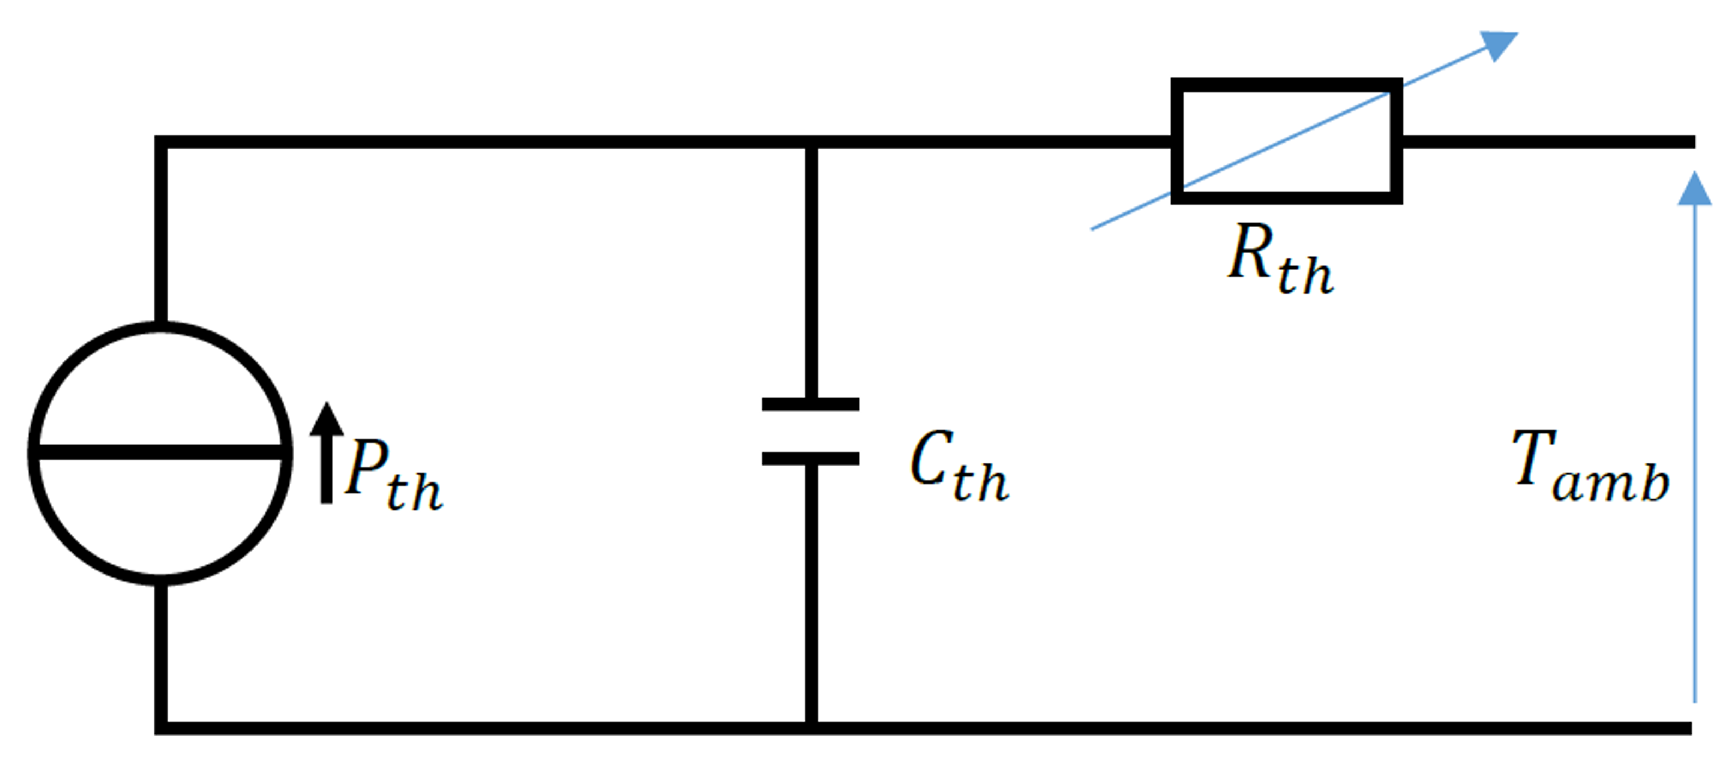
In our study, we adopted an equivalent electric circuit to model the thermal behavior of a lithium-ion battery; the model is illustrated in
Figure 13. This method enables us to precisely predict the internal temperature of the battery by taking into account both the power sources and losses within the system.
Our electrical model was used to estimate both reversible and irreversible heat losses in order to better understand the battery’s thermal behavior. Reversible heat losses are associated with the entropy of a system, which is the amount of disorder or randomness in a system. The reversible heat losses can be calculated using the second part of Equation (
22) and are considered to be heat losses that could potentially be recovered [
41,
42]. On the other hand, irreversible heat losses result in the generation of joules of heat, which cannot be recovered. Both these heat losses then form the power sources
estimated using Equation (
22) in our equivalent circuit.
Furthermore, our equivalent circuit incorporates a thermal capacity
and a thermal resistance
, both of which serve as the optimization parameters for this model. It is imperative that these parameters be accurately identified to enable the model to accurately replicate experimental results. The thermal capacity represents the ability of the battery to store and accumulate heat, which is necessary for accurately modeling the battery’s thermal behavior [
41]. It takes into account both the reversible and irreversible heat generation, including the heat generated by the power sources and the rate at which heat is transferred within the battery. The thermal resistance represents the rate at which heat is transferred through the battery and is also influenced by both reversible and irreversible heat generation. On the other hand, the thermal resistance represents the insulation effect of the battery, limiting the transfer of heat outside the system. It is essential for modeling the temperature rise within the battery, which can impact its performance and lifespan. By incorporating both the thermal capacity and thermal resistance in our equivalent circuit, we can gain a better understanding of the battery’s thermal behavior and optimize its operation.
: thermal power (watts);
I: current (amperes);
U: battery open circuit voltage (volts);
V: battery internal voltage (volts);
T: temperature (Kelvin);
: the derivative of open circuit voltage U with respect to temperature T (volts/Kelvin).
Thermal Model Parameter Identification
By utilizing the voltage and cycling current of the electrical model, it is possible to estimate the heat losses and subsequently incorporate them into the thermal model for temperature estimation, as in
Figure 14. This process is vital for comprehending the thermal characteristics, as temperature can significantly impact component performance and longevity. Precise temperature estimation can also facilitate designing suitable cooling methods to prevent overheating and potential damage.
The NMC battery underwent concurrent electrical and thermal analysis using identical cycling profiles from the previous section. This enabled a comprehensive examination of battery behavior under cycling conditions, both electrically and thermally. By inspecting the voltage and current from the cycled battery model, heat losses could be determined and input into the thermal model to estimate operational temperature distribution.
The experimentally obtained temperature data are presented in the following figure.
Below in
Table 5 are the values of the optimization parameters calculated for the battery thermal model.
Ageing Model
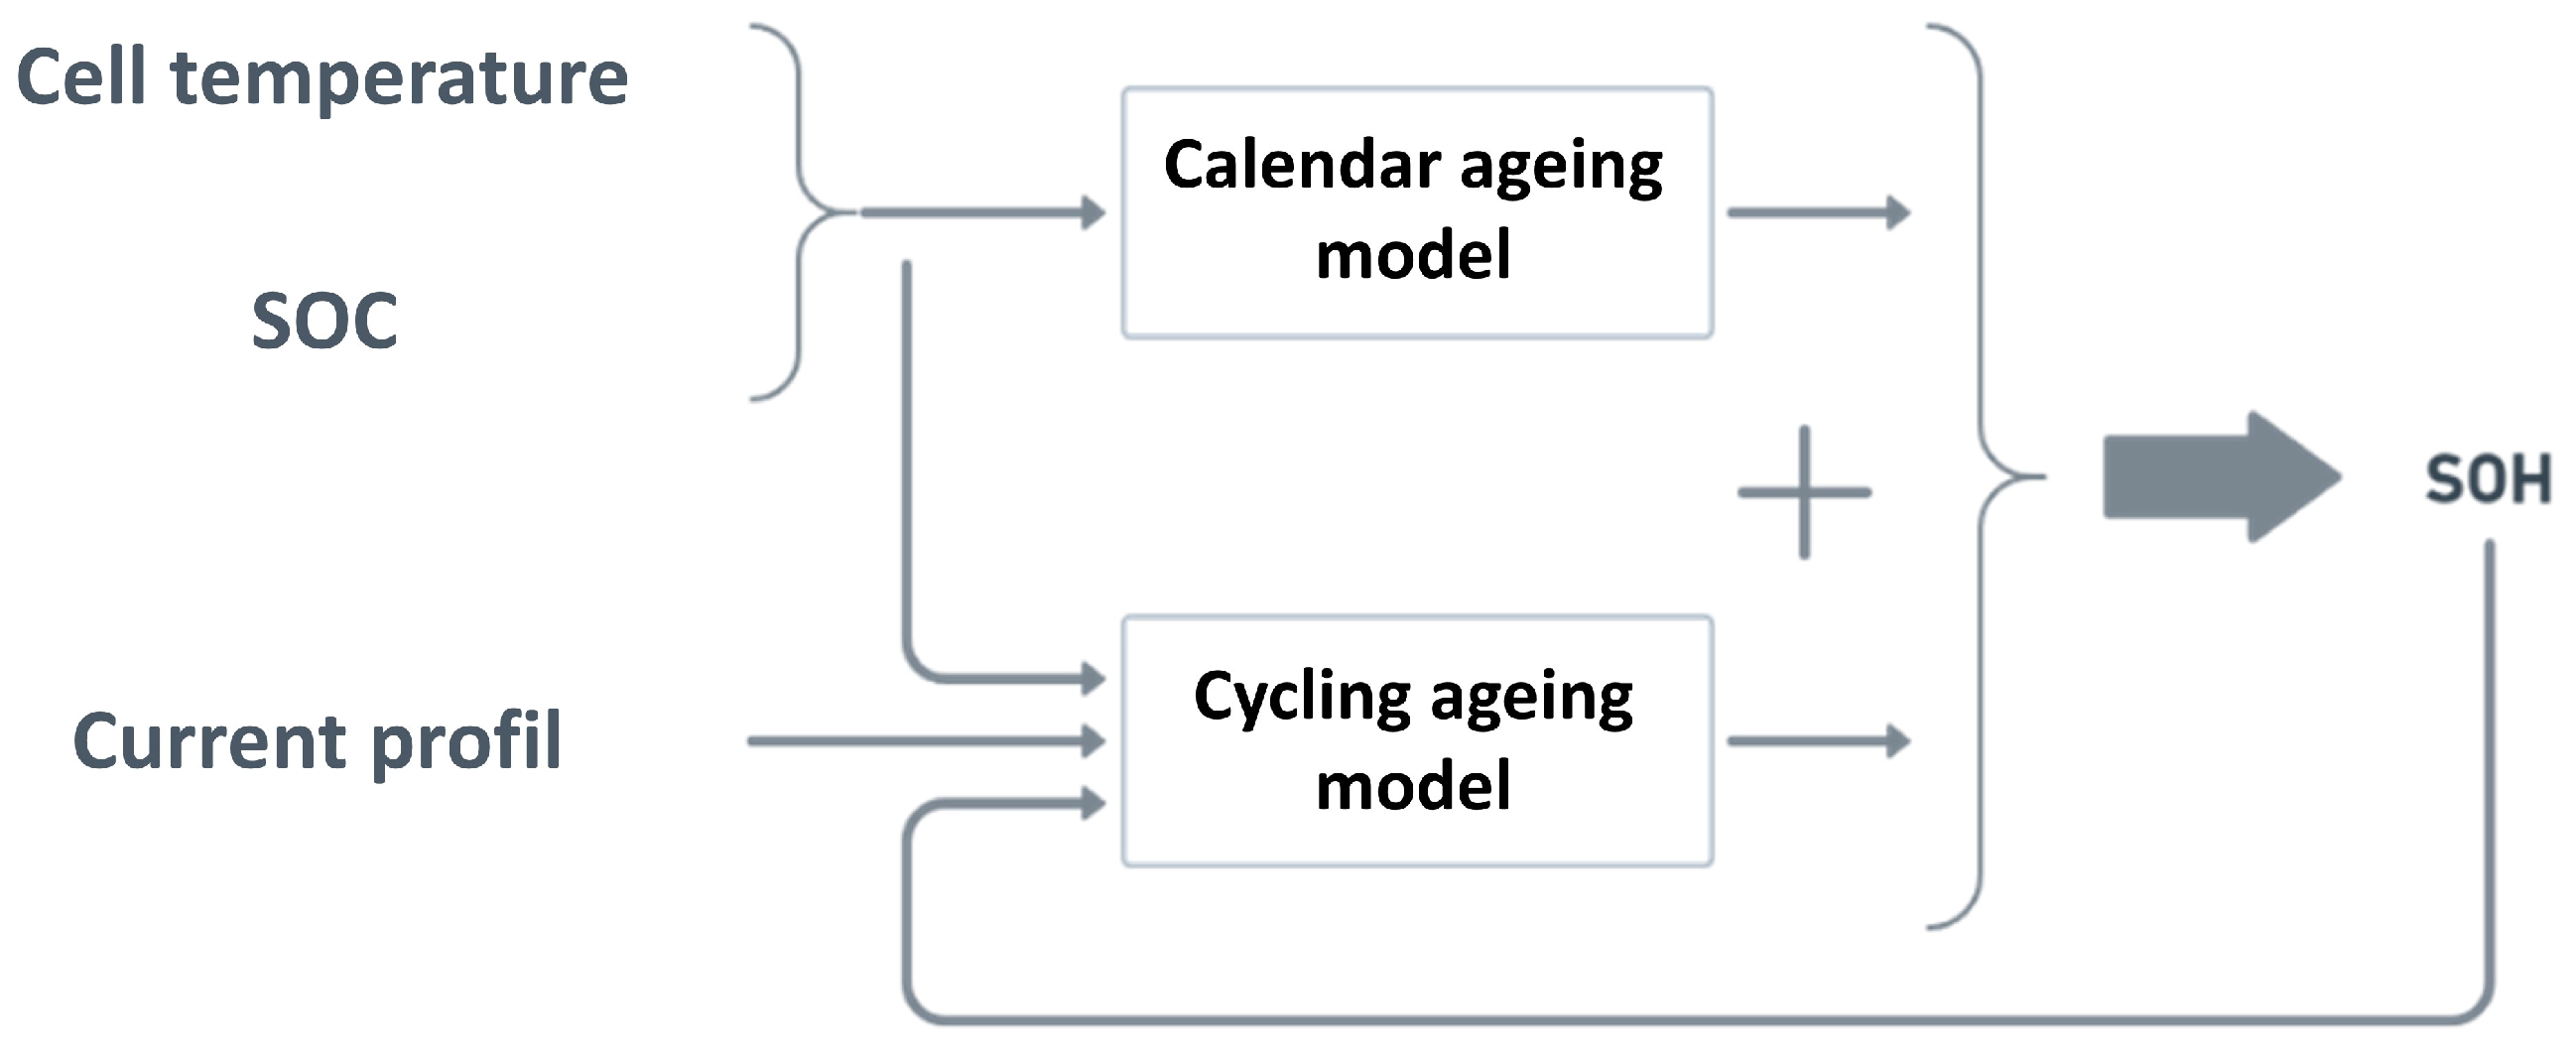
The ageing sub-model is realized after modeling the electrical and thermal behavior of the battery. This final part of the battery cell multiphysics model is the most consistent and consists of two sub-models: a calendar ageing model and a cycling ageing model. The principle used to characterize ageing is shown in
Figure 15. Ageing model components. The total degradation of the electrochemical cell is the sum of the degradations of these two submodels.
The choice was made to separate the ageing of the battery of calendar and cycling, without complex interaction of one ageing on the other. Calendar ageing corresponds to the ageing of the cell at rest, while ageing due to cycling corresponds to that observed during the use of the cell. Because of this choice, and according to the expertise of our partner, the CEA laboratory, calendar degradation affects the battery permanently, while degradation due to cycling acts only when there is an energy exchange.
Both types of degradation are temperature-dependent. In addition, calendar degradation depends on the state of charge of the battery (SOC), and degradation in cycling depends on the current rate, the depth of discharge (DOD); i.e., the SOC variation, but also the current state of health of the battery (SOH).
To match the experimental data, and as explained before, the battery ageing model consists of two parts: calendar ageing and cycling ageing. It was observed that for lithium-ion batteries, there is a switching point (particular ageing moment) in the ageing process after which the battery life decreases more rapidly. Therefore, the battery ageing was modeled using two equations. Equation (
23) models the ageing before the switching point, and Equation (
24) models the ageing after the break to fit more the evolution of ageing in this two different portion where the ageing evolve differently. Each of the two equations is divided into two parts: the first part models the calendar ageing, and the second part models the cycling ageing.
The equation has several components, each of which represents a different factor that contributes to the battery’s capacity loss over time, represented by a.
The first component, , represents the square root of the ageing time of the battery and is related to the calendar ageing component of the model. The constant parameter determines the overall scale of the capacity loss with respect to time.
The second component of the equation, , takes into account the impact of the battery voltage and temperature on the capacity loss. and are constant parameters that determine the impact of the battery voltage and temperature, respectively.
The third component of the equation, , represents the cycling ageing component of the model, taking into account the impact of the positive and negative current on the capacity loss. , , , and are constant parameters that determine the impact of the positive and negative current and the absolute value of the negative current on the capacity loss.
Overall, the equation takes into account the different factors that contribute to the ageing of a lithium-ion battery, including calendar ageing and cycling ageing, as well as the impact of temperature, voltage, and current on the battery’s capacity loss over time. The constant parameters in the equation need to be carefully determined to accurately model the ageing of a specific lithium-ion battery. It is important to note that these ageing models are semi-empirical and require parameterization to accurately match the experimental results. To estimate typical current levels, the electric model and energy model of the vehicle were used based on selected missions.
Ageing Model Parameter Identification
The parameters of the ageing model developed for the NMC technology were identified through cycling and calendar tests conducted at an ambient temperature of 24 degrees and were observed under the cycling profile seen previously. The effect of isolated calendar or cycling ageing can be visualized by canceling the part of the model that represents one of the two ageing types, thus allowing the two phenomena to be viewed separately or coupled, as illustrated in the
Figure 16.
Below in
Table 6 are the optimization parameters (no unit) calculated for the ageing models of the NMC battery.
After discussing the battery modeling and parameter identification, it is clear that accurately modeling the battery is crucial for predicting its performance and estimating its lifetime. However, it is also important to consider the motor modeling, which is another key component of an electric vehicle. Therefore, in the following sections, we will briefly discuss the motor modeling methods.
2.7. Multiphysics Motor Model
2.7.1. Electromagnetic Model
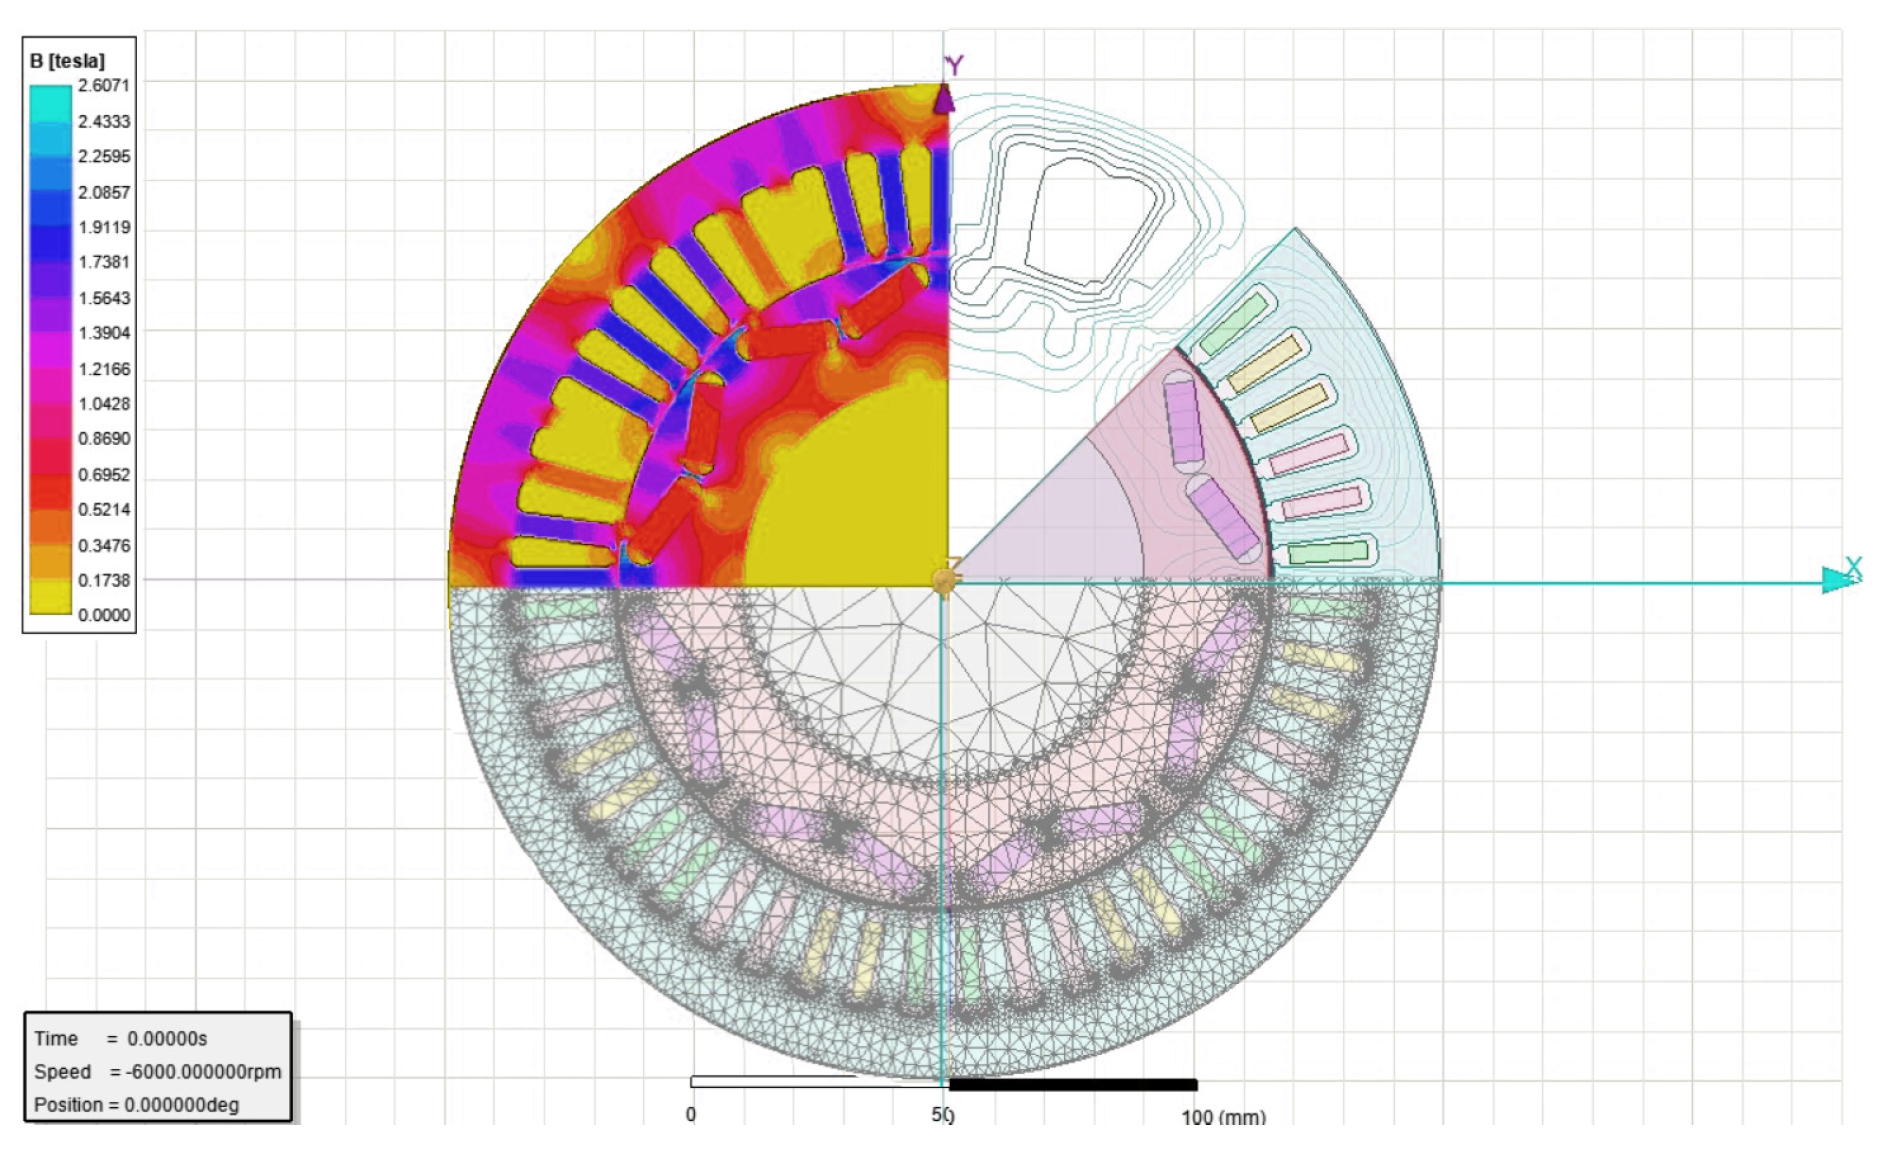
Developing an accurate multiphysics model of an electric motor requires a high level of precision in the evaluation of the electromagnetic model’s performance. To achieve this precision, it is crucial to utilize appropriate simulation tools that can accurately represent the physical behavior of the motor. As such, we chose to create a finite element model of the motor (
Figure 17) using the commercial software Ansys Electronics 2021 R2 by Ansys, Sourced in Laval, France [
43]. The simulation of the electromagnetic model using the finite element method and Ansys Electronics has facilitated several performance analyses, with a particular focus on estimating the electrical losses in the electric motor, including joule losses and iron losses [
44,
45]. These losses are a crucial aspect of the motor’s performance, as they can significantly impact its efficiency and power output. The adopted geometry parameters for the motor are explained in the
Table 7.
The electrical losses in the motor are caused by various factors, including resistance in the motor windings, magnetic hysteresis in the core materials, and eddy currents. Joule losses arise from resistive losses in the motor windings, while iron losses are caused by energy lost through magnetic hysteresis and eddy currents in the core materials [
46].
By utilizing the finite element model, it is possible to estimate the distribution and magnitude of these losses within the motor, identifying areas that experience high losses, such as the rotor or stator. This information can then be used to optimize the motor’s design to minimize losses, thereby increasing its efficiency and performance.
2.7.2. Thermal Model
As explained in the state of the art, it is critical to evaluate the temperature of the various motor parts in order to reconcile the results obtained in order to best estimate the overall results and the service life of the machine given the close relationship between its performance and service life with its temperature during use.
The thermal network method (TNM) is based on the idea of dividing the motor into basic thermal components that represent a mix of heat transfer operations via conduction, convection, and radiation [
47,
48,
49].
The geometric parameters used to build the electromagnetic model will also be used to build the thermal model. The temperature will be estimated in the different motor compartments under operating conditions corresponding to the WLTC.
This approach was used in this work to perform thermal modeling of the inner permanent magnet motor, using the Motor-CAD v15, 2021 R1 by Ansys sourced in Laval, France [
43] used to build the engine’s thermal circuit.
The interconnection between the electromagnetic and thermal models is established such that the motor’s EF/analytical model, implemented with Matlab and Ansys Electronics, assesses its performance and electrical losses at distinct operational points within the drive cycle.
2.7.3. Ageing Model
Motor ageing models are primarily semi-empirical, leveraging experimental data obtained under either accelerated or non-accelerated conditions. These models establish a mathematical connection between ageing progression and temperature/time.
The durability of a motor is intimately tied to the longevity of one of its crucial components, which, if it malfunctions, can affect the entire product—specifically, in the case of electric motors, the weak link in permanent magnet synchronous motors is the insulation of their windings. The breakdown of this insulation is primarily correlated with motor temperature, followed by considerations of mechanical wear and time, as documented in [
50].
It is necessary to account for the dynamic evolution of temperature and assume that the damage of chemical deterioration due to temperature is independent of time and additive. The following is the definition of an ageing or residual life factor as a percentage between two time references
t1 and
t2:
: lifetime as a function of the maximum temperature.
: reference lifetime typically assumed to be 20,000 h.
HIC: half-life reduction index, representing the numerical value of the temperature added to the reference temperature, causing a fifty percent reduction in insulation lifetime.
TI: reference temperature associated with the insulation class.
When the time interval during which excess temperature (
t1,
t2) occurs is extended to a duration T, you can calculate the lifetime using the following equation.
Studying the impact of heat on the motor’s lifespan is essentially an examination of motor insulation failure [
51].
It is possible to estimate the motor’s lifespan statically by considering the average temperature during its operation. This temperature can be projected onto a regression curve derived from experimental data obtained from motors sharing the same insulation class as the one under study.
This estimation method can yield results that closely align with experimental data, but it lacks absolute accuracy since it assumes that the dynamic temperature evolution and chemical deterioration due to temperature are independent of time and additive.
The highest allowable temperature in motors is directly linked to their insulation class; the higher the insulation class, the greater the permissible temperature, but this also comes with a higher motor cost.
The flowchart in
Figure 18 provides a summary of the interconnections and data exchange among the three sub-models within the system.
2.8. Optimization Algorithm
The selection of an optimization method for any application might be critical for the process’s convergence towards an optimal output. The optimization algorithm chosen must strike a compromise between convergence time and accuracy of findings. In general, optimization algorithms are classified into two types: gradient-based optimization algorithms and non-gradient-based optimization algorithms.
The nature of the objective function and the scale of the issue to be solved can favor one type over another. For example, if the objective function is smooth, an optimization method that considers the gradient can converge to an optimal solution much faster. However, algorithms based on gradient evaluation may converge to solutions with local and non-global minimums for an irregular objective function, or even risk crashing if the objective function contains a discontinuity.
Thus, from the perspective of creating a multiobject optimization with several optimization variables, the nature of the objective function may include several optimums, and therefore, it is preferable to use the genetic algorithm, which is an evolutionary algorithm that uses evolutionary selection, variation, and replacement operations to increase or replace populations in a generational way in order to improve the most global solution, while exploring as many solutions as possible to avoid converging on an optimal local solution. The parameters of the optimization algorithm are summarized in
Table 8.
Nb of variables:
- -
This parameter determines the number of variables in the optimization problem that the genetic algorithm will solve.
Nb of generations:
- -
This parameter determines the number of generations that the genetic algorithm will run for.
Population size:
- -
This parameter determines the size of the population of individuals that will be evaluated in each generation of the genetic algorithm.
Migration factor:
- -
This parameter determines the proportion of individuals that will be migrated from one sub-population to another during the genetic algorithm.
Number of elite:
- -
This parameter determines the number of best individuals in the population that will be directly passed on to the next generation without undergoing crossover and mutation operations.
Migration interval:
- -
This parameter determines the number of generations between migration of individuals from one sub-population to another.
The optimization parameters listed in the table were defined after multiple trial and error attempts to find the best values for the genetic algorithm to solve the specific optimization problem at hand. It is important to note that there is no direct formula or rule to define the best values for these parameters, as it largely depends on the nature and complexity of the problem being solved.
To explore extensive design spaces effectively, the geometric dimensions need to exhibit a broad range of variation during dimensioning optimization. Consequently, the finite element (FE) model should be capable of accommodating substantial variations in these parameters without reaching a geometrically unfeasible state, which would necessitate abandoning the optimization process. Typically, this challenge is addressed by incorporating specific constraints into the optimization procedure to prevent infeasible configurations while preserving the flexibility of design variable variation.
The predefined range of variation for the optimization parameters is detailed in
Table 9.
Note: Ensuring that the motor’s shape aligns with all the operational requirements within the tested driving cycle, encompassing speed, torque, and power demands is of paramount importance during the optimization of the motor’s design. This emphasis is critical for guaranteeing a positive user experience and the overall usability of the electric car. If the suggested shape, as determined by the optimization algorithm, fails to meet these criteria, it will be dismissed and penalized to prevent such occurrences in subsequent optimization iterations. This rigorous adherence to the approach ensures that the optimization process revolves around discovering motor designs that genuinely satisfy the performance expectations of the driving cycle, ensuring optimal efficiency and user comfort.
The objective function takes into account the lifespans of both the motor and the battery simultaneously. However, given the significant difference in the longevity of these two components (the motor’s lifespan being significantly longer than that of the battery), a weighting factor is introduced after several optimization trials. This factor ensures convergence toward a solution that does not prioritize the motor’s lifespan over that of the battery or the cost of the battery in the electric motor.
Consequently, the objective function, which combines price minimization with lifetime maximization, can be represented as follows:
MSRP: manufacturer’s suggested retail price (MSRP), denoting the price recommended by the manufacturer for selling the electric vehicle
Prixbatt: price of the battery.
Lifetimebatt: battery lifespan.
Prixmoteur: price of the electric motor.
Lifetimemot: electric motor lifespan
3. Results Discussion
Two different driving cycles were employed to evaluate the effectiveness of the optimization strategy and make comparisons between the outcomes. The optimization process was conducted, and the results of both optimizations are visually represented in
Figure 19. In this graph, the convergence of the blue population toward the red Pareto front, representing the optimal generation, is evident.
Of particular note is the Pareto front’s inflection point, commonly referred to as the “elbow”, which highlights the most favorable outcomes that strike an optimal balance between the price and longevity components of the objective function. These findings signify the highest achievable level of performance and are among the study’s most significant results.
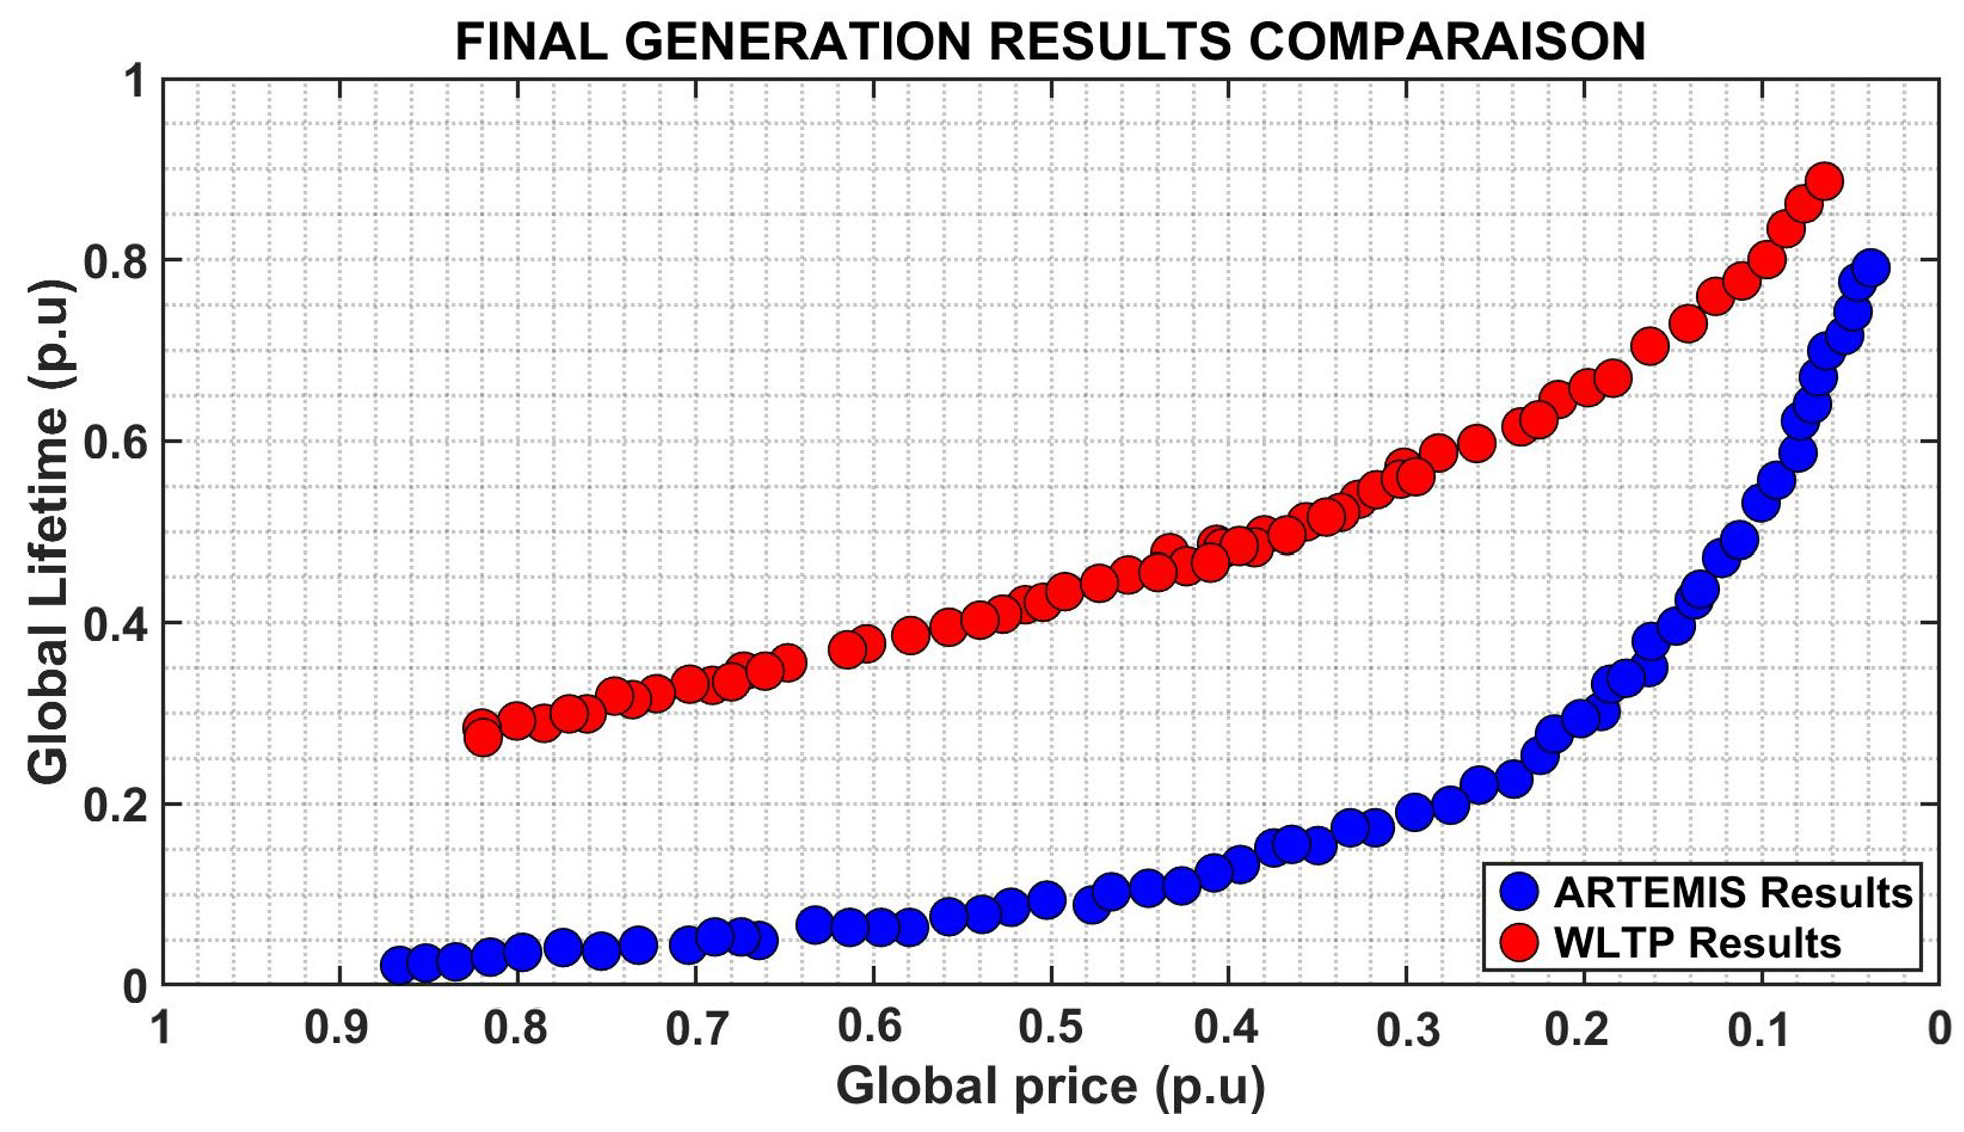
For a more detailed comparison of the results obtained from the two driving cycles, we present the final generation outcomes in
Figure 20. The values of “Global Lifetime (p.u)” and “Global Price (p.u)” in the figure below are represented using the per unit (p.u.) notation. This notation is employed to standardize the data, facilitating the analysis of curve evolution.
To calculate the per unit values, we use the maximum values of the lifetime and overall cost curves as reference points. These maximum values establish the reference baseline, equivalent to 1.0 p.u. (100%).
The formulas employed for calculating the per unit values are as follows:
”Lifetime” represents the lifespan value at a specific point along the curve, while ”Maximum Lifetime” corresponds to the highest value obtained from the lifespan curve. Similarly, ”Price” denotes the price value at a specific point on the curve, and ”Maximum Price” signifies the maximum value achieved from the overall cost curve.
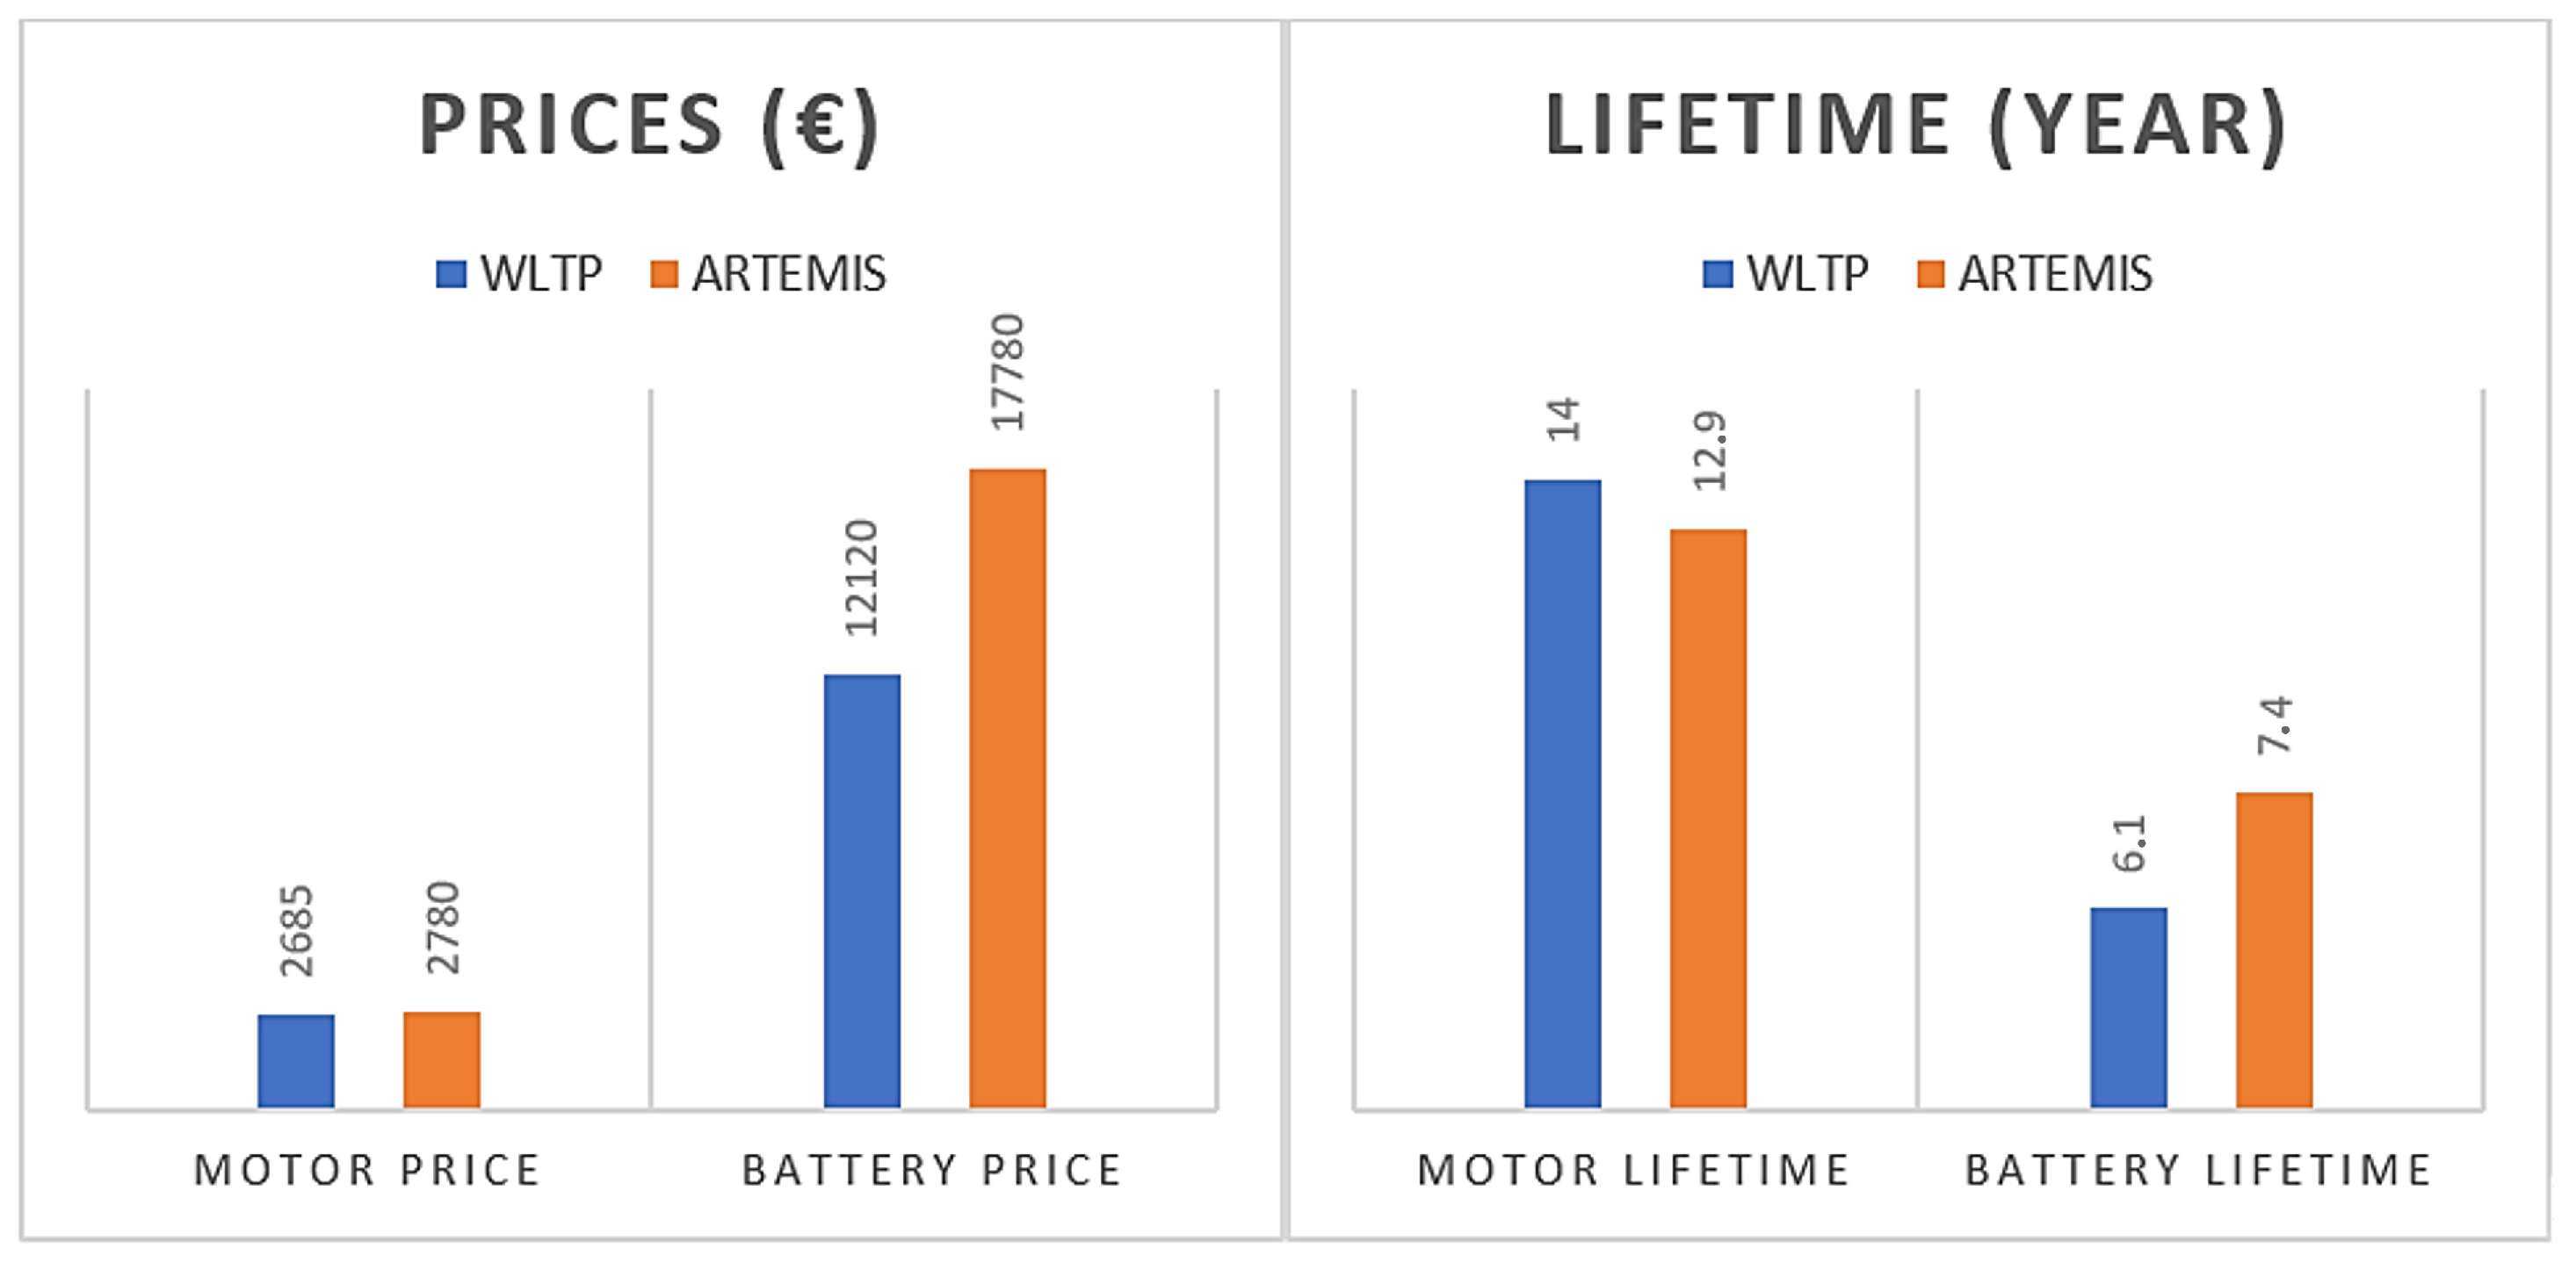
To assess the variations in the outcomes of the two driving cycles more thoroughly, we concentrate on the elbow region of the two Pareto fronts. This region catches the best results and provides a full assessment of each optimization’s performance in relation to the goal function. Closer analysis reveals that the price evaluation conclusions show equal drivetrain prices for both modifications. The lifetime analysis of the results, on the other hand, demonstrates a considerable difference between the two driving cycles.
To further our analysis, we examine the convergence patterns of the two optimization procedures for two chains of tractions, which possess identical lifespans, albeit at contrasting prices. By doing so, we gain a more comprehensive understanding of the performance trade-offs associated with the different optimization approaches. The results in
Figure 21 demonstrate that both optimizations achieve comparable convergence towards the optimal solution for chains with identical lifespans.
However, the optimal solution obtained using the Artemis optimization approach exhibits a higher price compared to the WLTP optimization approach. These findings highlight the importance of choosing an optimization approach that balances the competing objectives of cost and longevity and underscores the significance of the lifetime analysis in evaluating the performance of optimization procedures.
The convergence results obtained for a same level of life and a different price are logical and can be explained as follows:
Optimization for Lifetime: To ensure the same lifetime for the motor and battery, a comparison of the Artemis driving cycle and the WLTP driving cycle reveals some key differences in optimization. The Artemis driving cycle, with a duration of 4000 s, is significantly longer compared to the WLTP driving cycle, which lasts 1800 s. As a result, the required driving range for the Artemis cycle is much greater, necessitating a larger battery to store sufficient energy. The larger battery size leads to a higher cost for powertrain optimization when targeting the Artemis driving cycle.
Battery Optimization convergence: The primary factor contributing to the higher cost of optimizing the battery for the Artemis driving cycle is its increased energy requirement. The longer duration of the cycle demands a larger battery capacity to provide the necessary driving range. The Artemis driving cycle, lasting 4000 s, requires the vehicle to sustain operation over a longer period compared to the 1800 s duration of the WLTP driving cycle.
To meet the extended energy demand of the Artemis driving cycle, a larger battery capacity is necessary. A larger battery pack is needed to store the increased energy required to ensure the vehicle’s driving range can cover the longer duration of the cycle. This larger battery size directly translates to higher costs in powertrain optimization.
The increased battery capacity comes with higher prices associated with larger battery packs. Larger battery packs require more materials, including additional cells and associated components, increasing the manufacturing costs.
Motor Optimization convergence: In terms of motor optimization, the difference between the two driving cycles is not as significant. The motor needs to operate efficiently across all driving points of the cycle, delivering the required torque at specific speeds. Both the Artemis and WLTP driving cycles exhibit a significant peak in torque, with the Artemis cycle having a slight advantage, particularly during its highway portion.
The cost difference in motor optimization arises from two factors. Firstly, the higher average speed of the Artemis driving cycle results in a more substantial temperature variation for the motor. To mitigate this, a larger magnet is required in the motor design, reducing the current and minimizing heat losses. Secondly, the larger battery in the Artemis optimization contributes to the higher cost as it requires the motor to handle increased power output.
In conclusion, optimizing the electrical motor for the Artemis driving cycle tends to be more expensive compared to the WLTP driving cycle. This is primarily due to the larger battery size required for an extended driving range and the need for a motor design capable of handling higher power output and temperature fluctuations.
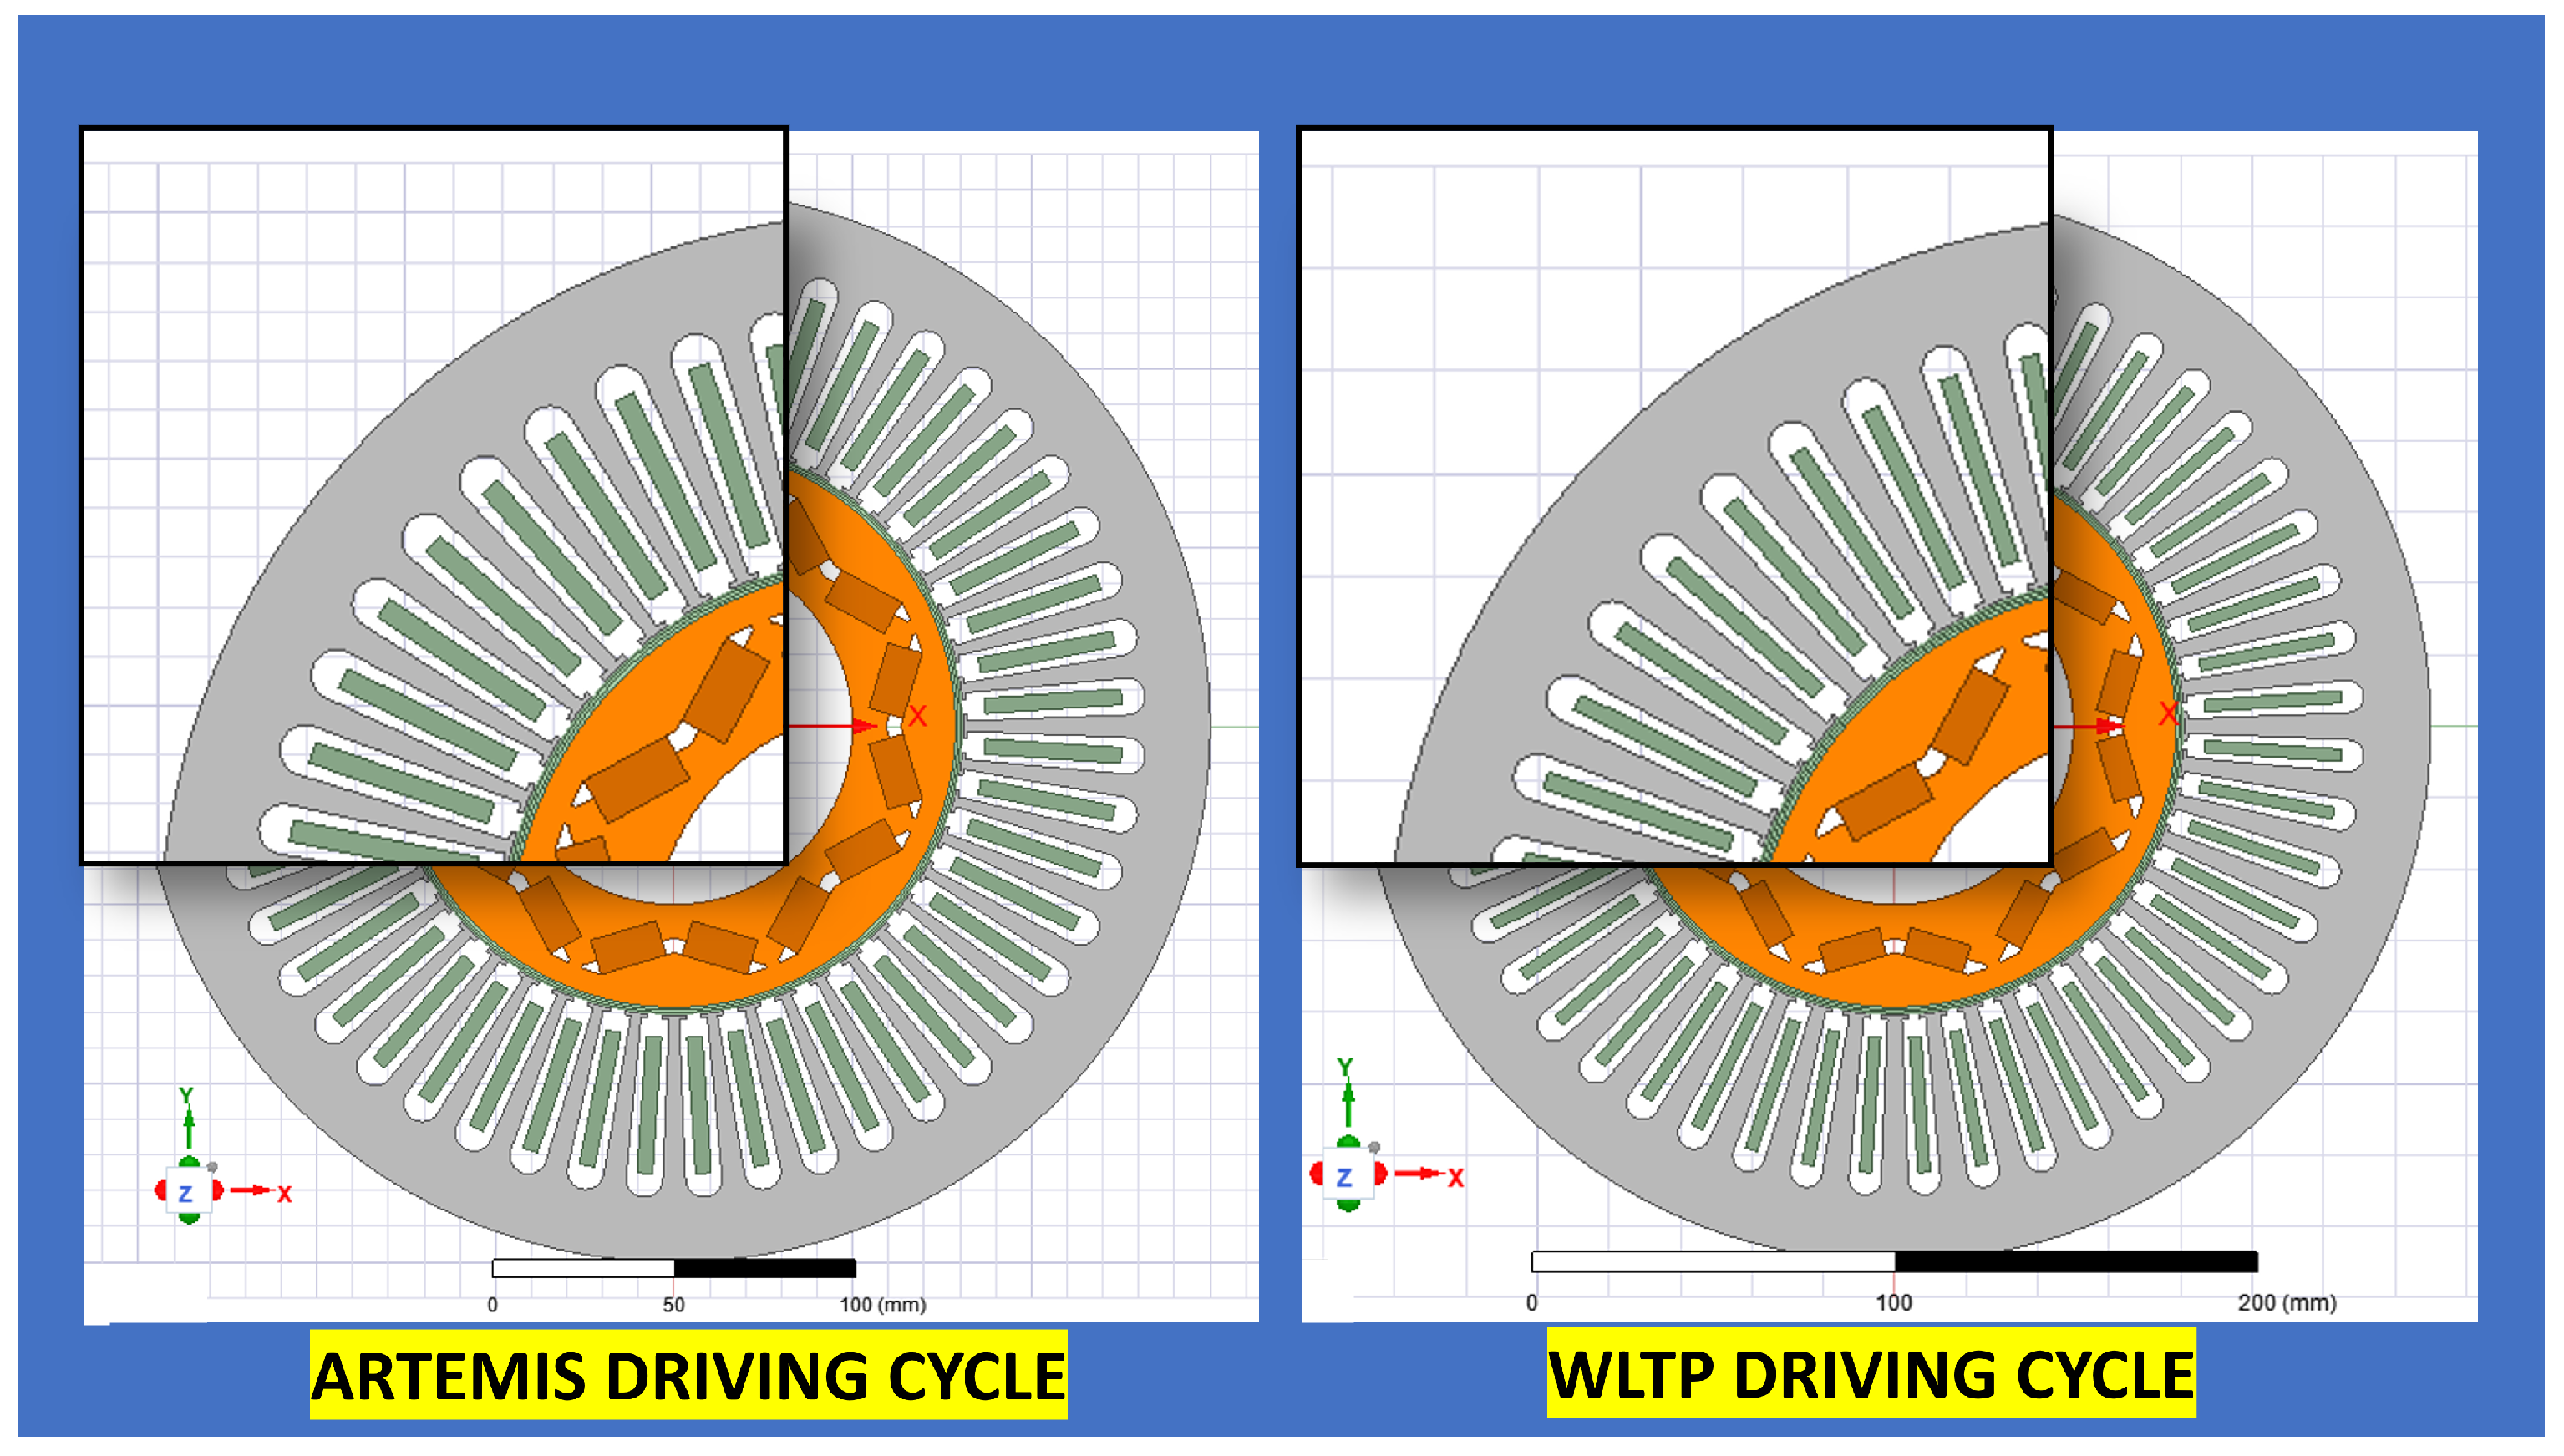
We can be interested to see the final geometry of the motor resulting from the optimization realized for the two missions WLTP and Artemis, as illustrated in
Figure 22, with the geometrical parameters represented in
Table 10.
For Artemis driving cycle (Motor 1): The Artemis driving cycle is characterized by higher speeds and torque requirements, demanding a motor with superior performance. Here is the justification for the motor geometry:
Interior diameter Rotor: 112 mm (Artemis)—The larger interior diameter (112 mm) in the Artemis motor allows for larger windings and a higher current-carrying capacity. This enables the motor to generate greater torque output, meeting the acceleration and high-speed demands of the Artemis cycle, which includes more highway driving, while considering the requirements for a longer motor lifespan.
Exterior diameter Stator: 267 mm (Artemis)—The larger exterior diameter (267 mm) in the Artemis motor provides more space for additional windings, resulting in increased power output and torque production. Moreover, the increased stator diameter promotes improved heat dissipation, ensuring reliable performance and extending the motor’s operational lifetime during the demanding conditions of the Artemis driving cycle.
Permanent magnet width: 37 mm (Artemis)—The larger permanent magnet width (37 mm) in the Artemis motor enhances the motor’s overall torque capability. Additionally, the increased surface area of the magnets allows for better heat transfer, ensuring efficient thermal management and extending the lifespan of the magnets under demanding operating conditions.
Permanent magnet thickness: 9.8 mm (Artemis)—The larger permanent magnet thickness (9.8 mm) in the Artemis motor contributes to a higher magnetic field strength and improved torque generation. This choice ensures reliable performance while considering the thermal impact on the magnets. The increased volume of the magnets allows for better heat dissipation, minimizing the risk of demagnetization and ensuring a longer lifespan.
Slot opening: 2.5 mm (Artemis)—The larger slot opening (2.5 mm) in the Artemis motor allows for improved cooling airflow, aiding in effective heat dissipation. This choice ensures that the motor operates within acceptable temperature limits, promoting a longer lifespan while meeting the high-speed and high-torque demands of the Artemis driving cycle.
Motor length: 121 mm (Artemis)—The longer motor length (121 mm) in the Artemis motor provides more space for windings, leading to increased torque output. This choice enables the motor to meet the torque demands during acceleration and high-speed driving on highways, while considering the thermal impact on the motor. By allowing for efficient heat dissipation, the motor’s operational lifetime can be extended even under the demanding conditions of the Artemis cycle.
For WLTP driving cycle (Motor 2): The WLTP driving cycle represents real-world driving conditions, including urban, suburban, and highway driving. The focus is on overall efficiency, durability, and versatility. Here is the justification for the motor geometry:
Interior diameter Rotor: 110 mm (WLTP)—The interior diameter of 110 mm in the WLTP motor strikes a balance between power requirements and motor size. It allows for efficient torque generation while considering the thermal impact and the desired lifespan of the motor during the diverse driving conditions encountered in the WLTP cycle.
Exterior diameter Stator: 265 mm (WLTP)—The exterior diameter of 265 mm in the WLTP motor ensures a compact motor size while still meeting the torque requirements of the WLTP cycle. This choice considers thermal management and allows for efficient heat dissipation, ensuring reliable motor operation throughout the WLTP cycle.
Permanent magnet width: 32 mm (WLTP)—The permanent magnet width of 32 mm in the WLTP motor strikes a balance between power requirements and motor size. It provides efficient torque generation while considering the thermal impact and the desired lifespan of the motor during the diverse driving conditions of the WLTP cycle.
Permanent magnet thickness: 7.1 mm (WLTP)—The permanent magnet thickness of 7.1 mm in the WLTP motor strikes a balance between magnetic field strength and overall motor size. It ensures efficient torque generation while considering the thermal impact and the desired lifespan of the motor during the WLTP cycle.
Slot opening: 2.1 mm (WLTP)—The slot opening of 2.1 mm in the WLTP motor strikes a balance between electromagnetic performance and manufacturing considerations. It allows for efficient motor operation during the diverse driving conditions encountered in the WLTP cycle while considering thermal management and the desired lifespan of the motor.
Motor length: 104 mm (WLTP)—The motor length of 104 mm in the WLTP motor provides a compact motor size while still meeting the torque requirements of the WLTP cycle. This choice considers thermal management and ensures reliable motor operation throughout the WLTP cycle while considering the desired motor lifespan.
4. Conclusions
This research demonstrated the value of comprehensive multiphysics modeling and a multi-objective optimization approach for enhancing electric vehicle powertrain performance and cost-effectiveness. The optimized designs exhibited noticeable improvements in overall lifespan and cost reduction compared to the initial baseline powertrain.
A major finding was the substantial impact of battery sizing on the optimization outcomes. Increasing battery capacity extended powertrain lifespan across both driving cycles, despite also raising system costs. This highlights the critical role of batteries in balancing EV design trade-offs.
In addition, tuning motor geometry parameters such as slot height and magnet thickness improved motor efficiency, reducing losses and heat generation. This contributed to increased powertrain durability.
The genetic algorithm successfully identified optimal trade-offs between cost and lifetime objectives. The analysis of convergence patterns provided insights into the influence of driving cycles and component sizing on system optimization.
This work focused on battery and motor modeling and optimization. However, other powertrain components also play key roles in overall system performance and efficiency. Power electronics such as inverters and converters enable optimal power distribution and should be considered in future optimization efforts.
Expanding the modeling to encompass additional powertrain elements will lead to further performance improvements and cost reductions. The model fidelity could also be enhanced by incorporating more detailed degradation physics and thermal effects. Validating the optimization outcomes through physical prototypes would provide further confidence.
By demonstrating the benefits of a holistic optimization approach, this research paves the way for continued advancements in electric vehicle powertrain design. The findings underscore the pivotal role of batteries while highlighting opportunities to optimize other components like power electronics. This work provides a methodology and quantitative insights to guide the next generation of electric vehicle development.

