Abstract
Reactor temperature manipulation to increase product yields of chemical reactions is a known technique used in many industrial processes. In the case of exothermic chemical reactions, the well-known Le Chatelier’s principle predicts that a decrease in temperature will displace the chemical reaction toward the formation of products by increasing the value of the equilibrium constant. The reverse is true for endothermic reactions. Reactor temperature manipulation in an industrial system, however, affects the values of many variables, including physical properties, transport parameters, reaction kinetic parameters, etc. In the case of reactive absorption, some variables change with increasing temperatures due to solute absorption, while others change in such a way that the solute absorption rate decreases. For example, temperature drop increases product formation for exothermic reactions but reduces the value of transport parameters, leading to decreasing interfacial concentrations and absorption rates. Therefore, temperature manipulation strategies must be designed carefully to achieve the process goals. In this work, we theoretically study the use of temperature as a tool to increase CO2 absorption by solvents in a semi-batch reactor. A computer code has been developed and validated using reported experimental data. Calculated results demonstrate an increase in absorbed CO2 of more than 28% with respect to the highest temperature used. Despite high agitation and high gas flow rate, the system is mass transfer controlled at short times, becoming kinetically controlled as time increases. An operating strategy to decrease cooling energy costs is also proposed. This study reveals that reactor temperature manipulation can be an effective process to improve CO2 absorption by solvents in two-phase semi-batch reactors.
1. Introduction
The Intergovernmental Panel on Climate Change (IPCC) has reported that growth in anthropogenic emissions has persisted across all major groups of Green House Gases (GHGs) since 1990. By 2019, the largest growth in absolute emissions occurred for CO2 from fossil fuels and industry, followed by CH4. Based on central estimates only, historical cumulative net CO2 emissions between 1850 and 2019 yield a 50% probability of limiting global warming to 1.5 °C (central estimate about 2900 Gt CO2) and a 67% probability of limiting global warming to 2 °C (central estimate about 3550 Gt CO2) [1].
A significant reduction in CO2 emissions is needed to keep the global temperature increase below 1.5 °C, 45% by 2030, and net zero emissions by 2050 [2]. In order to achieve these goals, there is an urgent need for new carbon sequestration technologies or optimization of existing ones. A commonly used CO2 sequestration technology from flue-gas streams is reactive absorption by selective solvents or blends of solvents ([3,4,5,6,7,8,9,10,11,12,13,14,15,16,17,18,19,20], among others). Amines, various blends of amines, and other solvents have been investigated [4,5,6,7,8,9]. Recently, amino acid solutions have been introduced because they present significant advantages over amine solvents (less equipment corrosion, less fugitive emissions, and more chemical stability) [10,11,12,13,14,15,16,17,18,19,20].
Process intensification is a new engineering technology focused on reducing the operating and capital costs of industrial processes by the combination of chemical reaction and separation operations [21]. It is based upon the well-known principle that chemical reactions can be displaced towards product formation by changing the value of relevant variables, product/reactant concentrations, temperature, pressure, etc. [22,23]. Temperature changes can be employed to displace the equilibrium point for both exothermic and endothermic reactions. A generic reversible chemical reaction with significant heat effects can be written as [24]
Q is the heat of reaction, positive for exothermic reactions and negative for endothermic ones; a, b, c, and d are stoichiometric coefficients; A, B, C, and D are chemical reactants and products. In the case of a reversible elementary reaction, the specific rate of reaction for the limiting reactant A (−rA) is given by [24]
is the reversible reaction equilibrium constant, and are the forward and reverse specific rate constants for the forward and reverse reactions, respectively, and is the i-component concentration.
Inspection of Equation (1) shows that decreasing Q will tilt the reaction towards product formation in the case of an exothermic reaction while increasing Q will have the same effect for an endothermic reaction. In the case of CO2 absorption by solvents, the absorption reactions are highly exothermic; therefore, temperature reduction can lead to increased CO2 absorption. However, a typical reaction scheme for CO2 absorption involves several different reactions. In this work, we use CO2 absorption in water–monoethanol amine (MEA) solutions. This reaction system is well-studied in literature, and there is an adequate amount of kinetic parameter values available [4,8,25,26]. Gabitto and Tsouris [8] proposed the following reaction scheme:
Equation (3) represents the main CO2 absorption reaction by MEA. The reaction proceeds through a non-elementary mechanism that leads to the formation of an MEA carbamate () and protonated MEA (). Equation (5) represents the main CO2 absorption reaction in alkaline solutions. Equation (4) has been added for completeness as its contribution to absorption is almost negligible compared to Equation (5). The rest of the equation has also been added for completeness; however, these equations can explain some interesting behavior of the absorption system that was observed experimentally. A list of all chemical compounds present in the gas and liquid phases is included in Table A1 in Appendix A. A complete list of formulas used to calculate the equilibrium constant values is shown in the Supplemental Information (SI) file. Using these formulas, we calculated equilibrium constant values vs temperature, and the results are shown in Figure 1. The calculated values have been plotted using a logarithmic scale to depict values that differ by several orders of magnitude. In the logarithmic plot, the temperature variation with the inverse of temperature (1/T) is given by a straight line. Positive slopes represent exothermic reactions, while negative slopes represent endothermic reactions. The results in Figure 1 can be used to analyze the temperature behavior of all the chemical reactions involved in the process. The CO2 absorption reactions, Equations (3) and (5), are highly exothermic, while Equation (4) is almost independent of temperature variations, and the other reactions, Equations (6)–(8), are endothermic. The variation in the values of the equilibrium constants with temperature will be a key factor in evaluating the behavior of the reaction scheme given by Equations (3)–(9).
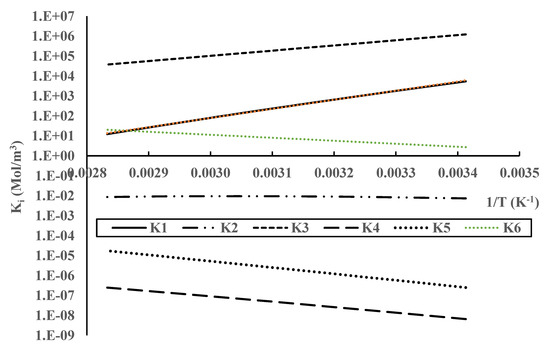
Figure 1.
Temperature variation in the equilibrium constants for MEA reactions with CO2.
Recently, Jang et al. [27,28] used a 3-D printed packing device to improve heat and mass transfer during reactive absorption of CO2 by a low-aqueous solvent, i.e., a solvent containing a small fraction of water. This packing device had channels in the interior of its corrugated plates that allowed a flow of cooling fluid to remove the heat released by the exothermic reaction of CO2 with amines. Because of the heat and mass transfer enhancement afforded by the 3-D printed packing device, it was termed an “intensified packing device”. The authors reported improved thermal management along an 8-inch diameter packed column via intra-stage cooling and a significant increase in the amount of CO2 absorbed, up to 25%, compared to the same system without cooling. However, in packing column separators, a complex thermal behavior is observed. The presence of a temperature bulge that appears in different positions inside the columns depending upon operating conditions, solvent physical properties, and CO2 loading has been reported [29,30]. The absorber performance seems to be independent of the bulge location when it is in the top or in the bottom of the column, while it affects the performance when located in the middle. The ratio of liquid/gas flow rates (L/G) plays an important role in column performance. There is a critical L/G value that gives a maximum bulge temperature near the middle of the absorber. The magnitude of the bulge temperature is increased by solvents with higher heats of absorption and by higher gas phase CO2 concentrations. At lower L/G ratios, the temperature of the bulge is somewhat smaller and appears nearer the top of the column. At greater values of the L/G ratio, the bulge temperature is substantially smaller and appears at the bottom of the column [30]. The position of the temperature bulge also varies during column operation, complicating column design [29]. The set of operating conditions used by Jang et al. [27] in their experiments located the bulge close to the top of the column, and this was the reason for the increased performance observed. However, other operating conditions can require complex design procedures to determine the exact position of the temperature bulge [29]. Furthermore, packing columns have constraints on the amounts of gas and liquid phases that can be treated due to the flooding phenomenon [4,8].
The goal of this project is to improve the performance of CO2 absorption industrial processes by manipulating the temperature of the chemical reaction system. We aim to increase the percentage of absorbed carbon dioxide and reduce operating costs.
Considering the complexity of thermal management in packing columns, we decided in this project to use a two-phase semi-batch reactor. This reactor is widely used in industry, especially in biotechnology-related operations [31]. The liquid phase is stationary, while there is a continuous flow of a gas phase. This reactor, see Figure 2, has a jacket that allows good cooling and/or heating conditions. The presence of a mechanical stirrer and appropriate baffle design helps to achieve good mixing and homogeneous property values. The gas phase is introduced through a distributor that allows the formation of bubbles of a certain size and controls the bubble size distribution. The bubbling gas phase also produces agitation of the liquid phase, contributing to further reduction in heat and mass transfer limitations [31,32,33]. High gas–liquid heat and mass transfer areas can be achieved by the selection of small bubble diameters [34].
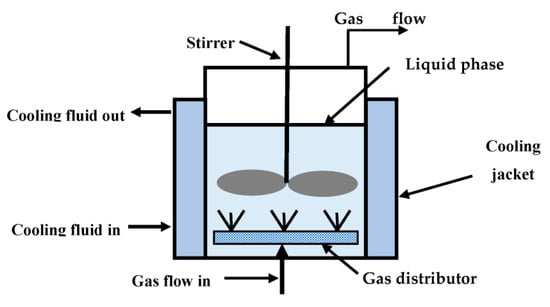
Figure 2.
Two-phase semi-batch reactor.
2. Materials and Methods
2.1. Chemical Reactor Mass Balance Model
In this work, we follow the experimental and theoretical study reported by Gabitto et al. [34] using a two-phase semi-batch reactor. The authors proposed a simulation model for the process and found good agreement between the results calculated using their reactor model and experimental data. CO2 gas–liquid reactive mass transfer was modeled using the two-film model, which assumes interphase mass transfer only by molecular diffusion in two thin layers on both sides of the interphase [35,36]. This model defines mass transfer coefficients in each thin layer, kg for gas and kl for liquid. Increased transport due to CO2 absorption reactions is accounted for using an enhancement factor (E) defined as the ratio of mass transfer with and without chemical reaction [36,37]. Chemical reactions occur in a thin film on the liquid side of the interface. Gabitto et al. [34] assumed instantaneous reaction and ideal mixing inside the reactor, leading to constant concentrations throughout the reactor and equal to the concentrations in the exiting stream. The authors proposed the following mass balance equations in the liquid phase:
is the liquid phase concentration, is the liquid phase equilibrium concentration at the gas–liquid interphase, aw is the interphase area per unit volume, is the gas hold-up defined as the ratio of gas volume to the total volume (Vg/VT), represents moles of species-i generated/consumed by interphase reaction per unit volume and is the molar flow of component-i from the gas into the liquid phase given by
The enhancement factor (E) is given by [33,34]
DCO2 is the diffusion coefficient, and the various kif are the forward-specific reaction rate constants Equations (3)–(5). The Hatta (Ha) number is a measure of the amount of dissolved gas that reacts inside the diffusion film near the gas–liquid interface compared to the amount that reaches the bulk of the solution without reacting. When Ha > 2, the enhancement factor E is directly equal to the Ha number [36].
In the gas phase, a mass balance for species-i leads to
We replace using Equation (12) to obtain:
H is the reactor height, is the gas superficial velocity, and are the input and output gas phase concentrations of component i, respectively.
2.2. Chemical Reactor Energy Balance Model
We showed in the introduction section that some of the reactions given in the reaction scheme are highly exothermic; therefore, an energy balance must be solved to consider temperature changes. There is also significant mass transfer of the liquid solvent molecules (water and MEA) into the gas phase. These mass flows involve significant energy changes as the latent heat of the liquid side molecules must be provided [4,8,34]. Gabitto et al. [34] reported the following energy balances in the liquid and gas phases:
and are the heat capacities of the i-component in the mixture, is the concentration of the i-component in the input gas phase, is the heat capacity of the i-component in the input gas stream, is the global heat transfer coefficient, is the heat of vaporization for the i-liquid solvent chemical species, is the temperature of the input gas stream, is the heat released by the chemical reaction, and and are the superficial velocities of the gas and liquid phases, respectively. The i-molar flow term () is given by Equation (12). The CO2 molar flow term () is given by [34]
is the liquid-side CO2 mass transfer coefficient.
2.3. Parameter Estimation
The implementation of the two-phase batch reactor model requires the evaluation of several different parameters. For the sake of completeness, we list some here. A complete list can be found in Gabitto et al. [34].
The overall gas hold-up () was calculated using the following correlation [38]:
is the liquid phase volume and is the power consumption given by [39]
where is the dimensionless gas flow number and is the power consumed by the impeller in the absence of the gas phase.
The average diameter of the bubbles () was calculated using [40]
is the liquid phase surface tension and is the liquid phase density.
The liquid side mass transfer coefficient () is calculated from [38]
3. Results and Discussion
A modified version of the custom-made computer code developed by Gabitto et al. [34] was used to implement the reactor model. The authors validated their model by comparison with their experimental data [34], as well as literature data [4,41]. More information about the validation procedure will be provided below. The input data used in the simulations are shown in Table 1.

Table 1.
Typical set of values used in the simulation of a semi-batch reactor.
The efficiency of the absorption process is reported in this work using the CO2 load defined as the summation of the concentrations of all compounds containing CO2, including , divided by the initial MEA concentration. The total concentration of all chemical compounds that contain CO2 is also used to quantify the absorption process. Typical simulation results for constant liquid phase temperature are shown in Figure 3 and Figure 4. The concentrations of the OH− and H+ ions are not shown as their concentrations are very small.
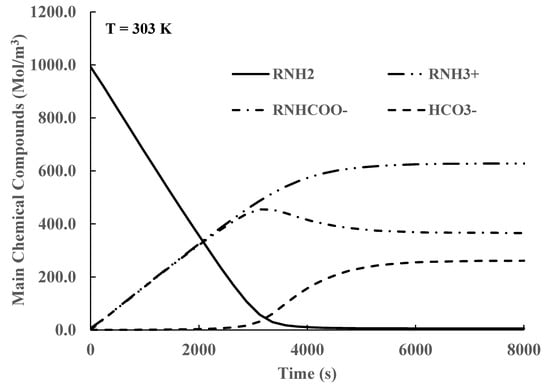
Figure 3.
Time variation in chemical compound concentrations in liquid phase for CO2 loads bigger than 0.55.
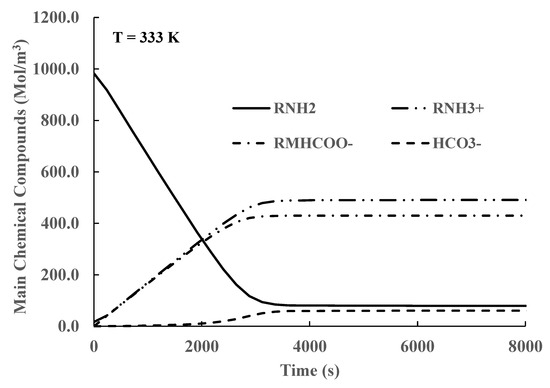
Figure 4.
Time variation in chemical compound concentrations in liquid phase for CO2 loads smaller than 0.55.
In Figure 3, it is shown that the CO2 absorption by MEA, Equation (3), is the main reaction until 3000 s. This reaction consumes MEA () while producing approximately equivalent amounts of carbamate () and protonated MEA (). At longer times, the amount of MEA is very small, and the production of becomes the main reaction. The carbamate () concentration decreases by the reaction given by Equation (8). After times longer than 6000 s, equilibrium is reached. This behavior agrees well with the values of the equilibrium concentrations reported in references [4,41] for the case of CO2 loads bigger than 0.55.
In Figure 4, we show similar results for CO2 loads smaller than 0.55. In this case, the concentration of MEA does not decrease as much as in the previous case, and there are contributions from Equations (3) and (5) until equilibrium is achieved. This behavior also agrees well with the values reported in references [4,41] for CO2 load values smaller than 0.55. The authors validated their simulation results by comparing their calculated results for several CO2 load values against the ones reported by Greer [4].
A set of simulations for constant liquid phase temperature are shown in Figure 5, Figure 6, Figure 7, Figure 8 and Figure 9. The CO2 absorbed in the liquid phase is stored as MEA carbamate (), bicarbonate (), carbonate () and free CO2 dissolved in the liquid phase (). However, at the pH values used in the simulations, most of the CO2 is stored as MEA carbamate and bicarbonate.
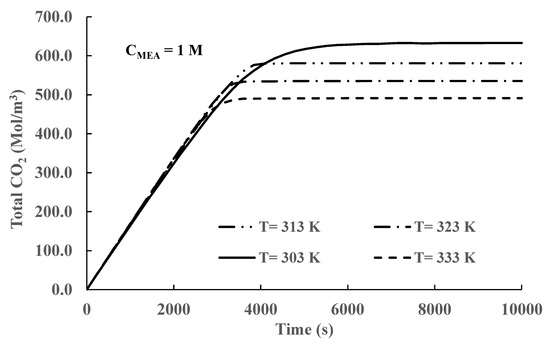
Figure 5.
Time variation in total CO2 concentration in the liquid phase for different temperatures (Initial CMEA = 1 M).
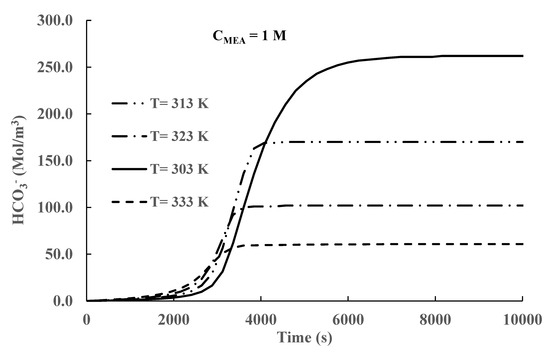
Figure 6.
Time variation in bicarbonate concentration in the liquid phase (Initial CMEA = 1 M).
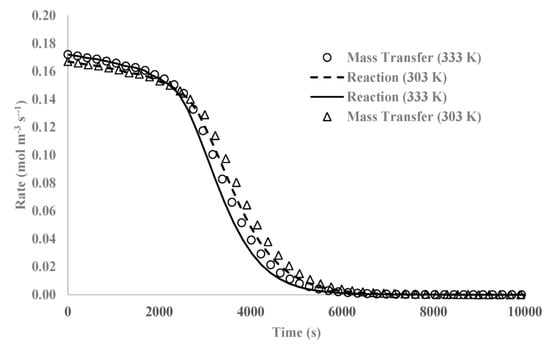
Figure 7.
Comparison between mass transfer and reaction rates for different temperatures.
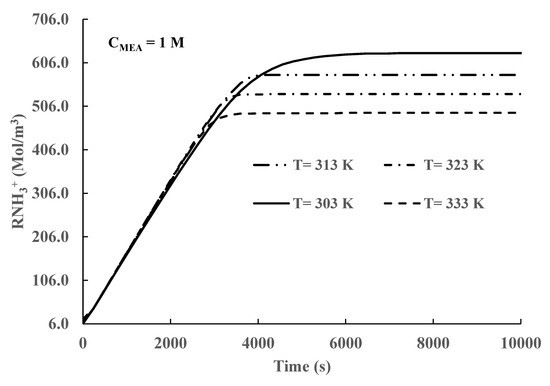
Figure 8.
Protonated MEA concentration in the liquid phase vs time.
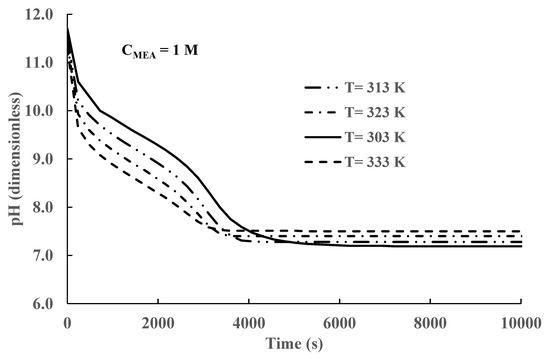
Figure 9.
Time variation in solvent pH at different temperatures.
Figure 5 shows the total CO2 concentration in the liquid phase at different constant temperatures. The temperature inside the reactor is maintained constant by heat exchange with the cooling jacket. Results depicted in Figure 5 show that at times below 3000 s, there are no significant differences in the absorbed amounts of CO2 for the different temperatures used in the simulations. At longer times, there is an increase in absorbed concentrations for lower temperature values. At times longer than 6000 s, constant concentration values are achieved in all cases. The long-time results indicate that equilibrium has been achieved in all cases. This conclusion was confirmed by comparison of the values of the equilibrium constants calculated by the formulas presented in the supplemental materials and the ones calculated using the equilibrium values of the concentrations of the chemical species appearing in Equations (3) and (5) for all temperatures. The results presented in Figure 5 also show that equilibrium is reached faster at higher temperatures. This behavior is produced because the rate of reaction depends upon the value of the forward equilibrium constant (kif) in all cases. The formulas reported in the supplementary materials show that all the values of specific rate constantly increase with increasing temperatures. In conclusion, decreasing temperatures produce higher CO2 absorption due to the increased value of the equilibrium constants for the exothermic reaction given by Equation (3). However, decreasing temperatures delay equilibrium as the forward-specific rate constantly decreases in value.
Similar results for bicarbonate absorption are presented in Figure 6. The time behavior of the variation in the bicarbonate concentration with time is like the one shown in Figure 5. At long times, equilibrium is reached, but the bicarbonate process requires longer times to reach equilibrium than MEA carbamate formation. Bicarbonate formation is driven by high pH, and there is still non-negligible CO2 absorption for pH values above 7. The results presented in Figure 6 also show that higher absorption is achieved at lower temperatures, reflecting the increase in equilibrium constants as the temperature is decreased. A comparison of the results presented in Figure 5 and Figure 6 shows that the MEA carbamate concentrations are more than an order of magnitude higher (>13 times) than the bicarbonate concentrations. Therefore, MEA carbamate formation is the principal mechanism of CO2 absorption.
The results depicted in Figure 5 show that at short and medium times, the amount of CO2 absorbed is practically independent of temperature at short times, and there is a small increase as the temperature increases until equilibrium is reached. To find the reason for this unexpected behavior, we carried out simulations calculating the absolute values of mass transfer and reaction rates for all times. Typical calculated results are shown in Figure 7. At short times, both the mass transfer and the reaction rates have the same value. The developed computer code operates by comparing both values and selecting the smaller value. This value determines the controlling mechanism, kinetic or mass transfer control, and then calculates all concentrations using the controlling mechanism value. In conclusion, an equal value means that the system is mass transfer controlled. At short times, mass transfer rates increase only slightly with increasing temperature, and the calculated concentration values at different temperatures are very similar. At longer times, the reaction rate decreases in value due to the decrease in reactant amount () and the system becomes kinetically controlled; however, CO2 absorption is driven by the value of Equation (3) forward specific reaction constant that increases in value as temperature increases. Once equilibrium is reached, the value of the CO2 absorbing species is determined by the values of the equilibrium constants that are higher for smaller temperatures.
Another product of CO2 absorption by MEA is protonated MEA (), Equation (3). The time variation in the concentration of protonated MEA is shown in Figure 8. The results depicted in Figure 8 show that the time variation in protonated MEA concentration is equal to the formation of MEA carbamate. However, the concentration values of protonated MEA are higher than the equivalent values of MEA carbamate produced. This difference can be explained if we consider that protonated MEA also depends upon the pH values through Equation (7). An increase in the protonated MEA values suggests that Equation (7) is displaced to the left during the process. This change will produce an increase in the number of protons () and, therefore, a decrease in pH. The value of protonated MEA concentration also increases as the liquid phase temperature decreases.
The variation in pH with time and temperature is shown in Figure 9. The results presented in Figure 8 show that, for a constant temperature, the pH decreases continuously as CO2 is absorbed. However, for different temperatures, the pH values increase as the temperature decreases during the transient period at time values smaller than 6000 s. After equilibrium is reached, time > 6000 s, the pH values decrease as temperature decreases.
In Table 2 we present a summary of typical results for constant temperature operation and different values of liquid phase temperatures and initial MEA concentration values.

Table 2.
Typical simulation results calculated for a semi-batch reactor (Tg = 333 K, Qg = 3.34 × 10⁻⁵ m3/s, and rpm = 400 1/min).
The results presented in Figure 5, Figure 6, Figure 7, Figure 8 and Figure 9 and Table 2 demonstrate that CO2 absorption increases as the liquid phase temperature decreases once steady state is achieved. The extra amount absorbed is more than 28 % with respect to operation at the highest temperature (333 K). The behavior is produced by the increase in the equilibrium constant values given by Equations (3) and (5). This finding creates the possibility of increasing absorption by reaction temperature manipulation. However, some practical problems remain. In all our simulations, we maintained the liquid phase constant by adequate cooling. In typical industrial processes, the gas phase is at high temperatures [27,28]; therefore, a significant energy expense could be required to achieve the necessary lower temperatures. Procedures to reduce this cost are necessary. Inspection of Figure 5, Figure 6, Figure 7, Figure 8 and Figure 9 shows that, for this reactor, CO2 absorption is cumulative and reaches an equilibrium (saturation) value beyond which there is negligible additional absorption. An analysis of the heat transfer processes in the liquid phase shows that there are three main heat transfer mechanisms: heat generated by exothermic chemical reactions, heat used to vaporize the molecules of liquid solvents, and sensible heat exchange between the gas and liquid phases. The solvent temperature increases by the heat released by the exothermic reaction’s decrease due to the latent heat of vaporization of the solvent into the gas phase and typically will increase or decrease by heat transfer between the gas and the liquid phases. Considering the three heat transfer mechanisms, a moderate increase in the liquid temperature can be expected in most practical cases. If this is the case, it is possible to start reactor operation without cooling and start the cooling process later. The energy savings by not cooling the reactor at short times can exceed the extra energy expenses by starting to cool the reactor at longer times or higher temperatures. Extra energy savings can be obtained by stopping reactor operation once equilibrium is achieved. This cooling strategy was tested by running simulations where no cooling was applied for the first 3000 s, and at that time, cooling heat transfer was started. The results are presented in Figure 10 and Figure 11.
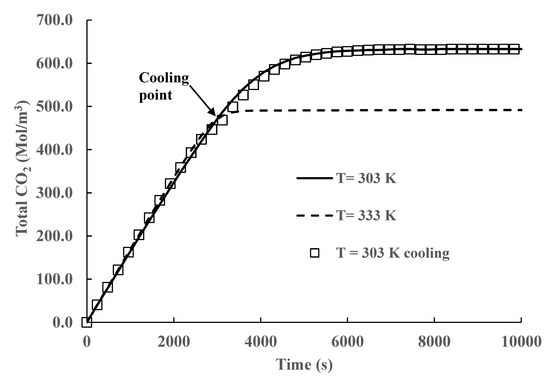
Figure 10.
Time variation in total CO2 concentration with and without cooling.
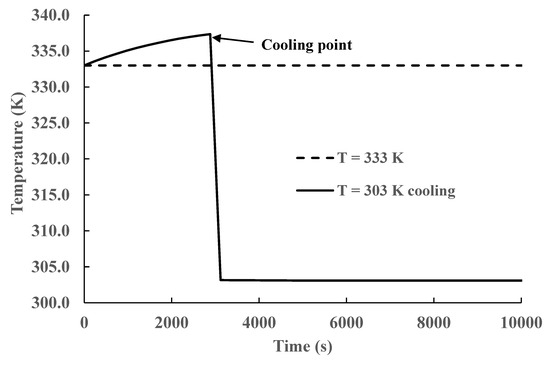
Figure 11.
Temperature variation vs. time with and without total cooling.
A comparison of the time variation in total CO2 concentration with total and partial cooling of the reactor is shown in Figure 10. In the case of partial cooling, the reaction is run without cooling until equilibrium is achieved for the highest temperature (333 K), approximately 3000 s for a 1 M initial MEA concentration. After this time, cooling is started at the lowest temperature (303 K) used in our simulations. The results presented in the figure show that there is little difference in CO2 absorption for both strategies. Furthermore, the simulation results show that after 6000 s, right before equilibrium is reached, there is only a small increase in CO2 absorption. Therefore, it is possible to achieve similar CO2 loads using cooling during the whole operation and using cooling only during the interval from 3000 s to 6000 s. The cooling savings by using this strategy will be approximately 50% of the total. This behavior is produced because the heat released by the exothermic reactions is partially offset by solvent evaporation at short times and heat transfer between both phases. There is a small increase in temperature in the liquid phase, reducing the value of the equilibrium constant, but this temperature increase does not significantly reduce CO2 absorption at short times. Starting cooling right before equilibrium is achieved reduces the liquid phase temperature, which increases the equilibrium constant without significant differences from the long-time behavior with total cooling. In Figure 11, we plot the temperature evolution for both strategies. We can see that there is a moderate increase in temperature, from 333 to 337 K, without cooling at short times, but the main effect of this temperature increase is a faster CO2 absorption than in the case of total cooling. The temperature behavior at short times has no effect on the final equilibrium values as the system is far away from equilibrium.
The calculated results presented in Table 2 show that an increase in the initial MEA concentration results in a lower CO2 load. In Figure 12, we plot the total CO2 concentration for different initial MEA concentrations. It is shown in Figure 11 that there is a significant increase in the total CO2 concentration values with increasing initial MEA concentrations. However, the results presented in Figure 11 also show that there is a significant increase in the time needed to reach equilibrium. Inspection of the results reported in Table 2 also shows that there is a decrease in the CO2 load as the initial MEA concentration increases. To reach an optimum absorption process, these effects must be considered carefully because they work in opposite directions. Operation at low initial MEA concentrations produces higher loads, and equilibrium is reached faster; therefore, several batches can be run during the operation time of a higher MEA concentration process. A higher initial MEA concentration operation, however, absorbs a higher amount of CO2 than a lower initial MEA concentration process; therefore, during the required MEA regeneration step, significant savings may be achieved by dealing with one batch of a concentrated solution and not several batches of a more dilute solution, with all batches having similar volumes. It is beyond the scope of this study to conduct a quantitative analysis of the costs involved; however, the presented results support the use of temperature manipulation to increase CO2 absorption and lower operating costs.
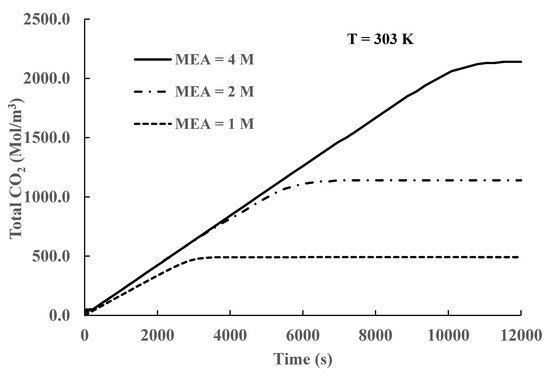
Figure 12.
Total CO2 concentration variation for different initial MEA concentrations.
4. Conclusions
The influence of reaction temperature manipulations to increase product yields has been numerically studied. A theoretical model of the operation of a semi-batch reactor has been implemented in a custom computer code. The model has been validated against experimental and literature data. The calculated results agree with the theoretical predictions that, in the case of exothermic reactions, a decrease in the liquid phase temperature will increase CO2 load by increasing the value of the equilibrium constant. The results also agree with theoretical predictions that as the liquid phase temperature decreases, the time needed to reach equilibrium increases. Based on the calculated results, a strategy to increase product formation while reducing cooling costs can be proposed. CO2 absorption can be increased by more than 28% by reducing 30 °C the operating reactor temperature. The selection of optimal times to start and finish the cooling process is critical to produce significant energy savings, up to more than 50% compared to total cooling. It is recommended that the reaction process is initiated without cooling. The cooling process should be initiated right at the point when equilibrium will be reached without cooling. Our simulation results showed that the cool-down liquid phase will behave similarly to an equivalent system with cooling during the whole reactor operation.
High initial MEA concentration operations reduce the CO2 load but increase the absolute CO2 amount absorbed and the time required to achieve equilibrium. The design of an optimum absorption process requires careful balancing of these opposed effects. The results presented in this study support the use of reactor temperature manipulation to increase CO2 absorption and lower operating costs. The development of more efficient capture processes, especially from concentrated point sources, can lead to a substantial reduction in carbon dioxide emissions.
Supplementary Materials
The following supporting information can be downloaded at: https://www.mdpi.com/article/10.3390/en16186522/s1.
Author Contributions
J.F.G. participated in methodology, software, validation, and writing—original draft and C.T. participated in conceptualization, funding acquisition, project supervision, and writing—review and editing. All authors have read and agreed to the published version of the manuscript.
Funding
The work by C.T. was partially supported by the U.S. Department of Energy, Office of Fossil Energy and Carbon Management. Partial support (J.F.G.) by a RISE Grant from the office of the Vice-President of Research at PVAMU is kindly acknowledged. This study was conducted at Prairie View A&M University and the Oak Ridge National Laboratory (ORNL).
Data Availability Statement
See notice below concerning policies from the USA government related to data generated in US governmental agencies.
Conflicts of Interest
The authors declare no conflict of interest.
Notice
This manuscript has been authored by UT-Battelle, LLC under Contract No. DE-AC05-00OR22725 with the U.S. Department of Energy. The United States Government retains and the publisher, by accepting the article for publication, acknowledges that the United States Government retains a non-exclusive, paid-up, irrevocable, world-wide license to publish or reproduce the published form of this manuscript, or allow others to do so, for United States Government purposes. The Department of Energy will provide public access to these results of federally sponsored research in accordance with the DOE Public Access Plan (http://energy.gov/downloads/doe-public-access-plan (accessed on 26 June 2023).
Nomenclature
| aw | Interface area per unit volume (m−1) |
| bi | Blade height (m) |
| Concentration of i-species in k-phase (mol m−3) | |
| Species-i gas phase concentration (mol m−3) | |
| Species-i liquid phase concentration (mol m−3) | |
| Species-i liquid phase equilibrium concentration (mol m−3) | |
| Input gas phase concentrations of i-component (mol m−3) | |
| Output gas phase concentrations of i-species (mol m−3) | |
| Heat capacities of the i-component (J mol−1 K−1) | |
| Heat capacities of the i-component (J mol−1 K−1) | |
| Gas bubble Sauter diameter (m) | |
| Column diameter (m) | |
| DCO2 | CO2 diffusion coefficient (m2 s−1) |
| di | Impeller diameter (m) |
| dT | Reactor diameter (m) |
| Gas phase hold-up (Vg/VT) | |
| E | Enhancement factor (dimensionless) |
| Gas flow number (dimensionless | |
| H | Reactor height (m) |
| Liquid-side CO2 mass transfer coefficient (m s−1) | |
| Forward specific reaction rate constant (m3 mol−1 s−1) | |
| Reverse specific rate constant (m3 mol−1 s−1) | |
| Ki | Equilibrium constant for i-reaction (variable) |
| MEA | Monoethanol amine |
| N | Rotational speed (rps) |
| Molar flow of component-i from the gas into the liquid phase (mol m−3 s−1) | |
| Power consumed by the stirrer with gas phase present (W) | |
| pH | Liquid phase pH (dimensionless) |
| Power consumed by the stirrer without gas phase (W) | |
| Q | Heat of reaction (J mol−1) |
| Qg | Gas flow rate (m3 s−1) |
| R | Alkyl group |
| Mols of species-i generated by chemical reaction (mol m−3 s−1) | |
| Temperature of the gas phase (K) | |
| Temperature of the input gas stream (K) | |
| Temperature of the liquid stream (K) | |
| Global heat transfer coefficient (J m−2 K−1 s−1) | |
| Gas superficial velocity (m s−1) | |
| Liquid superficial velocity (m s−1) | |
| Liquid phase volume (m3) | |
| Total reactor volume (m3) | |
| Greek letters | |
| Heat of vaporization for the i-species (J mol−1) | |
| Heat released by chemical reaction (J mol−1) | |
| Liquid phase density (kg m−3) | |
| Liquid phase surface tension (N m−1) |
Appendix A

Table A1.
List of compounds participating in the reaction scheme.
Table A1.
List of compounds participating in the reaction scheme.
| Compound No | Gas | Liquid |
|---|---|---|
| 1 | N2 (g) | MEACO2− |
| 2 | O2 (g) | MEA+ |
| 3 | CO2 (g) | HCO3− |
| 4 | H2O (g) | OH− |
| 5 | MEA (g) | MEA (aq.) |
| 6 | - | CO2 (aq.) |
| 7 | - | H+ |
| 8 | - | CO32− |
References
- IPCC. 2022: Summary for Policymakers. In Climate Change 2022: Mitigation of Climate Change. Contribution of Working Group III to the Sixth Assessment Report of the Intergovernmental Panel on Climate Change; Shukla, P.R., Skea, J., Slade, R., Al Khourdajie, A., van Diemen, R., McCollum, D., Pathak, M., Some, S., Vyas, P., Fradera, R., et al., Eds.; Cambridge University Press: Cambridge, UK; New York, NY, USA, 2022. [Google Scholar] [CrossRef]
- Masson-Delmotte, V.; Zhai, P.; Pörtner, H.-O.; Roberts, D.; Skea, J.; Shukla, P.R.; Pirani, A.; Péan, W.M.-O.C.; Pidcock, R.; Connors, S.; et al. (Eds.) Global Warming of 1.5 °C. An IPCC Special Report on the Impacts of Global Warming of 1.5 °C above Pre-Industrial Levels and Related Global Greenhouse Gas Emission Pathways, in the Context of Strengthening the Global Response to the Threat of Climate Change, Sustainable Development, and Efforts to Eradicate Poverty; IPCC: Geneva, Switzerland, 2018. [Google Scholar]
- Aaron, D.; Tsouris, C. Separation of CO2 from Flue Gas: A Review. Sep. Sci. Technol. 2005, 40, 321–348. [Google Scholar] [CrossRef]
- Greer, T. Modeling and Simulation of Post Combustion CO2 Capturing. Master’s Thesis, Telemark University College, Faculty of Technology, Porsgrunn, Norway, 2008. [Google Scholar]
- Bosch, H.; Versteeg, G.F.; van SwaaiJ, W.P.M. Gas-Liquid Mass Transfer with Parallel Reversible Reactions-III. Absorption of CO2 into Solutions of Blends of Amines. Chem. Eng. Sci. 1989, 44, 2745–2750. [Google Scholar]
- Hagewiesche, D.P.; Ashour, S.S.; Al-Ghawas, H.A.; Sandall, O.C. Absorption of Carbon Dioxide into Aqueous Blends of Monoethanolamine and Methyldiethanolamine. Chem. Eng. Sci. 1995, 50, 1071–1079. [Google Scholar] [CrossRef]
- Sakwattanapong, R.; Aroonwilas, A.; Veawab, A. Reaction Rate of CO2 in Aqueous MEA-AMP Solution: Experiment and Modeling. Energy Procedia 2009, 1, 217–224. [Google Scholar] [CrossRef]
- Gabitto, J.; Tsouris, C. Carbon Dioxide Absorption Modeling for Off-Gas Treatment in the Nuclear Fuel Cycle. Int. J. Chem. Eng. 2018, 2018, 3158147. [Google Scholar] [CrossRef]
- Kasturi, A.S.; Ladshaw, A.; Yiacoumi, S.; Gabitto, J.; Garrabrant, K.; Custelcean, R.; Tsouris, C. CO2 Absorption from Simulated Flue Gas in a Bubble Column. Sep. Sci. Technol. 2019, 54, 2034–2046. [Google Scholar] [CrossRef]
- Versteeg, G.F.; Holst, J.V.; Politiek, P.P.; Niederer, J.P. CO2 Capture from Flue Gas Using Amino Acid Salt Solutions. June 2006. Available online: http://www.co2-cato.nl/doc.php?lid=317 (accessed on 9 April 2018).
- van Holst, J.; Versteeg, G.F.; Brilman, D.W.F.; Hogendoorn, J.A. Kinetic Study of CO2 with Various Amino Acid Salts in Aqueous Solution. Chem. Eng. Sci. 2009, 64, 59–68. [Google Scholar] [CrossRef]
- Vaidya, P.D.; Konduru, P.; Vaidyanathan, M.; Kenig, E.Y. Kinetics of Carbon Dioxide Removal by Aqueous Alkaline Amino Acid salts. Ind. Eng. Chem. Res. 2010, 49, 11067–11072. [Google Scholar] [CrossRef]
- Simons, K.; Brilman, D.W.F.; Mengers, H.; Nijmeijer, K.; Wessling, M. Kinetics of CO2 Absorption in Aqueous Sarcosine Salt Solutions: Influence of Concentration, Temperature, and CO2 Loading. Ind. Eng. Chem. Res. 2010, 49, 9693–9702. [Google Scholar] [CrossRef]
- Shen, S.; Yang, Y.N.; Bian, Y.; Zhao, Y. Kinetics of CO2 Absorption into Aqueous Basic Amino Acid Salt: Potassium Salt of Lysine Solution. Environ. Sci. Technol. 2016, 50, 2054–2063. [Google Scholar] [CrossRef]
- Seipp, C.A.; Williams, N.J.; Kidder, M.K.; Custelcean, R. CO2 Capture from Ambient Air by Crystallization with a Guanidine Sorbent. Angew. Chem. Int. Ed. 2017, 56, 1042–1045. [Google Scholar] [CrossRef] [PubMed]
- Brethomé, F.M.; Williams, N.J.; Seipp, C.A.; Kidder, M.K.; Custelcean, R. Direct Air Capture of CO2 via Aqueous-Phase Absorption and Crystalline-Phase Release using Concentrated Solar Power. Nat. Energy 2018, 3, 553–559. [Google Scholar] [CrossRef]
- Williams, N.J.; Seipp, C.A.; Brethomé, F.M.; Ma, Y.-Z.; Ivanov, A.S.; Bryantsev, V.S.; Kidder, M.K.; Martin, H.J.; Holguin, E.; Garrabrant, K.A.; et al. CO2 Capture via Crystalline Hydrogen-Bonded Bicarbonate Dimers. Chem 2019, 5, 719–730. [Google Scholar] [CrossRef]
- Custelcean, R.; Williams, N.J.; Garrabrant, K.A.; Agullo, P.; Brethomé, F.M.; Martin, H.J.; Kidder, M.K. Direct Air Capture of CO2 with Aqueous Amino Acids and Solid Bis-iminoguanidines (BIGs). Ind. Eng. Chem. Res. 2019, 58, 23338–23346. [Google Scholar] [CrossRef]
- Mahmud, N.; Benamor, A.; Nasser, M.S.; Al-Marri, M.J.; Qiblawey, H.; Tontiwachwuthikul, P. Reaction Kinetics of Carbon Dioxide with Aqueous Solutions of L-Arginine, Glycine & Sarcosine using the Stopped Flow Technique. Int. J. Greenh. Gas Control 2017, 63, 47–58. [Google Scholar]
- Kasturi, A.; Gabitto, J.F.; Custelcean, R.; Tsouris, C. A Process Intensification Approach for CO2 Absorption using Amino Acid Solutions and a Guanidine Compound. Energies 2021, 14, 5821. [Google Scholar] [CrossRef]
- Kim, Y.-H.; Park, L.K.; Yiacoumi, S.; Tsouris, C. Modular Chemical Process Intensification: A Review. Annu. Rev. Chem. Biomol. Eng. 2017, 8, 359–380. [Google Scholar] [CrossRef]
- Le Chatelier, H.L. Sur un énoncé générale des lois des équlibres chimiques. Comptes Rendus Académie Sci. 1884, 99, 786–789. [Google Scholar]
- Hillert, M. Le Chatelier’s Principle—Restated and Illustrated with Phase Diagrams. JPE 1995, 16, 403–410. [Google Scholar] [CrossRef]
- Fogler, H.S. Elements of Chemical Reaction Engineering, 5th ed.; Prentice Hall: Upper Saddle River, NJ, USA, 2016. [Google Scholar]
- Jamal, A.; Meisen, A.; Lim, C.J. Kinetics of Carbon Dioxide Absorption and Desorption in Aqueous Alkanolamine Solutions using a Novel Hemispherical Contactor—I. Experimental Apparatus and Mathematical Modeling. Chem. Eng. Sci. 2006, 61, 6571–6589. [Google Scholar]
- Jamal, A.; Meisen, A.; Lim, C.J. Kinetics of Carbon Dioxide Absorption and Desorption in Aqueous Alkanolamine Solutions using a Novel Hemispherical Contactor—II. Experimental Results and Parameter Estimation. Chem. Eng. Sci. 2006, 61, 6590–6603. [Google Scholar]
- Jang, G.G.; Thompson, J.A.; Sun, X.; Tsouris, C. Process Intensification of CO2 Capture by Low-Aqueous Solvent. Chem. Eng. J. 2021, 426, 131240. [Google Scholar] [CrossRef]
- Tsouris, C.; Jang, G.G.; Thompson, J.A.; Lai, C.; Sun, X. Demonstration and Validation of Additively Manufactured Intensified Device for Enhanced Carbon Capture; Oak Ridge National Lab.: Oak Ridge, TN, USA, 2021. [Google Scholar] [CrossRef]
- Kvamsdal, H.M.; Rochelle, G.T. Effects of the Temperature Bulge in CO2 Absorption from Flue Gas by Aqueous Monoethanolamine. Ind. Eng. Res. 2008, 47, 867–875. [Google Scholar] [CrossRef]
- Kvamsdal, H.M.; Jakobsen, J.P.; Hoff, K.A. Dynamic Modeling and Simulation of a CO2 Absorber Column for Post-Combustion CO2 Capture. Chem. Eng. Process. Process Intensif. 2009, 48, 135–144. [Google Scholar] [CrossRef]
- Bailey, J.E.; Ollis, D.F. Biochemical Engineering Fundamentals, 2nd ed.; McGraw-Hill: New York, NY, USA, 1986. [Google Scholar]
- Zhang, J.; Smith, R. Design and Optimization of Batch and Semi-Batch Reactors. Chem. Eng. Sci. 2004, 59, 459–478. [Google Scholar] [CrossRef]
- Katoh, S.; Horiuchi, J.-I.; Yoshida, F. Biochemical Engineering, 2nd ed.; Wiley & Sons, WILEY-VCH Verlag GmbH & Co. KgaA: Weinheim, Germany, 2015. [Google Scholar]
- Gabitto, J.; Custelcean, R.; Tsouris, C. Simulation of Carbon Dioxide Absorption by Amino Acids in Two-Phase Batch and Bubble Column Reactors. Sep. Sci. Technol. 2019, 54, 2013–2015. [Google Scholar] [CrossRef]
- Morsi, B.I.; Basha, O.M. Mass Transfer in Multiphase Systems. In Mass Transfer-Advancement in Process Modelling; Solecki, M., Ed.; IntechOpen: London, UK, 2017. [Google Scholar] [CrossRef][Green Version]
- Perry, R.H.; Green, D.W. Chemical Engineers Handbook, 7th ed.; McGraw-Hill: New York, NY, USA, 1999. [Google Scholar]
- Richardson, J.H.; Harker, J.H.; Backhurst, J.R. Chemical Engineering. Vol. 2, Particle Technology and Separation Processes, 5th ed.; Butterworth-Heinemann: Oxford, UK, 2008. [Google Scholar]
- Bouaifi, M.; Hebrard, G.; Bastoul, D.; Roustan, M. A Comparative Study of Gas Hold-Up, Bubble Size, Interfacial Area and Mass Transfer Coefficients in Stirred Gas-Liquid Reactors and Bubble Columns. Chem. Eng. Process. 2001, 40, 97–111. [Google Scholar] [CrossRef]
- Luan, D.; Zhang, S.; Wei, X.; Chen, Y.-M. Study on Mathematical Model to Predict Aerated power Consumption in a Gas-Liquid Stirred Tank. Results Phys. 2017, 7, 4085–4088. [Google Scholar] [CrossRef]
- Lee, J.C.; Meyrick, D.L. Gas–liquid Interfacial Area in Salt Solutions in an Agitated Tank. Trans. Inst. Eng. 1970, 48, T37. [Google Scholar]
- Liu, Y.; Zhang, L.; Watanasiri, S. Representing Vapor-Liquid Equilibrium for an aqueous MEA-CO2 System using the Electrolyte Non-random Two Liquid Model. Ind. Eng. Chem. Res. 1999, 38, 2080–2090. [Google Scholar] [CrossRef]
Disclaimer/Publisher’s Note: The statements, opinions and data contained in all publications are solely those of the individual author(s) and contributor(s) and not of MDPI and/or the editor(s). MDPI and/or the editor(s) disclaim responsibility for any injury to people or property resulting from any ideas, methods, instructions or products referred to in the content. |
© 2023 by the authors. Licensee MDPI, Basel, Switzerland. This article is an open access article distributed under the terms and conditions of the Creative Commons Attribution (CC BY) license (https://creativecommons.org/licenses/by/4.0/).