1. Introduction
The energy market, specifically electricity exchange, is a dynamically developing system consisting of an increasing number of investors and traders. The number of directly appearing consumers has also shown an upward trend in recent years. Electricity, as well as gas and refined petroleum products, constitute a significant part of the consumption basket of European households and companies. Since energy products are essential components of almost all end products and services, any change in energy prices directly impacts the general price level of those end products and services. Residential energy policy and consumer prices in Europe are influenced by the construction industry’s reduction in energy consumption, technological performance improvements, rational energy consumption, and the transition to renewable sources [
1,
2]. The market is dominated by complex interactions, as energy, especially electricity, is a product that is cumbersome and costly to store. Market participants shape prices using external and internal information, and the analysis of this stochastic dynamic is not yet significant in the scientific world, especially when comparing it to, for example, financial markets and stock exchanges [
3,
4]. Electricity is a commodity that can be traded and transported; however, it cannot be stored. It is traded to manage fluctuations in energy supply and to compensate for an area’s energy shortage with surplus energy from another region. Two major factors have significantly disrupted the electricity market’s balance in the last four years: the coronavirus pandemic and the Russian–Ukrainian conflict. Our work introduces a novel, innovative analysis method for examining electricity exchange data. We convert time series into networks and then compare their degree distributions using the overlap coefficient. Occasionally, the Jaccard similarity index is used for comparing the domain of distribution functions; however, we also point out its limitations, due to which the application of the overlap coefficient is more effective. In addition, unlike traditional correlation analysis, as discussed in our study, the method takes into account more than just the co-movement of data. When transforming data into networks, other properties are inherited into the network topology, such as data height and range, thus expanding the set of properties analyzed simultaneously.
1.1. The Algorithm of Power Exchanges
During the liberalization process of electricity trading, European countries established energy exchanges, providing a space for electricity trading. The EU integration significantly facilitated the creation of European electricity exchanges. From an economic perspective, electricity is a commodity that can be purchased and sold, making it tradable. Due to its nature, electricity is difficult to store and must be available on demand [
5,
6]. Consequently, unlike other products, it cannot be kept in stock, rationed, or have customers queued up under normal operating conditions. Furthermore, the market is dictated by the constantly changing demand and supply. An electricity exchange (also known as a power exchange or PX) is a system that enables purchases through buy orders and sales through sell orders. Exchanges can ensure adequate market liquidity and supply flexibility, and these platforms facilitate the optimization and balancing of production [
7]. The trading of derivative products contributes to long-term risk management. The principle of demand and supply is used to determine prices during the bidding process. The electricity market enables electricity trading between suppliers and consumers. The role of the wholesale market is to enable trade between producers, retailers, and other financial intermediaries for both short-term electricity delivery (spot market) and future delivery periods (futures market). An efficient market is one where electricity is traded at a price that minimizes production costs while meeting the demand. General market objectives include ensuring the efficient pricing of electricity production, incentivizing network services, and maintaining infrastructure. The impact of electricity exchange prices on end-consumer prices is not direct, but indirectly, it can play a role by providing transparent reference prices [
8]. The price signals provided by the exchange significantly impact both the competitive market and the regulated segment. The exchange can make production more efficient and optimal, and through wholesale prices, it can also reduce end-consumer prices [
9,
10,
11].
Wholesale transactions related to electricity are managed and settled by a market participant or an independent organization appointed explicitly for this function. Energy markets can fundamentally be distinguished into two types based on the trading time horizon: spot (immediate) and futures markets [
12,
13]. Within spot markets, intraday (intraday market, IDM) and day-ahead (day-ahead market, DAM) auction markets can be separated. Intraday auctions can be implemented as cross-border auctions or supplementary regional auctions. Day-ahead markets in most parts of Europe have been interconnected for several years (e.g., ENTSO-E), while intraday markets have only recently transitioned from national to European levels. There is also a difference in price formation between the two market types: day-ahead markets are generally organized as auctions, i.e., demand and supply are aggregated, while intraday markets are usually implemented as continuous trading. The latter enables market participants to create a balance in supply [
14,
15].
During the day-ahead market trading process, consumers must specify the amount they wish to purchase while setting a maximum price. Producers must follow a similar approach, specifying a minimum price above which they would like to sell a certain quantity. The quantity is measured in megawatt-hours (MWh), and the price is calculated in EURMWh. The market operator aggregates the submitted offers. Intraday market trading takes place in a manner similar to the DAM process, but this trading process is more akin to traditional stock exchange trading. Typically, hourly and quarter-hourly offers can be made and bid on, and where these prices and quantities meet, the transaction takes place.
1.2. COVID-19 Epidemic Impact on Power Exchanges
Before the pandemic, the promotion of competition, efficiency, and maximizing welfare were the pillars of electricity market analysis and policy strategies. The COVID-19 pandemic has posed significant challenges to economies and energy markets worldwide. [
16,
17]. European Union (EU) countries were no exception, and the pandemic’s economic impacts affected them in various ways. Within this context, electricity markets played a crucial role in stabilizing economies and ensuring energy supply for different countries [
18]. Following the outbreak of the pandemic, governments worldwide implemented strict measures to slow down and stop the spread of infections, including lockdowns, remote work, and distance learning. These measures drastically altered electricity consumption patterns [
19], significantly decreasing energy demand in the industrial and commercial sectors. In contrast, residential energy consumption increased markedly as people spent more time at home [
20]. Electricity markets reacted to these changes to varying degrees, depending on the structure of economies and the flexibility and depth of energy markets. As a result of the COVID-19 pandemic, the proportion and composition of energy sources also changed in EU countries. Due to the dramatic decline in consumption, the production of coal- and natural-gas-based power plants decreased, allowing for an increasing share of renewable energy sources, such as wind and solar power, in the energy mix [
21]. During the pandemic, renewable energy sources broke records in electricity production, partly due to the reduced energy demand and favorable weather conditions [
22].
1.3. Market Prices and Regulations
The evolution of electricity prices exhibits mean reversion and cyclical patterns, with extreme volatility and relatively frequent occurrences of outlier values. The risk associated with daily market operations stems from high price fluctuations. This is particularly true for spot prices, where volatility on a daily basis can reach up to 50%, which is more than ten times greater than for other energy products (natural gas and crude oil). The peculiar characteristics of prices necessitate the development of models aimed at simultaneously capturing such price features for forecasting, risk management, and the evaluation of electricity-driven derivative products. Electricity prices are highly volatile and unbalanced and change hourly or even by the minute in some markets due to the constant variations in supply and demand. They are influenced by numerous parameters, e.g., weather, time of day, supply disruptions, maintenance, and transmission system constraints. Electricity demand is subject to seasonal, weekly, and daily external factors and can be influenced by irregular events. The demand for electricity varies significantly in the electricity market, which implies substantial additional costs for suppliers. As a result of the COVID-19 pandemic, significant changes have occurred in electricity markets. The decrease in demand, plummeting oil and natural gas prices, and the increasing share of renewable energy sources all contributed to the decline in electricity prices in EU countries. Lower prices created opportunities for consumers to satisfy their growing interest in energy efficiency and green technologies [
21,
23].
Electricity market regulations also underwent significant changes during the pandemic, as governments and regulatory authorities were forced to respond quickly to changing market conditions. Policymakers aimed to ensure the stability and sustainability of the energy supply while promoting economic recovery and the green transition. New regulations included subsidies, tax incentives, and market interventions that encouraged the development of renewable energy sources, as well as the implementation of network development and modernization projects [
24].
1.4. Impact of the Russian–Ukrainian Conflict on Energy Markets
The Russian–Ukrainian conflict, which has been ongoing since 2022, also significantly impacts the European Union (EU) electricity market [
25]. Russian gas supplies previously covered a significant portion of the EU’s energy needs, and as a result, its energy security and electricity market stability were affected by the conflict’s developments. During the Russian–Ukrainian conflict, Russian gas supplies to the EU decreased substantially, making it increasingly challenging to meet energy needs. Due to disruptions in supply chains and a decline in Russian gas production, gas prices rose sharply, affecting the electricity market. The EU tried to alleviate its dependency on Russian gas by diversifying energy sources and increasing the use of alternative energy sources. Increasing the import of liquefied natural gas (LNG) in the Mediterranean region, enhancing gas supplies from Scandinavian countries and North Africa, and prioritizing investments in renewable energy sources came to the forefront.
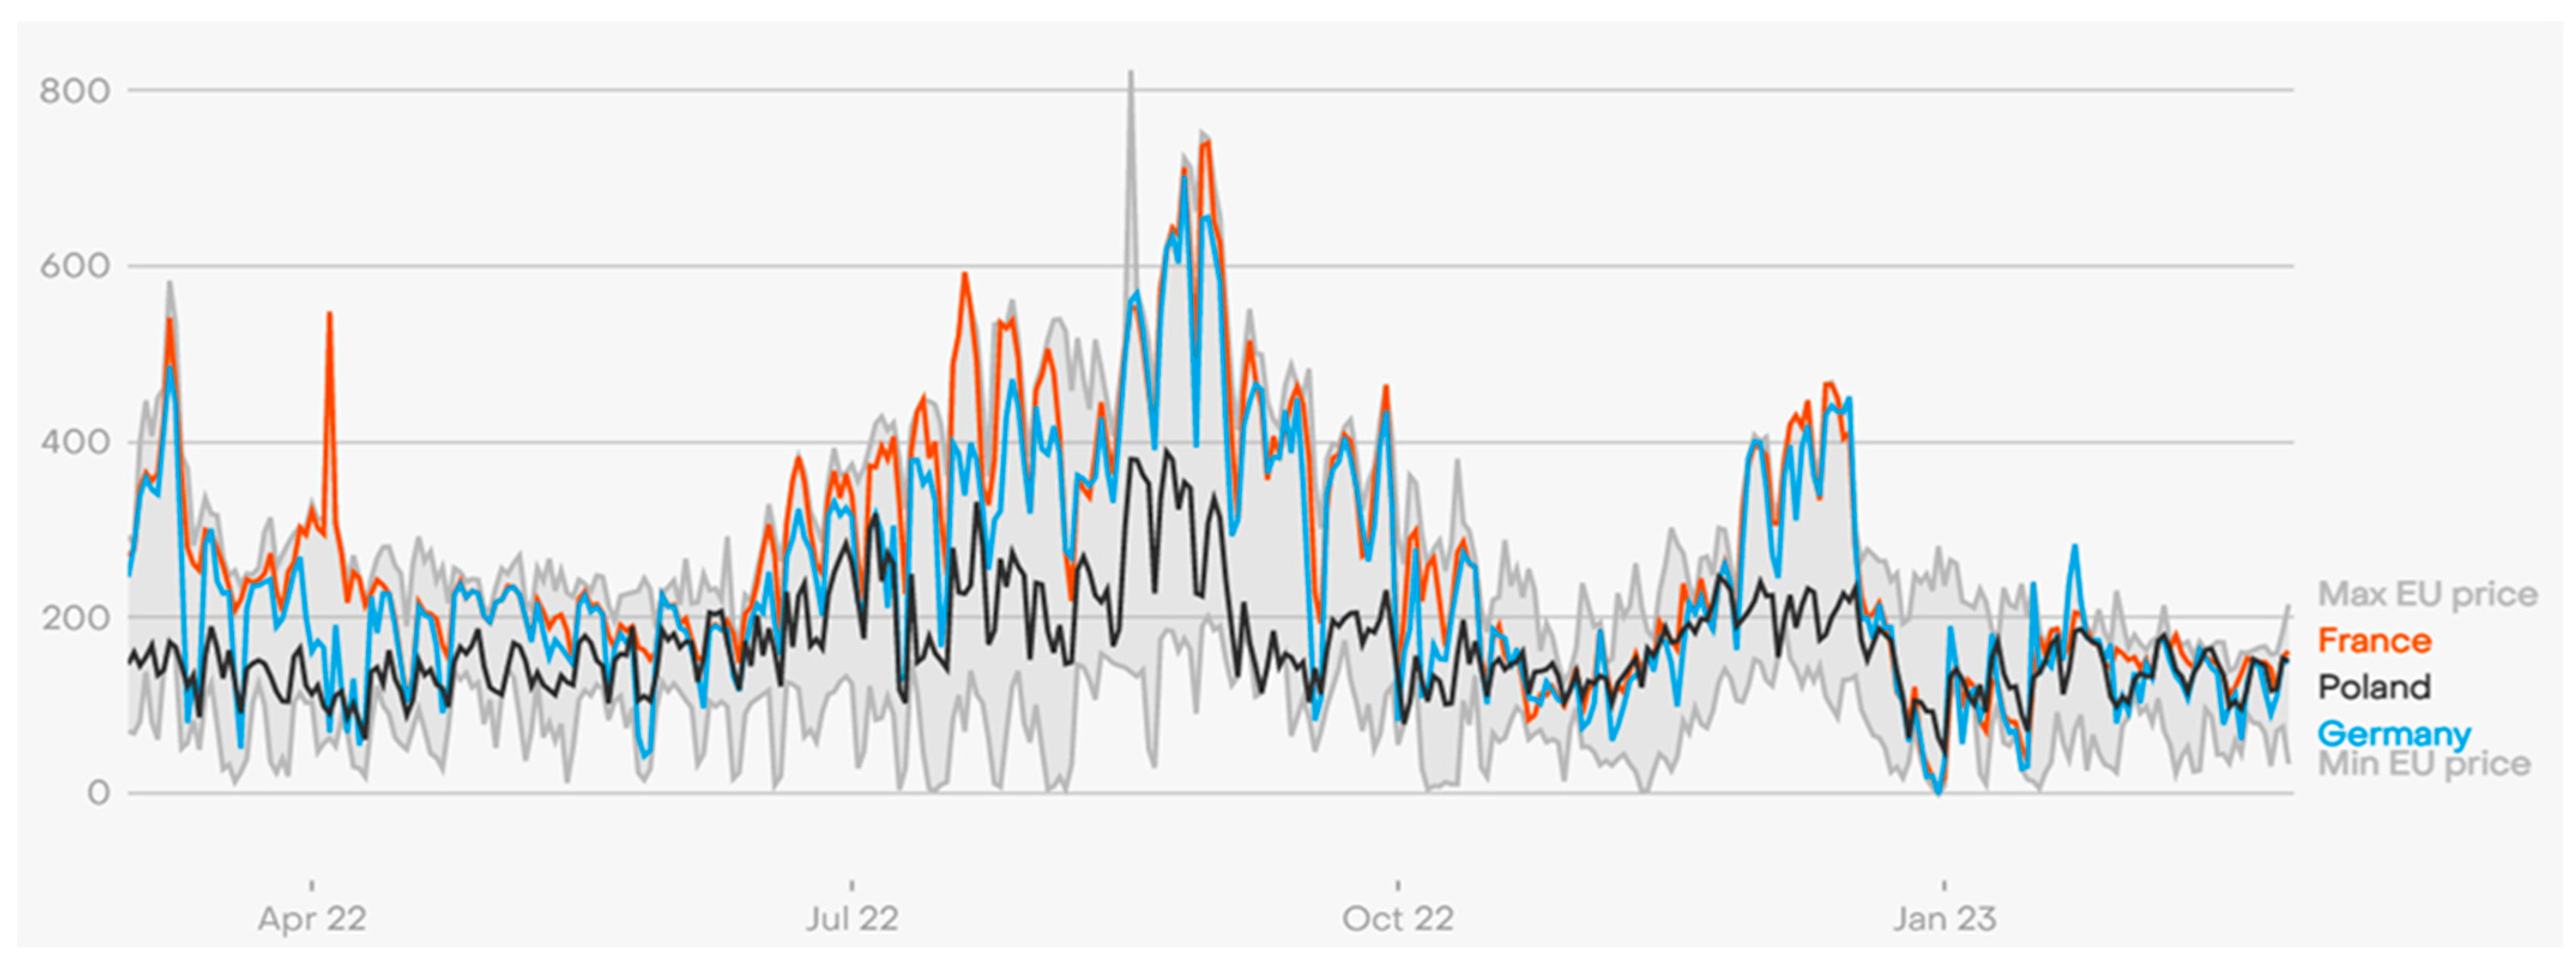
The decline in Russian gas supplies and the uncertainty surrounding the outcome of the conflict led to significant price increases in the EU electricity market. Electricity prices in the wholesale market increased considerably, resulting in higher prices for residential and industrial consumers. (
Figure 1)
The Russian–Ukrainian conflict and the volatility of gas supplies have significantly influenced the volatility of the EU electricity market. Due to supply uncertainties and geopolitical tensions, the market was exposed to rapid price fluctuations, causing instability in both the wholesale and retail markets. The EU developed a comprehensive energy strategy in response to the conflict-induced energy supply issues and the decline in gas supply. This strategy aimed at diversifying energy sources, increasing energy efficiency and raising the proportion of renewable energy sources. The EU invested in cross-border energy infrastructure development to ensure the stability of gas and electricity supply. The new infrastructure enabled a more flexible management of gas and electricity flows within the EU and promoted the diversification of energy sources. The EU also placed a greater emphasis on renewables, such as solar, wind, and biomass, as well as improving energy efficiency in buildings and industry. Through new technologies and investments, the proportion of renewable energy sources increased in the EU electricity market, reducing dependency on fossil fuels. The EU’s main challenge remains to maintain energy security amid geopolitical tensions. The EU must continuously diversify its energy sources and develop its energy infrastructure to handle future challenges and maintain energy supply stability. The EU should strive to ensure energy price stability to promote economic growth and competitiveness. This includes developing market regulations, combating abuse, and establishing an efficient energy pricing structure reflecting energy sources’ actual costs and value.
2. Materials and Methods
This study aims to conduct a comprehensive yet novel analysis of power exchange data between 2019 and 2022. During the analysis, we examined the data of the following 15 countries: Belgium (BE), Austria (AT), Czech Republic (CZ), Denmark (DK), Spain (ES), Greece (GR), Hungary (HU), Italy (IT), Netherlands (NL), Poland (PL), Portugal (PT), Slovenia (SL), Romania (RO), Slovakia (SK), and Germany (DE). The scientific and market-based reasons for selecting the countries are as follows:
Diversification: The countries included in the analysis are located in different geographical regions, making it important to examine these countries to understand the regional effects of the power exchange.
Energy structure: Each country relies on different energy sources, providing an opportunity to analyze the relationship between energy structure and power exchange.
Integration: Most countries included in the analysis are members of the European Union, allowing for the analysis of the effects of EU energy policy and the progress of power exchange integration.
Competition: Different competition regulations are applied in each country’s power exchange operation. The study can evaluate the effects of these regulations on market competition.
Market scope: Most countries included in the study play a significant role in the European power exchange market. Considering countries with a larger market share during the analysis is essential.
Trade relations: There are close trade relations between the countries included in the analysis, which influence power exchange markets and energy prices.
Infrastructure: There are significant differences between countries in terms of energy infrastructure development and transmission capacity. The study aims to reveal the effects of these differences on power exchange markets.
Prices and liquidity: The countries studied have different levels of prices and liquidity in power exchange markets. The countries included in the analysis provide an opportunity to understand the relationship between liquidity and pricing.
New technologies and innovation: New technologies and innovations (e.g., renewable energy sources, electricity storage, and digitalization) affecting power exchange markets spread to varying degrees in different countries. The study aims to reveal the impact of these technologies and innovations on power exchange markets.
2.1. Transforming Time Series into a Visibility Graph
The visibility graph is a new, common branch of network theory and statistics that describes complex systems by converting them into network structures and analyzing network metrics. The graph assumes many properties of the time series in its internal properties.
2.2. Mathematical Description of the Visibility Graph
The use of the visibility graph is a suitable technique for analysing time series with a large number of observations. The procedure involves converting the time series xi (i = 1, 2,…, N) into a graph, where (where V = (vi) i = 1, 2,…, N is the set of vertices and E is the edge parameter). In this case, each vi is the vertex of a given value xi in the graph generated.
First, we converted the discrete time series xt into a graph, where each time observation represents a node in the network, and then, we built a relationship between them based on the visibility criterion.
The visibility algorithm transforms the time series {
xi}
i = 1,…,N into a graph
, where
V = {
vi}
i = 1,…,N is the set of vertices (where the node vi is the element corresponding to the original time series data point
xi).
E = {
ei}
i = 1,…,N is the adjacency matrix of the graph with elements
eij = 1, if the following condition is satisfied:
In all other cases, eij = 0, so the value of the eij matrix is 1 in the case of an existing connection; in the absence of a connection, it is 0. N is the length of the time interval between i and j. Simply put, if two data points can be connected by an uninterrupted line in the bar graph, they are connected in the network.
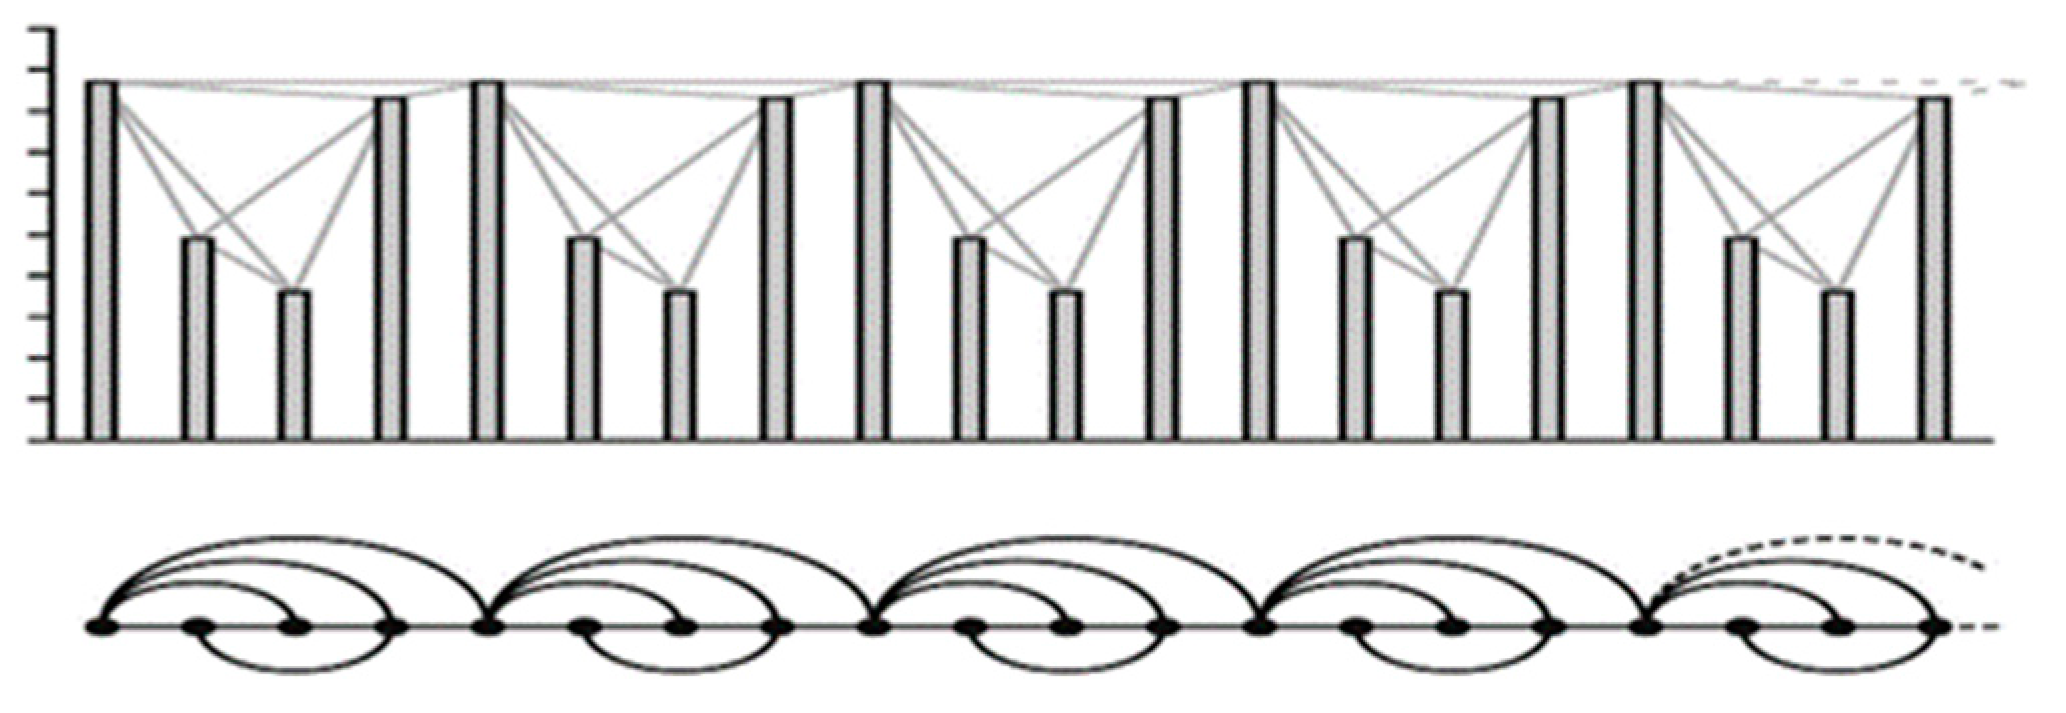
If this linkage is blocked by an intermediate (higher) value between the two values, the edge is not formed in the graph (
Figure 2). As can be seen, the height of each vertical column in the time-series bar chart represents the data for each time series, and each column represents a node in the corresponding graph. Hence, the two nodes of the lower graph are connected, or a joint is added if an unbroken line can be drawn between the two data on the upper graph.
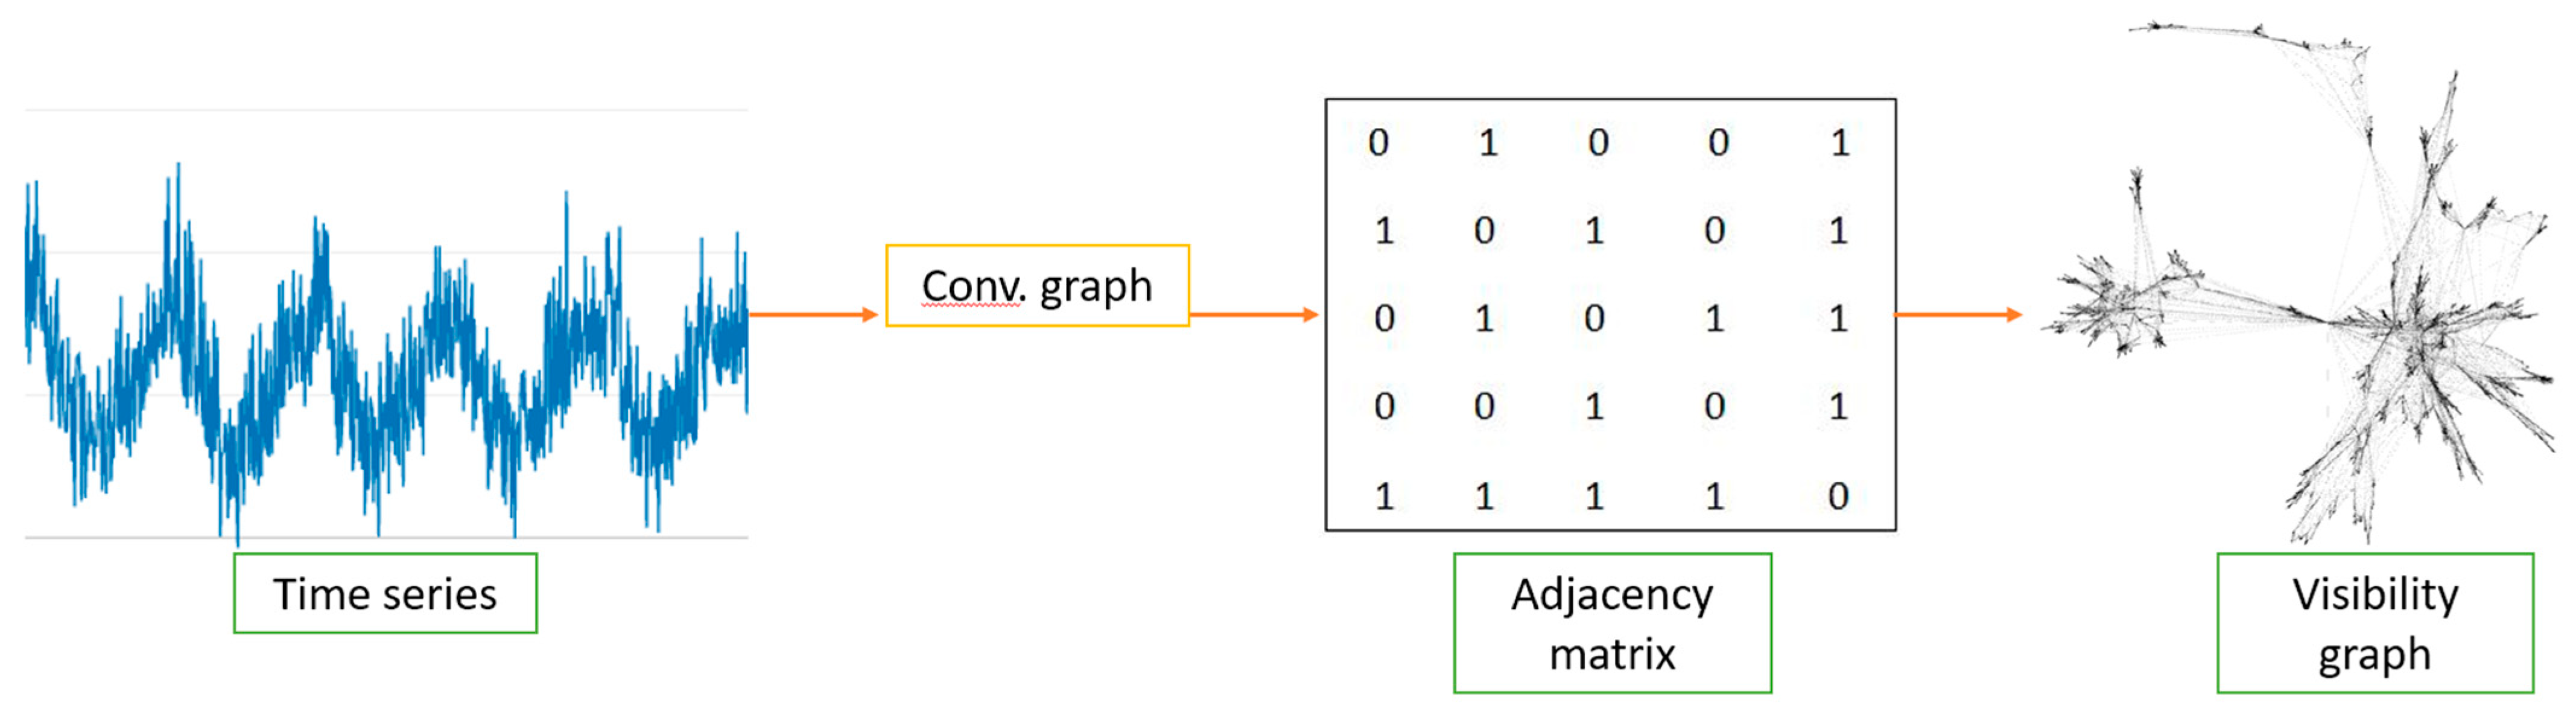
The resulting networks can be used to create adjacency matrices for the corresponding time series or visibility graphs (
Figure 3) and then apply network science methods and metrics to analyze the time-series data [
26,
27,
28,
29,
30].
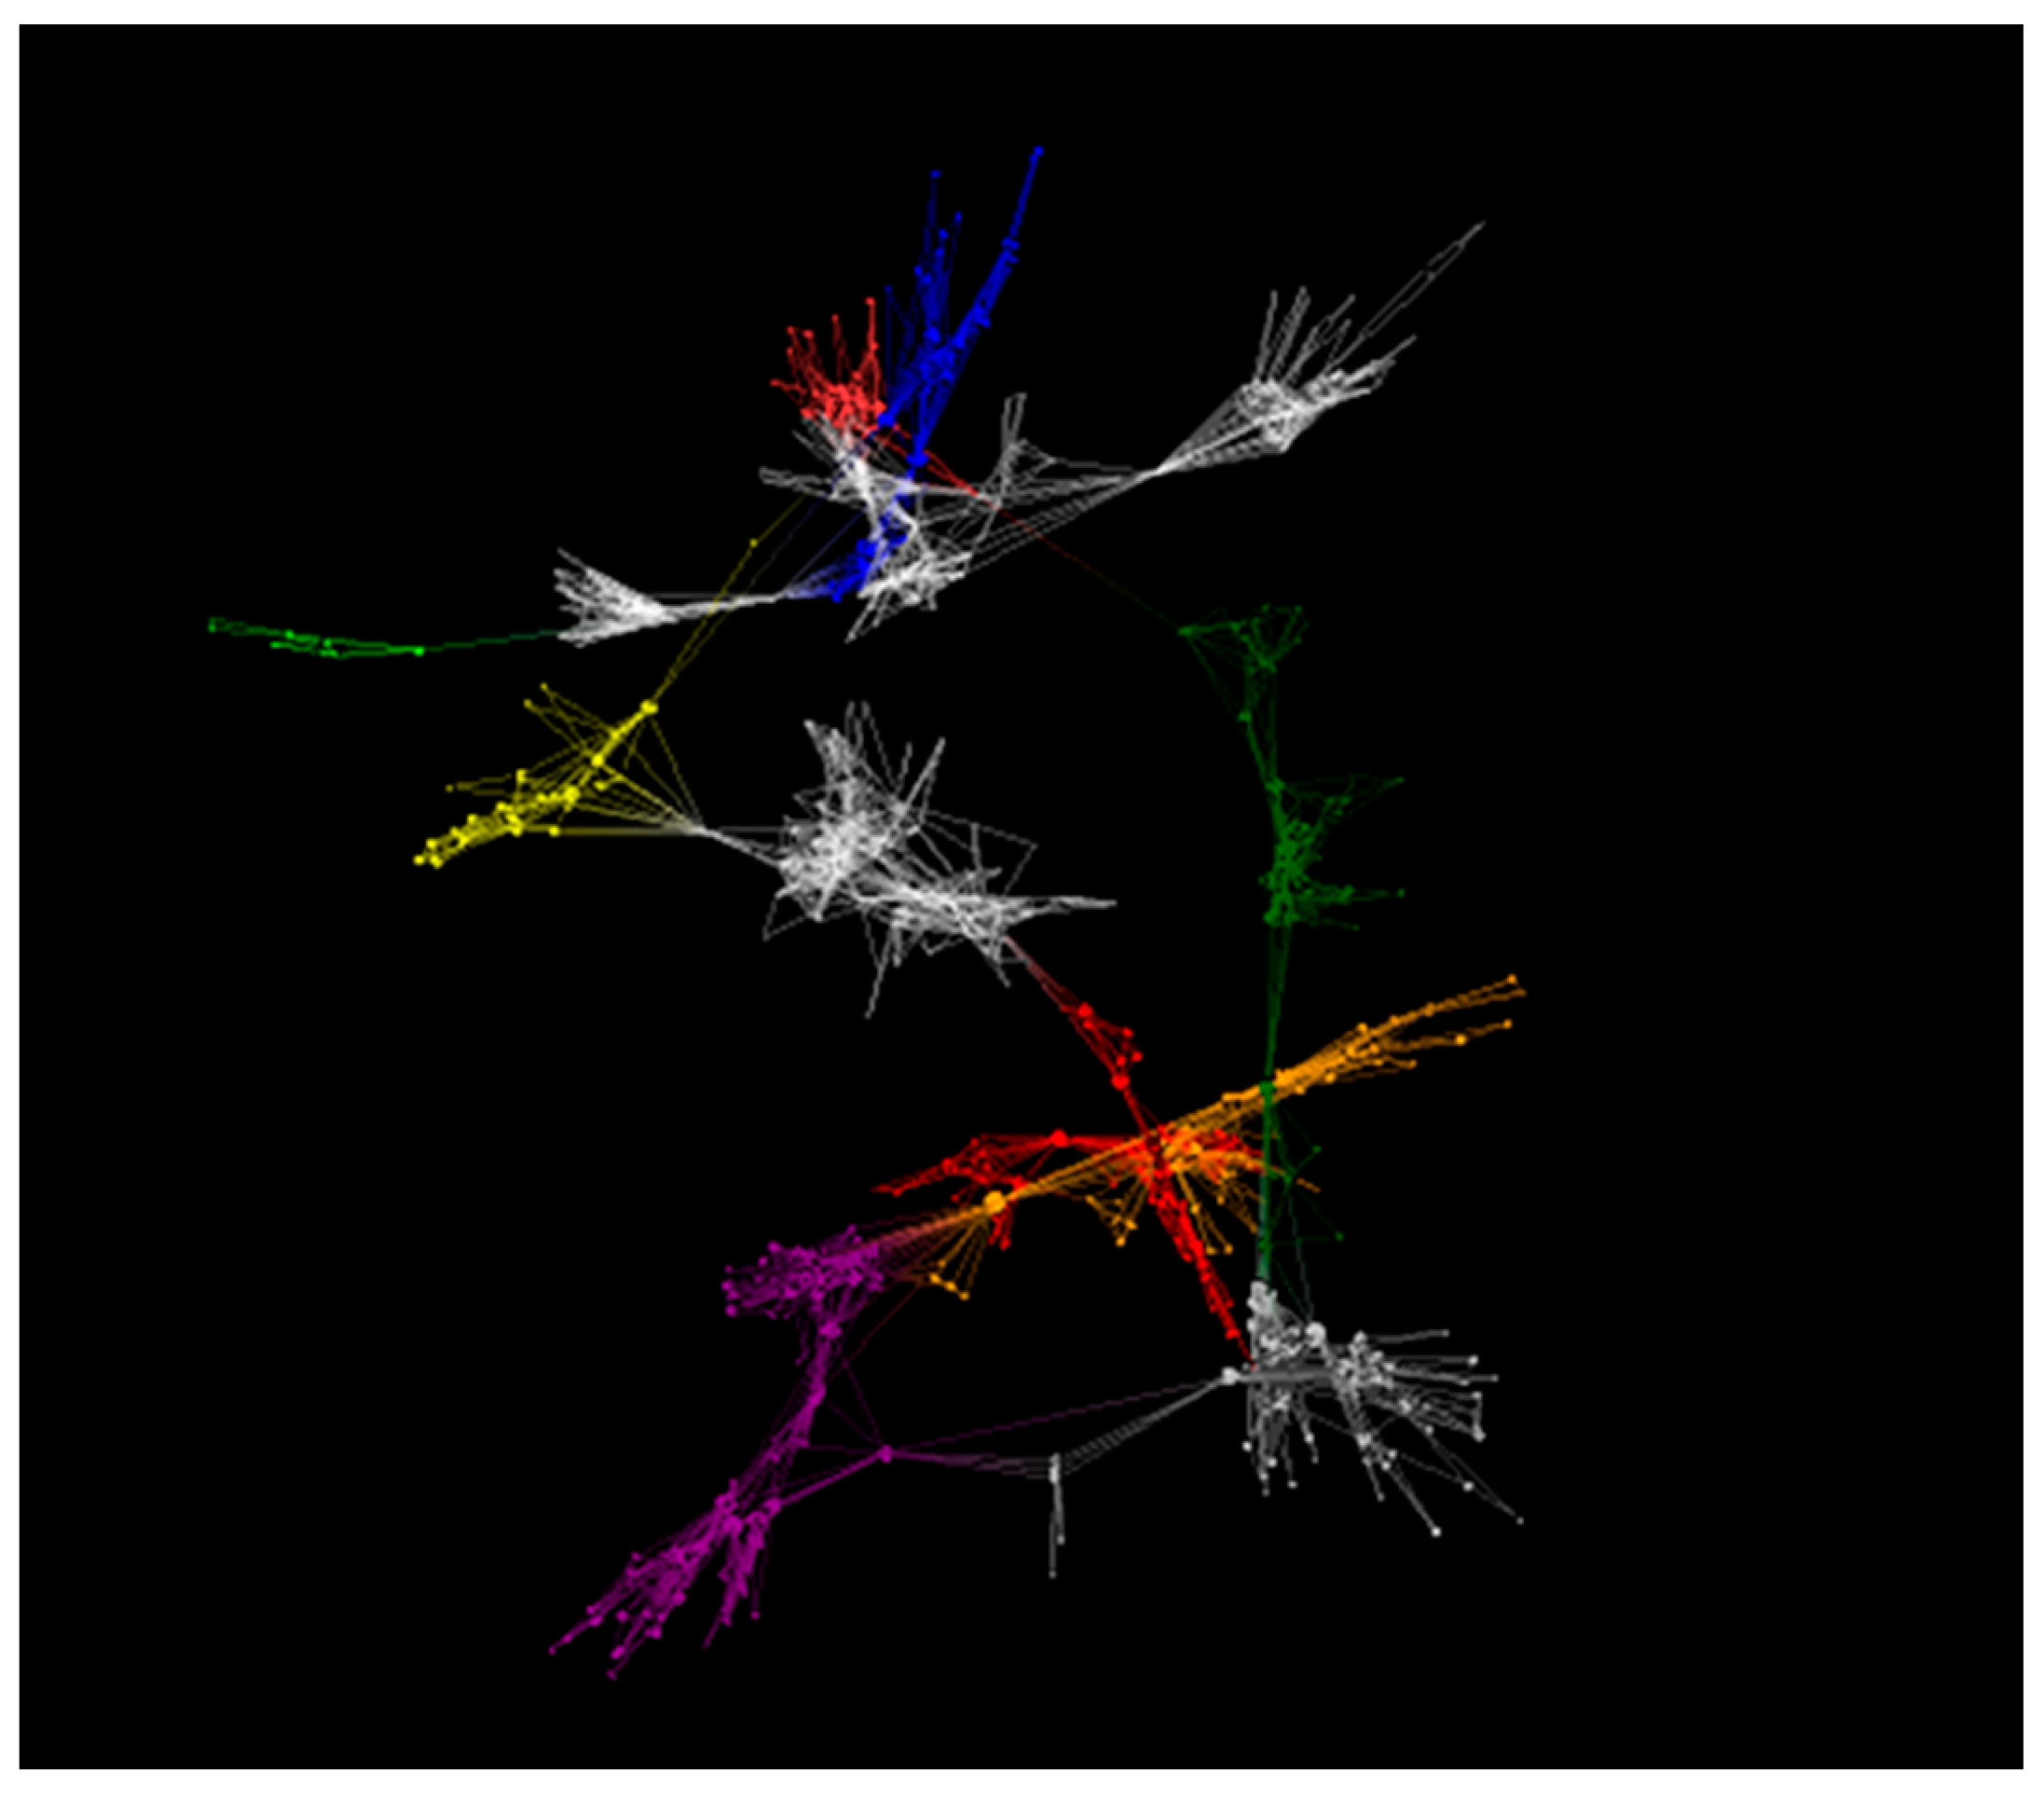
As a graphical illustration of the methodology, three months of data from the Hungarian power exchange are shown as a visibility graph in
Figure 4. In the grid, each period is arranged as a group, reflecting a single market event. The different colors represent identifiable clusters and different periods in the time series.
In order to understand the visibility graphs presented and analyzed later, it is important to introduce two network topology metrics: the degree measure and the degree distribution. In a subsequent study, we will write in detail about the information that network properties provide about the time series and market processes.
One of the key metrics in network analysis is degree distribution. It shows the connectivity of a given vertex in the graph with the other actors in the network. In an undirected network, points A and B are symmetrically connected, while this condition does not necessarily hold in a directed network. In the latter type of network, individual vertices can have both incoming and outgoing edges, so the information does not pass symmetrically between the two points. In our research, we worked with undirected graphs for visibility graphs.
The number of edges (
L) in an undirected graph can be described with the following mathematical formula:
where
ki is the degree of the i-th node.
The multiplication by ½ is necessary because each connection is counted twice in the equation, as the connections are symmetrical. Hence, A is in the same quality relationship with B as B is with A. Based on these, the average degree can also be calculated. In an undirected graph, the average of the vertices’ edges is called the average degree.
The average degree can also be written in the following form:
The multiplication by 2 indicates that an edge is undirected between two vertices, so each edge appears twice in the network, and then we divided this by the number of vertices.
In connection with the previous indicators, we can introduce the degree distribution value
pk, which shows the probability of the degree of a randomly selected point in the network being exactly
k [
31,
32].
2.3. Data Height as an Influencing Factor
It is worth examining how the data height of a time series affects the degree of development in the graph-transformed dataset. To conduct this, we need to define
as the conditional probability that a given vertex has a degree of
k, while its height is
x. Based on this:
From the equation, it can be seen that
for any value of
x. Then, we can determine the average degree of a vertex associated with a data point, which corresponds to a vertex with a height of
x:
Since
and ln (
x) increases monotonically,
K(
x) will also increase monotonically [
33]. However, we consider it important to note that, in the case of the electricity exchange time series, the price spikes cannot necessarily be considered outlier data, as a detailed examination of the time-series distribution clearly shows that these seemingly abnormally high values stem from the fat-tail of the distribution function but are still part of the time series. It is unnecessary to exclude them from the analysis, unlike in correlation analysis, where ensuring a normal distribution may not necessarily be true.
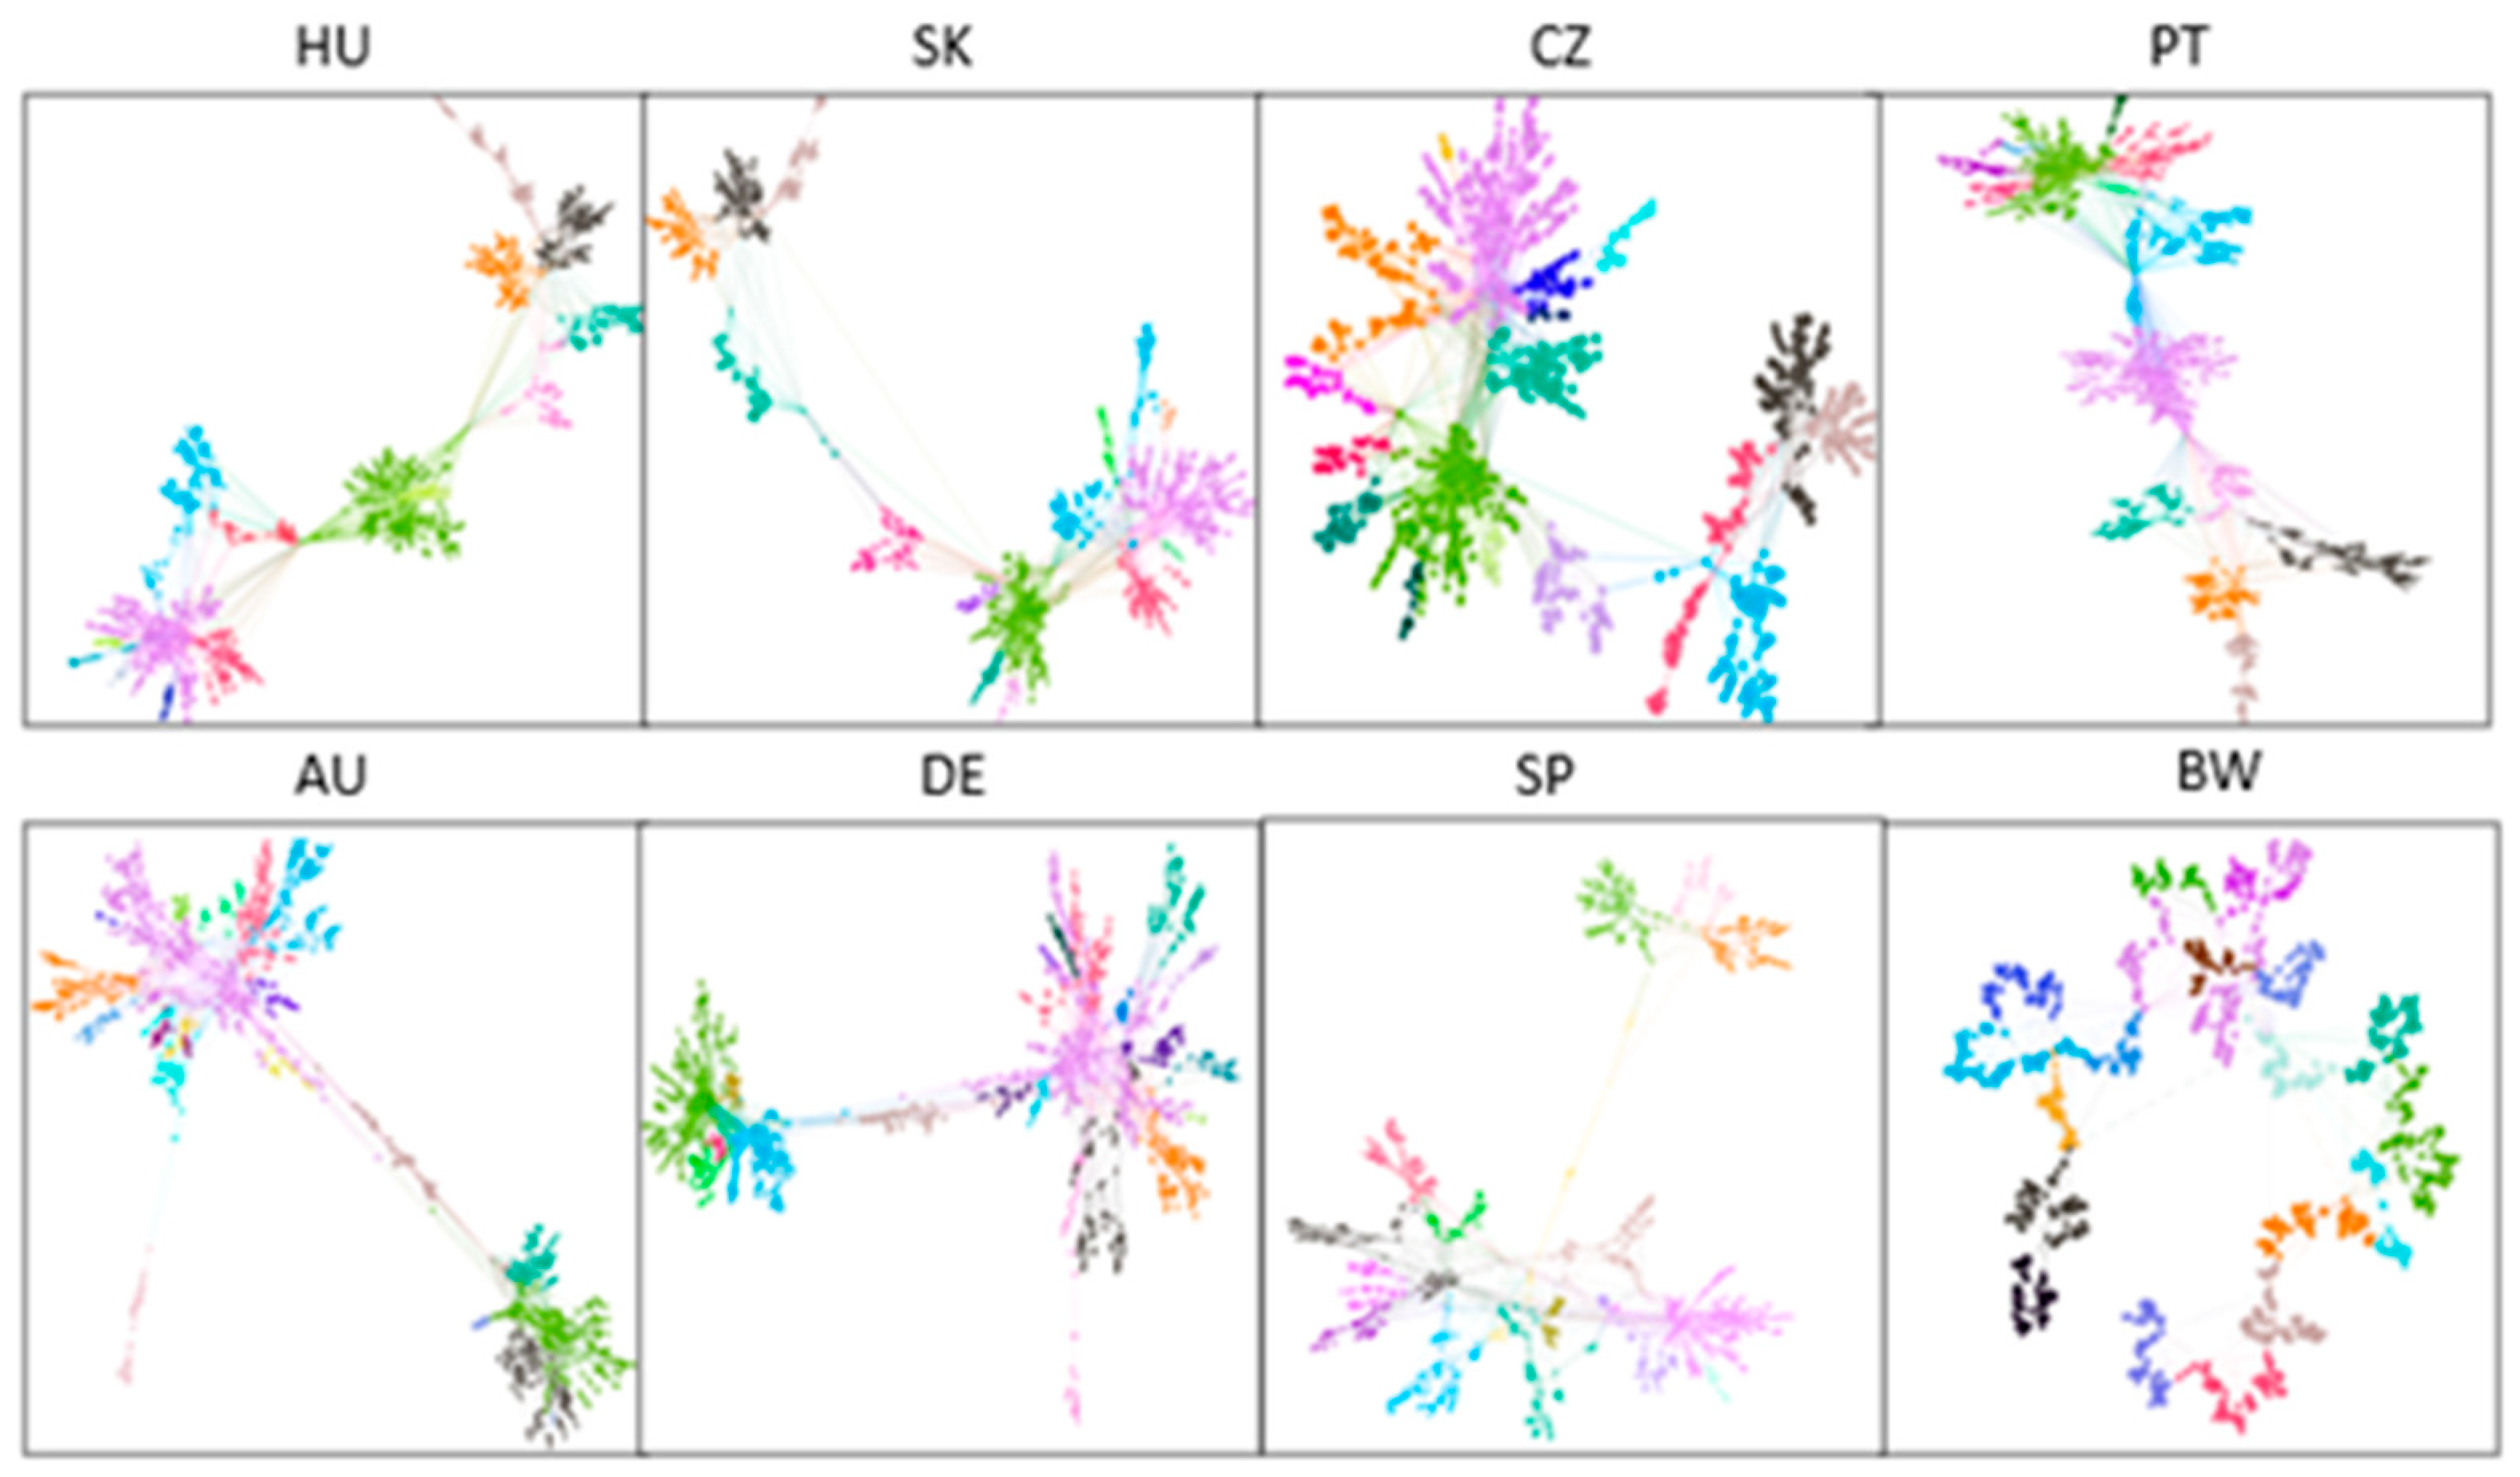
Except for a few exceptions (Spain and Portugal), the observed markets are similar in terms of network structure, so the visibility graphs share some common features in terms of topological properties. Based on the number of edges and the average degree, it is evident that the electricity market in Spain is less volatile in terms of market activity compared to other areas, which is also reflected in the prices, such as in the standard deviation. If the dispersion of the time series increases, the average path length decreases, while the number of edges and edge density increase. The expansion also results in a decrease in the average path length within the network. The low volatility may also be due to the rarity of price spikes and extreme movements during trading. The distribution of the Spanish market is flatter than the normal curve. The data dispersion is similar to that of other countries, even slightly lower. The share of renewable energy sources is the highest in Spain’s energy mix, which indicates a high exposure to natural processes, and this affects energy prices. These processes can also be observed in the Portuguese market, as there is a strong correlation since Portugal is exclusively connected to the Spanish market. These movements are somewhat slower processes, thus exhibiting a trending pattern, which is why price spikes (a short-lived, significant increase in electricity prices) are not observed. The high number of peaks also indicates the extent of the decline, price spikes, or trending processes in the observed values.
Figure 5 illustrates the visibility graphs of some countries and random walks. The different colors represent identifiable clusters and different periods in the time series.
In countries where the share of nuclear energy (France, Slovakia, and Slovenia) or renewable energy is higher, the average degree and the number of edges only slightly increase above the average. Values lower than the average could only be observed in random processes, indicating that the degree metrics effectively characterize the market regarding the presence or absence of extreme movements or price spikes. Markets with significantly higher degree and average degree values mostly derive their energy from fossil fuels, which, in turn, cause extreme fluctuations in prices. More frequent oscillations in the observations of time series result in a higher edge density and shorter average path length in the visibility graphs.
Consequently, markets with a lower volatility (Spain, Portugal, or the generated random walks) exhibit a higher average path length, indicating a lower number of “hubs”, which is closely related to the degree distribution and clustering. As for clustering, the clustering coefficients only differ minimally from each other. The clustering coefficient shows a moderately strong correlation with the average measured in time series; however, the nature of this relationship is not apparent in the examined markets. Further research is necessary to investigate this correlation.
The function describing the behaviour of coefficients follows a hierarchical structure observed in the networks. The visibility graph is also suitable for identifying periods observed in time series. Since the main focus of this study is to present the overlapped coefficient, we only briefly introduce this topic. A more comprehensive discussion and detailed presentation will be published in a future article.
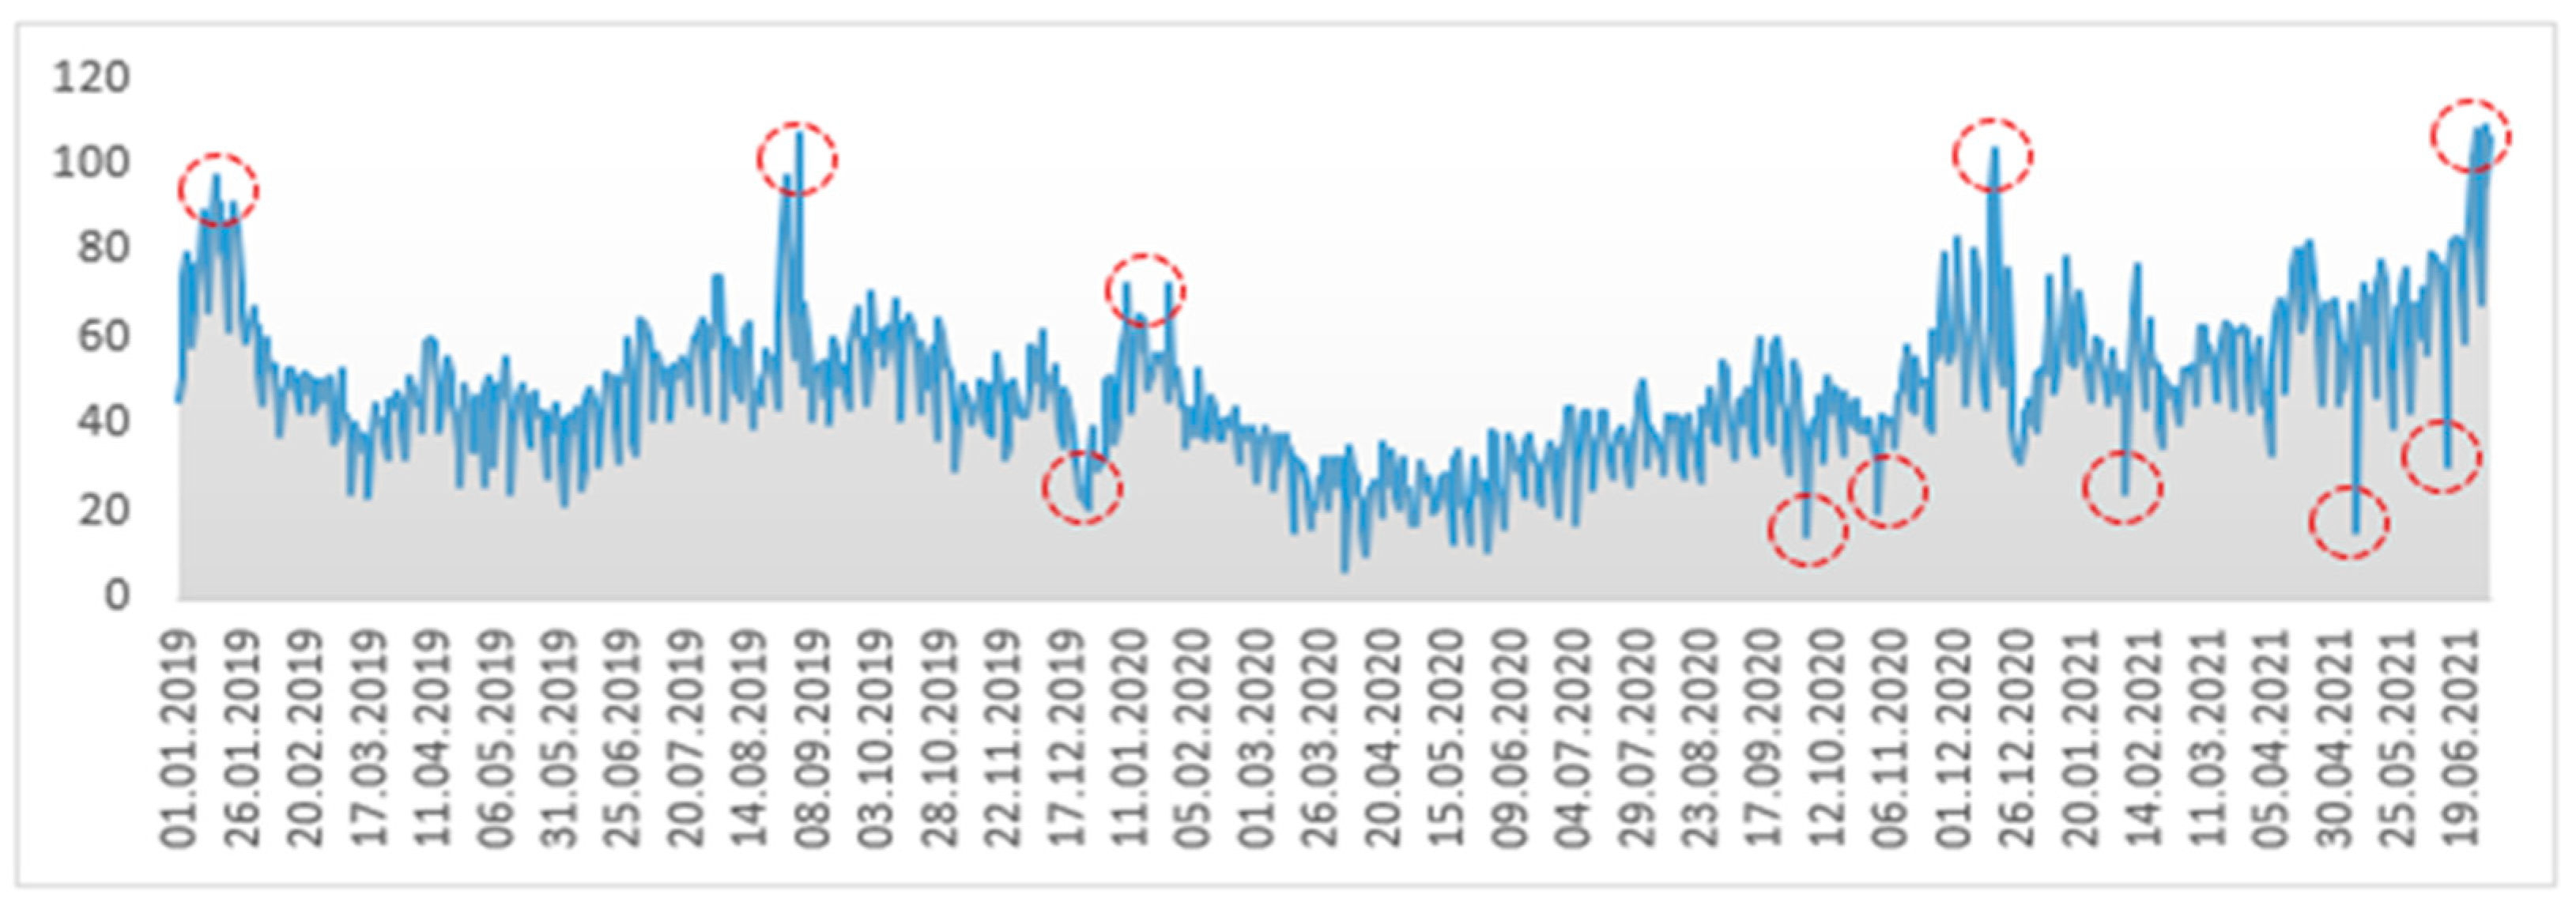
Figure 6 illustrates one of the major advantages of converting to a visibility graph: local maxima, minima, and other significant time points or periods can be identified and delineated much more easily when represented as a graph compared to traditional two-dimensional coordinate systems, as the days are aggregated. In such representation, only a few highlighted periods, framed in red, can be visually observed.
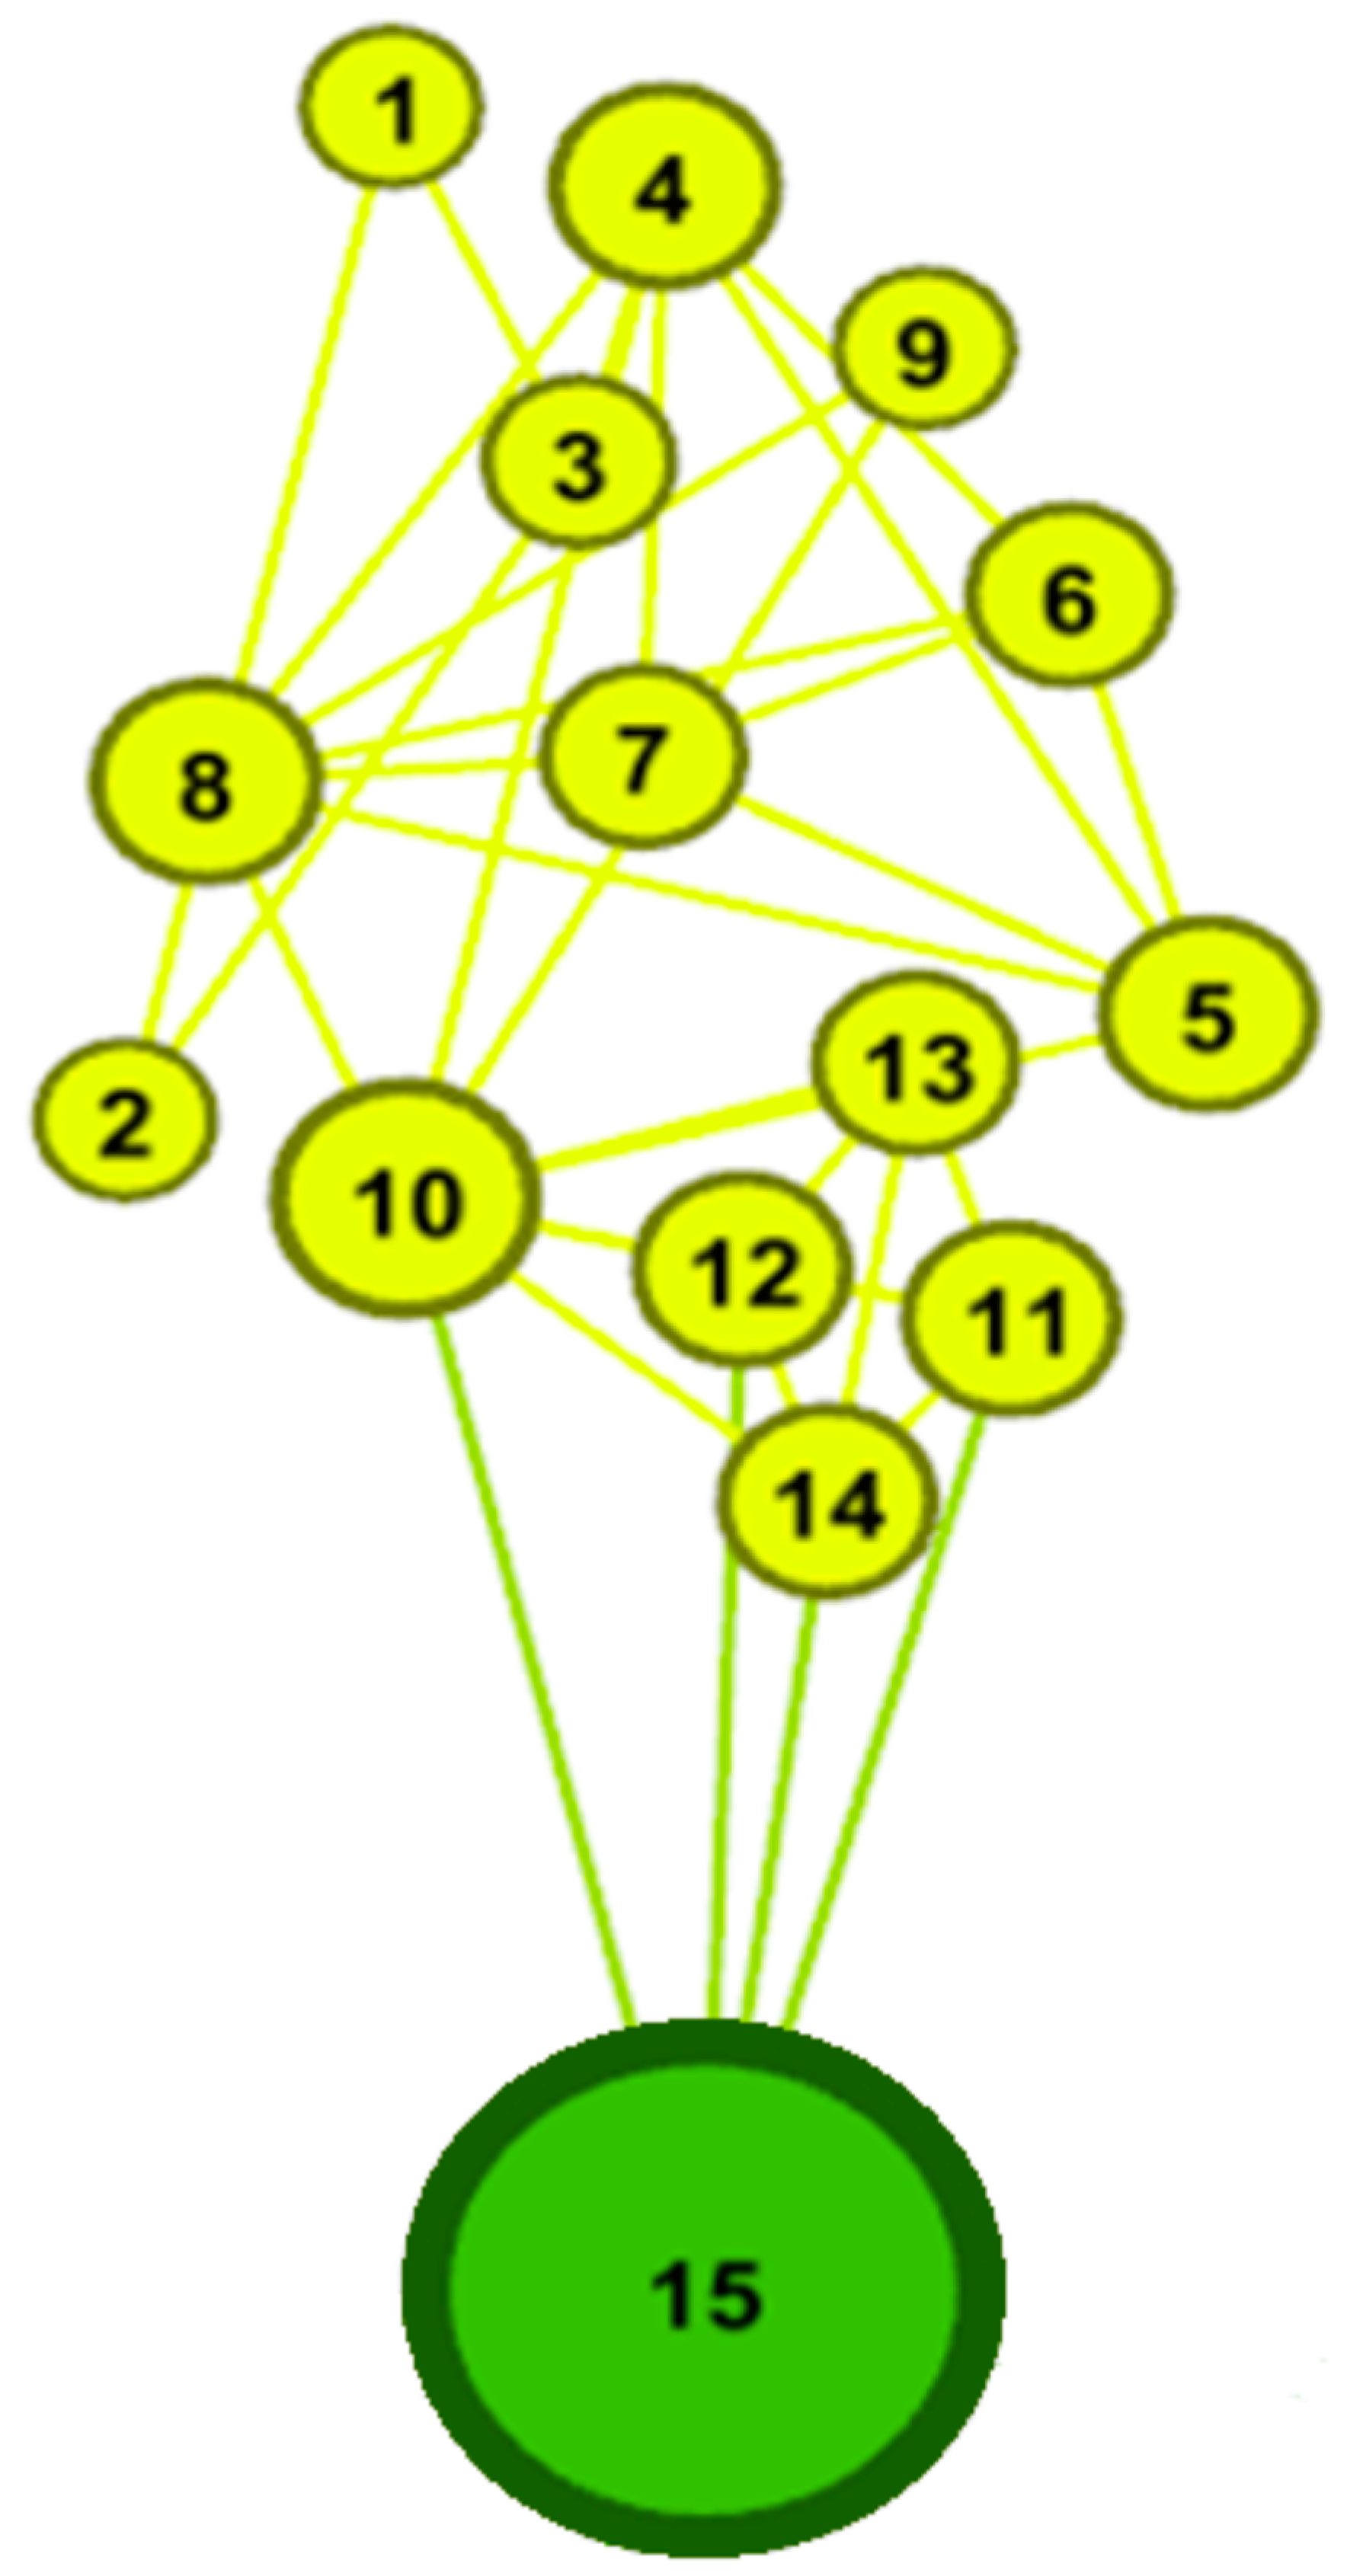
After representing them as graphs (
Figure 7), clusters (specific periods) and hubs (prominent time points) can be detected more easily, both on a global and local level.
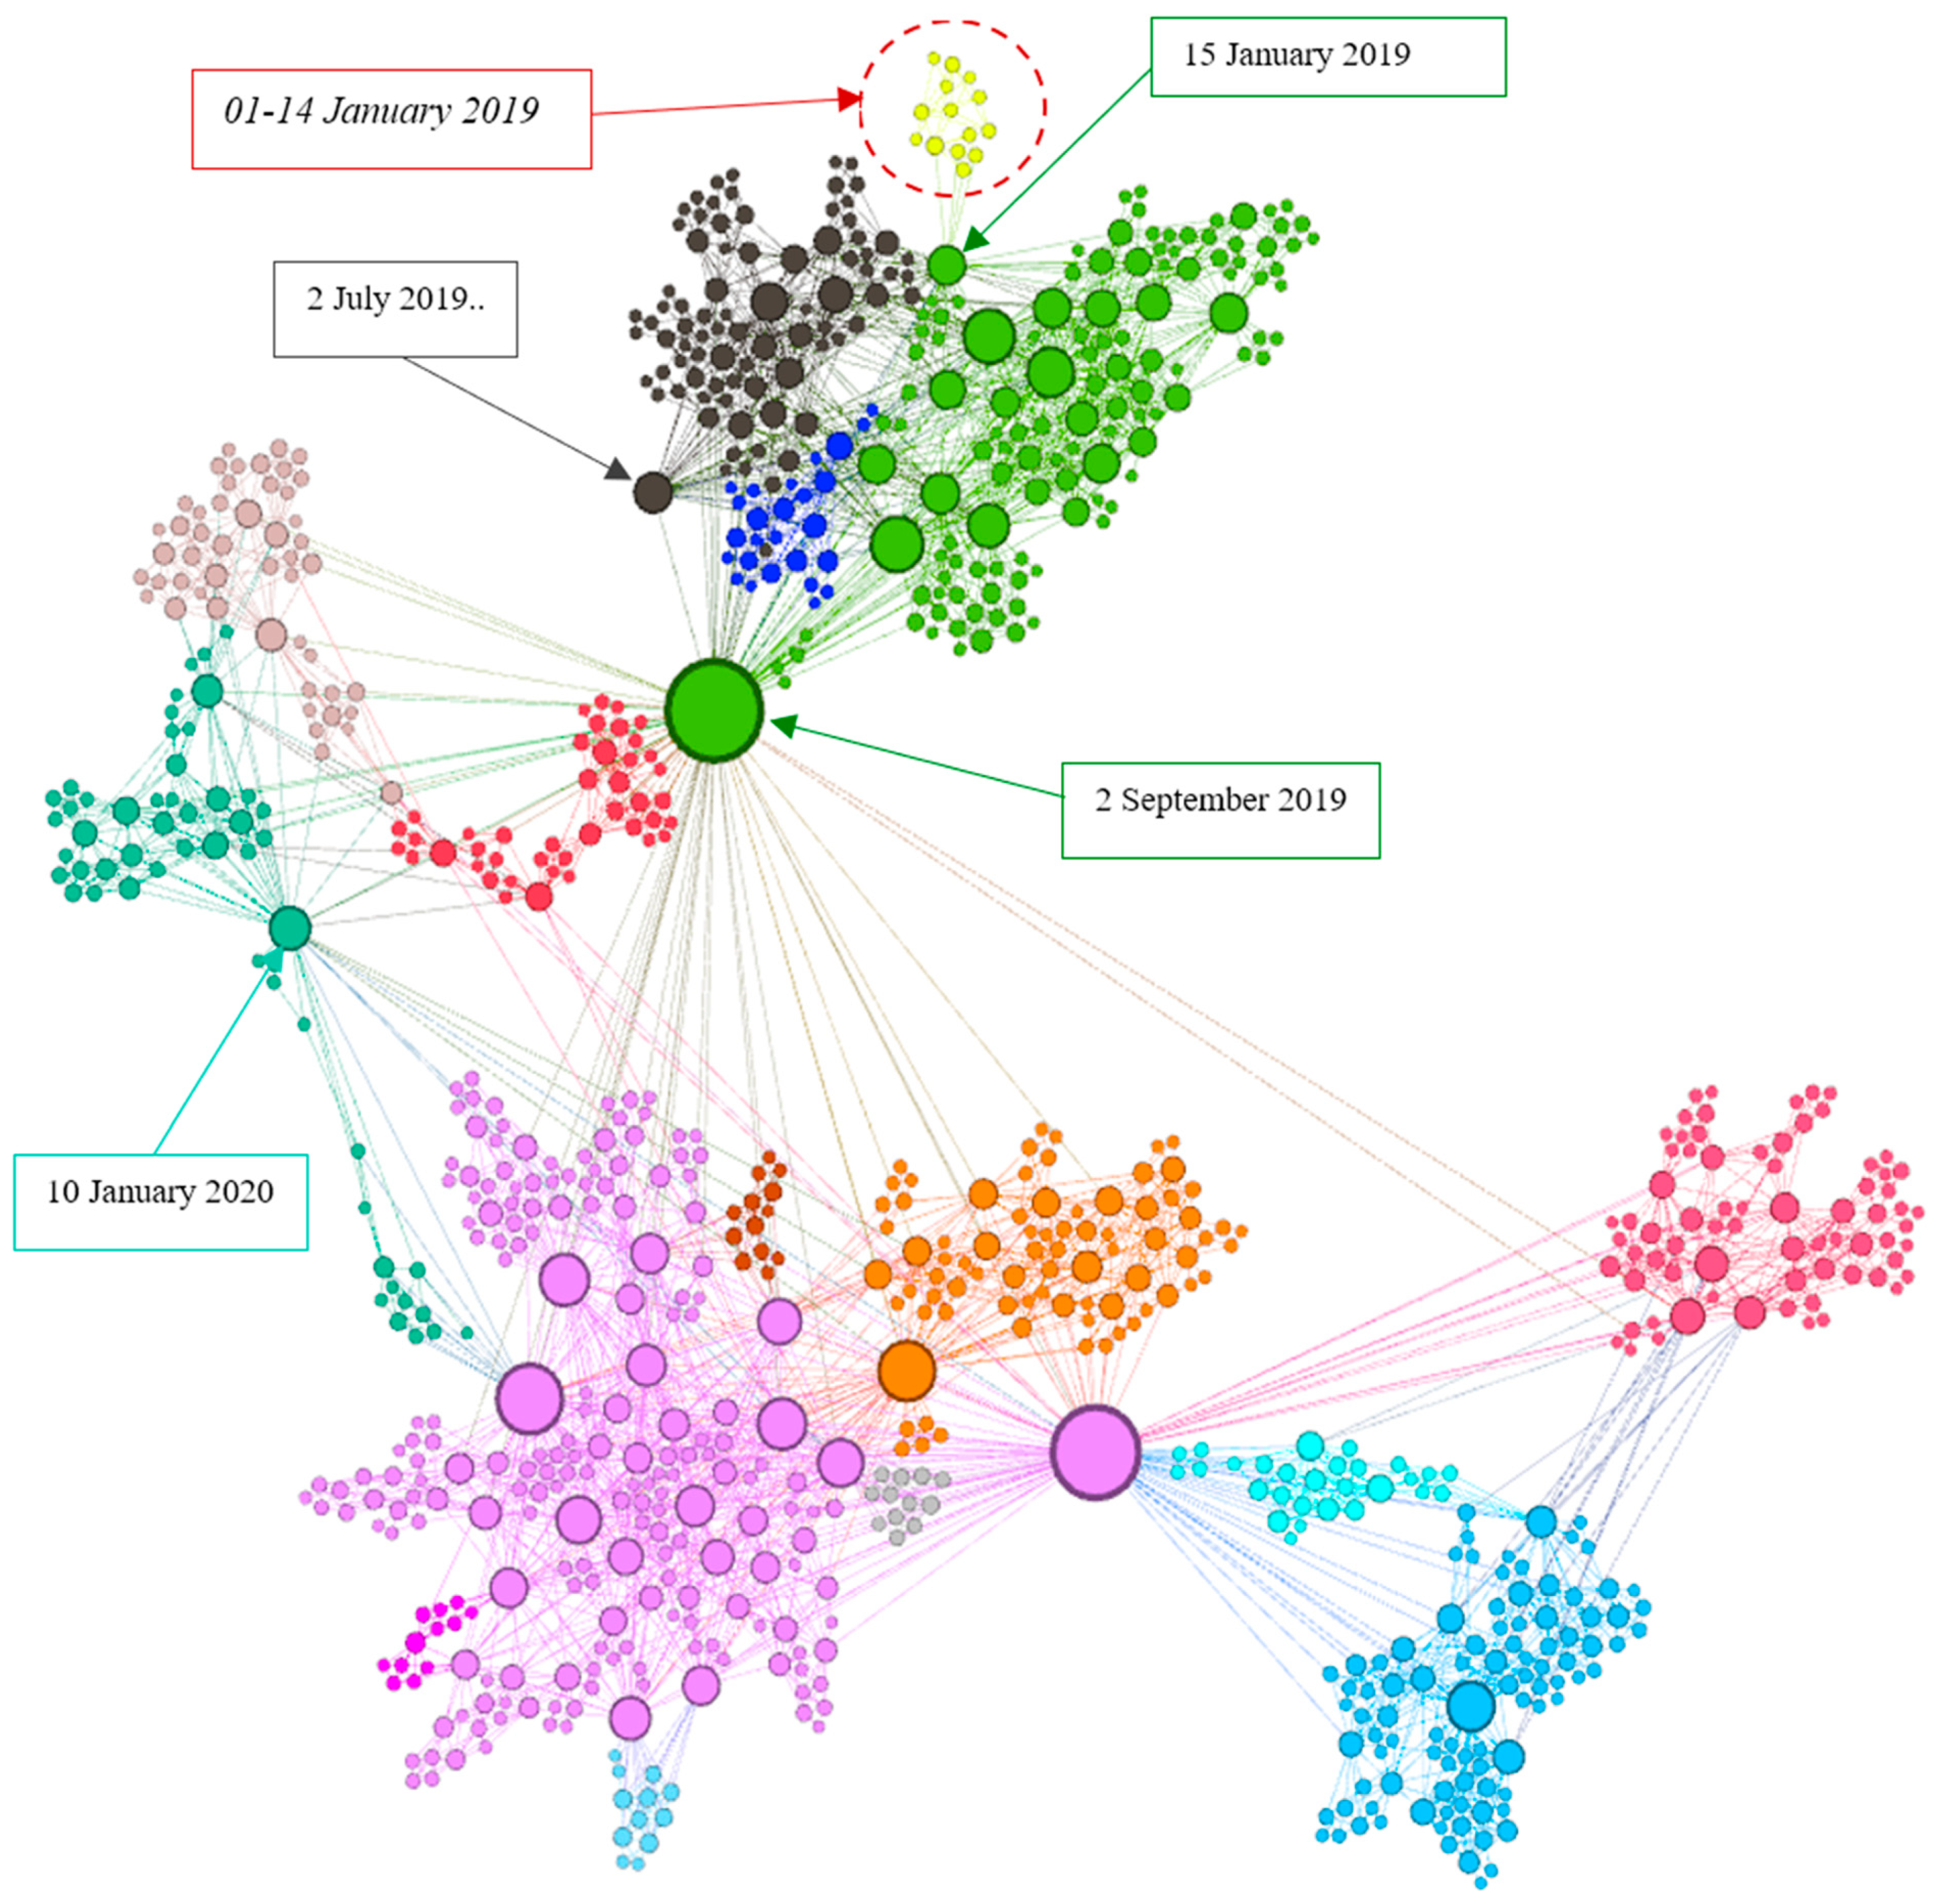
In the period of early January 2019,
Figure 6 shows a rapidly increasing segment followed by a decline in the first two weeks. This period is depicted in
Figure 8.
The numbers depicted in
Figure 8 represent the days of the given period instead of actual dates. The number of days should be interpreted as the days within the interval of the examined period, not as the days of the year. Therefore, 1 January 2020 is the 366th day of the period. The graph represents the first 15 days of the year 2019. Each point is connected to the corresponding “visible” days for that point. The yellow-coloured cluster corresponds to exactly the first two weeks of the year (days 1–14), which then connects to a larger cluster on the 15th day of the year. Based on this, the first 14 days form a separate period, which is interrupted by the highest stock exchange price until that point on the 15th day. Therefore, we would like to reiterate the limitations of traditional time-series representation since this segment, for example, could not be easily detected by visual inspection in
Figure 6 considering a dataset covering a larger time interval.
2.4. Overlap Coefficient
In most scientific works comparing graph similarity, especially in studies published in recent years, the Jaccard similarity measure was used [
34,
35,
36,
37,
38,
39]. Similarity is essential in scientific research, including machine learning and pattern recognition [
40,
41,
42,
43].
The Jaccard index can be approached most simply from the degree distributions of the networks. The index value shows the similarity between the degree distribution curves of the two networks, that is, how similar the two networks are in terms of the number of connections between nodes: the size of the intersection of sets A and B (i.e., the number of common elements) over the size of the union of sets A and B (i.e., the number of unique elements).
The index value can range between 0 and 1, where 0 means that the connection structure of the two networks is completely different, while 1 means that the two networks are completely identical.
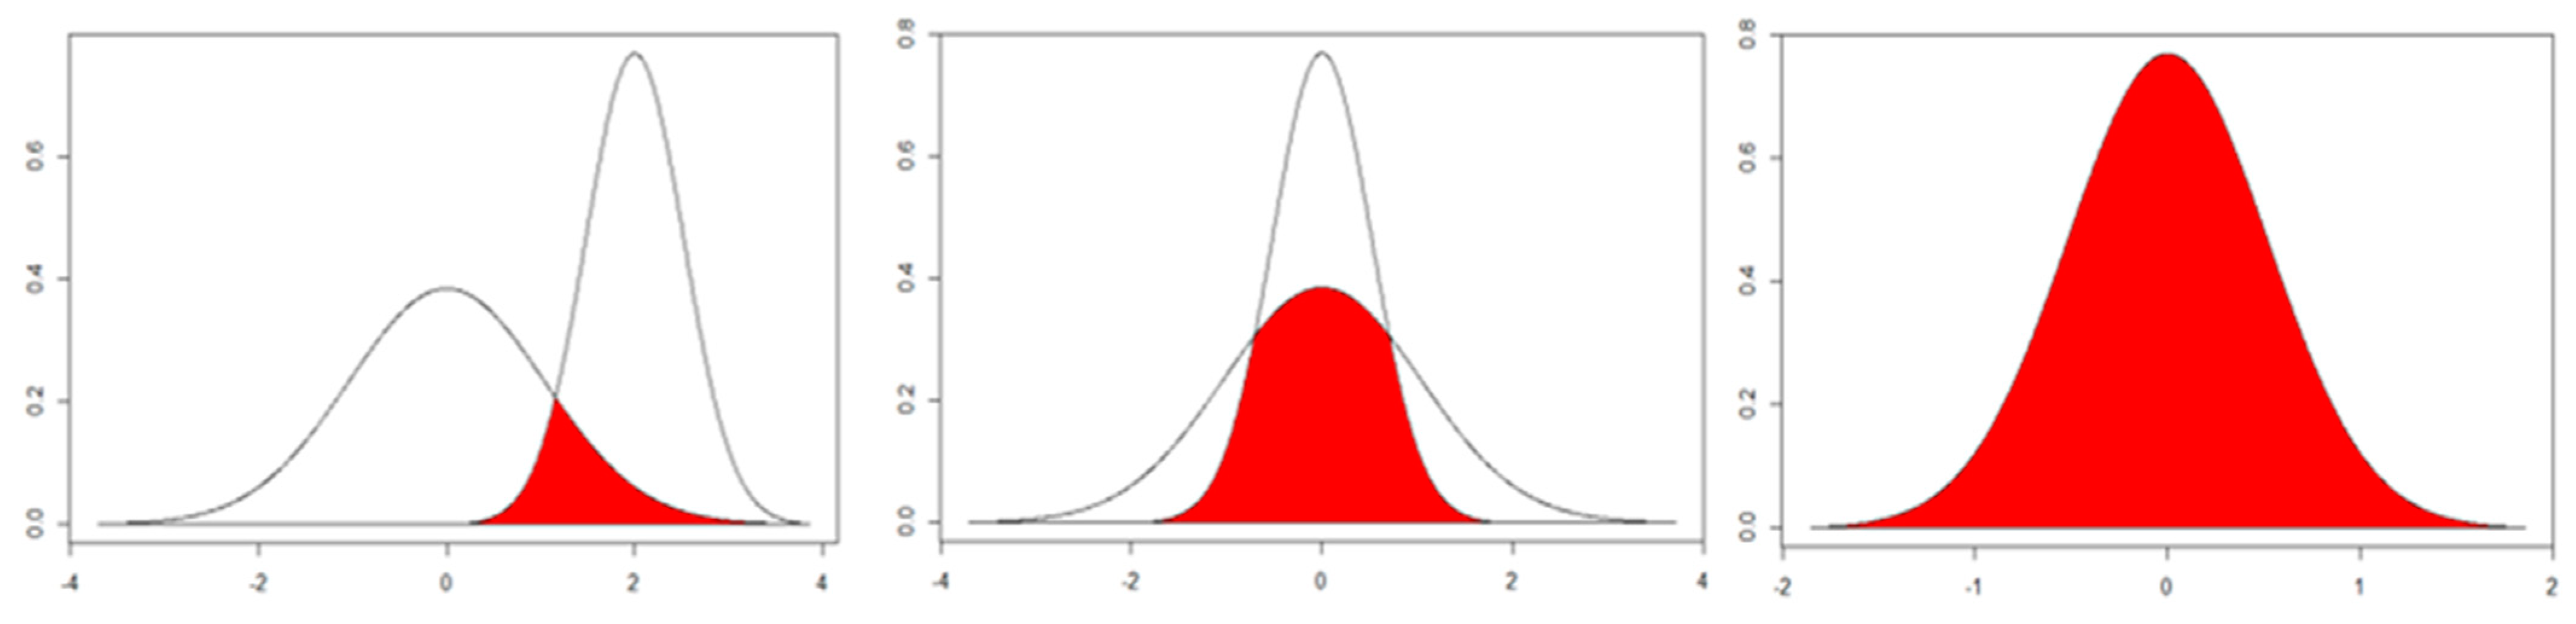
However, it is important to mention the methodological shortcoming of the Jaccard measure, which needs to be addressed. We may obtain false index values due to overlap when comparing the degree distribution curves of two networks whose distribution functions have almost identical mean, standard deviation, and median values and differ only in their kurtosis (
Figure 9). In other words, if
, the Jaccard coefficient does not reveal this and can be misleading, especially if
. In the similarity analysis of networks created from electricity exchange data, we based our conclusions on the overlaps of degree distributions; this inaccuracy may be significant regarding the results.
To overcome the aforementioned error, we suggest the following modification. The correction of the equation above is necessary in the sense that the basis for comparison should always be the smaller set (in our case, the area of the distribution); therefore:
Since, from a research perspective, the overlapping and distinct nodes are not significant on a per-unit basis, the further refinement of the equation is not warranted, so the equation essentially modifies to the Szymkiewicz–Simpson coefficient [
44].
3. Results
As already mentioned, the main purpose of our study is to conduct a comprehensive novel analysis of power exchange data between 2019 and 2022. During our analysis, we examined the data from 15 countries. Regarding the results,
Table 1 summarises the pairwise similarity matrix of the examined electricity exchanges, initially for the entire 2019–2022 period.
The analysis of coefficients presented in
Table 1 reveals strong similarities among most markets concerning their internal processes and structures. However, when comparing the Spanish and Portuguese electricity exchanges to the broader European market, they exhibit the weakest similarity. These markets follow a flatter distribution than the normal, leading to a lower overlap coefficient. One plausible explanation for this disparity is that Spain has the highest proportion of energy produced from renewable sources among the examined exchanges. This higher exposure to natural factors results in a distinct price distribution and volatility, which is prominently reflected in the similarity index. Additionally, Portugal’s examination as a country bordering only two other nations imposes severe limitations on its transmission capacity and interconnection with other electricity markets, further contributing to its dissimilarity with the European market. As such, the influence of territorial similarities and differences emerges as a significant factor in shaping the internal European system’s interconnection and exchange capacity between countries. The exchange capacity plays a vital role in ensuring the stability and efficient functioning of interconnected power systems. It represents the maximum instantaneous electrical energy that can be imported or exported between two systems while adhering to security criteria. The calculation of the exchange capacity involves a collaborative effort among operators from different systems, engaging in coordinated studies that consider various factors, such as production and demand forecasts, facility maintenance schedules, and simulations of network element malfunctions. These studies span different time horizons, from annual to daily forecasts, to facilitate large-scale commercial exchanges while upholding security standards. Maintaining a high level of exchange capacity becomes crucial as it enables every country to benefit from the stability advantages that result from market integration. In alignment with this objective, the European Union has proposed that the minimum cross-border interconnection capacity should account for at least 10% of each country’s installed production capacity [
45]. The efforts to enhance these capacities are illustrated in
Figure 10, which depicts the development of transmission capacities within the interconnected European electricity markets.
As previously mentioned, power exchanges play an extremely important role in the electricity markets as they facilitate the large volume and fast trading of electricity. Power exchanges enable transactions between energy sources (e.g., wind farms and nuclear power plants) and consumers. The exchange capacity, that is, the maximum instantaneous electrical energy that can be imported or exported between two power systems, is crucial to the operation of a power exchange. Energy systems need to constantly balance supply and demand, and these exchanges enable this balance. If a country produces more energy than it needs, it can sell the surplus on the exchange, and conversely, if a country needs more energy than it produces, it can buy it on the power exchange. Therefore, in the course of investigations (
Figure 10), the measurement and analysis of the exchange capacity play an important role in understanding how the power exchange operates, what factors influence trade, and how these factors impact prices, supply, and demand. In addition, it can help to identify potential problems and risks that may affect the energy supply and market stability.
In summary, the Jaccard index and the overlap coefficient address the extent to which individual markets are heterogeneous or homogeneous. The integration of electricity exchanges and their gradual integration within the European Union results in increasing homogeneity. The market mechanisms are similar, and the results are consistent with the territorial differences arising from transmission constraints, as shown in
Figure 10. These differences are reflected in energy trading prices, as energy import and export opportunities limit the ability to balance domestic demand and supply and the potential to mitigate price fluctuations due to excess demand and/or supply. At present, the Spanish electricity system does not reach this recommended minimum level in Europe, as their commercial exchange capacity with the European system accounts for only 3% of Spain’s installed production capacity. Therefore, strengthening connections with neighbouring systems is the most critical investment Spain needs to implement in the next few years. Furthermore, due to Spain’s geographical location, its interconnection possibilities with the rest of Europe are very limited. The fact that only the connection with France enables energy exchange with the rest of the European Union makes it an electrical island. Spain and France are currently connected by four high-voltage lines. Despite the increased electricity demand in both countries [
46], no new interconnecting lines have been built since 1982 [
37].
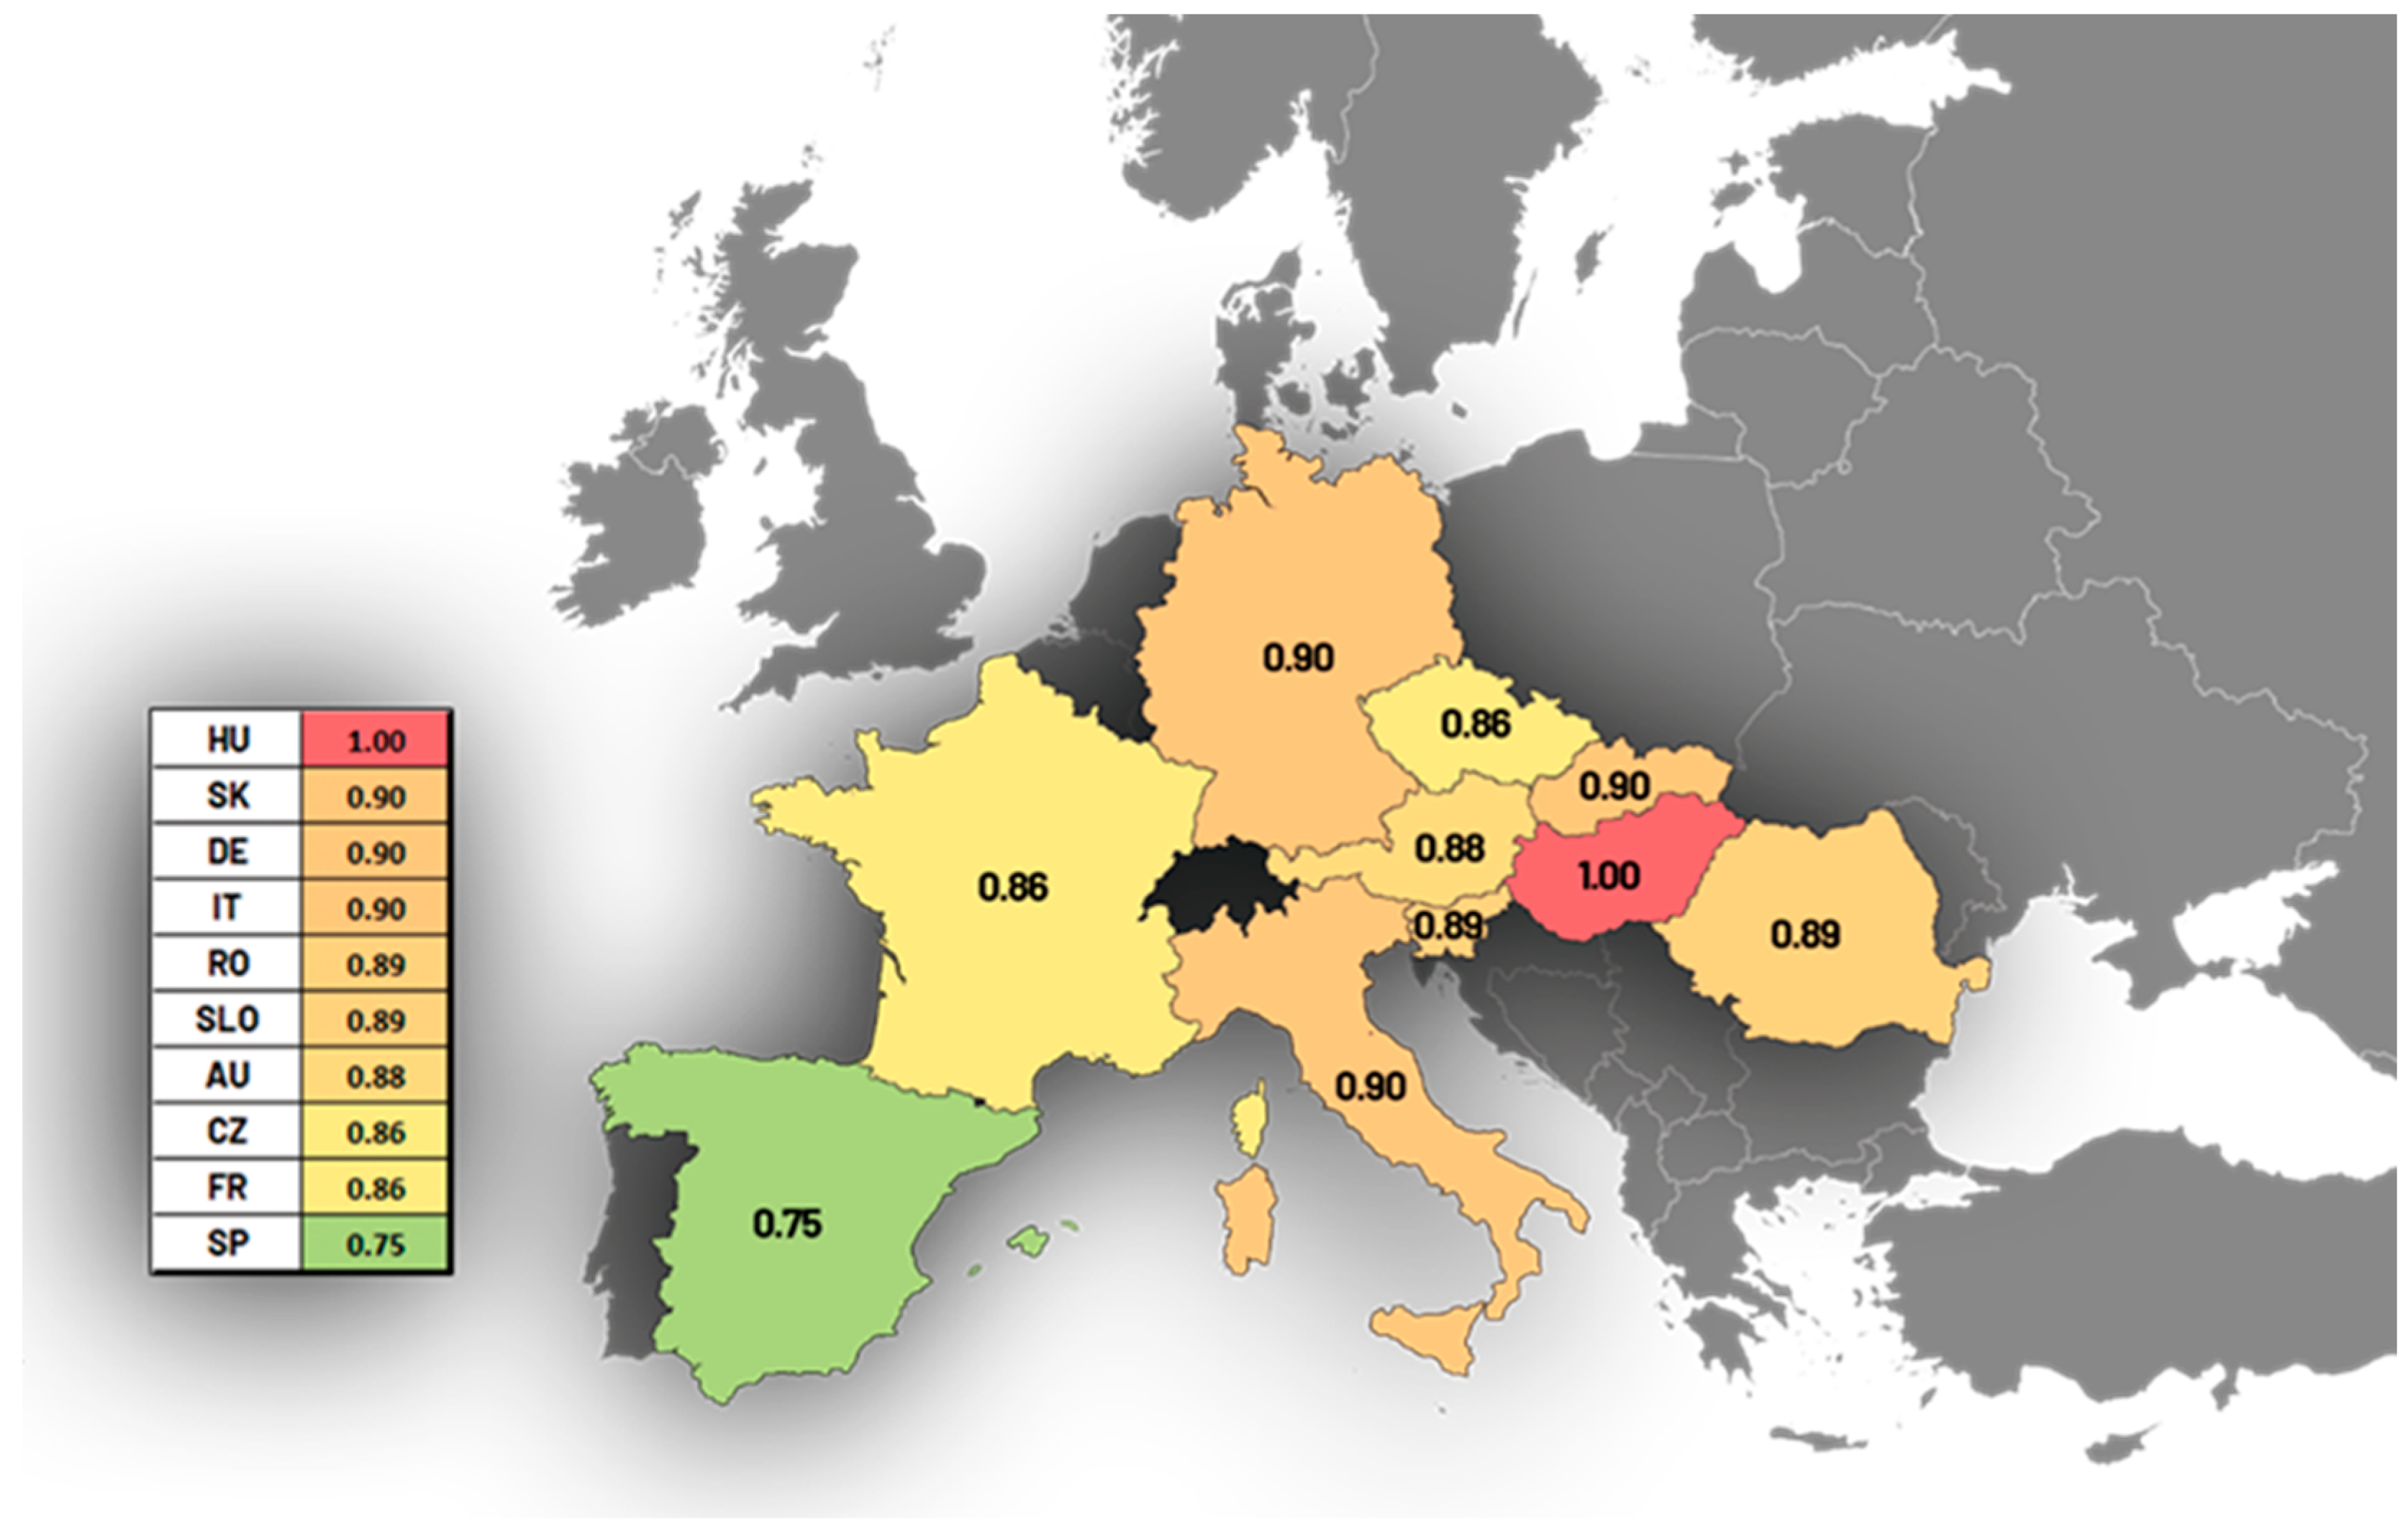
Although only indirectly interconnected, the Hungarian and German markets mutually affect each other. The Hungarian Power Exchange (HUPX) market provides a regional reference price for the exchanges of neighbouring countries, while the German market’s price impact is decreasing but still felt in the market. This increasing integration in the EU territory may further mitigate the length and magnitude of the price spikes that occur during extreme periods in the future. The effect is not expected to diminish indefinitely, as even though an integrated market is being formed, we still consider distinct market structures, so these effects can only be mitigated as long as cross-border trading performance allows. Demand–supply anomalies mainly occur locally, so they are not fully capable of affecting each other. The formation of a European regional electricity market is currently underway, within which the following strong territorial exchange cohesions are taking place (
Figure 11).
In the Central and Western European region (France, Germany, the Netherlands, Belgium, and Luxembourg), there are three operators (EPEXSPOT, APX-ENDEX, and BELPEX) in operation, as well as an additional three operators managing market processes in the case of market coupling between Italy and Slovenia, and the Czech Republic, Slovakia, and Hungary. This could also explain the territorial differences detected by the modified Jaccard index. However, in the case of electricity exchanges, the impact of individual interests is still strongly present, making it difficult to capture market processes solely with macro-characteristics.
To ensure the proper interconnection of the various European regional markets, the increased coordination of the compatibility of hours and products, as well as the operational rules of the markets and the security criteria of the various systems involved, are needed to prevent incidents in a given country from spreading to the rest of the European system. The differences between coastal countries and inland regions are further reinforced by Europe’s support for developing renewable energy sources in recent years so that they can constitute a larger share of each country’s energy mix. Managing renewable energy sources, particularly wind and solar energy, is a complex task, as the production of these technologies does not necessarily occur when the system requires it, unlike fossil fuel producers. As interconnection capacity increases, the total amount of wind energy production that can be safely integrated into the system also increases. The energy obtained from this source, which sometimes lacks sufficient capacity in the system, could be transmitted directly to neighbouring systems via networks. For similar reasons, the feed-in capacity of Hungarian solar power plants has also been limited recently, although its regulation and actual network limitations still need to be made clear.
3.1. The Impact of the COVID-19 Pandemic
The demand for electricity worldwide rapidly decreased due to restrictive measures. A continuous recovery can be observed as the measures gradually ease. In the Indian electricity system, electricity demand fell back to low seasonal/weekend levels due to the restrictions. The decline caused by the falling commercial and industrial activities was only partially offset by the increased residential demand [
47]. Internationally, it can also be observed that, as the lockdown measures eased, the electricity demand showed signs of recovery. Following the announcement of the restrictions, commercial and industrial demand plummeted drastically. This led to high-frequency states in the network. Therefore, system operators had to significantly curtail the amount of electricity fed into the grid in March 2020.
Table 2 shows the overlap coefficients created exclusively from data for March 2020. It is clearly illustrated that, during this period, the prices in the markets of countries with close market interconnections primarily moved together. This joint movement also stems from the fact that these countries introduced strict restrictions due to the pandemic at nearly the same time. During the lockdowns, the exercise of market power was also mitigated in the European market [
16]. This is reflected in the differences in the values of the overlap coefficients when considering the entire 2020–2021 period for calculating the index (
Table 3).
Table 3 clearly shows that, while Spain and Portugal’s market isolation remained, the German market somewhat adapted to the European market conditions. The same is visible in the case of Poland. This reduction in market power is mainly due to the fact that market demand fluctuations—over-supply—caused by the lockdowns had to be sold on the international market, thus aligning prices somewhat.
3.2. Market Changes Caused by the Russian–Ukrainian Conflict
The reduction in energy imports from Russia directly affects the production capacity of every Western economy dependent on Russian energy, particularly the European Union countries, which sourced the majority of their natural gas and oil imports from Russia. The most affected Central–Eastern European countries include Bulgaria, the Czech Republic, Estonia, Hungary, Latvia, Poland, Slovakia, and Slovenia, as well as the North-Eastern European countries, including Austria, Denmark, Finland, and Germany. In the event of a decrease in energy imports, an imbalance in demand and supply occurs, which may result in rising energy carrier prices. Additionally, the sudden decrease in supply led to a stronger joint movement of closely interconnected energy exchanges, which resulted in stronger connections in the global energy market and increased prices. The values of the overlap coefficients support this process, as the similarity matrix became more balanced, with only the previously strongly separated Spanish and Portuguese markets showing strong deviations.
Table 4 shows that the previously separate German electricity exchange shows, at present, a higher correlation with other regional exchanges, further increasing financial risks and price fluctuations. Due to its high raw material stocks, Poland can maintain some independence or at least temporary self-sufficiency. In addition, energy-dependent countries strive to diversify their energy sources, for example, by developing renewable energy sources and sourcing imported energy sources from different countries.
The results shown in
Figure 12, based on the overlap coefficient, provide an answer for the extent to which individual markets are heterogeneous or homogeneous. The gradual integration of power exchanges within the European Union results in increasing homogeneity, indicating that the market mechanisms are very similar, and the results are in line with the territorial differences resulting from the transmission constraints seen in
Figure 11. These differences are also reflected in the prices of energy trading on the exchange, as the possibilities for energy import and export restrict the opportunity to balance domestic demand and supply and to mitigate price fluctuations resulting from excess demand and/or supply.
4. Discussion
There are many areas of the energy market that could be affected by the crisis. These contribute directly or indirectly to energy import, export, and price. The Sustainable Development Goals (SDGs), particularly SDG 7, also address the critical issue of clean and alternative energy sources, where sustainability and environmental aspects are strongly integrated [
48,
49,
50,
51,
52]. Other studies provide insights into the behaviour of prices too (e.g., carbon emissions) by using similarity and heterogeneity analysis. The Jaccard coefficient, which we also used in this study, is rarely used to measure differences only in factors [
53]. Most of the published research have used it to measure similarities, which are supported by the results of visibility graph mappings. As an example, Fan et al. [
54] used this coefficient in their study to measure similarities between carbon markets. Then, they constructed visibility graph networks to map daily carbon trading prices. With the help of this method, their results could indicate how the inequalities across the given groups should have been considered in the future national carbon market. In another study, Nobi et al. [
55] examined how the correlation and network structure of the global and local indices changed during the given years. The Jaccard index helped them to find out that the average correlations of the global indices increased with time, while the local indices showed a decreasing trend except for drastic changes during the crises in 2008–2012. We can see that previous research only used the distribution functions of raw time series. The novelty of our research lies in attaching a new, innovative procedure to the previous methodologies. This added value is inherent in the visibility graph method. In our research, we transformed time series into networks and analysed their degree distributions using the Jaccard index. This approach provided us with an innovative way to understand the dynamics of the systems examined. Importantly, our findings, achieved by applying the Jaccard index on the degree distributions, further underscore the potential of this approach for in-depth analyses in this field. Future research could refine these methods to further enhance our understanding of energy markets, potentially uncovering nuanced dynamics that have yet to be explored. A study similar to ours has not yet been conducted to investigate electricity market dynamics and regional interdependence using the Jaccard index and visibility graph network mapping, especially during crises. We think that the used methods and the findings of this study can serve as a model for further studies.
5. Conclusions
The development of renewable energy sources and the implementation of cheaper, more sustainable, and environmentally friendly alternatives compared to traditional energy sources create an opportunity for the affected countries to reduce energy dependency. As the results show, external economic shocks can, on the one hand, strengthen the integration among regional markets and, on the other hand, force the adoption of alternatives that were not previously promoted for business or profitability reasons. One such solution could be increasing energy efficiency, which could lead to a decrease in demand for fossil fuels. This can be achieved by reducing energy consumption, improving building insulation, and applying energy-saving technologies. Diversifying the energy supply also plays an important role in reducing energy dependency. Sourcing imported energy sources from different countries, building new gas pipelines, and developing liquefied natural gas (LNG) infrastructure can enable trade diversification and improvement of supply security. Regional cooperation and integration of energy markets can further strengthen the stability and efficiency of the energy supply. The affected countries can launch joint projects to develop renewable energy sources, expand network capacities, and develop energy transmission infrastructure. The EU increasingly supports the latter developments as strategies for market events, as the current decrease in Russian energy imports poses a serious challenge for Western economies, especially for European Union countries, in the post-pandemic recovery.
This research evaluated time series using the visibility graph method and the overlap coefficient technique. The methods employed played a crucial role in understanding the data and deepening our knowledge about the stability and efficiency of the energy supply.
The visibility graph is an efficient tool for transforming time series into networks. This method allows us to graphically represent complex systems, such as energy supply systems, and examine their dynamics. The examination of time series as networks facilitates the identification and analysis of non-linear relationships, which can contribute to a better understanding of the systems’ behaviour and stability.
We applied the overlap coefficient method to analyse the degree distributions on the networks of each country. This procedure assisted in recognizing similarities and differences between the networks and facilitated a better understanding of the relationships between different systems and markets.
In addition to the usefulness of the methods employed in the research, several further development directions arise. For instance, the application of new data visualization techniques, such as tools for visualizing complex networks, could be important, as they may further aid in understanding the behaviour and interactions of the systems. Finally, in future research, it may be crucial to analyse the effects of variable time horizons and system parameters to better understand the long-term dynamics of the systems and their impact on market stability and efficiency. Dynamic networks can provide great assistance in examining these aspects, although further research work is required for this purpose.


