Article

Factors Influencing the Real-World Electricity Consumption of Electric Motorcycles

by
Triluck Kusalaphirom
,
Thaned Satiennam
* and
Wichuda Satiennam
Department of Civil Engineering, Faculty of Engineering, Khon Kaen University, Khon Kaen 40002, Thailand
*
Author to whom correspondence should be addressed.
Energies 2023, 16(17), 6369; https://doi.org/10.3390/en16176369
Submission received: 18 July 2023 / Revised: 21 August 2023 / Accepted: 31 August 2023 / Published: 2 September 2023
(This article belongs to the Special Issue Innovation in Motor Drive Systems for Electric Vehicles)

Abstract

:
Currently, studies regarding the factors influencing the real-world electricity consumption of electric motorcycles are lacking. The objective of this study was to examine the factors influencing the real-world electricity consumption of electric motorcycles when driving along an uncongested road network. This study developed an onboard measurement device to collect on-road data, including instant speed data and electricity consumption, from the test electric motorcycle while it was driving on a real-world road. Overall, 105 participants (n = 105) drove the test motorcycle along the uncongested urban road network. Multiple linear regression analysis was applied to explore the effect of influencing variables on the electricity consumption of electric motorcycles. The analysis results revealed that the rider’s weight and average running speed positively influenced electricity consumption, whereas decelerating time negatively influenced electricity consumption. Noticeably, the rider’s weight affected electricity consumption more than other factors. The lightweighting of electric motorcycles was mainly recommended to lower electricity consumption. Subsequently, CO2 emissions from electricity generation could be reduced.

1. Introduction

Presently, greenhouse gas emissions are rising, particularly because of the burning of fossil fuels for energy. Global climate change is the effect of this, which must be immediately addressed. To limit temperature rise to no more than 2 °C, GHG emission rates must be reduced by 50% by 2050 [1,2]. The primary source of CO2 emissions is the transportation sector. Since most of its energy comes from fossil fuels, they contribute about 22% of global CO2 emissions. An interesting measure for lowering CO2 emissions from the transportation sector is the electric vehicle (EV). Previous studies have shown that equivalent CO2 emissions from electric motorcycles can be lower than those from gasoline motorcycles. For example, a study in Thailand showed a 56% reduction [3], and a study in Uganda revealed a 36% reduction [4]. Even though CO2 is not released when driving an electric vehicle, it is released when producing electricity from dirty energy sources like lignite, coal, and oil.
Currently, global electricity is generated from coal (36.7%), natural gas (23.6%), hydropower (15.7%), waste-to-energy (10.8%), nuclear (10.7%), and oil (2.8%). The majority of the electricity is thus produced using carbon energy, which cannot be recycled and produces CO2 emissions [5].
According to the Electricity Generating Authority of Thailand, 53% of the country’s electricity in 2022 was from natural gas, 17% was from imports, 10% was from renewable energy, 8% was from lignite, 7% was from coal, 3% was from water energy, and 1% was from oil. CO2 emissions from electricity generation were 0.435 kgCO2/kWh. However, the generation of electricity from clean energy sources, such as solar energy and wind energy, has tended to increase continuously. As a result, Thailand’s electricity generation has a tendency to reduce CO2 emissions over time [6].
The global demand for electric vehicles increased between 2016 and 2021, particularly in developing nations in Asia. Despite the COVID-19 pandemic, which may have delayed shipments and resulted in shortages of electric components, growth doubled between 2020 and 2021 [7]. However, the demand for electric cars continues to grow more rapidly than that for electric motorcycles, which is still a small market. To encourage motorcycle riders to use more electric motorcycles, studies on the development and usage of electric motorcycles from all perspectives are important.
Several studies have explored the influencing factors and consumer’s willingness and intentions for the adoption of electric vehicles [8,9,10]. Electric vehicles with lower weights consume less electricity [11]. Rather than changing the technology of the vehicle engine from the combustion engine to the electric motor, a change in driving behavior can also reduce energy consumption and CO2 emissions. An eco-driving cycle is a fuel-efficient driving behavior that saves fuel and lowers CO2 emissions. Eco-driving drivers consumed 39.3% less fuel and produced 17.4% less CO2 emissions [12]. A previous study [3] examined the real-world driving cycle, energy consumption, and CO2 emissions of electric and gasoline motorcycles while driving on a congested road network where motorcyclists’ driving behaviors were constrained. However, only one driver drove the test motorcycles. Therefore, the impact of driving behaviors on energy consumption and CO2 emissions from motorcycles may not be have been explored.
Therefore, this study aimed to examine the factors influencing the real-world electric consumption of electric motorcycles. The scope of this study focused on the effect of rider characteristics and driving behavior on electricity consumption while driving along an uncongested urban network. The literature review is presented in Section 2. Section 3 presents the research methodology. Section 4 describes the results and discussions, and Section 5 presents the conclusions and recommendations.

2. Literature Review

According to our literature review, numerous factors can influence the energy consumption of electric vehicles. We could classify the influencing factors into three main types, including driving behavior, vehicle characteristics, and driving conditions. The factors influencing electricity consumption are summarized in Table 1.
The driving behaviors influencing electricity consumption included speed and acceleration. Four-wheel electric vehicles consumed more electricity while their acceleration increased [13,14,15] and their speed increased [14,16].
The vehicle characteristics influencing electricity consumption included the weight of vehicles, state of charge of the battery, motor’s operating efficiency, as well as the air conditioner and ancillary components (like the radio and lights). Electricity consumption increased with increasing vehicle weight [11,17]. Electrical consumption decreased with greater motor operating efficiency. However, this decrease was highly sensitive to vehicle size. Increasing motor efficiency had a significant impact on the electricity consumption of larger vehicles but had little impact on smaller vehicles, like scooters [11]. Turning on the air conditioner and ancillary components in electric vehicles significantly increased electricity consumption [11]. A low state of charge of battery could dramatically increase electricity consumption [18].
The driving conditions influencing electricity consumption included traffic and road conditions. The road type or traffic condition had an effect on the electricity consumption. Driving on an arterial road consumed more electricity than driving on other types of roads, such as expressways, collector roads, and local roads in China [19]. On the contrary, city driving consumed less electricity than highway driving in India [11]. Road curvature had a significant effect on electrical consumption, while motorcycles traveling on a curved road consumed less electricity than on a straight road [20].
Many previous studies have researched energy consumption and CO2 emissions on four-wheel vehicles [11,13,14,15,16,18,19,21,22], but some of them have researched two-wheel vehicles [3,4,11,20]. A number of studies have applied models or simulations by software or in a laboratory to estimate electricity consumption [4,11,15,17,18,20,22,23,24]. A few of them [14,16,21] have collected real-world electricity consumptions of four-wheel vehicles, which achieved higher accuracy results. There was a limited study on the electricity consumption of two-wheel vehicles. A previous study [3] compared the energy consumption and CO2 emissions of electric and gasoline motorcycles on the real-world road. However, this study used only used one rider to test the test motorcycles; thus, the variance of driving behavior on electricity consumption had not been explored.
Therefore, this study aimed to determine the factors affecting the electricity consumption of electric motorcycles in real-world road conditions using a group of riders. The research hypothesis of this study was that the characteristics of the rider and driving behavior might influence the electricity consumption of electric motorcycles.
Table 1. Factors influencing the electricity consumption of electric vehicles.
AuthorsTypes of Vehicles and RoadsEstimations/CollectionsInfluencing Factors
Sweeting et al. (2011) [13]
-
Four-wheel electric vehicle
-
Powertrain simulation
-
Driving behavior (higher acceleration, more electricity consumption)
Yao et al. (2013) [19]
-
Four-wheel light-duty electric vehicles
-
Chassis dynamometer test
-
Road type
Saxena et al. (2014) [11]
-
Two- and four-wheel light-duty electric vehicles
-
Powertrain modeling methodology
-
Road type
-
Total vehicle mass
-
Motor operating efficiency
-
Air conditioner and ancillary components
Wu et al. (2015) [14]
-
Four-wheel electric vehicle
-
City network and Freeway
-
Real-world data collection
-
Driving behavior (higher speed, higher acceleration, higher-grade roadway, more electricity consumption)
Li et al. (2016) [21]
-
Four-wheel electric vehicle
-
Congested and uncongested urban network
-
Real-world data collection
-
Road topography
-
Consumption (Heating, Ventilation, and Air Conditioning, HVAC)
Wager et al. (2016) [16]
-
Four-wheel electric vehicle
-
Highway
-
Real-world data collection
-
Driving behavior (higher speed, more electricity consumption)
Galvin (2017) [15]
-
Four-wheel electric vehicle
-
Chassis dynamometer test
-
Driving behavior (higher acceleration, more electricity consumption)
Farzaneh et al. (2018) [20]
-
Two-wheel electric vehicle
-
Electric Motorcycle (EMC) dynamic Model
-
Road curvature
Liao et al. (2021) [18]
-
Four-wheel electric vehicle
-
Powertrain simulation
-
Battery state of charge (SOC)
Mavlonov et al. (2023) [22]
-
Four-wheel electric vehicle
-
Powertrain simulation
-
Efficiency map and the electric motor size

3. Research Methodology

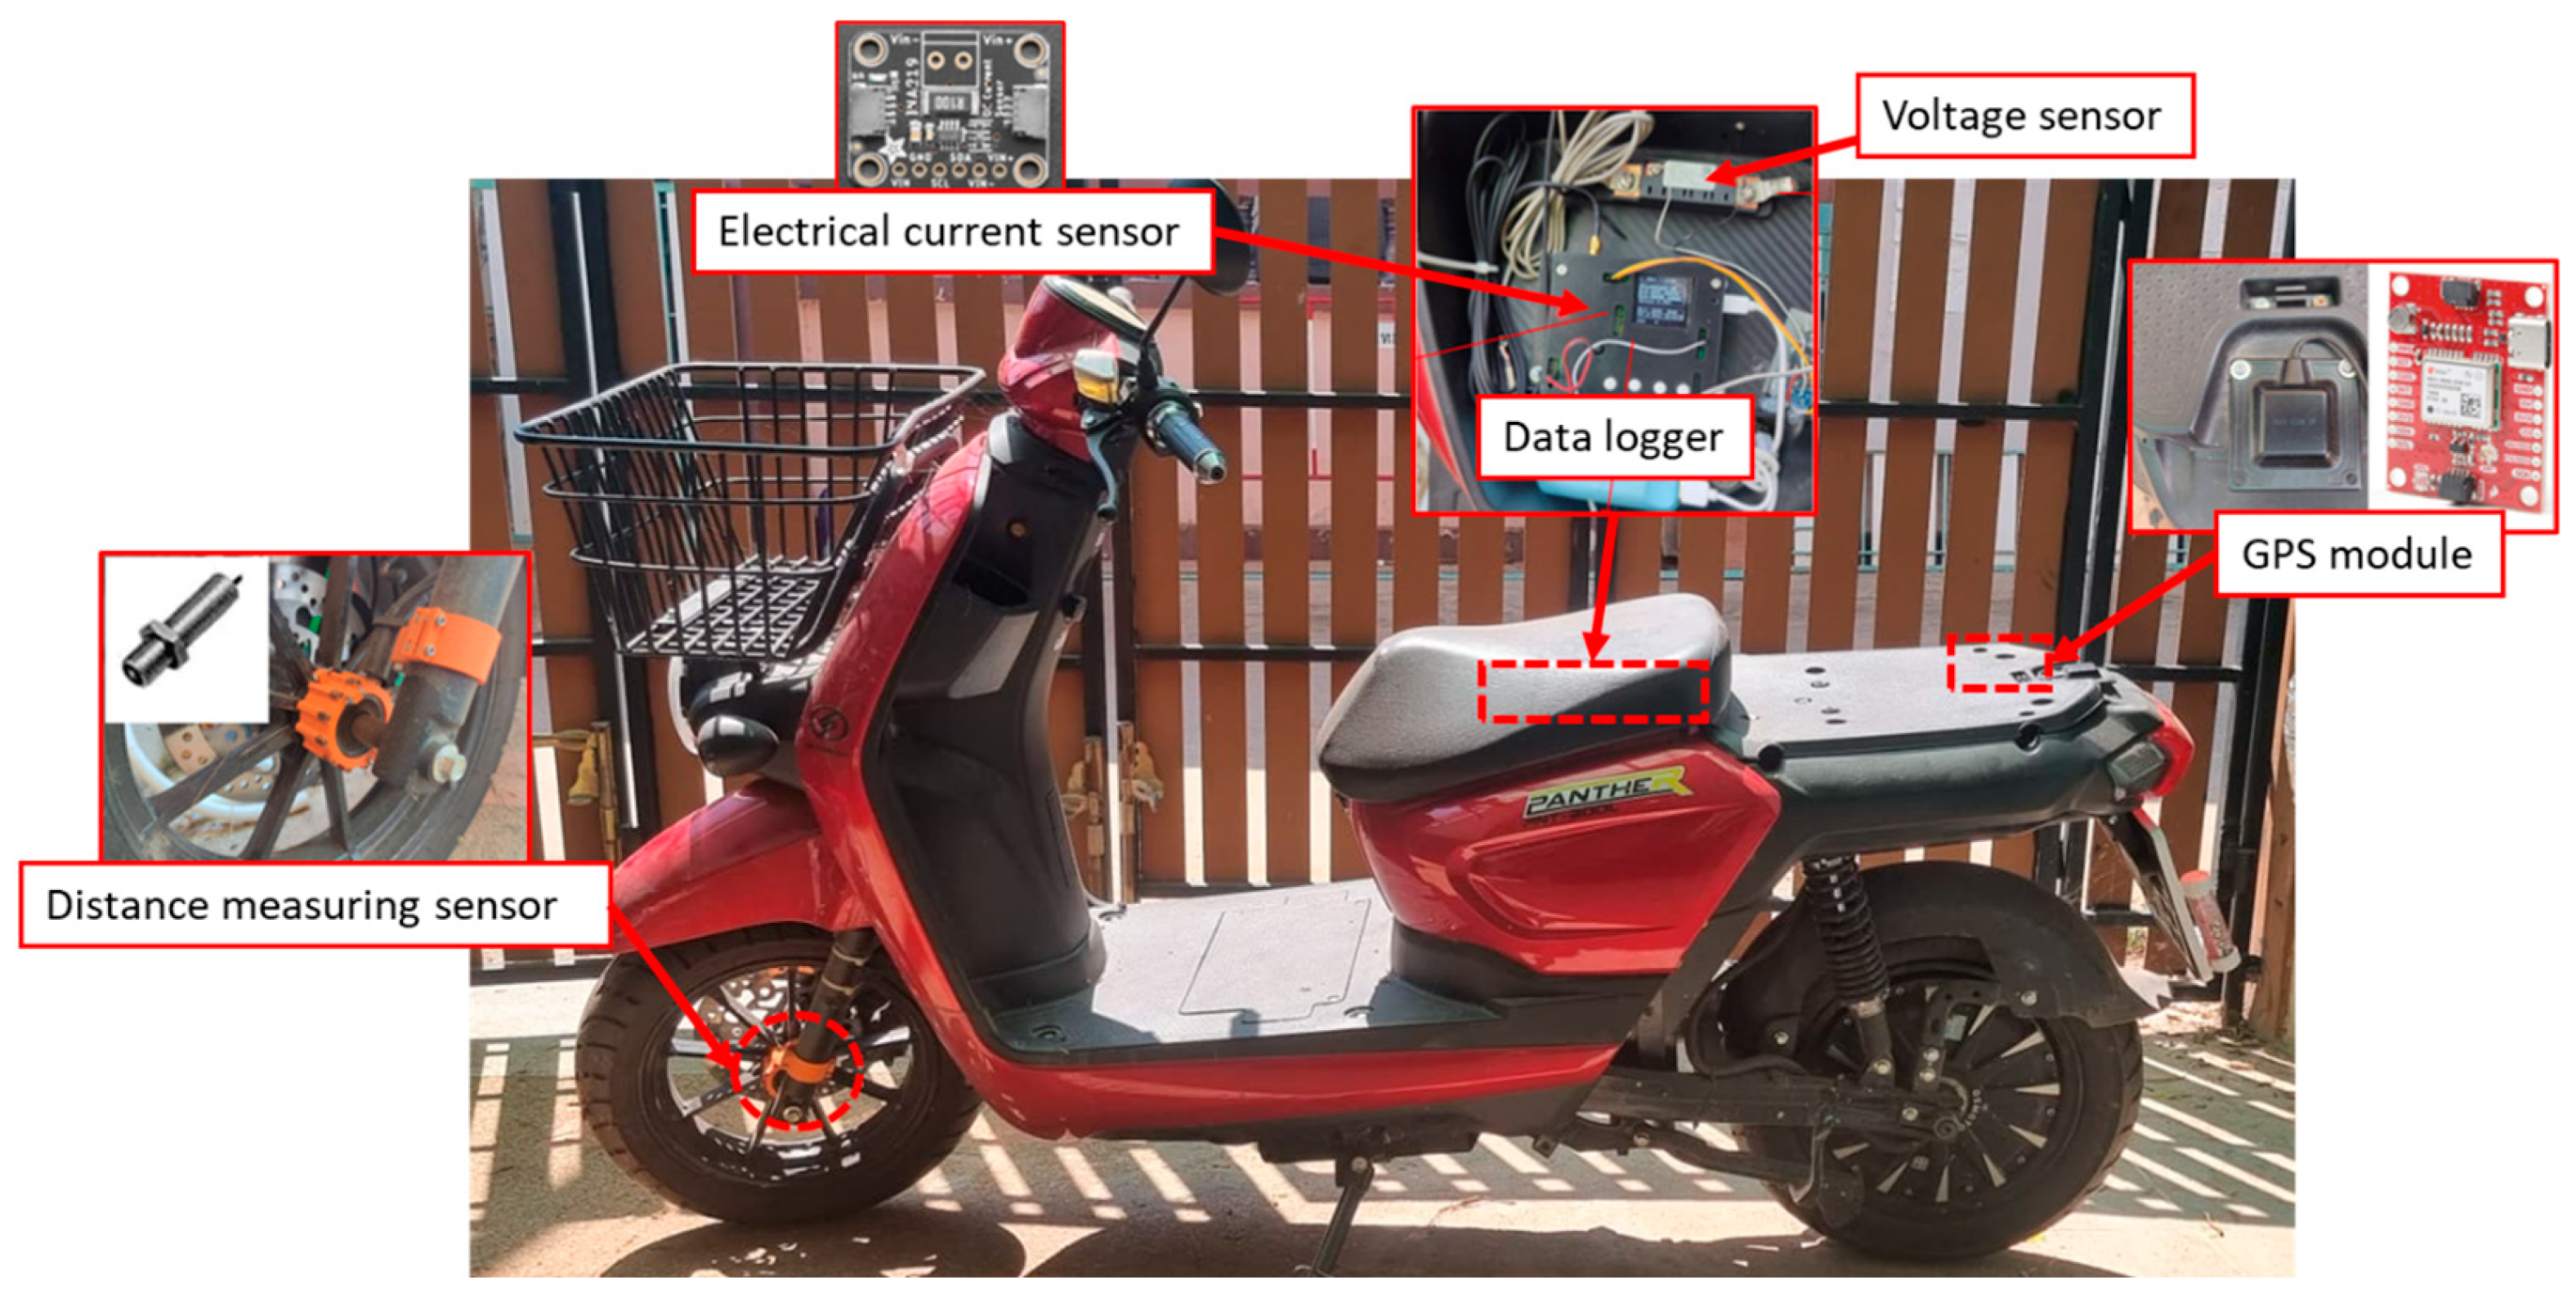
3.1. Development of On-Board Measurement Device

This study developed an on-board measurement device following our previous studies [3,12,25]. The device was installed on the test motorcycle to collect on-road data when it was driving on the real-world road. The developed device could collect and record speed data and electricity consumption per second while the motorcycle was driving on the road network.
The 3000 W electric motorcycle, brand: STROM and model: PANTHER PNT-300L, with 5.8 kWh of lithium-ion battery power, manufactured by Strom (Thailand) Co. Ltd., Bangkok, Thailand, was selected for this study. Its maximum speed was 95 km/h. Its weight was 90 kg. This model had high performance among other models of electric motorcycles in Thailand.
The developed onboard measurement device consisted of several units. A distance measuring sensor, i.e., a hall-effect sensor, was applied to measure distance once every second and to calculate the instant speed. It was installed at the front wheel of the test electric motorcycle. An electrical current sensor was used to measure the electrical current (Amperes). A voltage sensor was applied to measure electrical difference (Volts). Data from both sensors were used to calculate the current rate of power flow (Watts). A GPS module was used to measure the existing location of the test electric motorcycle and installed at the back of the test electric motorcycle. The data logger was installed to record the data measured by all sensors. Figure 1 shows locations where the devices were installed on the test electric motorcycle.

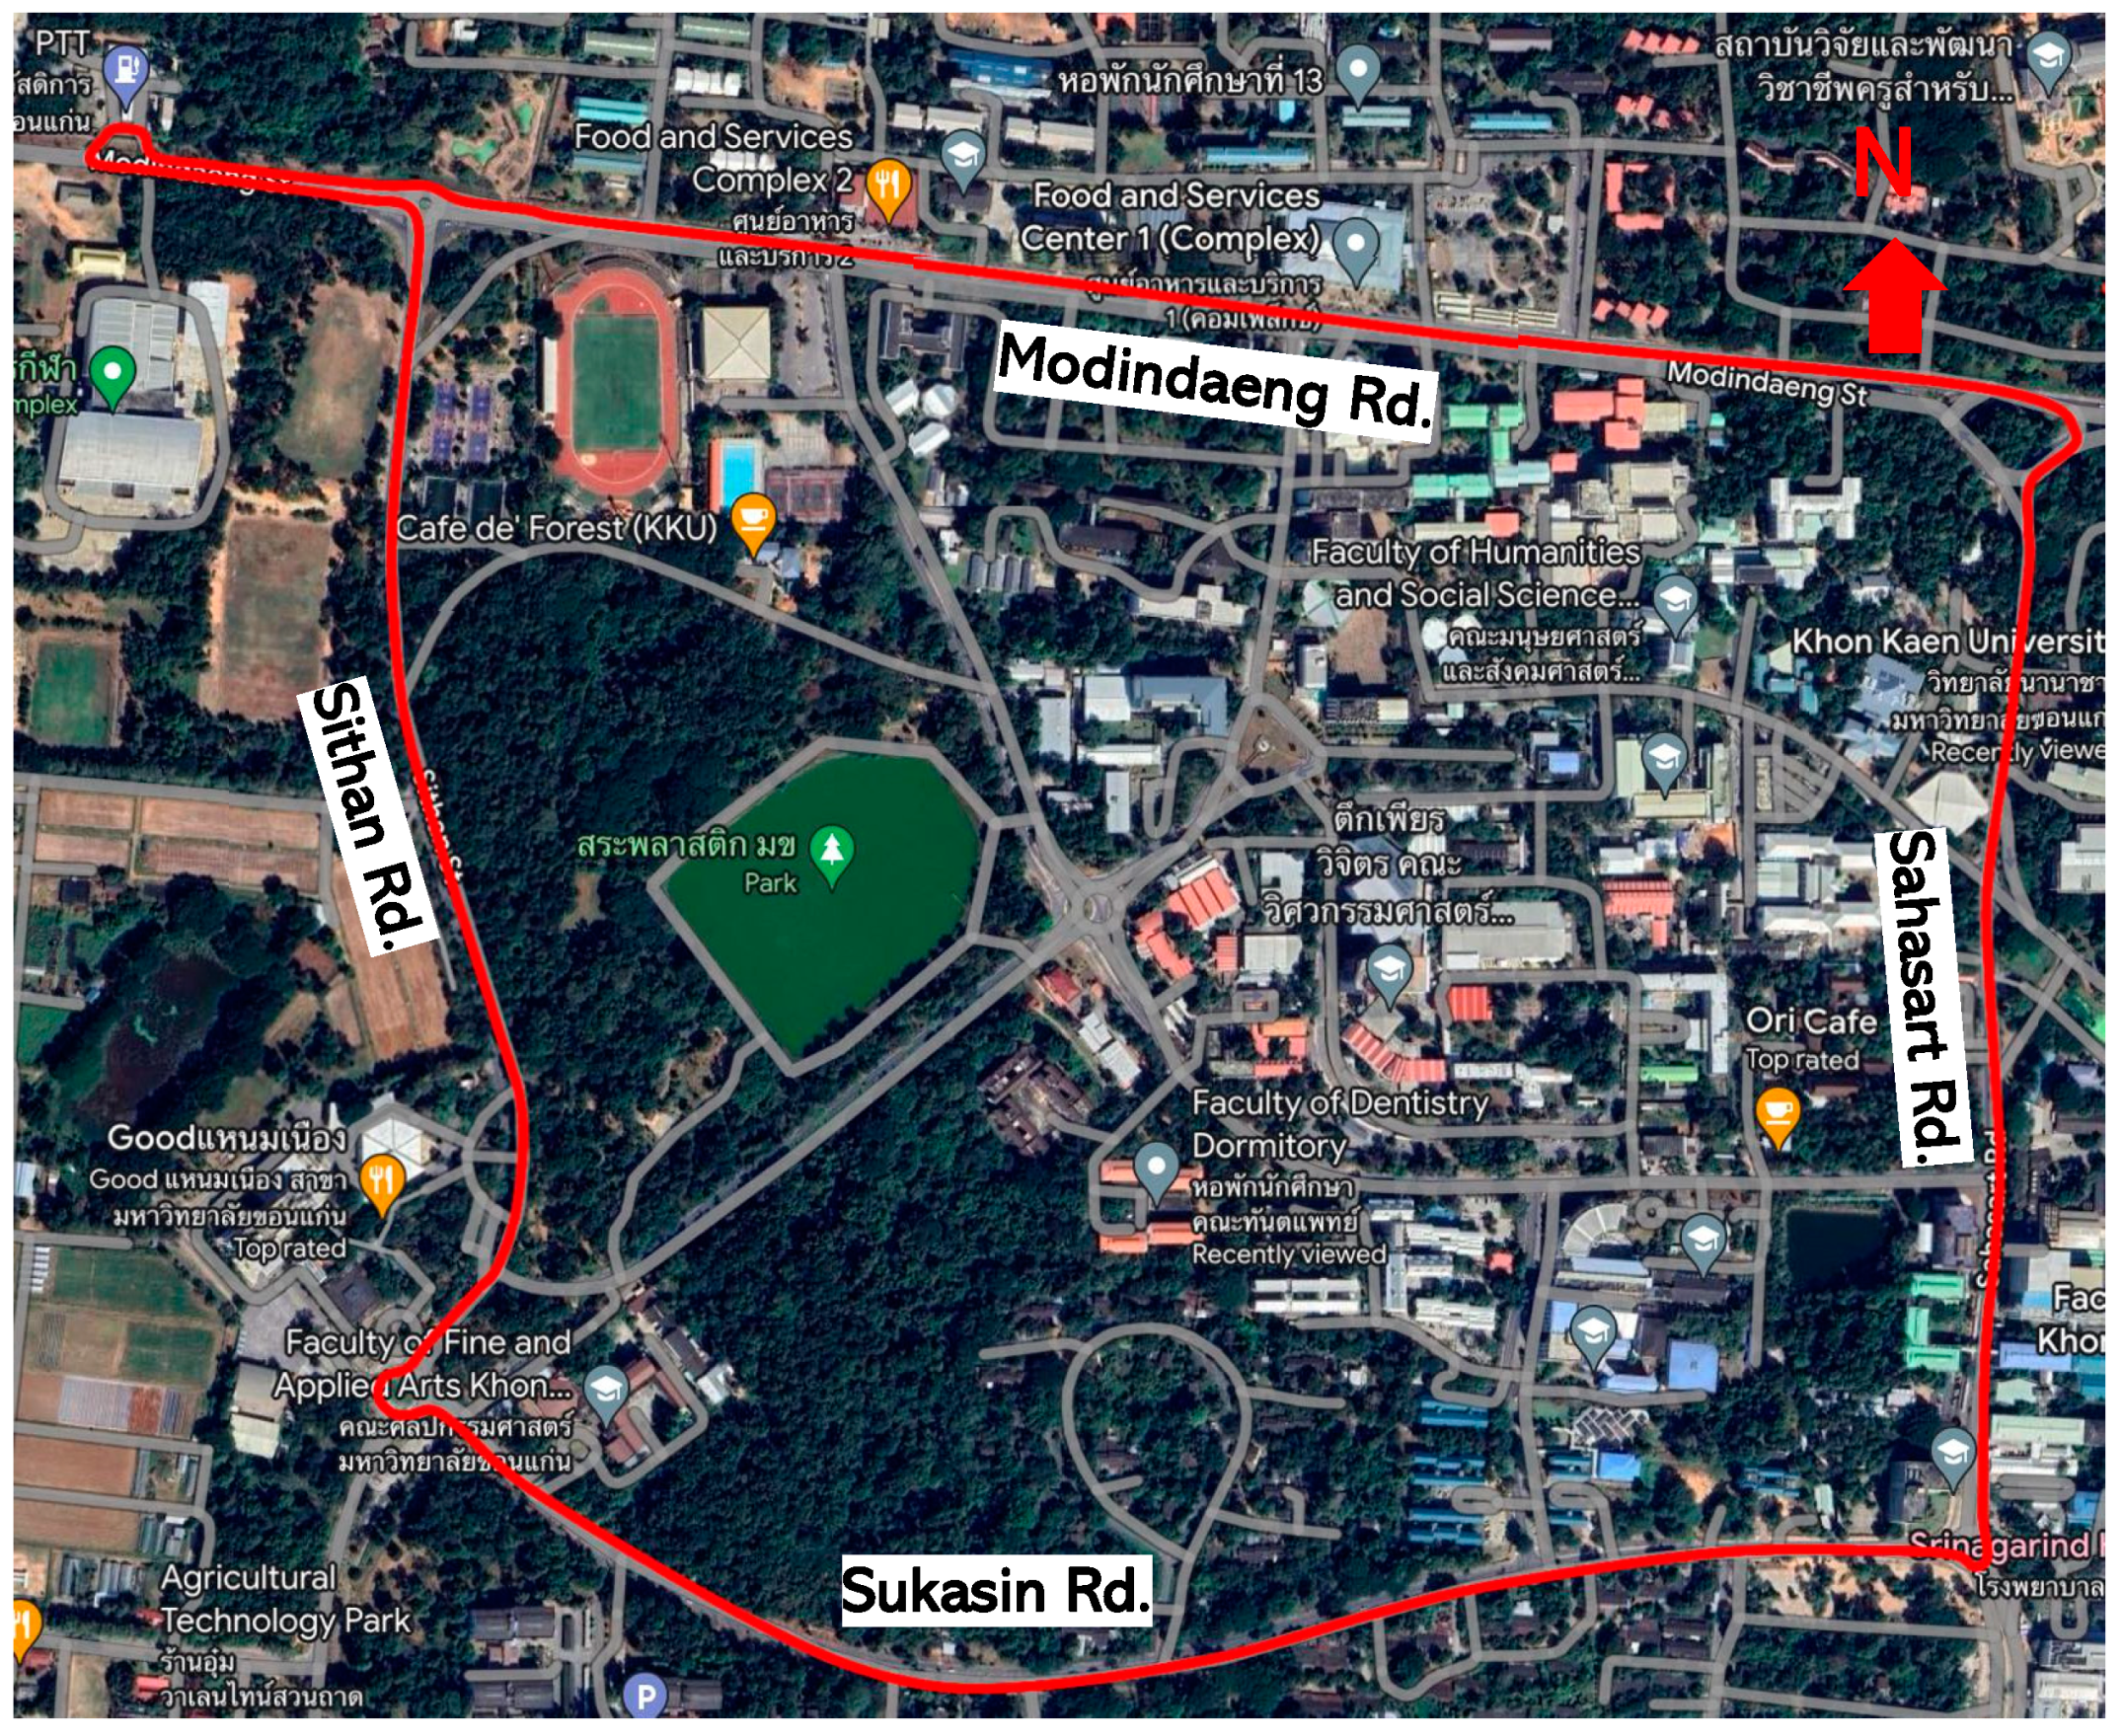
3.2. Real-World Data Collection

The developed onboard measurement device was installed on the test electric motorcycle to collect on-road data. This study selected the road network in Khon Kaen University, Thailand, as the representative of an uncongested urban network for driving the test motorcycle to collect on-road data, as shown in Figure 2. This road network consisted of many long road sections where the riders could accelerate their speeds to the desired maximum speeds. The road topography did not have a high grade. The speed limit was 50 km/h, i.e., the urban speed limit.
Overall, 105 participants, 64.5% of whom were men and 35.5% of whom were women, rode the test electric motorcycle. The on-road driving data were collected during off-peak hours when traffic was not congested, allowing the riders to drive the motorcycle at their preferred speed. This road condition allowed the riders to perform their driving behavior freely. Although an electric motorcycle emits zero emissions, it was driving along the roadway, the electricity generation in Thailand that mainly provides electricity for EVs, which emits CO2 emissions (CO2 Emissions = 0.435 kgCO2/kWh) [6]. Therefore, we calculated the CO2-equivalent emissions (gCO2/km) from the measured electricity consumption of an electric motorcycle (kWh/km).

3.3. Data Analysis

This study explored the relationship between electricity consumption and influencing variables. Multiple linear regression analysis was applied as it has been widely used to analyze driving behaviors in many studies [21,26,27,28]. The dependent variable was electricity consumption. The independent variables were the variables of the characteristics of rider and motorcycle, including the rider’s gender and the rider’s weight, as well as variables of driving behavior, including the average overall speed, the average running speed, the average acceleration, the average deceleration, the accelerating time, the decelerating time, the cruising time, the idling time, and the PKE. The definitions of analysis variables are presented in Table 2.
The stepwise estimation was applied to include the variable in the multiple linear regression model. This process aimed to maximize the incremental explained variance at each stage of model construction. In the first step, the highest bivariate correlation was chosen. The variables that no longer met the significance level were checked and removed, and then the variable with the highest statistically significant partial correlation was added. The significance of partial correlations for variables not included in the equation was evaluated using the t value. They were calculated as a ratio of the additional sum of squares explained by adding a particular variable and the sum of squares left after including that same variable. If this t value did not exceed a significance level of 0.05, the variable would not be accepted to enter the equation [29].
The collinearity diagnostics, including tolerance and VIF, were applied to evaluate the impact of collinearity on the independent variables in the regression equation. The tolerance value indicated the amount of an independent variable’s predictive capability that could not be predicted by the other independent variables in the regression equation. Therefore, it represented the unique variance remaining for each variable. The VIF was the inverse of the tolerance value [29].

4. Results and Discussions

4.1. Validation Results of Developed On-Board Measurement Device

This study validated the distance measurement of a developed on-board measurement device by comparing the 1 km reference distance. The validation result of the developed on-board measurement device is presented in Table 3. It was found that the percentage of average error in measured distances was 0.006%. Consequently, the developed on-board measurement device could measure the distance with high accuracy.

4.2. Results of Real-World Data Collection

The descriptive statistics of real-world data are summarized in Table 4. The average electricity consumption was 57.83 Wh/km, higher than those of 1000 W electric motorcycle (28 Wh/km) [3] and the 1500 W electric scooter (33 Wh/km) [11], since this study used the test electric motorcycle with a higher motor power, i.e., 3000 W, therefore consuming more electricity. The average rider’s weight was 72.2 kg, which was 80% of the test motorcycle’s weight (90 kg). The average overall speed was 27.76 km/h. The running speed was 31.77 km/h, lower than that of the gasoline motorcycle driving on the same route (32.11 km/h) [12]. The average acceleration and the average deceleration were 0.77 m/s2 and −0.78 m/s2, respectively, lower than those of the gasoline motorcycles driving on the same route (0.85 m/s2 and −0.88 m/s2) [12]. The accelerating time, the decelerating time, the cruising time, and the idling time were 28.27%, 27.13%, 31.77%, and 12.64%, respectively. The average PKE was 0.99 m/s2, higher than that of the gasoline motorcycle driving on the same route (0.55 m/s2) [12]. In addition, the calculated CO2 equivalent emissions were 25.74 g·CO2/km, higher than that of the 1000 W electric motorcycle driving in a congested urban road network (14.17 g·CO2/km) [3]. The higher motor power, i.e., 3000 W, of this test electric motorcycle consumed more electricity and therefore emitted more CO2 equivalent emissions.
We may draw conclusions from the real-world data collection when riders were driving the electric motorcycle in an uncongested urban network, i.e., driving behavior was less constrained by traffic conditions. Although their average running speed, average acceleration, and average deceleration were lower than those of a gasoline motorcycle, their PKE was higher [12]. Due to differences in engine technology, the electric motorcycle with a 3000 W motor could produce less power than the gasoline motorcycle with a 113 cc internal combustion engine.

4.3. Results of Multiple Linear Regression Analysis

The result of the overall model fit assessment is displayed in Table 5. The adjusted R2 was 0.344, indicating the percentage of total variation in electricity consumption explained by the regression model consisting of the rider’s weight, average running speed, and decelerating time. The ANOVA analysis showed an F ratio of 19.182 and a significance level of 0.000, indicating that the total sum of squares (6880.605 + 12,076.157 = 18,956.762) was the squared error that would occur if only the mean of electricity consumption was used to predict electricity consumption. Using the values of the rider’s weight, average running speed, and decelerating time reduced this error significantly by 36.3 percent (6880.605 ÷ 18,956.762 × 100) [29].
The results of stepwise estimation are illustrated in Table 6. The final model included the rider’s weight, average running speed, and decelerating time. The t values of rider weight, average running speed, and decelerating time were 7.348, 2643, and −2.662, respectively, which were statistically significant at the 0.05 level. The rider’s weight had a partial correlation (1.848) and a Beta coefficient (0.595), indicating that when the rider’s weight increased, the electricity consumption also increased. The average running speed had a partial correlation (1.529) and a Beta coefficient (0.226), indicating that when the average running speed increased, the electricity consumption also increased. The decelerating time had a partial correlation (−0.954) and a Beta coefficient (−0.226), indicating that when the decelerating time increased, the electricity consumption decreased. The rider’s weight had a Beta coefficient higher than those of the average running speed and the decelerating time, indicating that the effect of the rider’s weight was greater than them. Regarding the results of collinearity diagnostics, the VIF of all variables was below 3, showing that the developed regression model had a complete lack of multicollinearity [29].
Based on the research hypothesis, it can be concluded that the rider’s characteristics and driving behavior influenced the electricity consumption of the electric motorcycles. The higher weight of the rider considerably resulted in higher electricity consumption. This finding is consistent with previous studies that have applied powertrain simulation and found that the loading weight of electric motorcycles influenced their electricity consumption [11,17]. Higher average running speeds caused more electricity consumption since electric motors consumed more electricity while running speeds increased. This finding is consistent with previous studies of two-wheel electric vehicles [3] and four-wheel electric vehicles [14,16]. In addition, the motors of electric motorcycles did not consume electricity while they were decelerating. In contrast, the internal combustion engine of gasoline motorcycles still consumed gasoline while they were decelerating and idling [3,12,30]. Nonetheless, the acceleration did not significantly influence the electricity consumption. This may be attributed to the fact that motorcycle riders did not significantly accelerate the test motorcycle due to their caution and lack of familiarity with the test electric motorcycle.
The findings from this study will lead to lower electricity consumption for electric motorcycles. Although the weight of motorcycle riders cannot be controlled, the lightweighting of electric motorcycle components, e.g., chassis, motor, and battery, should be emphasized. The lightweighting of electric motorcycles has become more popular as a result of significant investments in green energy by both the public and commercial sectors [31]. For example, Brammo manufactured the model Empulse (2012) using plastic to produce the chassis and carbon fiber to produce headlight shroud, fenders, top panel, and rear light housing [32]. The Zero Motorcycles used aircraft-grade aluminium for building the entire frame of the model MX (2013) to achieve mass reduction, which weighs between 101 and 120 kg [33]. Honda plans to manufacture the model EM1 e: (2024)using a plastic composite and aluminum to produce the rear wheel and front wheel, respectively [34]. However, the reduction in vehicle weight is achieved at the cost of more expensive materials and more complex manufacturing processes. This trade-off has raised the relevance of cost-effective vehicle lightweighting in electric motorcycle design.
The eco-driving behavior of motorcycle riders could reduce electricity consumption. For example, the real-world eco-driving cycle should be applied through the eco-driving training course or the eco-mode in an assistant device for motorcycle riders. This real-world eco-driving cycle has an average running speed of 12.7% lower than that of the non-eco-driving cycle, thus reducing the fuel consumption rate and CO2 emission rate by 39.3% and 17.4%, respectively [12]. The smart energy management system can communicate to the rider by receiving the importance of trip time reduction and presenting each optimal speed at straight and curve road alignment to optimize consumed electricity [35]. Alternatively, to streamline the use of energy, an application of speed limiter on vehicles was proposed. The auto-limit riding speed system based on battery level could increase the efficiency of electricity consumption on electric motorcycles by up to 57.3% [36]. Finally, CO2 equivalent emissions from electricity generation could be reduced.

5. Conclusions and Recommendations

This study aims to examine factors influencing the real-world electricity consumption of electric motorcycles when driving along an uncongested urban road network. An onboard measurement device was developed to collect on-road data, including speed data and electricity consumption by second, while the test electric motorcycle was driving on a real-world road. In total, 105 participants drove the test motorcycle along the road network at Khon Kaen University, Thailand. Multiple linear regression analysis was performed to explore the effects of the influencing variables on electricity consumption.
The analysis results revealed that the rider’s weight and average running speed positively influenced electricity consumption, but decelerating time negatively influenced electricity consumption while driving along the uncongested urban road network. However, the rider’s weight affected electricity consumption more than the average running speed, i.e., driving behavior, and decelerating time, i.e., engine technology. Although we could not limit the weight of the riders, the lightweighting of electric motorcycles has been recommended to lower electricity consumption. The eco-driving behavior of motorcycle riders could reduce electricity consumption. Subsequently, CO2 emissions from electricity generation could be reduced.
Future studies should expand on the experimental condition. To increase the likelihood that motorcycle riders will be more familiar with the test electric motorcycle, the pre-driving test should be extended more before data collection. The test electric motorcycle should include more diverse types, i.e., various motor powers. Various power consumption components, such as, drive unit, power going into the screen, DC-to-DC converter, and low-voltage systems, should be installed on the test electric motorcycle to measure their electricity consumption. The real-world driving data should be extended to collect data on more various road conditions, e.g., congested and mixed traffic road networks, as well as high-grade topography. The previous study found that dense signalized intersection networks affected the fuel consumption of gasoline motorcycles more than the driving behavior of motorcycle riders [30].

Author Contributions

Conceptualization, T.K. and T.S.; data collection, T.K.; methodology, T.K. and T.S.; formal analysis, T.K. and T.S.; writing—original draft preparation, T.K.; writing—review and editing, T.S. and W.S.; supervision, T.S. and W.S. All authors have read and agreed to the published version of the manuscript.

Funding

This research received no external funding.

Data Availability Statement

The data presented in this study are available on request from the corresponding author.

Conflicts of Interest

The authors declare no conflict of interest.

References

  1. IEA. Energy Technology Perspectives 2012: Pathways to a Clean Energy System; IEA: Paris, France, 2012. [Google Scholar]
  2. UNEP. Emissions Gap Report 2020; UNEP: Nairobi, Kenya, 2020. [Google Scholar]
  3. Koossalapeerom, T.; Satiennam, T.; Satiennam, W.; Leelapatra, W.; Seedam, A.; Rakpukdee, T. Comparative Study of Real-World Driving Cycles, Energy Consumption, and CO2 Emissions of Electric and Gasoline Motorcycles Driving in a Congested Urban Corridor. Sustain. Cities Soc. 2019, 45, 619–627. [Google Scholar] [CrossRef]
  4. Vanatta, M.; Rathod, B.; Calzavara, J.; Courtright, T.; Sims, T.; Saint-Sernin, É.; Clack, H.; Jagger, P.; Craig, M. Emissions Impacts of Electrifying Motorcycle Taxis in Kampala, Uganda. Transp. Res. Part D Transp. Environ. 2022, 104, 103193. [Google Scholar] [CrossRef]
  5. IEA Global Share of Electricity Generation. Available online: https://view.officeapps.live.com/op/view.aspx?src=https%3A%2F%2Fwww.eppo.go.th%2Fepposite%2Fimages%2FEnergy-Statistics%2Fenergyinformation%2FEnergy_Statistics%2FElectricity%2FT05_02_03.ppt&wdOrigin=BROWSELINK (accessed on 20 January 2023).
  6. EPPO. Share of Power Generation by Fuel Type, Thailand; EPPO: Bangkok, Thailand, 2022. [Google Scholar]
  7. IEA. Global EV Outlook 2022: Securing Spplies for an Electric Future; IEA: Paris, France, 2022. [Google Scholar]
  8. Michael, L.K.; KV, S.; Hungund, S.S.; Fernandes, M. Factors Influencing Adoption of Electric Vehicles–A Case in India. Cogent Eng. 2022, 9, 2085375. [Google Scholar] [CrossRef]
  9. Guerra, E. Electric Vehicles, Air Pollution, and the Motorcycle City: A Stated Preference Survey of Consumers’ Willingness to Adopt Electric Motorcycles in Solo, Indonesia. Transp. Res. Part D Transp. Environ. 2019, 68, 52–64. [Google Scholar] [CrossRef]
  10. Li, W.; Long, R.; Chen, H.; Geng, J. A Review of Factors Influencing Consumer Intentions to Adopt Battery Electric Vehicles. Renew. Sustain. Energy Rev. 2017, 78, 318–328. [Google Scholar] [CrossRef]
  11. Saxena, S.; Gopal, A.; Phadke, A. Electrical Consumption of Two-, Three- and Four-Wheel Light-Duty Electric Vehicles in India. Appl. Energy 2014, 115, 582–590. [Google Scholar] [CrossRef]
  12. Kusalaphirom, T.; Satiennam, T.; Satiennam, W.; Seedam, A. Development of a Real-World Eco-Driving Cycle for Motorcycles. Sustainability 2022, 14, 6176. [Google Scholar] [CrossRef]
  13. Sweeting, W.J.; Hutchinson, A.R.; Savage, S.D. Factors Affecting Electric Vehicle Energy Consumption. Int. J. Sustain. Eng. 2011, 4, 192–201. [Google Scholar] [CrossRef]
  14. Wu, X.; Freese, D.; Cabrera, A.; Kitch, W.A. Electric Vehicles’ Energy Consumption Measurement and Estimation. Transp. Res. Part D Transp. Environ. 2015, 34, 52–67. [Google Scholar] [CrossRef]
  15. Galvin, R. Energy Consumption Effects of Speed and Acceleration in Electric Vehicles: Laboratory Case Studies and Implications for Drivers and Policymakers. Transp. Res. Part D Transp. Environ. 2017, 53, 234–248. [Google Scholar] [CrossRef]
  16. Wager, G.; Whale, J.; Braunl, T. Driving Electric Vehicles at Highway Speeds: The Effect of Higher Driving Speeds on Energy Consumption and Driving Range for Electric Vehicles in Australia. Renew. Sustain. Energy Rev. 2016, 63, 158–165. [Google Scholar] [CrossRef]
  17. Hieu, L.T.; Khoa, N.X.; Lim, O. An Investigation on the Effects of Input Parameters on the Dynamic and Electric Consumption of Electric Motorcycles. Sustainability 2021, 13, 7285. [Google Scholar] [CrossRef]
  18. Liao, P.; Tang, T.Q.; Liu, R.; Huang, H.J. An Eco-Driving Strategy for Electric Vehicle Based on the Powertrain. Appl. Energy 2021, 302, 117583. [Google Scholar] [CrossRef]
  19. Yao, E.; Yang, Z.; Song, Y.; Zuo, T. Comparison of Electric Vehicle’s Energy Consumption Factors for Different Road Types. Discret. Dyn. Nat. Soc. 2013, 2013, 328757. [Google Scholar] [CrossRef]
  20. Farzaneh, A.; Farjah, E. Analysis of Road Curvature’s Effects on Electric Motorcycle Energy Consumption. Energy 2018, 151, 160–166. [Google Scholar] [CrossRef]
  21. Li, W.; Stanula, P.; Egede, P.; Kara, S.; Herrmann, C. Determining the Main Factors Influencing the Energy Consumption of Electric Vehicles in the Usage Phase. Procedia CIRP 2016, 48, 352–357. [Google Scholar] [CrossRef]
  22. Mavlonov, J.; Ruzimov, S.; Tonoli, A.; Amati, N.; Mukhitdinov, A. Sensitivity Analysis of Electric Energy Consumption in Battery Electric Vehicles with Different Electric Motors. World Electr. Veh. J. 2023, 14, 36. [Google Scholar] [CrossRef]
  23. Miri, I.; Fotouhi, A.; Ewin, N. Electric Vehicle Energy Consumption Modelling and Estimation-A Case Study. Int. J. Energy Res. 2021, 45, 501–520. [Google Scholar] [CrossRef]
  24. Lopes, J.A.P.; Soares, F.J.; Almeida, P.M.R. Integration of Electric Vehicles in the Electric Power System. Proc. IEEE 2011, 99, 168–183. [Google Scholar] [CrossRef]
  25. Satiennam, T.; Seedam, A.; Radpukdee, T.; Satiennam, W.; Pasangtiyo, W.; Hashino, Y. Development of On-Road Exhaust Emission and Fuel Consumption Models for Motorcycles and Application through Traffic Microsimulation. J. Adv. Transp. 2017, 2017, 3958967. [Google Scholar] [CrossRef]
  26. Kotagi, P.B.; Raj, P.; Asaithambi, G. Modeling Lateral Placement and Movement of Vehicles on Urban Undivided Roads in Mixed Traffic: A Case Study of India. J. Traffic Transp. Eng. 2020, 7, 860–873. [Google Scholar] [CrossRef]
  27. Kadali, B.R.; Vedagiri, P.; Rathi, N. Models for Pedestrian Gap Acceptance Behaviour Analysis at Unprotected Mid-Block Crosswalks under Mixed Traffic Conditions. Transp. Res. Part F Traffic Psychol. Behav. 2015, 32, 114–126. [Google Scholar] [CrossRef]
  28. Yasanthi, R.G.N.; Mehran, B. Modeling Free-Flow Speed Variations under Adverse Road-Weather Conditions: Case of Cold Region Highways. Case Stud. Transp. Policy 2020, 8, 22–30. [Google Scholar] [CrossRef]
  29. Hair, J., Jr.; Black, W.C.; Babin, B.J.; Anderson, R.E. Multivariate Data Analysis, 8th ed.; Cengage Learning, EMEA: Andover, UK, 2019. [Google Scholar]
  30. Seedam, A.; Satiennam, T.; Radpukdee, T.; Satiennam, W.; Ratanavaraha, V. Motorcycle On-Road Driving Parameters Influencing Fuel Consumption and Emissions on Congested Signalized Urban Corridor. J. Adv. Transp. 2017, 2017, 5859789. [Google Scholar] [CrossRef]
  31. Nayak, A.K.; Ganguli, B.; Ajayan, P.M. Advances in Electric Two-Wheeler Technologies. Energy Rep. 2023, 9, 3508–3530. [Google Scholar] [CrossRef]
  32. Sulthoni BRAMMO Empulse. Available online: https://www.topspeed.com/motorcycles/motorcycle-reviews/brammo/2012-brammo-empulse-ar129701.html (accessed on 31 July 2023).
  33. Squatriglia, C. Zero Builds an Electric Motocross Machine. Available online: https://www.wired.com/2009/06/zero-mx/ (accessed on 31 July 2023).
  34. Purvis, B. 2024 Honda EM1 e: - Technical Review. Available online: https://www.bennetts.co.uk/bikesocial/reviews/bikes/honda/em1e-2024-electric-scooter-review (accessed on 31 July 2023).
  35. Farzaneh, A.; Farjah, E. A Novel Smart Energy Management System in Pure Electric Motorcycle Using COA. IEEE Trans. Intell. Veh. 2019, 4, 600–608. [Google Scholar] [CrossRef]
  36. Rifa’i, A.F.; Rudiansyah, H.; Milanto, R. Design and Implementation of Auto-Limit Riding Speed System for Electric Motorcycles Based on Battery Level with Fuzzy PID. In Proceedings of the 7th International Conference on Electric Vehicular Technology (ICEVT), Bali, Indonesia, 14–16 September 2022; pp. 27–33. [Google Scholar]
Figure 1. Installation locations of the devices on the test electric motorcycle.
Energies 16 06369 g001
Figure 2. Route for real-world driving data collection at Khon Kaen University.
Energies 16 06369 g002
Table 2. Variables for analysis.
VariablesDefinitions
Independent variables
  Electricity consumption (kWh/km)Electricity consumption of electric motorcycle
Variables of characteristics of rider
  GenderGender of motorcycle rider (0 = female, 1 = male)
  Rider WeightWeight of electric motorcycle rider
Variables of driving behavior
  Average acceleration (m/s2)Rate of change of speed above 0.27 m/s2
  Average deceleration (m/s2)Rate of change of speed below −0.27 m/s2
  Average overall speed (km/h) Average speed in a cycle, including every period.
  Average running speed (km/h)Average speed in a cycle, excluding idle period.
  Idling time (%) The proportion of time at speed is zero
  Cruising time (%)The proportion of time obtaining an absolute change of speed ≥ 0.27 m/s2
  Accelerating time (%)The proportion of time accelerating for ≥0.27 m/s2
  Decelerating time (%)The proportion of time decelerating for ≤−0.27 m/s2
  Positive Kinetic Energy, PKE (m/s2)Positive acceleration kinetic energy,
PKE = 1 L ( v i 2 v i 1 2 )   and   v i 2 > v i 1 2 where vi = final speed at time i, vi−1 = initial speed at time i − 1, and L = distance
Table 3. Validation result of the distance measurement of the developed on-board device.
No.Reference Distance (m.)Measured Distance (m.)Error (%)
110001000.690.069
210001000.440.044
31000999.72−0.028
41000999.25−0.075
510001000.180.018
Average1000999.970.006
Table 4. Descriptive statistics of the collected real-world data.
VariablesMax.Min.MeanS.D.
Electricity consumption (Wh/km)89.9432.8157.8313.47
Rider weight (kg)80.063.072.24.38
Average overall speed (km/h)34.4722.1627.762.59
Average running speed (km/h)36.9626.6631.771.97
Acceleration (m/s2)0.920.610.770.07
Deceleration (m/s2)−1.02−0.62−0.780.07
Accelerating time (%)34.2921.5028.272.92
Decelerating time (%)34.5119.827.133.17
Cruising Time (%)49.0022.5531.775.66
Idling time (%)26.190.9612.646.54
PKE (m/s2)1.320.650.990.13
Table 5. Overall model fit.
Multiple R0.602
Coefficient of Determination (R2)0.363
Adjusted R20.344
Standard error of the estimate10.934
Analysis of Variance
Sum of SquaresdfMean SquareFSig.
Regression6880.60532293.53519.1820.000
Residual12,076.157101119.566
Total18,956.762104
Table 6. Multiple linear regression model.
VariableRegression CoefficientsStatistical SignificanceCollinearity Statistics
BStd. ErrorBetatSig.ToleranceVIF
Constant−98.13426.671 −3.6790.000
Rider weight1.8480.2510.5957.3480.0000.9621.039
Average running speed1.5290.5780.2262.6430.0100.8591.164
Decelerating time−0.9540.358−0.226−2.6620.0090.8721.147
Disclaimer/Publisher’s Note: The statements, opinions and data contained in all publications are solely those of the individual author(s) and contributor(s) and not of MDPI and/or the editor(s). MDPI and/or the editor(s) disclaim responsibility for any injury to people or property resulting from any ideas, methods, instructions or products referred to in the content.

