Abstract
Microgrids are decentralized power production systems, where the energy production and consumption are very close to each other. Microgrids generally exploit renewable energy sources, encountering a problem of storage, as the power production from solar and wind is intermittent. This research presents a new integrated methodology and discusses a comparison of batteries and pumped storage hydropower (PSH) as energy storage systems with the integration of wind and solar PV energy sources, which are the major upcoming technologies in the renewable energy sector. We implemented the simulator and optimizer model (HOMER), which develops energy availability usage to obtain optimized renewable energy integration in the microgrid, showing its economic added value. Two scenarios are run with this model—one considers batteries as an energy storage technology and the other considers PSH—in order to obtain the best economic and technical results for the analyzed microgrid. The economic analysis showed a lower net present cost (NPC) and levelized cost of energy (LCOE) for the microgrid with PSH. The results showed that the microgrid with the storage of PSH was economical, with an NPC of 45.8 M€ and an LCOE of 0.379 €/kWh, in comparison with the scenario with batteries, which had an NPC of 95.2 M€ and an LCOE of 0.786 €/kWh. The role of storage was understood by differentiating the data into different seasons, using a Python model. Furthermore, a sensitivity analysis was conducted by varying the capital cost multiplier of solar PV and wind turbines to obtain the best optimal economic solutions.
1. Introduction
Climate change and global warming are topics of major interest in the current decade. Furthermore, there has been an ever-increasing demand for energy over the past few decades. Renewable energy technologies play a major role in satisfying the energy demand, as well as in decreasing emissions, especially in the European Union, where the target of net zero emissions has been set for 2050. The global electricity demand is expected to reach 30,621 TWh in 2030 and 43,762 TWh in 2050, from 24,700 TWh, which was recorded in 2021, with a major part of consumption in buildings and an expected increasing demand from Electric Vehicles (EVs) and hybrid industries [1]. Additionally, the invasion of Russia in the Ukraine caused an energy crisis in many countries. The rising prices of energy in Europe placed a major burden on consumers and had a great impact on the economy, which was recovering from the COVID-19 pandemic [2]. Net zero emissions and sustainable energy can be achieved with the implementation of different types of renewables (such as solar photovoltaics (PV), wind, hydropower, geothermal power, ocean power, bioenergy). The global renewable energy capacity by the end of 2020 was 2802 GW [3]. Portugal generated 24.27 TWh of energy in 2022, accounting for 59.4% of the total electricity production [4].
Hydropower has the largest contribution among all renewable energies. Its energy generation is greater than the rest of the renewable energy technologies combined. Overall, 17% of the global electricity was produced by hydropower in 2020. The potential of hydropower, with low carbon electricity and a very high generation capacity, will be very important in the journey towards the energy transition. Hydropower can be produced at both large and small scales. The large or medium scales typically include the construction of dams and reservoirs to convert potential and kinetic energy into electrical energy, while small-scale hydropower can also include energy extraction from water distribution systems and irrigation systems, using existing infrastructures and thus adhering to the circular economy concept. Hydropower can also be exploited with water hammer and PSH technology, combined with other renewables such as solar PV and wind energy [5].
The increasing demand for energy and the transition towards clean energy have introduced new challenges, such as increased energy efficiency and storage. Energy storage is a critical area of research that is needed for the integration of renewable energies. The pivotal role of energy storage in addressing the problem of the intermittency of renewable technologies such as solar and wind will be of great importance in achieving the goal of mitigating global warming to 1.5 degrees. There are many energy storage technologies, such as mechanical, electro-chemical, chemical, thermal and electrical (Figure 1a) [6]. Batteries and PSH are the most common technologies that are used for energy storage in off-grid systems and microgrids. Considering the current storage technologies, the storage capacity in water and hydropower reservoirs is by far the largest (Figure 1b) [7]. In comparison with battery storage, PSH can also generate positive environmental–social–technical benefits, creating conditions to address climate change, water scarcity, flood control, firefighting support, the availability of water for drinking, irrigation and industrial processes, but can also generate negative impacts, such as natural land transformation [8]. Mine Storage is a company that is involved in implementing PSH projects in old mined areas, which has the potential to overcome the mentioned problem of natural land transformation.
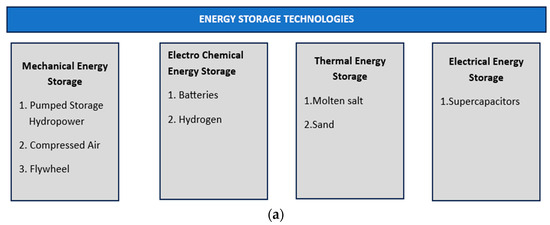
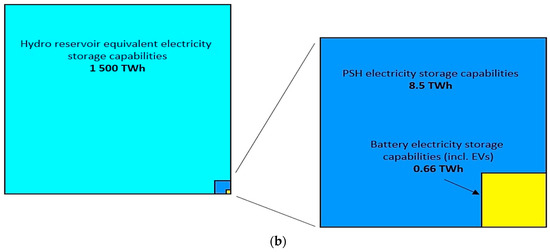
Figure 1.
General classification of different energy storage technologies (a) and capability of electricity storage globally by batteries and hydropower in 2020 (b) [7].
The combination of storage systems can also be used, such as hybrid pumped and battery systems. PSH and batteries can supplement each other, and the system manages energy variations in a promising hybrid technology and can be used in off-grid renewable energy systems [9]. For example, the study presented in [10] used the genetic algorithm to optimize a renewable energy system using solar PV, PSH and batteries to increase the reliability of the system.
Decentralized power systems that use only renewable energy systems as energy sources encounter the problem of intermittent energy production from solar and wind and this can be overcome using storage systems. Within this setting, this research tries to address the problem of an efficient energy storage technology for mini-grids in remote locations and islands. This is a very relevant topic, especially in the European Union. The European Commission is indeed supporting a just and sustainable transition, which means ensuring that regions are not left behind in the clean energy transformation. Moreover, the European Commission is committed to ensuring that rural areas benefit from the new economic opportunities of renewable energies. Renewables are well suited for decentralized and local generation, increasing the number of small-scale energy projects to promote sustainable energy production.
1.1. Pumped Storage Hydropower (PSH) for Medium- and Large-Scale Energy Storage and Production
PSH can be considered as a large battery bank that stores water at higher elevation from a lower reservoir or water body. Whenever there is a demand for electricity, water is discharged from the upper reservoir to the lower reservoir. The water discharged from the upper reservoir runs a hydro-turbine that generates electricity. Whenever there is a surplus of electricity produced from renewables such as wind or solar, or when the electricity demand is low, the water is pumped back from the lower reservoir to the upper one. This method of energy storage becomes critical in off-grid energy systems when there is a dearth of power production from renewables in a low-sunshine or a low-speed wind condition, which cannot satisfy the demand for electricity. The electricity produced can be controlled by varying the flow to the turbine according to the electricity demand.
The world’s largest battery technology is pumped storage hydropower, which accounts for more than 94% of the installed global energy storage capacity [11,12]. There are two ways in which PSH can be effectively used for storage. In open-loop PSH, water from a natural body is used to fill one of the two reservoirs and an upper reservoir is used to store the pumped water. In closed-loop PSH, the system is not connected to a natural water body but forms a connection between two reservoirs (upper and lower) only. The environmental impact of open-loop PSH on aquatic and terrestrial habitats is greater than that of closed-loop PSH, because the natural river is also affected [11]. Closed-loop PSH is used in the current research for HOMER simulations.
In 2022, the total installed turbine power capacity from PSH in Portugal was 3.71 GW, and Figure 2 shows the weekly average electricity production in Portugal using different resources and the contribution of PSH to the total electricity generation [13].
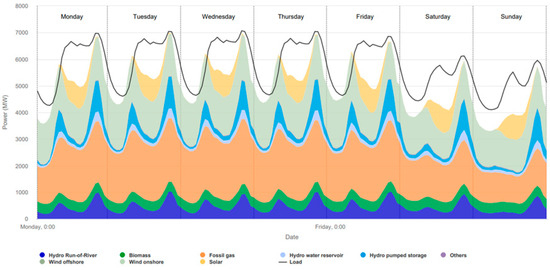
Figure 2.
Average total net electricity generation during one week in Portugal in 2022.
1.2. Batteries as Storage in Microgrids or Off-Grid
Batteries are the chemical energy storage technologies that have been revolutionizing the world, with storage capabilities in grids, mobility systems, electronic devices and many more. The critical factors to consider in a battery are its efficiency, its life cycle, the temperature of operation, the depth of discharge (DOD), the density of energy and self-discharge [14]. There are different classifications of battery technologies based on the chemistry of the battery, such as lead–acid, Li-ion, nickel–cadmium, sodium–sulfur, vanadium redox batteries and more. The study in [15] analyzed the different types of batteries for energy storage and concluded that sodium–sulfur batteries are most used in large-scale storage systems, and the production costs of Li-ion and sodium–sulfur batteries are very high in comparison with other battery technologies. However, Li-ion batteries have high efficiency, high energy density and also a longer life cycle, which makes them a potential energy storage system for grid application (both off-grid and on-grid) [16]. Lead–acid batteries are also potential competitors for energy storage in off-grid systems and microgrids due to their low cost. When lead–acid batteries are compared with Li-ion batteries, Li-ion batteries show a longer life cycle, greater efficiency and better charging and discharging cycles; although the upfront cost of lead–acid batteries seems to be lower than that of Li-ion batteries, over the lifetime of the batteries, Li-ion batteries are the most economical option [17].
1.3. Microgrids or Decentralized Power Production
There are several constraints in extending energy access to remote places and islands, as this can be a problem economically and can also cause environmental impacts. Decentralized power production with distributed energy resources is a promising system where power generation and consumption occur at the same time. This system can achieve zero emissions by using renewable sources only. Wind and solar are major resources for the production of electricity; however, the problem of the intermittency of power production in solar PV and wind energy is a major obstacle in the use of only renewables as a source to satisfy the demand. Therefore, the usage of energy storage technologies such as batteries and PSH becomes inevitable to satisfy the continuous demand for electricity. Batteries and PSH have both advantages and disadvantages when used as storage technologies. Reference [18] gives an overview of the different software that can be used for the design of hybrid energy systems. A hybrid renewable energy system (HRES) is one where there is a combination of more than one energy source [19]. HOMER is a tool that is used to design power systems and was developed by the National Renewable Energy Laboratory of the US. The software can be used to design microgrid systems using various energy generation technologies with resources that can be taken from a specific geographic location. The software performs simulation, optimization and sensitivity analysis. The simulation is conducted to consider the technical aspects and life cycle costs, and the optimization process of HOMER selects the scenario that satisfies the technical aspects with the lowest cost over the period of the project. The sensitivity analysis considers the uncertainties and performs a range of simulations and optimization considering the variability in inputs [20]. Table 1 shows the different research that has been undertaken using the HOMER model.

Table 1.
Different research on microgrids using HOMER software at different locations.
1.4. Data Preparation and Cleaning of the Obtained Load Data
The load data are obtained for each hour from the REN website [27] of Portugal and are scaled down to obtain a suitable load based on the EDM information for the analyzed microgrid. The load data obtained from the website are further used in the simulations of the HOMER software. The quality of the data is enhanced by identifying and clearing the errors and data that are not consistent [28]. There are different types of data, but quantitative data are the data that can be used to measure the topic of interest with numbers such as integers or decimals, and consistent data will result in a reliable analysis of the data [29]. To avoid any unwanted results regarding the usage of the data, the data must be cleaned before using them. With the use of the Python language for data analysis, the load data that are obtained from the REN website are prepared. The zero and missing values of power are replaced by the average values of power consumption. The duplicate values in the collected data are removed in the data preparation process. Outliers are data that significantly deviate from normal values or patterns in the obtained data.
2. Methodology
This research uses an integrated model based on an energy simulator of different alternatives based on renewable energy sources (pre-defined) and an optimizer model for microgrid energy sources with economic analysis integration. The model uses a general grid search algorithm for all possible solutions and then uses its proprietary derivative, a free algorithm, to find the lowest-cost microgrid system (Figure 3). The combination of different parameters from the source availability, different scenarios’ simulation and technical and economic optimization, as an integrated model, represents the novelty of this research. This study uses HOMER as the optimization model to find the most economical storage system and to further analyze the obtained results through a new model developed in Python. The integration of HOMER and Python allows us to analyze the results in different seasons and to assess the role of energy storage in satisfying the energy demand. The assumptions made in this study are (1) scaling down the Portugal demand data for the load and using the same demand pattern for the project; (2) considering the higher end costs of solar PV; (3) considering the selected site viable for a PSH and microgrid project.
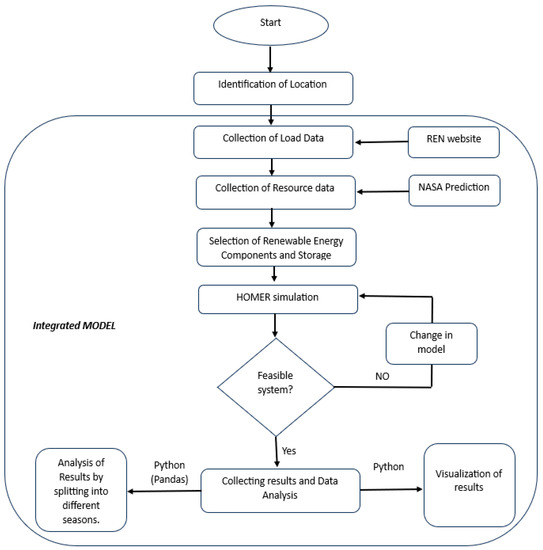
Figure 3.
Developed methodology of the integrated model.
The design of a distributed energy resource (DER) system requires a careful analysis of the available resources in the desired location before installing the renewable energy systems. Microgrids/mini-grids will become critical in providing energy to remote places and islands where grid extension is not feasible. Constructing a framework that unifies all the available renewable energy systems without sacrificing the reliability of the system is quite challenging. Energy storage systems play a crucial role in decentralized energy solutions. The simulation of decentralized energy systems/renewable energy systems can be achieved with many software tools, such as HOMER, PVsyst or others. The HOMER software is used in the current research to obtain optimal results. The HOMER software uses the load data given and collects the resource data from the location in which the microgrid is to be installed. The HOMER results show the economic feasibility of the project. The results from the HOMER calculations show the NPC, LCOE, operation and maintenance costs (O&M) and autonomy of storage. There are two scenarios considered in this research that are simulated in HOMER and then treated in a Python model. The scenarios compare the costs of using batteries and pumped storage hydropower for the given load and renewable energy resources. The following sections explain the details of the components and the simulation characteristics.
2.1. Load
The load for the current system that is used for the optimization of the integrated model is taken from the hourly consumption data of Madeira, Portugal from the the REN website [27] (Figure 4a) and it shows the monthly average variation throughout the year 2022; it also gives information about the complementarity between energy sources in each month. The electric loads are the power consumed every hour in kW. Hourly data are imperative in running scenarios to obtain accurate results. The data are taken concerning the comparison of batteries and PSH as energy storage solutions and we analyze the cost and feasibility aspects. Figure 4 shows the graph of the load. The peak load is 1591.08 kW; the average energy consumed is 25,670.35 kWh/day. The load factor of 0.33 is considered for both simulations. The load is low during the months of summer as there is no heating required.
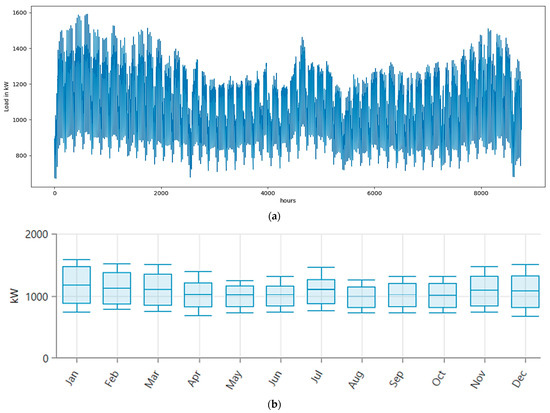
Figure 4.
Hourly load distribution in kW throughout the year 2022 (a), and monthly average variation throughout the year 2022 (b).
2.2. Resources
The location used for the HOMER simulations is Madeira, Portugal. The HOMER software downloads the data of the solar irradiance, wind speed and temperature from different sources, such as NREL or NASA satellites. Portugal is in the southern part of Europe and obtains much more solar power in comparison with most other countries in Europe.
2.2.1. Solar Energy Data
The solar irradiation data are taken from the NASA Prediction of Worldwide Energy Resource (POWER), in the specified location, where the annual average daily radiation is 5.12 . Figure 5 shows the distribution of the solar data in different months. The peak daily radiation is seen in the month of July, with 7.22 . The lowest daily radiation is in the month of December, with 2.580 . The clearness index shows the clearness in the sky. The portion of incoming radiation that is incident on the Earth is the clearness index. The higher the clearness index value, the greater the available energy to convert it into electricity [30]. The highest clearness index is seen in the month of August, with a value of 0.663, indicating that there are many clear sky days in this month, whereas the lowest clearness index is in the month of December, with a clearness index of 0.510, indicating that there are many cloudy days in this month.
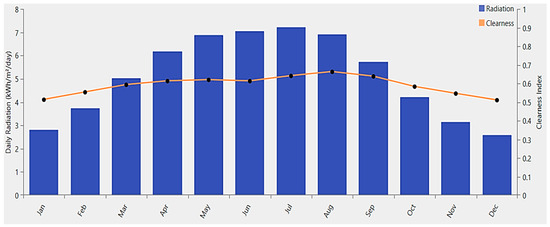
Figure 5.
Solar radiation data of the location with radiation in kWh//day for different months of an average year and with the clearness index for different months.
2.2.2. Wind Energy Data
The model collects the wind speed data from the NASA POWER database. Figure 6 shows the distribution of wind speeds in different months of the year. The anemometer measures the wind speed at a height of 10 m. The wind data are of 50 m altitude above sea level and measured over a period of 30 years. The average annual wind speed is 6.42 m/s. The highest wind speed is seen in the month of December, with an average speed of 7.10 m/s. The lowest wind speed is in September, with a wind speed of 5.369 m/s. The optimized model considers for the wind speed data a surface roughness length of 0.01 m. The wind speed at a specific height can be calculated using the Prandtl law, as shown in Equation (1).
where
u = average wind speed;
z0 = surface roughness;
z1 = height 1;
z2 = height 2.
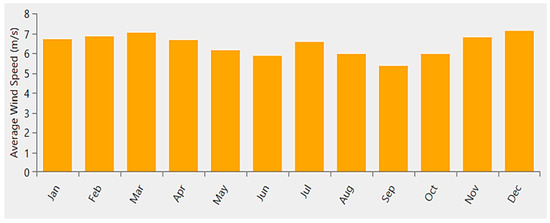
Figure 6.
Average wind speed for all the months considering surface roughness length of 0.01 m and wind speeds measured at a height of 10 m.
2.3. Basic Terminology
2.3.1. Net Present Cost (NPC)
The NPC is the difference between the current value of all the costs, including O&M costs, replacement costs for the lifetime of the project and the present value of the revenue that the project earns over its entire lifetime. The project should be designed in such a way as to reduce the NPC [31]. HOMER uses the discount rate to calculate the NPC. The NPC can be calculated using the following formula [32]:
where
TAC = total annualized cost;
CRF = capital recovery factor;
N = number of years;
i = annual interest rate (%).
2.3.2. Levelized Cost of Energy (LCOE)
The LCOE is the ratio of the average cost of electrical energy produced and the electrical energy produced by the system. This can be calculated using the following equation [33]:
where
= total annualized cost, in EUR;
= total electric load served.
2.3.3. Operation and Maintenance (O&M) Cost
The O&M costs are the costs associated with the wear and tear of the equipment, such as wind turbines, solar PV and hydropower equipment. These can be variable or fixed costs associated with the project. These usually cover the maintenance of dams in hydropower, hydro-turbines and other equipment in wind turbines. HOMER receives the O&M costs for different systems as input and calculates the total O&M cost of the system over the complete cycle of the project [34].
2.3.4. Autonomy of the Storage
Autonomy can be defined as the physical quantity of time that the load can serve in the absence of an energy source. It is measured in hours or days. Higher autonomy of storage will increase the reliability of the energy system by serving the load. Autonomy of storage is an important factor that serves as a backup power source for the energy system that is installed and covers the variations in power production to maintain the system’s operation.
2.4. Simulations
There are two simulation scenarios developed in this research. The aim is to determine the economic feasibility of this case study of a microgrid. A comparison between batteries and PSH and an economic assessment are also carried out. The HOMER model optimizes different scenarios to suggest the lowest NPC scenario. This research concentrates on two scenarios, where, in Scenario 1, solar PV, wind turbines and batteries are used to meet the electrical load demand, as shown in Figure 7. In Scenario 2, solar PV, wind turbines and pumped storage hydropower are used to satisfy the electrical load, as shown in Figure 8. The electrical load is the same for the both scenarios and the same company’s PV and wind turbines are used, without altering the costs, in both scenarios in order to obtain a suitable comparison.
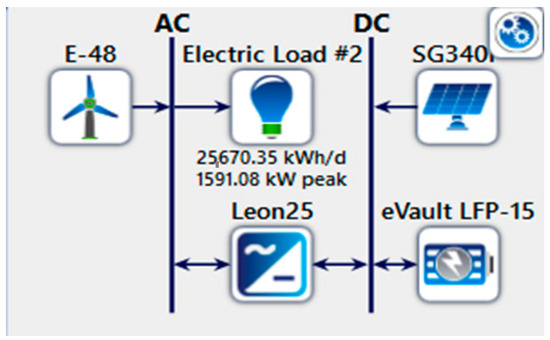
Figure 7.
Scenario 1 with wind turbine, solar PV and battery as storage.
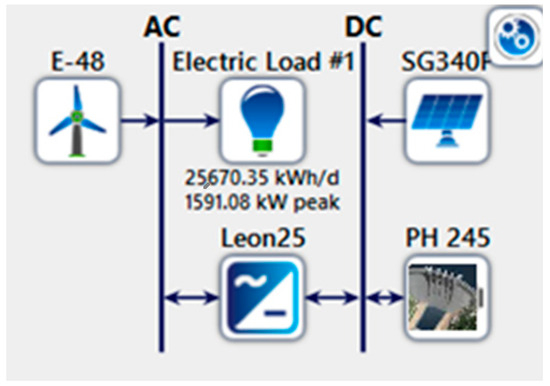
Figure 8.
Scenario 2 with wind turbine, solar PV and PSH as storage.
2.4.1. Solar PV
Solar PV is an economical source of power when designing a renewable energy-based microgrid system. Table 2 shows the specifications of the solar PV used for the simulations. The costs of the solar PV are considered as 3000 €/kW with a replacement cost of 3000 €/kW and an O&M cost of 10 €/kW. The Peimar SG340P is a multi-crystalline solar PV system and the efficiency of monocrystalline solar PV is greater than that of multicrystalline solar PV; however, the cost of monocrystalline PV is higher as well. The power from the solar PV can be calculated using Equation (5).
where
= power output during standard test conditions in kW;
= derating factor of solar PV;
= incident solar irradiance in kW/;
= incident solar irradiance at standard test conditions, i.e., 1 kW/;
= temperature coefficient of power;
= cell temperature of solar PV in °C;
= cell temperature under standard test conditions, i.e., 25 °C.

Table 2.
Technical specifications of all the renewable energy systems used.
Table 2.
Technical specifications of all the renewable energy systems used.
| Solar PV—Peimer SG340P | Wind Turbine—Enercon E-48 [800 kW] | ||
|---|---|---|---|
| Parameter | Value | Parameter | Value |
| PV Model | Peimar SG340P | Wind Turbine Model | Enercon E-48 |
| Vmp | 38.3 V | Rated Capacity | 800 kW |
| Imp | 8.88 A | Rotor Diameter | 48 m |
| Rated Capacity | 1500 kW | Cut-In windspeed | 2.5 m/s |
| Efficiency | 17.5 | Cut-Out windspeed | 34 m/s |
| Operating Temperature | 25 °C | Generator | Direct Driven Generator |
| Temperature Coefficient | −0.43 | ||
| Convertor—Leonics MTP-413 F | Battery—Fortress Power eVault LFP-15 Battery | ||
| Parameter | Value | Parameter | Value |
| Inverter Model | Leonics MTP-413F 25 kW | Nominal Voltage (V) | 48 |
| External DC Charger | 240 V | Nominal Capacity (kWh) | 14.4 |
| Phase | 3 phases | Nominal Capacity (Ah) | 300 |
| Maximum Efficiency | 95% | Roundtrip Efficiency (%) | 98 |
| AC Output | 240 V AC | Maximum Charge Rate (A/Ah) | 0.4 |
| Maximum Charge Current (A) | 130 | ||
| Maximum Discharge Current (A) | 150 | ||
2.4.2. Wind Turbine
Wind turbines are one of the major renewable energy conversion systems in Europe. The wind turbine used in this case study simulation is the Enercon E-48 with a capacity of 800 kW. Figure 9 shows the annual energy yield of the wind turbine with the variation in the wind speed [35]. The cost of the wind turbine is considered to be 3800 €/kW with an O&M cost of 25,600 €/year [36]. The turbine specifications are given in Table 2 [35]. The model calculates the power produced by the wind turbine by calculating the power at the hub height with the power curve and then multiplies the power produced with the air density ratio.
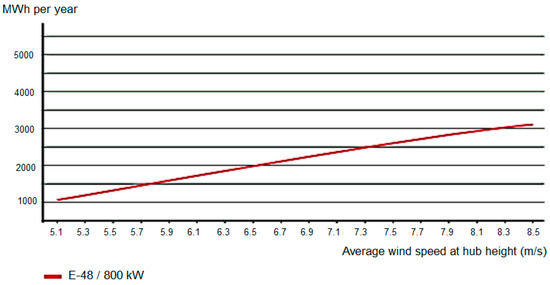
Figure 9.
Annual energy yield of Enercon E-48 wind turbine.
2.4.3. Converter and Batteries
A converter is an important power electronics device that converts AC to DC or DC to AC. The solar panels produce output in DC and this needs to be converted to AC when providing it to the residents or the grid. The specifications of the converter used in the simulation are shown in Table 2. The cost considered for the inverter is 600 €/kW with no O&M cost. The lifetime is assumed to be 10 years. This is a bidirectional inverter with three phases. The inverter can be used for solar and other renewable energy sources.
The battery characteristics are specified in Table 2, where Fortress Power eVault LFP-15 batteries are chosen for this research.
3. Results and Discussion
3.1. Scenario 1
In Scenario 1, batteries are considered for storage along with solar PV and wind energy as renewable sources of energy. Scenario 1 uses batteries to satisfy the demand when there is a drop in the renewable sources’ production of electrical energy from solar PV or wind turbines. The components used in Scenario 1 are the Peimar SG340P solar panels, Enercon E-48 800 kW wind turbines, eVault LFP-15 battery and Leonics MTP-413F 25 kW converter. The cost of the batteries is considered as 14,000 €/Unit. After running the simulations with the input data given in Table 2, the HOMER software runs different scenarios to give an optimized result. According to the simulations, the best scenario is chosen for the analysis. The results of Scenario 1 show that the NPC will be 95.2 M € with an LCOE of 0.786 €/kWh. Figure 10 and Table 3 show the costs associated with this scenario.
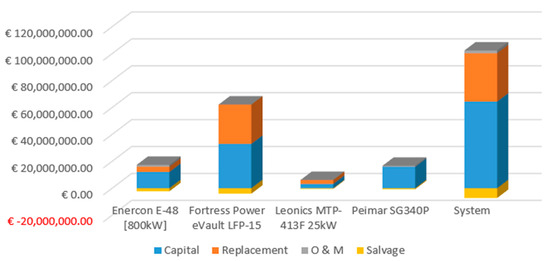
Figure 10.
Representation of capital, replacement, O&M and salvage cost values of PV, wind turbine, battery, converter and the whole system for Scenario 1.

Table 3.
Costs of different components used in Scenario 1.
The electric load is satisfied with 5331 kW of solar PV capacity, 33,955 kWh of battery capacity and 3200 kW of wind energy capacity, with three wind turbines. The HOMER simulation calculates the annual operating costs as 2.38 M €/year. The autonomy of storage in Scenario 1 is 30.2 h. In Table 4, Table 5 and Table 6, we present the technical specifications of each component under Scenario 1’s conditions.

Table 4.
Electrical specifications of Scenario 1.

Table 5.
Technical specifications of battery for Scenario 1.

Table 6.
Technical specifications of solar PV and wind turbine for Scenario 1.
As a wind turbine uses the kinetic energy of wind to produce energy, based on the wind profile in the selected location, the wind specification is as seen in the Table 6 for Scenario 1. Four turbines are chosen, with an installed power capacity of 800 kW each, for a total power capacity of 3200 kW. The average output of the power from the wind turbine is 1062 kW per year. This is further used to find the capacity factor, which is obtained by dividing the mean output of the wind power and total capacity of the wind power [37]. The total energy production through the wind turbine is 9,299,602 kWh/yr. The minimum and maximum outputs for the wind turbine are the lowest and highest amounts of power obtained over the year, which are 0 kW and 2573 kW, respectively. The wind penetration is the average power output of the wind turbine divided by the average primary load, which is expressed as a percentage, whereas the percentage of Enercon E-48 in Table 4 is the percentage of wind energy in the total production of energy.
3.2. Scenario 2
Scenario 2 is simulated with solar PV, wind turbines and pumped storage hydropower (PSH). The generic units of the PSHu parameters are defined by the reservoir capacity of 1000 of water to be discharged over a 12 h time period. The cost of PSHu is considered as 2200 €/kW. HOMER calculates the energy by considering an effective head of 100 m with turbine generator efficiency of 90%.
The discharge flow rate is calculated by
The power generation is calculated using the equation below, considering 90% efficiency:
For the charging cycle of the PSHu, the model considers the turbine generator as a pump in reverse mode to pump the water back to the upper reservoir. The flow rate of the pump is calculated and 0.01875 is obtained as the pumped flow. The period of time required to completely fill the reservoir and the electrical energy with pump efficiency of 80% are 14.6 h and 302.7 kWh, respectively. The model considers a 22 kW generator. The nominal voltage is 240 V with a maximum discharge current of 91.6 A. The capacity of the PSHu is given by dividing the power by the nominal voltage, which is found to be 1059 Ah. The cost of PSH is considered as 2200 €/kW, with an operating cost of 4000 €/year.
Scenario 2 considers the same solar PV and wind turbine components, which are the Peimer SG340P and Enercon E-48, with an equivalent large PSH obtained from 159 PSHu. Scenario 2 has an NPC of 45.8 M € and an LCOE of 0.379 €/kWh. Figure 11 and Table 7 show the costs of the different components of Scenario 2.
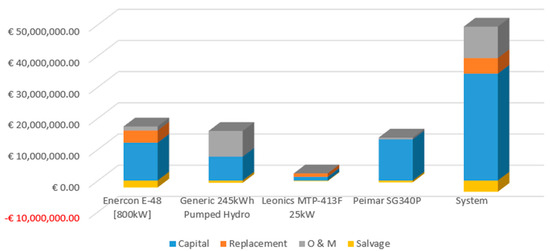
Figure 11.
Representation of capital, replacement, O&M and salvage cost values of PV, wind turbine, PSH, converter and the whole system for Scenario 2.

Table 7.
Costs of different components used in Scenario 2.
The load, being the same as in Scenario 1, is satisfied with 4411 kW of solar PV, 3200 kW of wind energy capacity and 40,411 kWh of PSH capacity. The autonomy for Scenario 2 is 37.8 h. Figure 12 shows the percentage of the PSH state of charge during different days of the year. In Table 8, Table 9 and Table 10, we present the characteristics of each component obtained for Scenario 2.

Figure 12.
State of charge of PSH for different hours of the day and different days of the year.

Table 8.
Electrical specifications of Scenario 2.

Table 9.
Technical specifications of PSH for Scenario 2.

Table 10.
Technical specifications of solar PV and wind turbine for Scenario 2.
Table 10 states the technical specifications of the solar PV and wind turbines. As in Scenario 1, four wind turbines with 800 kW each are selected according to the optimized result. The mean output here is 1123 kW, with a capacity factor of 35.1%. The total production is obtained as 9,841,470 kWh/yr. The wind penetration in Scenario 2 is 105%. The working hours are the same as in Scenario 1, namely 8339 h.
3.3. Comparison between Scenario 1 and Scenario 2
The model optimizes the microgrid with a grid search algorithm to find all the feasible solutions and then uses the derivative-free algorithm, which is implemented in HOMER, to identify the system with the lowest cost. The scenarios covering the load demands with the available renewable resources are inserted into the model to provide an optimized solution with the lowest NPC. The optimized result for Scenario 1 has an NPC of 95.2 M €, whereas Scenario 2, which considers the PSH, has an NPC of 45.8 M €. Hence, the scenario that uses PSH, Scenario 2, had an NPC that is 51.8% lower than the one using batteries, i.e., Scenario 1. This can be attributed to the replacement costs of batteries in the long run, since the lifetimes of batteries are less than those of PSH, and the replacement costs will contribute to the long-term costs of the project. Considering the LCOE, in Scenario 1, the LCOE is 0.786, which is higher than that of Scenario 2, with an LCOE of 0.379. The LCOE, as a defined measure of the cost of energy, shows the economical viability and indicates which is the better project. Hence, the NPC and LCOE are excellent measurement parameters to compare the economic aspects of the two scenarios.
The capacity for solar PV in Scenario 2 is 4411 kW, which is less than the capacity of Scenario 1, which is 5331 kW. Scenario 2 has more PSH power being generated, with an annual throughput of 2,745,708 kWh/yr, whereas, in Scenario 1, with batteries, the annual throughput (amount of energy that cycles though the storage bank in one year) is 2,513,616 kWh/yr. Due to the high cost of batteries and the shorter life cycle, the model requires a greater capacity of renewable energy components (solar PV), which is an economic solution in which a larger storage capacity is used to satisfy the demand for electricity. Figure 13 and Figure 14 show the states of charge of the storage systems in Scenarios 1 and 2 and the solar PV and wind turbines satisfying the load demand.
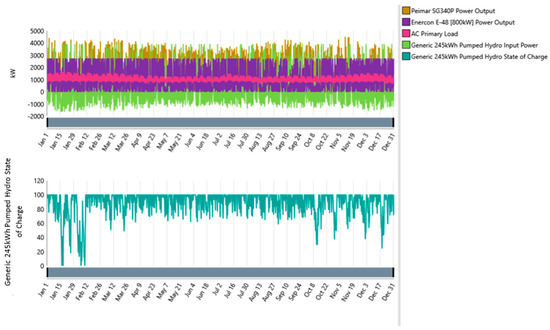
Figure 13.
Scenario 2: solar PV, wind turbine and PSH power output along with the power demand and PSH state of charge.
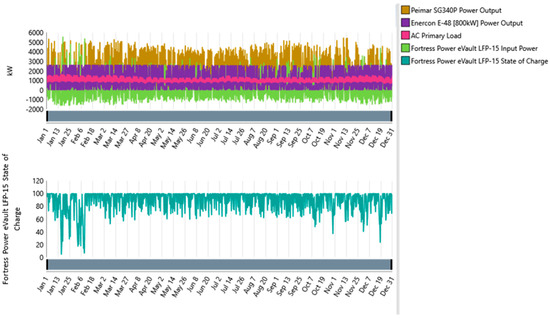
Figure 14.
Scenario 1: solar PV, wind turbine and battery power output along with the power demand and battery state of charge.
3.4. Technical Analysis of Scenario 2 with Python
3.4.1. Energy Demand and Production in Different Seasons
The hourly results obtained from the modeling for demand and production are exported and used in the data analysis of a developed Python model. The whole energy demand and production is divided into different seasons, which are winter, spring, summer and autumn. The winter season ranges from the start of January to the end of February to facilitate the data grouping. The spring period is from the start of March until the end of May. The summer season is considered from the start of June till the end of August. Autumn is considered from the start of September until the end of December. It can be observed that the solar irradiance is lower in the seasons of winter and autumn, which leads to a greater role for PSH during the daytime. It is also observed that the load during these seasons is high due to heating. Figure 15, Figure 16, Figure 17 and Figure 18 show the graphs of power production during the different seasons.
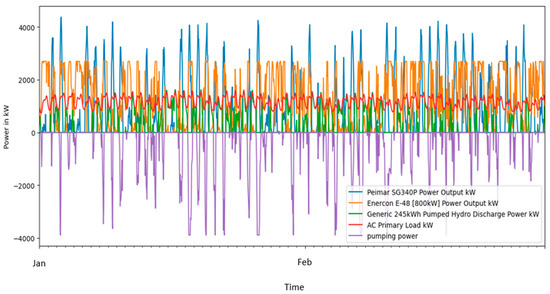
Figure 15.
Power production from solar PV, wind turbine and pumped storage hydropower charge and discharge power along with the load demand for the season of winter.
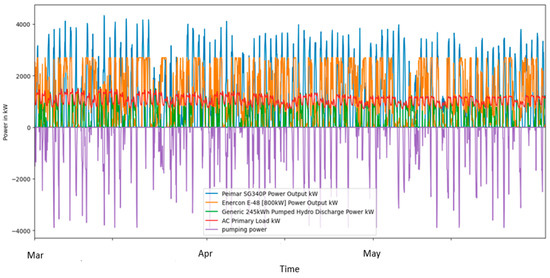
Figure 16.
Power production from solar PV, wind turbine and pumped storage hydropower charge and discharge power along with the load demand for the season of spring.
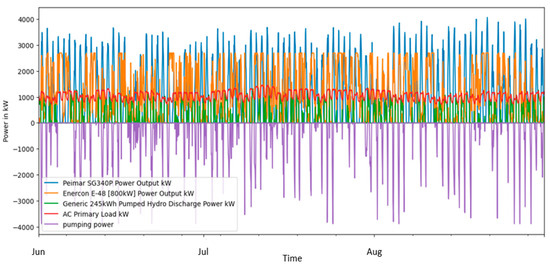
Figure 17.
Power production from solar PV, wind turbine and pumped storage hydropower charge and discharge power along with the load demand for the season of summer.
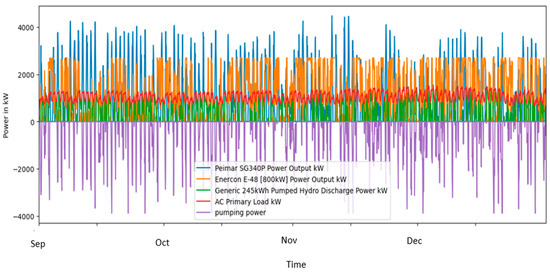
Figure 18.
Power production from solar PV, wind turbine and pumped storage hydropower charge and discharge power along with the load demand for the season of autumn.
Based on the analysis of the different seasons, the pumped storage hydropower working conditions vary. This is mainly due to the highly variable output of the wind energy, which depends on the wind speed. Most of the time, the shadow effects on the solar panels also necessitate PSH to maintain the demand for a power supply. Figure 19 shows a bar graph of the average power production in each month of the analyzed year. Since solar PV works only during the day for a specific time, while the wind power can keep working, the average value of the wind power per month is comparably greater than that of solar PV.
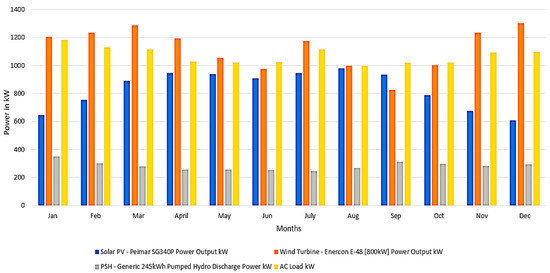
Figure 19.
Power production of solar PV, wind turbine and PSH along with load demand of hourly data averaged across months of the analyzed year.
3.4.2. The Need for Energy Storage
To understand the need for energy storage, the graph of the power production gives a clear picture of the variability of the power generation by wind and the non-production of solar PV during the night. This can be seen in Figure 20, which shows the power production over 48 h in January.
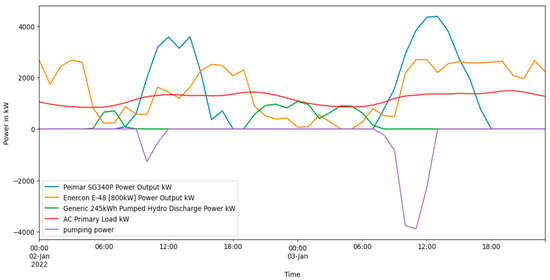
Figure 20.
Power production on 2nd–3rd of January 2022 with solar PV, wind turbine, PSH charge and discharge power along with the demand for power.
It is noticed that in order to keep the demand satisfied, whenever there is a drop in power from solar and wind turbine sources, the PSH satisfies the demand. It is also recognized that whenever there is excessive power production from solar PV, usually during the daytime, the PSH is pumped to recharge the storage. The pumping of water to the upper reservoir ensures that PSH can be used again when there is a demand for power. This can be clearly visualized with profile graphs, and the variability in the wind power can also be realized. Figure 21, Figure 22 and Figure 23 show the profiles of solar PV, wind turbine power output and PSH input power.
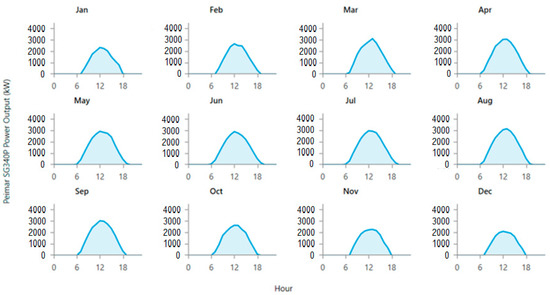
Figure 21.
Average daily profile of solar PV output for different months of the year of 2022.
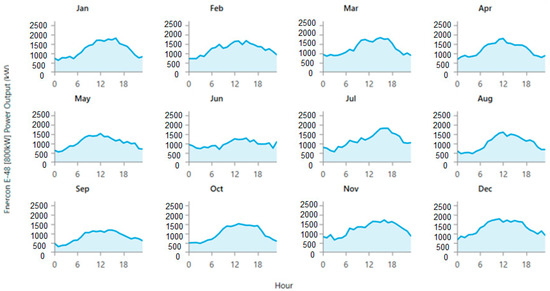
Figure 22.
Average daily profile of wind turbine Enercon E-48 output for different months of the year of 2022, which shows the variability in power generation.
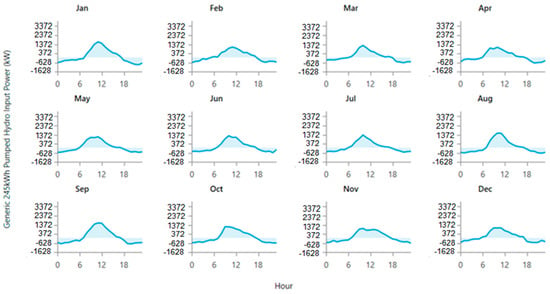
Figure 23.
Average daily profile of PSH input and output power for different months of the year of 2022.
It can be noticed that the production of power from solar PV is low, with a peak close to 2000 kW during the winter season. The production of electricity also can be seen only during the daytime, approximately from 7 a.m. to 6 p.m. There is also a gradual increase and decrease in power production over time, which leaves the demand for power vulnerable, and it needs to be satisfied with wind power and PSH. The variability in the wind power can be seen in the profile of the wind output in Figure 22.
The variability in the power production in the wind turbine is attributed to the continuous variability in the wind speed. Due to this variability, the profile of the PSH shows power being produced at night, where power from solar PV is not available.
Figure 23 clearly indicates that the input power for PSH occurs during the daytime, where the power is produced from solar PV. During the autumn and winter months, there is greater usage of power from PSH, as the power from solar PV is reduced and PSH is required to compensate for the variable power produced from the wind turbine.
3.5. Sensitivity Analysis
A sensitivity analysis is performed with Scenario 2, as it is the optimal solution. It is performed where variable values for different parameters can be given. The scenario, which considers a 100% state of charge for PSH and the capital cost of the SG-340P solar PV and Enercon E-48, is varied, as shown in Table 11.

Table 11.
Capital cost multiplier for sensitivity analysis.
Figure 24 shows the optimal sensitivity solutions. The capital cost is considered with variations both less than and greater than the unit multiplier. The main reason for this consideration is that there have been a number of investments in renewable energy projects and also the effects of war, which result in inflation. The graph covers the variation in the solar PV SG 340P and Enercon E-48 wind turbine for the range of values from 0.2 to 4 in their capital cost multiplier. The various areas show the coverage of the NPC for an optimal solution. The sensitivity analysis covers the different solutions in calculation for microgrids. In Figure 24, we present 36 values of the NPC (in white) for different simulations of the model, resulting from six sensitivity variables for the solar PV and wind turbine; it also shows the representation domain over the given capital cost multiplier range. It is important to ensure that the scenarios or projects in the simulation are as close as possible to the expected reality.
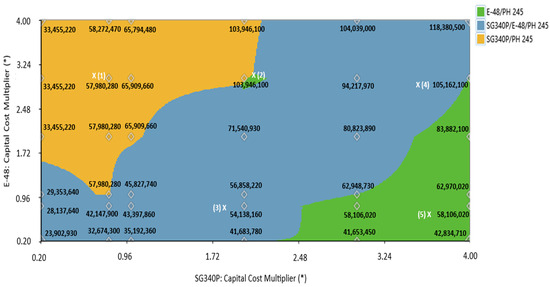
Figure 24.
Sensitivity analysis superimposed with total NPC for cost multipliers of solar PV and wind turbine. * specific values used in capital costs multiplier in each solution.
The orange region is the area with solar PV and PSH as a feasible option in terms of economics, and the blue region suggests a combination of solar PV, wind turbines and PSH. The green region represents the region where the wind turbine-based model dominates. These regions in the graph can be attributed to the capital cost multipliers used. The region with a low wind turbine capital cost multiplier but a higher solar PV capital cost multiplier results in the wind turbine-based microgrid model and vice versa. The green region, with a solar PV capital cost multiplier ranging approximately from 1.9 to 2.2, and a wind turbine capital cost multiplier from 2.8 to 3.10, results in a wind turbine-based microgrid with PSH as storage (E-48/PH 245), due to the lower NPC compared to other solutions involving solar PV + PSH and/or solar PV + wind turbines + PSH. The sensitivity graph is obtained by choosing specific points (1,2,3,4,5), as shown in Figure 24, and observing the different solutions that are possible, as shown in Figure 25a–e.
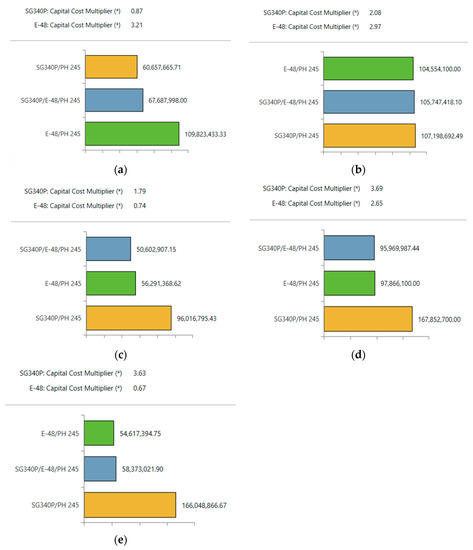
Figure 25.
Interpolated values of capital cost multipliers for solar PV and wind turbine in the developed sensitivity analysis at (a) point 1; (b) point 2; (c) point 3; (d) point 4; (e) point 5; * specific values used in capital costs multiplier in each solution.
4. Conclusions
With the ever-increasing demand for energy around the world, due to climate change and global warming issues, the need for an energy transition has become critical. The rise in solar PV and wind energy renewables has led to potential problems such as variability in power production. The storage of energy is necessary to address the problem of intermittent power production from renewables. Batteries and pumped storage hydropower are some of the storage technologies that are being currently used.
This research discussed the analysis of two scenarios using an integrated model based on the HOMER and Python software tools. The model was run to find an economical solution for the microgrid that satisfies the demand of the load. Scenario 1 used batteries as storage, with solar PV and a wind turbine as renewable sources of power generation. An inverter was used to convert DC to AC. Scenario 2 used PSH with the same renewable sources as Scenario 1 and from the same manufacturers. The simulations resulted in an NPC of 95.2 M € and an LCOE of 0.786 €/kWh for Scenario 1, whereas Scenario 2 resulted in an NPC of 45.8 M€ and an LCOE of 0.379 €/kWh, clearly indicating, for the analyzed case study, that Scenario 2 with PSH was the most economical solution. Real projects should be chosen based on the location and taking into consideration that batteries have a small lifetime in comparison with PSH, which results in replacement costs. Although the cost of batteries is being reduced over time, it is still difficult for them to compete with PSH economically. The technical analysis of Scenario 2 indicates the need for the storage of the data obtained from the model. Data analysis with Python was performed to place distinct data into different seasons and to better understand the role of PSH in the winter and autumn seasons, where the power from PV is reduced. A sensitivity analysis was carried out to investigate different projects by varying the characteristic parameters. The optimal solutions with different capital cost multipliers for the solar PV—SG-340P—and the wind turbine—Enercon E-48—resulted from the combination of solar PV, wind turbines and PSH.
However, this study presents some limitations. In this research, the integrated model does not consider the constraints of the area available to install PSH for the analyzed study. With a constraint on the area, batteries could be a more suitable solution, despite their higher cost, but also their occupied area should be considered. The model performed the simulations using the NASA POWER system to acquire the renewable resource data. The obtained electrical results cannot be exactly the same as real-time results and the margin of error needs to be considered. Moreover, the consideration of buying the land for PSH should also be addressed. Whenever there is a shift in the system from batteries to wind or wind to solar, there is always a challenge in addressing the shifting period from one renewable technology to other, which will require special smart devices and should need be considered also in the optimization and cost analysis.
The analyzed topic also falls within the field of machine learning techniques, used to forecast the energy demand and weather data. Modern digital technologies are used to collect data and develop smart solutions and smart grids with the Internet of Things (IoT), where the lowest cost of energy is inserted into the grid automatically and the PSH is considered based on the power demand and weather forecast conditions.
The other advantages of hydropower as a storage solution against batteries that are worth mentioning are that (i) hydropower is a huge “water battery” that can provide the flexibility to integrate other renewables in a complementary way, allowing us to better address climate change and water scarcity and provide a water supply, but, on the other hand, social and environmental impacts can be generated; (ii) the use of hydropower as a multi-purpose system and its hybridization with other energy sources in the water–energy nexus will be of the utmost importance in the near future; (iii) the lifetime of PSH is comparably higher than that of batteries, guaranteeing a long-term solution; (iv) the number of cycles of charging and discharging can be high for PSH, without shortening the lifespan of the system, when compared with batteries. Thus, these advantages and the economic analysis here performed suggest that PSH can be a better solution in terms of storage for microgrid and off-grid systems in comparison with batteries. However, in the near future, a solution that incorporates both components could be more convenient.
Author Contributions
Conceptualization, H.M.R.; methodology, H.M.R. and P.S.M.G.; drawings, P.S.M.G. and H.M.R.; software and calculus, P.S.M.G.; writing—original draft preparation, P.S.M.G. and H.M.R.; review and editing, P.S.M.G., H.M.R., E.Q. and O.E.C.-H.; supervision and final preparation, H.M.R., E.Q. and O.E.C.-H. All authors have read and agreed to the published version of the manuscript.
Funding
The authors are grateful for the Foundation for Science and Technology’s support of the first author through the funding UIDB/04625/2020 from the research unit CERIS.
Data Availability Statement
The used data are available in the manuscript and can be shared upon request.
Acknowledgments
The authors would like to thank CERIS for the funding support through the Foundation for Science and Technology through the funding UIDB/04625/2020 and the opportunity to develop this research. The Hydropower course at Instituto Superior Tecnico, University of Lisbon, provided the platform for the development and initiation of the idea for this research.
Conflicts of Interest
The authors declare no conflict of interest.
References
- IEA. World Energy Outlook 2022; IEA: Paris, France, 2022; Available online: https://www.iea.org/reports/world-energy-outlook-2022 (accessed on 10 April 2023).
- IEA. Electricity Market Report–July 2022; IEA: Paris, France, 2022; Available online: https://www.iea.org/reports/electricity-market-report-july-2022 (accessed on 10 April 2023).
- IRENA. Renewable Energy Statistics 2021; The International Renewable Energy Agency: Abu Dhabi, United Arab Emirates, 2021. [Google Scholar]
- Energy-Charts. Public Net Electricity Generation in Portugal in 2022. Available online: https://energy-charts.info/charts/energy_pie/chart.htm?l=en&c=PT&year=2022&interval=year (accessed on 10 April 2023).
- Ramos, H.M.; Vargas, B.; Saldanha, J.R. New Integrated Energy Solution Idealization: Hybrid for Renewable Energy Network (Hy4REN). Energies 2022, 15, 3921. [Google Scholar] [CrossRef]
- Rahman, M.; Oni, A.O.; Gemechu, E.; Kumar, A. Assessment of energy storage technologies: A review. Energy Convers. Manag. 2020, 223, 113295. [Google Scholar] [CrossRef]
- IEA. Executive Summary–Hydropower Special Market Report–Analysis. Available online: https://www.iea.org/reports/hydropower-special-market-report/executive-summary (accessed on 10 April 2023).
- Immendoerfer, A.; Tietze, I.; Hottenroth, H.; Viere, T. Life-cycle impacts of pumped hydropower storage and battery storage. Int. J. Energy Environ. Eng. 2017, 8, 231–245. [Google Scholar] [CrossRef]
- Javed, M.S.; Zhong, D.; Ma, T.; Song, A.; Ahmed, S. Hybrid pumped hydro and battery storage for renewable energy based power supply system. Appl. Energy 2020, 257, 114026. [Google Scholar] [CrossRef]
- Ghanjati, C.; Tnani, S. Optimal sizing and energy management of a stand-alone photovoltaic/pumped storage hydropower/battery hybrid system using Genetic Algorithm for reducing cost and increasing reliability. Energy Environ. 2022. [Google Scholar] [CrossRef]
- PNNL. Open or Closed: Pumped Storage Hydropower Is on the Rise. Available online: https://www.pnnl.gov/news-media/open-or-closed-pumped-storage-hydropower-rise#:~:text=Open%2Dloop%20versus%20closed%2Dloop,to%20a%20natural%20water%20source (accessed on 16 May 2023).
- Pumped Storage Hydropower. Available online: https://www.hydropower.org/factsheets/pumped-storage (accessed on 6 February 2023).
- Energy-Charts. Public Net Electricity Generation in Portugal in Week 35 2023. Available online: https://energy-charts.info/charts/power/chart.htm?l=en&c=PT (accessed on 6 February 2023).
- Divya, K.C.; Østergaard, J. Battery energy storage technology for power systems—An overview. Electr. Power Syst. Res. 2009, 79, 511–520. [Google Scholar] [CrossRef]
- Poullikkas, A. A comparative overview of large-scale battery systems for electricity storage. Renew. Sustain. Energy Rev. 2013, 27, 778–788. [Google Scholar] [CrossRef]
- Chen, T.; Jin, Y.; Lv, H.; Yang, A.; Liu, M.; Chen, B.; Xie, Y.; Chen, Q. Applications of Lithium-Ion Batteries in Grid-Scale Energy Storage Systems. Trans. Tianjin Univ. 2020, 26, 208–217. [Google Scholar] [CrossRef]
- Keshan, H.; Thornburg, J.; Ustun, T. Comparison of lead-acid and lithium ion batteries for stationary storage in off-grid energy systems. In Proceedings of the 4th IET Clean Energy and Technology Conference (CEAT 2016), Kuala Lumpur, Malaysia, 14–15 November 2016. [Google Scholar]
- Sinha, S.; Chandel, S. Review of software tools for hybrid renewable energy systems. Renew. Sustain. Energy Rev. 2014, 32, 192–205. [Google Scholar] [CrossRef]
- Krishna, K.S.; Kumar, K.S. A review on hybrid renewable energy systems. Renew. Sustain. Energy Rev. 2015, 52, 907–916. [Google Scholar] [CrossRef]
- Lambert, T.; Gilman, P.; Lilienthal, P. Micropower system modeling with HOMER. In Integration of Alternative Sources of Energy; John Wiley & Sons, Inc.: Hoboken, NJ, USA, 2006; Volume 1, pp. 379–385. [Google Scholar]
- Demiroren, A.; Yilmaz, U. Analysis of change in electric energy cost with using renewable energy sources in Gökceada, Turkey: An island example. Renew. Sustain. Energy Rev. 2010, 14, 323–333. [Google Scholar] [CrossRef]
- Yimen, N.; Hamandjoda, O.; Meva’a, L.; Ndzana, B.; Nganhou, J. Analyzing of a Photovoltaic/Wind/Biogas/Pumped-Hydro Off-Grid Hybrid System for Rural Electrification in Sub-Saharan Africa—Case Study of Djoundé in Northern Cameroon. Energies 2018, 11, 2644. [Google Scholar] [CrossRef]
- Dalton, G.; Lockington, D.; Baldock, T. Feasibility analysis of renewable energy supply options for a grid-connected large hotel. Renew. Energy 2009, 34, 955–964. [Google Scholar] [CrossRef]
- Thomas, D.; Deblecker, O.; Ioakimidis, C.S. Optimal design and techno-economic analysis of an autonomous small isolated microgrid aiming at high RES penetration. Energy 2016, 116, 364–379. [Google Scholar] [CrossRef]
- He, L.; Zhang, S.; Chen, Y.; Ren, L.; Li, J. Techno-economic potential of a renewable energy-based microgrid system for a sustainable large-scale residential community in Beijing, China. Renew. Sustain. Energy Rev. 2018, 93, 631–641. [Google Scholar] [CrossRef]
- Sen, R.; Bhattacharyya, S.C. Off-grid electricity generation with renewable energy technologies in India: An application of HOMER. Renew. Energy 2014, 62, 388–398. [Google Scholar] [CrossRef]
- Energy Market Information System. Available online: https://mercado.ren.pt/EN/Gas/MarketInfo/Load/Actual/Pages/Hourly.aspx (accessed on 10 April 2023).
- Rahm, E.; Do, H.H. Data cleaning: Problems and current approaches. IEEE Data Eng. Bull. 2000, 23, 3–13. [Google Scholar]
- Hellerstein, J.M. Quantitative Data Cleaning for Large Databases; United Nations Economic Commission for Europe (UNECE): Geneva, Switzerland, 2008; Volume 25, pp. 1–42. [Google Scholar]
- How HOMER Calculates Clearness Index. Available online: https://www.homerenergy.com/products/pro/docs/3.9/how_homer_calculates_clearness_index.html (accessed on 10 April 2023).
- Abdelhady, S. Techno-economic study and the optimal hybrid renewable energy system design for a hotel building with net zero energy and net zero carbon emissions. Energy Convers. Manag. 2023, 289, 117195. [Google Scholar] [CrossRef]
- Net Present Cost. Available online: https://www.homerenergy.com/products/grid/docs/1.8/net_present_cost.html (accessed on 10 April 2023).
- Levelized Cost of Energy. Available online: https://www.homerenergy.com/products/pro/docs/3.11/levelized_cost_of_energy.html (accessed on 8 May 2023).
- Operation and Maintenance Cost. Available online: https://www.homerenergy.com/products/pro/docs/3.11/operation_and_maintenance_cost.html (accessed on 14 June 2023).
- E-48–ENERCON GmbH–Wind Turbine Datasheet|GlobalSpec. Available online: https://datasheets.globalspec.com/ds/enercon/e-48/965dc900-6d47-4188-8415-d3e10b84b523 (accessed on 8 May 2023).
- Distributed Generation Energy Technology Capital Costs. Energy Analysis|NREL. Available online: https://www.nrel.gov/analysis/tech-cost-dg.html (accessed on 8 May 2023).
- Wind Turbine Outputs. Available online: https://www.homerenergy.com/products/pro/docs/3.10/wind_turbine_outputs.html (accessed on 16 May 2023).
Disclaimer/Publisher’s Note: The statements, opinions and data contained in all publications are solely those of the individual author(s) and contributor(s) and not of MDPI and/or the editor(s). MDPI and/or the editor(s) disclaim responsibility for any injury to people or property resulting from any ideas, methods, instructions or products referred to in the content. |
© 2023 by the authors. Licensee MDPI, Basel, Switzerland. This article is an open access article distributed under the terms and conditions of the Creative Commons Attribution (CC BY) license (https://creativecommons.org/licenses/by/4.0/).