Abstract
Creating a comfortable indoor environment in education buildings is an important design objective. Climate change has resulted in rising summer indoor temperatures in the severe cold regions of China, and evidence of summer overheating risk in these regions has not yet been fully investigated. This study presents evidence of overheating in a university building in a severe cold region of China, discusses the potential of integrated shading devices for mitigating overheating, and proposes design ideas for the application of shading devices. Temperature monitoring and simulation were performed in a university building with natural ventilation located in Harbin, and various configurations of integrated shading devices were simulated using IES Virtual Environment software. The results demonstrate that 69% of classrooms were overheated; furthermore, south-facing classrooms could be overheated for up to 152 h during summer occupancy hours. This study finds that integrated shading devices reduce overheating hours by up to 59.2%. The design of appropriate parameters for shading devices can effectively improve indoor thermal comfort while maintaining daylight levels and controlling the increase in energy consumption. The methodology and results presented in this study offer a reference point and practical guidance for mitigating regional overheating, aiming to promote the improvement of regional standards and optimisation of thermal environments in the severe cold regions of China.
1. Introduction
1.1. Global Warming and Rising Temperatures
Global warming is intensifying, and temperatures are on the rise. The last nine consecutive years have been the hottest on record, and global temperatures in 2022 were 0.89 °C above the average for the base period (1951–1980), continuing the planet’s long-term warming trend [1]. China’s rate of warming is higher than the global average for the same period and is a sensitive area for global climate change [2]. The most significant warming areas in the last 55 years have been concentrated in the northern or plateau regions at higher latitudes, especially the north-central regions of north-eastern China, northern, and most of north-western China, and the Qinghai–Tibet Plateau [3].
Increasing temperatures have numerous negative impacts. They lead to increased energy consumption and carbon emissions in buildings [4,5] and negatively affect people’s health [6,7] and productivity. In teaching spaces, high temperatures impair students’ thinking [8] and learning abilities [9], leading to laziness, fatigue, and poor concentration.
1.2. Overheating in Severe Cold Regions of China
In other parts of the world at the same latitudes as the severe cold regions of China, there is considerable evidence of summer overheating, particularly in Canadian [10,11] and European [12,13,14,15] dwellings. The risk of overheating in school buildings should also not be underestimated [16]. Simulations of schools by Fuad Mutasim Baba [17] showed that classrooms had overheated for more than 110 h in the summer of 2020. Sara Mohamed [18], who observed two schools in the UK, found that most classrooms experienced overheating for more than 40% of the school day. Similarly, simulations by Camacho Montano et al. [19] showed that overheating of the studied school buildings in the UK represents up to 27% of the occupied time. In the severe cold regions of China, an increasing amount of indoor temperature monitoring data warns of regional overheating risks [20,21], and the risk of overheating in residential buildings has been tentatively confirmed [22,23,24].
Compared with residential buildings, university buildings have more internal heat sources and are more prone to overheating [25]. Some studies have shown that school buildings in severe cold regions have an uneven distribution of indoor heat in summer, with average monitored temperatures of around 30 °C [26]. In university buildings, students spend a significant amount of time in classrooms during the day [18,27], and although studies have highlighted the importance of creating a good thermal comfort environment in such buildings, little attention has been paid to the risk of overheating and thermal comfort in university buildings in the severe cold regions of China.
1.3. Integrated Shading Devices
There are two main types of measures to mitigate summer overheating: active interventions in building systems, such as ventilation systems, and passive performance optimisation of buildings, including modifications to the performance of the building envelope [28,29,30], natural ventilation [31,32,33], and shading devices [17,22,34]. Controlling solar gain can be effective in reducing overheating in summer. Approximately 45% of the heat gain and loss in the envelope occurs through windows [35]. Passive shading devices are considered to be the most critical design element for regulating thermal comfort [36,37]. In general, external shading devices for buildings perform better than internal shading devices [38]. Fixed shading devices generally perform better than movable shading devices [36,39,40] and are more economical [34]. Integrated external shading devices are a common type of shading in teaching buildings [40] and are effective in blocking sunlight from all orientations and different height angles. However, they have an equally large impact on the building’s indoor daylight environment and need to be reasonably evaluated before application [41].
Arifin et al. [42] studied the effectiveness of shading methods in enhancing thermal comfort in office buildings through statistical data. They showed that integrated shading devices played a significant role in reducing indoor temperatures and increasing thermal comfort compared with other shading methods. Nedhal A et al. [43] found that integrated shading devices had significant potential to reduce the duration of thermal discomfort in Malaysian high-rise residential buildings. Cho et al. [44] studied different designs of horizontal and vertical shading panels and concluded that external shading devices were effective in reducing air-conditioning energy consumption. Aleksandra et al. [37] analysed a variety of shading devices in office buildings in the Mediterranean region and concluded that a combination of horizontal and vertical shading yielded the best energy savings.
The application of shading devices to mitigate overheating has been studied at similar latitudes [45,46,47] and within the region [22], but the effectiveness of integrated shading devices in university buildings is unclear. This paper assesses the impact of integrated shading devices on summer indoor environments in classrooms in the severe cold regions of China.
1.4. Overheating Risk Criteria
There is no common definition of or guidance on overheating at an international level, but a number of reference standards have been proposed by different regions and organisations. ISO 7730-2005 [48], published by the International Organization for Standardization (ISO), specifies environmental conditions that are acceptable for general thermal comfort as well as those that represent local discomfort. The European Committee for Standardization (CEN) published EN15251 [49] and EN16798 [50], which present standards for adaptive models and individualised systems. The American Society of Heating, Refrigerating, and Air-Conditioning Engineers (ASHRAE) published ASHRAE 55 (2017) [51] and ASHRAE 55 (2020) [52], which include stand-alone adaptive models and specify acceptable thermal environmental conditions. The Chartered Institution of Building Services Engineers (CIBSE) has published a succession of guidance documents relating to indoor thermal comfort environments. Guide A (2006) [53] uses the percentage of occupied hours out of range as a single indicator for assessing time-integrated overheating. TM 52 [54] assesses three criteria to predict the risk of overheating in buildings. TM 59 [55] provides a reference for assessing the risk of overheating in homes. Based on CIBSE TM 52, the UK government has also developed the BB101 Guidelines [56] to assess overheating risk in schools and provide advice on thermal conditions in schools.
The Chinese code GB 50176-2016 [57] requires that the design requirements for severe cold areas “must adequately meet the winter insulation requirements, and summer heat protection can generally be disregarded”. There is therefore no clear standard for assessing the potential risk of overheating in public buildings in such regions; nor is there a code that discusses the need for shading devices in this region.
There is no uniform definition of the threshold values for summer indoor comfort temperatures in university buildings in the severe cold regions of China. However, some codes [58,59,60,61] and air conditioning design standards [62,63] define the comfort temperature of air-conditioned rooms in summer, with the upper range mostly between 26 °C and 28 °C. This can provide a reference for thermal comfort environment indicators of naturally ventilated university buildings in severe cold regions.
1.5. Research Gap and Innovations
In summary, the research gaps and innovations are as follows:
- Although an increasing number of studies have reported the impact of climate change on the thermal environments of buildings, the existing literature on empirical studies of indoor thermal comfort during summer in the severe cold regions of China is quite limited. In this region, studies related to building overheating have focused on residential buildings, while the overheating risk in educational buildings is still unknown. This paper aims to refine this identified research gap by first presenting evidence of overheating in educational buildings in these regions.
- Previous case studies have mainly focused on analysing the degree of overheating in specific rooms but lacked attention to the building as a whole. This paper assesses whether all rooms in an entire educational building satisfy the criteria by analysing specific spaces, which contributes to a more comprehensive understanding of the overheating risk profile.
- Shading devices have been recognised as an effective means of mitigating overheating. However, the Chinese code clearly states that the application of shading devices in severe cold regions has not yet been considered. Therefore, the effectiveness of applying integrated shading devices to mitigate overheating in this region needs to be verified. When studying mitigation measures, few articles have simultaneously considered the effects of multiple aspects such as the thermal environment, daylight, and energy consumption. This paper synthesises these three elements and proposes a methodology for the design of integrated shading application parameters. This method can be applied to the evaluation of multiple scenarios in different buildings with greater practical and guiding significance.
This paper answers the three following research questions:
- Do naturally ventilated university buildings in the severe cold regions of China suffer from overheating in summer? If so, what is the degree of overheating?
- Can the application of integrated shading devices mitigate overheating in classrooms at risk of overheating? If so, to what extent?
- Shading devices mitigate overheating by reducing solar radiation in the room, which affects the daylight entering the space and increases energy consumption for heating in winter. How should the parameters of integrated shading devices be designed, taking full account of the daylight environment and year-round energy consumption? What are the recommended values?
2. Methodology
2.1. Case Study
The severe cold regions of China are defined as regions in which the coldest monthly average temperature is ≤−10 °C or the average daily temperature is ≤5 °C for ≥145 days [57]. The representative city selected for this study was Harbin. The region has a mid-temperate continental monsoon climate with long, cold winters and relatively short summers. The temperature rises and falls rapidly in spring and autumn, which are transitional seasons of relatively short duration. The geographical and climate-related characteristics of the study area are shown in Table 1, Figure 1.

Table 1.
Geographic information and climate data for Harbin.
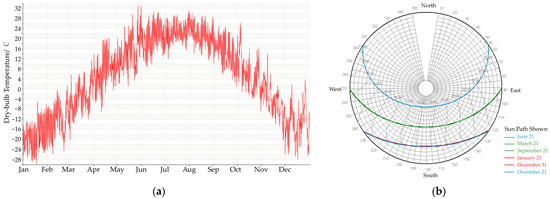
Figure 1.
Harbin: (a) annual dry-bulb temperature; (b) sun path diagrams, generated by IESVE software. Weather data source: ASHRAE design weather database v6.0.
Indoor air temperature was simulated and measured in a university building in Harbin. The focal building is naturally ventilated and has no air-conditioning system. In winter, the main indoor heat source is the central heating system. Central heating is supplied by a heating company through the municipal hot water network. The building is oriented 60° east of south, with a total floor area of 12,500 m2, 9 storeys above ground, and a total height of 36 m. Functionally, the building comprises mainly classrooms and offices, as well as a few physical science laboratories, with a total of 162 functional rooms. The floor plan and 3D model of the building are shown in Figure 2.
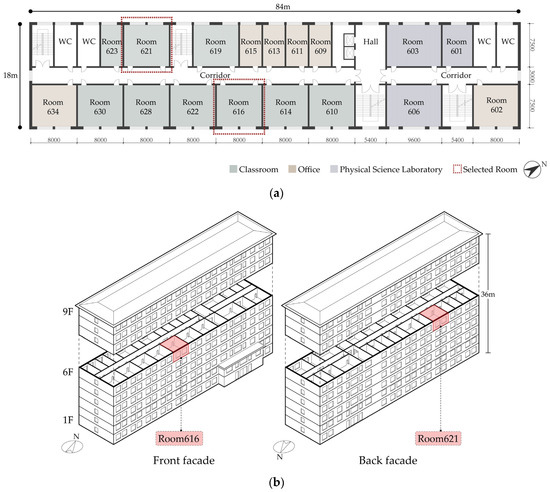
Figure 2.
(a) Sixth-floor plan; (b) simplified model of the building, with the classrooms being monitored identified.
Room 616 and room 621 in the central part of the sixth floor were chosen as the objects of measurement and simulation to reduce the impact of shading from trees and heat transfer from the roof on the indoor environment. Both rooms have an area of 60 m2 and a floor height of 3.9 m. The room façade is designed with two windows, with a single window opening area of 6.75 m2, a size of 2.5 × 2.7 m, a sill height of 1 m above ground, and a window-to-wall ratio of 0.43.
2.2. Measurement
The ambient temperature was monitored and recorded during the non-heating months using a UbiBot WS1 wireless smart sensing device, which was installed on a wall away from indoor heat sources and direct sunlight. The locations of the sensors in the rooms and a picture of the sensor are shown in Figure 3.
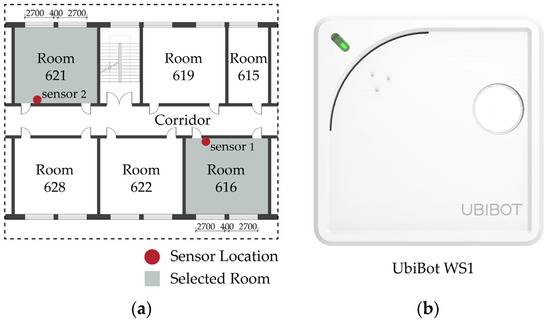
Figure 3.
(a) Sensor positions; (b) style of the sensor.
The Ubibot WS1 wireless smart device relies on DS18B20 sensors to collect information on temperature and other information, and to collect and upload data in real time via a wireless network. The parameters of the sensor are shown in Table 2. The temperature in the classrooms was tracked hour by hour. The indoor temperatures recorded by the sensors during this period were used to test the validity of the simulation.
Table 2.
Sensor parameters.
2.3. Simulation
2.3.1. IES Virtual Environment (IESVE) Software
IESVE software was used to simulate the thermal environment. This software supports the dynamic simulation of the thermal environment, energy consumption, and daylighting throughout the year, in line with practical engineering applications. Its calculations offer high accuracy and confidence. Apache is the core of the VE dynamic thermal simulation tool, which considers the energy efficiency or sustainability of buildings from an energy or carbon emissions perspective. RadianceIES is the core of the design simulation considering daylighting or artificial lighting for buildings. Their simulation validity has been extensively demonstrated [64].
2.3.2. Weather Data
Two types of weather files were used in this study. Typical meteorological data were used for revealing and analysing the overheating phenomena, so that the simulation results will be more representative and less susceptible to special or extreme weather years. The typical meteorological data were obtained from the ASHRAE design weather database [65]. Meanwhile, the local meteorological data for 2023 were used in the simulation for calibration and validation against the measured results. The local meteorological data were obtained from The European Centre for Medium-Range Weather Forecasts (ECMWF) Reanalysis v5 (ERA5) [66].
2.3.3. Building Envelope Materials
The envelope settings in the simulation model are shown in Table 3, based on the Design standard for the energy efficiency of public buildings in Heilongjiang Province (DB23/T 2706-2020) [63] and the Energy efficient construction of public buildings—severe cold and cold regions (06J908-1) [67].
Table 3.
Input parameters of building envelope materials for the simulations.
2.3.4. Natural Ventilation
Most university classrooms in severe cold regions rely on natural ventilation for air exchange. In this study, no mechanical ventilation system was installed in the classrooms, and ventilation was regulated mainly by opening windows. The timing of window opening was related to the course schedule and the behavioural habits of the users. During the lengthy heating period, when the outdoor temperature was very low, the windows were opened briefly between classes and at midday. During the transitional season, when it was cooler, the windows were opened when students entered the classrooms. During the summer, the windows remained open during the hours of use, with some windows closed at night. The doors of specialist classrooms appeared to be constantly closed during the period of use.
In this study, the number of air changes was used as an indicator to calculate the amount of ventilation in the room. The current Chinese code does not specify the natural ventilation rate of university buildings, and the Code for the Design of Schools (GB 50099-2011) [68] requires that when the number of air changes is used to determine indoor ventilation, the minimum number of air changes for different types of classrooms ranges from 2.5 h−1 to 4.5 h−1. Among the design parameters provided in the Standard for the Design of Scientific Research Buildings (JGJ91-2019) [59], the air changes per hour for various laboratories range from 1.0 h−1 to 4.0 h−1. The Lancet COVID-19 Commission Task Force on Safe School, Safe Work, and Safe Travel [69] recommends a non-infectious air change rate of 4.0 h−1 for schools as good, 6.0 h−1 as excellent, and greater than 6.0 h−1 as optimal. For reference, in conjunction with other studies [70,71] and standard recommendations, the range of ventilation rates for classroom use in this study was set at 3.0 h−1 to 6.0 h−1, with an infiltration ventilation value of 0.5 h−1. The open-window period, the air changes per hour (ACH) values of natural ventilation, and infiltration are shown in Table 4.
Table 4.
ACH of natural ventilation and infiltration of the simulation building.
2.3.5. Internal Gains
There is no clear distinction between periods of use in university buildings, with students using them during holidays, at weekends and even during summer and winter vacations. In this study, the indicators were set according to the requirements of the Design Standard for the Energy Efficiency of Public Buildings (GB 50189-2015) [58], taking into account the characteristics of the use of university buildings (Table 5). The period of use was defined as 7 am to 7 pm every day, with a total daily occupancy of 12 h. The simulation settings take into account the influence of internal gains, such as indoor equipment, lighting, and person occupancy, on indoor temperature (Table 6).
Table 5.
Internal gains parameter settings.
Table 6.
Lighting switch-on time (%), hour-by-hour usage rate of electrical equipment (%), and hour-by-hour occupancy rate of room occupants (%).
2.3.6. Shading Devices
An integrated shading device usually consists of a horizontal shading panel and two vertical shading panels. In practice, larger and more complex shading devices are rarely used in university buildings, due to cost, visibility, and aesthetic considerations. The main objective of this study was to determine the potential of integrated shading devices to mitigate overheating in classrooms; therefore, the study focused on a simplified setting in which horizontal shading panels and vertical shading panels had the same pick-out width. For a detailed description of the shading devices used in this study see Figure 4. The pick-out width “H” refers to the distance from the outer surface of the window to the end of the integrated shading devices.
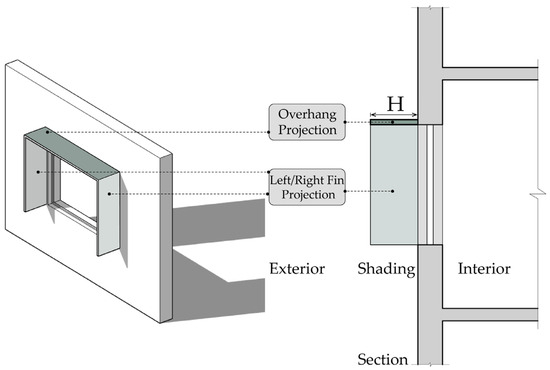
Figure 4.
An illustration of integrated shading devices.
In the IESVE software, the “Overhang projection”, “Left fin projection”, and “Right fin projection” all correspond to H values. The shading devices are only installed in the south-facing classroom windows. Considering the structural properties of the shading devices and daylight [72,73], H was taken to be in the range of 0–1.2 m and simulated in steps of 0.1 m.
2.4. Validation
The indoor temperature of a building is influenced by occupant activities and multiple operating parameters, which are often difficult to precisely match in a simulation model. This leads to errors between the predicted results yielded by the simulation model and the actual measurement of air temperature. The simulation model therefore needs to be checked and calibrated before it can be used for overheating assessment and research into mitigation measures to improve thermal comfort. By adjusting the relevant parameters of the simulated building [74], the model was manually calibrated to minimise the discrepancy between the measured and simulated temperatures and enhance their fit to an acceptable level.
The accuracy and validity of the indoor temperature simulations in this study were assessed using the coefficient of determination (R2) and the root-mean-square error (RMSE). R2 indicates the degree of explanation of dependent variable y by independent variable x and measures the degree of fit of a linear regression model. R2 takes values in the range [0, 1]. The closer R2 is to 1, the better the model fit.
where n represents the number of measured data; yi represents the measured value; represents the simulated value; represents the average measured value.
The RMSE represents the difference between the predicted value of a model and the actual observation value, which is used to measure the prediction accuracy of the model. It takes values in the range . The smaller the RMSE, the better the model’s prediction accuracy.
where n represents the number of measured data; yi represents the measured value; represents the simulated value.
The ambient monitored temperatures in the classroom spaces of the building were collected and correlated with the simulation results for verification. Temperature data for every hour during the use period from 22 April to 30 June in the non-heating season were collected and matched one by one with the simulation results to evaluate and verify the effectiveness of the simulation.
2.5. Overheating Risk Assessment
Based on the characteristics of the use of university buildings, the period of use was defined as 1 May to 30 September, from 07:00 to 19:00 each day, with a total daily occupancy of 12 h. The basic situation did not meet the requirements of the BB101 guidelines for the daily occupancy period of 09:00 to 16:00. As university buildings have no long-term idle period, it is appropriate to use CIBSE TM52 for overheating risk assessment.
Thermal comfort analysis using CIBSE TM52 requires a combination of three criteria to be assessed; buildings that do not meet two or more criteria are judged as overheating.
Criterion 1, hours of exceedance (He): The number of hours (He) during which is greater than or equal to one degree (K) during the period from May to September inclusive shall not be more than 3 per cent of occupied hours. If data are not available for the whole period (or if occupancy is only for a part of the period) then 3 per cent of available hours should be used.
where Top represents the operative temperature and Tmax represents the maximum acceptable temperature.
As recommended by CIBSE [54], the criterion adopts a maximum acceptable temperature (Tmax) of 3 °C above the comfort temperature for buildings in free-running mode.
where Trm represents the exponentially weighted running mean of the daily mean outdoor air temperature.
Criterion 2, daily weighted exceedance (We): to allow for the severity of overheating, the weighted exceedance (We) shall be less than or equal to 6 on any one day where:
where wf represents the weighting factor and he0 represents the time when wf = y.
Criterion 3, upper limit temperature (Tupp): to set an absolute maximum value for the indoor operative temperature, the value of shall not exceed 4 K.
This study also fully respected the current codes of the country and region in which it was conducted. Although Chinese codes do not currently have a unified definition and assessment criteria for overheating phenomena, the upper limits of comfort temperature set by various codes are summarised in Section 1.4. Referring to the peak temperature defined in previous studies [31] and CIBSE Guide A (2006) [53], 28 °C was taken as the static threshold. The number of hours for which the temperature exceeded 28 °C during classroom occupancy time was counted simultaneously and compared with the CIBSE TM52 standard results for reference.
2.6. Daylight Assessment
The classroom daylight environment was evaluated using the Spatial Daylight Autonomy (sDA) metric, which was proposed by the Illuminating Engineering Society of North America (IESNA). sDA is an indicator that describes the annual adequacy of daylight levels in the indoor environment. It reflects the percentage of the analysed area that reaches the minimum illumination level during the specified working hours each year. Based on the IESNA recommended measures, this study used sDA300,50% to assess the amount of daylight entering the classrooms.
According to IES LM-83-12 [75], sDA300,50% that meets or exceeds 55% of the analysis area is acceptable; achieving 75% is considered excellent. sDA300,50% was evaluated in LEED v4.1 EQ Credit: Daylight (Option 1) [76], with 40% scoring 1 point, 55% scoring 2 points, and 75% scoring 3 points.
The IESNA uses 08:00 to 18:00 as the annual operating time for the sDA indicator, i.e., the effective hours when daylight is available. Due to the high latitude of the research area, the analysis period for the sDA300/50% indicator in this study was 07:00–17:00, which was kept constant for 10 h per day, adjusted according to the usage time of the study space and the natural light characteristics of the area.
The simulation was carried out using RadianceIES, the built-in daylight environment simulation tool of the IESVE software package. The simulated space is divided into grids with a spacing of 0.5 m, and points are taken at a height of 0.75 m on the working face for calculation [77]. The reflectance of the surface in the space was set according to the Standard for the Daylighting Design of Buildings (GB 50033-2013) [78]. The specific parameters are shown in Table 7.
Table 7.
Surface reflection ratio of the classrooms.
2.7. Framework
The framework of this study is shown in Figure 5 and mainly consists of five parts: data collection, simulation data settings, simulation performance, measurement and validation.
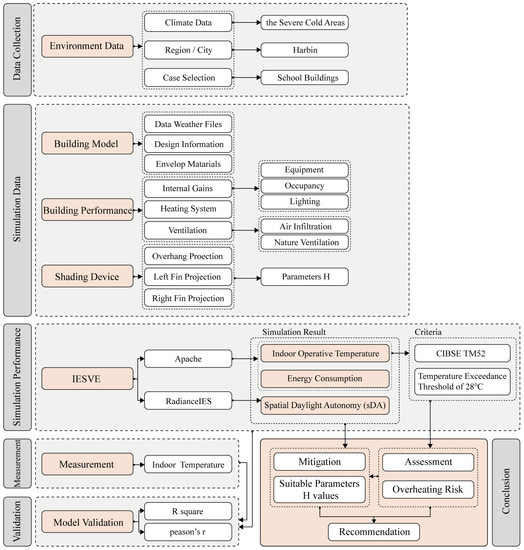
Figure 5.
The framework of study.
3. Results
3.1. Assessment of Overheating Risk
The annual indoor temperature of the university building under natural ventilation conditions was simulated by software. The analysis was carried out using the middle six floors of the building as an example, and the simulation results (Table 8) demonstrated the overheating situation of all the rooms on that floor between May and September.
Table 8.
Classroom overheating simulation results.
According to CIBSE Guide A [53], schools and office buildings must not exceed 28 °C for more than 1% of the hours of occupancy in summer. All the classrooms facing south and north in the study can be judged as overheating. According to the three criteria of CIBSE TM52 [54], all nine south-facing rooms remained overheated, north-facing rooms 609, 611, 613, and 615 no longer violated the overheating criteria, and the remaining five rooms were judged to be overheated.
Rooms 603 and 606 presented significant overheating duration, which was caused by their greater window-to-wall ratio, larger interior area, and special use that distinguished them from the other rooms. Therefore, the results are not representative of this study and will not be analysed further. In addition to the rooms mentioned above, the average overheating duration for the south-facing rooms was 145 h and 61 h for the north-facing rooms. The duration of overheating in the south-facing rooms was about 2.4 times longer than that in the north-facing ones. The risk of overheating cannot be ignored even in north-facing classrooms.
Room 616 was one of the rooms with the highest overheating hours in the south direction, at 152 h, accounting for 8.3% of the use time. Room 619 has the highest duration of overheating in the north direction, lasting for 106 h, accounting for 5.8% of the use time. Both rooms violated criterion 1 and criterion 2 and were identified as overheating. The temperature operation curves of the two classrooms from May to September are shown in Figure 6. Therefore, in the subsequent study, south-facing room 616 was selected as a representative room to further analyse the potential of shading mitigation measures.
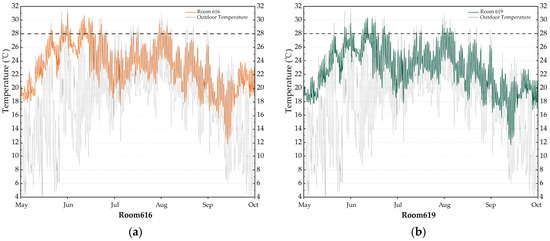
Figure 6.
The operation curve of outdoor and indoor temperature: (a) Room 616; (b) Room 619; May–September.
Correlation tests between the measured and simulated data were conducted to verify the validity of the simulations. The measured temperature data of the two classrooms were fitted separately to the simulated temperature data at 07:00–19:00 hourly from 22 April to 30 June 2023 in the daily usage period. The regression relationship between the two sets of data is shown in Figure 7.
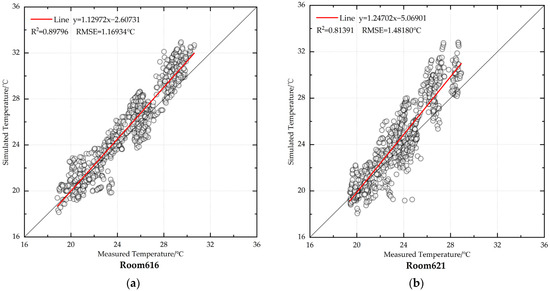
Figure 7.
Correlation test results: (a) Room 616; (b) Room 621.
For south-facing room 616, R2 = 0.89796, RMSE = 1.16934 °C; for north-facing room 621, R2 = 0.81391, RMSE = 1.48180 °C. The R2 values for both the north- and south-facing classrooms were greater than 0.8, and the RMSE values were small, indicating that the simulation data were well-fitted to the measured data and that the simulation was effective. The simulation model can be used to assess the risk of overheating and test the subsequent mitigation measures.
During the calibration and validation process, manual calibration was carried out for the transition season and summer in the non-heating period by adjusting the ventilation parameter settings, as shown in Figure 8. The transition season was calibrated by adjusting the natural ventilation periods using the May temperature data as an example. The summer season was calibrated by adjusting the ACH value within a reasonable range using the June data as an example.
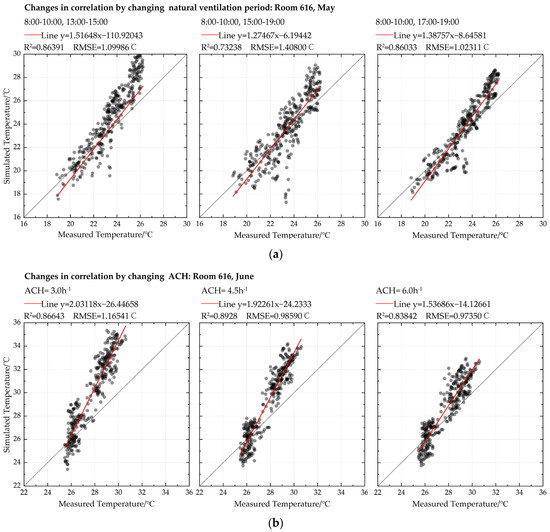
Figure 8.
Correlation results of changing ventilation parameters in calibration: (a) transition season; (b) summer.
When adjusting the natural ventilation periods, the minimum RMSE was 1.02311 °C, at which point R2 was 0.86033. The fitting situation was relatively good. The final application window-opening period was from 8:00 to 10:00, and from 17:00 to 19:00 for ventilation. When the natural ventilation ACH changed from 3.0 h−1 to 6.0 h−1, the overall fitting situation became better. The RMSE decreased from 1.16541 °C to 0.97350 °C. R2 fluctuated but was within an acceptable range. The final ACH value for the summer use time was determined to be 6 h−1. The final application of natural ventilation parameter settings are detailed in Table 4. The calibration reduced the difference between measured and simulated temperatures and improved the model fit to an acceptable level.
3.2. Integrated Shading Device Performance
In this paper, the H values of the integrated shading devices were studied in the range of 0–1.2 m, and the indoor overheating duration was calculated in increments of 0.1 m. The figures were compared with the initial environment without shading devices to analyse the ability of integrated shading devices to mitigate overheating in university buildings. Shading devices are only used in south-facing rooms, taking room 616 as an example. The results of the simulations of Room 616 with different shading lengths are shown in Table 9.
Table 9.
Assessment of classroom overheating for different values of H.
As the H value increased, the number of overheating hours decreased. At H = 1.2 m, the number of hours above 28 °C in the south-facing classroom decreased by 60% to approximately 132 h; CIBSE TM52 criterion 1 shows a 59.2% reduction in the number of hours overheated, reaching approximately 90 h. The decrease in overheating hours is significant. CIBSE TM52 criterion 2 shows that the number of degree hours exceeding the selected temperature threshold decreased from 24 to 10.
The overheating duration curve with H values is shown in Figure 9. The adaptive standard shows a uniform and gentle trend compared with the static threshold standard. The static threshold criterion showed a significant contraction in the reduction in overheating time when H exceeded 0.8 m. When H exceeded 1.1 m, the static threshold criterion showed that the overheating duration no longer decreased with increasing shade pick length; the dynamic adaptive criterion showed that the reduction in overheating duration was minimal, indicating that the overheating duration had largely stabilised.
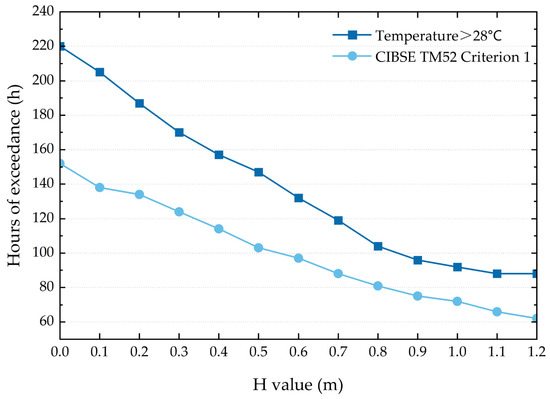
Figure 9.
Variation in overheating duration with H values.
The appropriate application of integrated shading devices has good potential to mitigate the risk of overheating in university buildings in severe cold regions. However, whether judged by the adaptive criteria or the static temperature thresholds, the application of shading devices in a single room had limited effect in this study and the room continued to be judged as overheating based on these criteria.
3.3. The Impact of Integrated Shading Devices on the Daylight Environment and Energy Consumption
Although shading devices can improve the indoor thermal comfort of classrooms in summer, their use also blocks the entry of solar radiation, affects the daylight environment, and increases heating energy consumption. Attention must be paid to the impact on the classroom daylight environment and winter heating energy consumption.
The year-round daylight environment of the classroom was evaluated according to the dynamic evaluation criterion, using sDA300/50% as an indicator. The results of the initial daylight environment simulation for south-facing room 616 are shown in Figure 10. A total of 111 of the 196 simulated sites met the criterion during the classroom’s year-round occupancy period, with sDA300/50% = 56.63%, exceeding 55% and meeting the IES LM-83-12 standard for an acceptable indoor daylight environment.
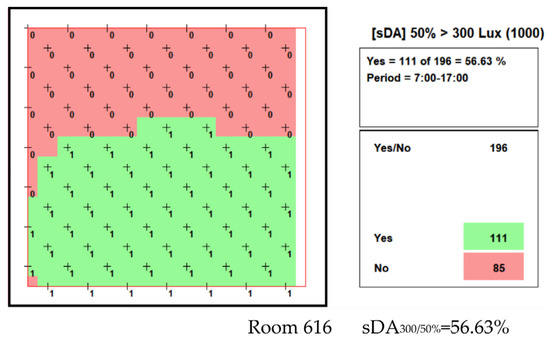
Figure 10.
Initial daylight environment sDA300/50% distribution.
The variation in sDA300/50% with different H values is shown in Table 10 and Figure 11. sDA300/50% = 55.61% when H = 0.3 m and sDA300/50% = 54.59% when H = 0.4 m, at which point the sDA300/50% value was already less than 55% and no longer met the acceptable standard in IES LM-83-12 [75]. sDA300/50% drops more when the H value changes from 0.5 m to 0.7 m, and when H < 0.7 m, less than half of the area in the classroom meets the requirement. The distribution of sDA300/50% at different H values is shown in Figure 12. When H = 1.2 m, sDA300/50% = 46.43%, and according to the LEED v4.1 EQ Credit [76] score, sDA300/50% was always greater than 40%, within the simulated H range of this study, and still earned a rating of 1 point. For simulated buildings where shading devices are needed to minimise the impact of sunlight on the interior, H should be kept below 0.6 m, with 0.3 m or less being optimal.
Table 10.
The values of sDA300/50% corresponding to different H values.
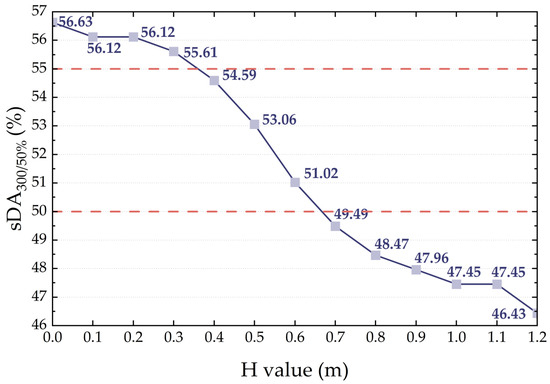
Figure 11.
Variation in sDA300/50% with different H values.
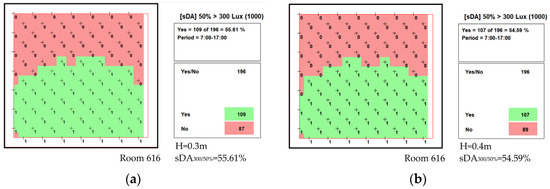
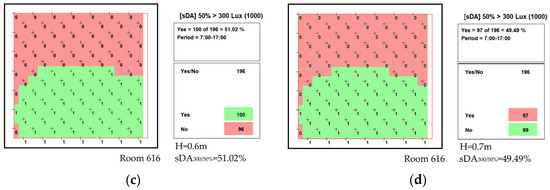
Figure 12.
Simulation of sDA300/50% at different H values at (a) 0.3 m; (b) 0.4 m; (c) 0.6 m; (d) 0.7 m.
The annual energy consumption after adopting integrated shading devices was simulated, and the results are shown in Table 11. The annual energy consumption of the south-facing classroom without the integrated shading intervention was 134.92 kWh/m2. The annual energy consumption increased gradually with H. The maximum annual energy consumption was 143.852 kWh/m2 at H = 1.2 m, an increase of approximately 6.6% from the initial value. At H = 0.6 m, the annual energy consumption was 140.063 kWh/m2, an increase of approximately 3.8% compared with the initial value. The increase in annual energy consumption tended to slow down as the H value increased (Figure 13).
Table 11.
Application of annual energy consumption changes for different H values (Room 616).
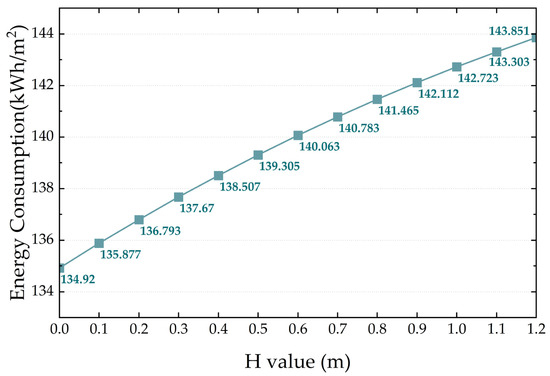
Figure 13.
Annual energy consumption variation with H values.
4. Discussion
This study investigated the risk of overheating in university buildings in the severe cold regions of China, focusing on a university building in Harbin, which is a representative city in a severe cold region of China. Through simulations and measurements, this study is the first to provide evidence of overheating in educational buildings in severe cold regions, using a university building as an example. This study proposed to mitigate overheating by integrated shading devices. It further discussed the potential of integrated shading devices to alleviate overheating, as well as the impact of applying shading devices on the indoor daylight environment and annual energy consumption.
4.1. Overheating Risk in University Buildings
The north- and south-facing classrooms in the focal university building were judged as overheating. According to the simulation results, from May to September, there were 20 h when the indoor temperature in south-facing room 616 exceeded 30 °C, 51 h when it exceeded 29 °C, and 149 h when it exceeded 28 °C. The north-facing classroom showed a similar trend but with relatively low levels of superheating. There were 11 h when the indoor temperature in north-facing room 619, which is the most severely overheated of the north-facing rooms, exceeded 30 °C, 46 h when it exceeded 29 °C, and 105 h when it exceeded 28 °C. The number of hours in each temperature degree band and charts of the rooms’ temperature colour gradients are shown in Figure 14 and Figure 15.
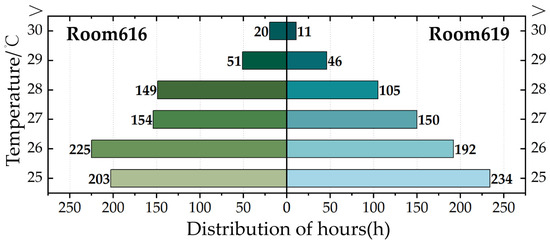
Figure 14.
The number of hours in each temperature degree band.
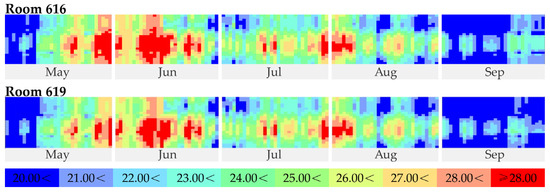
Figure 15.
Chart of the rooms’ temperature colour gradient, May–September.
Compared to educational buildings in other regions at similar latitudes, the results of this article show that the degree of overheating in classrooms is similar to that in Montreal, Canada [19], but significantly lower than those in the UK [20,21]. This mainly depends on the differences in climate, which is the primary factor affecting indoor overheating in buildings. The climate in the severe cold regions of China is similar to that of southern Canada, but significantly different from that of Europe.
There are no studies on the overheating risk of educational buildings in the severe cold regions of China for comparative reference. However, there have been a few studies on residential buildings in the same region. Compared to residential buildings [26], the percentage of overheating hours in classrooms is higher than that in bedrooms and south-facing living rooms. The reasons are speculated to be twofold. The external insulation layer of public buildings in severe cold regions is generally thick [79]; its thickness can reach 240 mm when considering the requirements of building standards for cold resistance design, which may affect indoor heat dissipation in summer. Due to the large amount of equipment such as computers and experimental apparatus often present in university buildings, their heat gain is higher, making them more prone to overheating [18]. The comparison with residential buildings reflects the differences in the behaviour of overheating risk in different building types, which warrants attention.
In contrast to studies that only assess overheating in specific rooms, this study evaluated and tested all rooms in the entire building. An assessment of a specific room helps to recognise the extent of overheating, whereas an assessment of all rooms gives a clearer picture of the risk of overheating in the building. The CIBSE TM52 criteria were applied to determine the overheating of all functional rooms in the entire building. The building has a total of 162 functional spaces, of which 49 passed the standard and 113 were identified as overheating. Out of the 81 rooms facing south, 76 were identified as overheating, accounting for 94%. Out of the 81 rooms facing north, 40 were identified as overheating, accounting for 49%. Although the degree of overheating in the rooms is not very severe, nearly 70% of the rooms in the building have a certain degree of overheating, and the risk of overheating cannot be ignored. In summary, university buildings in severe cold regions require certain intervention measures in summer to create a comfortable thermal environment.
Furthermore, compared with the adaptive standard, the static threshold standard recognises a significantly longer duration of overheating and a larger number of overheated rooms. This is consistent with the research conclusions of Johanna Morey et al. [80], who studied 122 social housing units in England. Under the static threshold standard, overheating was significant, but few rooms violated the adaptive standard. Fuad Mutasim Baba et al. [17] also showed in their survey of schools that the adaptive standard is more accurate than the old static threshold overheating standard in terms of students’ thermal sensation. This article also explains the differences between static and adaptive methods. The static threshold standard enables users to intuitively sense the level of risk of indoor overheating, while the dynamic adaptive evaluation standard has higher accuracy. Therefore, the discussion on the performance of shading devices in this article will use adaptive standard criteria as a reference.
4.2. The Effect of Integrated Shading Devices on the Indoor Environment
Integrated shading devices have great potential to alleviate the risk of overheating. This study found that after applying shading devices, the solar gain in summer was significantly reduced (the numerical changes are shown in Table 12). When the maximum value of H was 1.2 m, the overheating time was reduced by 59.2%, and this effect was significant. This result is consistent with the conclusions of similar studies that external shading devices have a prominent effect on alleviating thermal discomfort [81]. Compared with previous studies in the region [24], the results of this study seem to emphasise the superiority of integrated shading devices over single shading devices in mitigating overheating. There may be two reasons why this study yielded a greater reduction in overheating duration. The first reason relates to the orientation of the simulated building [82]: the building façade is oriented 60° east of south and is influenced by solar radiation from both the east and south directions, which makes the application of shading devices more effective in blocking solar radiation. Second, integrated shading devices, which combine horizontal and vertical shading, are more effective in blocking direct sunlight than a single shading device. This echoes the Chinese standard [58] recommending the application of integrated shading devices for windows in the south-east and south-west of China, and De Luca, F. et al. [83], recommending a combination of horizontal and vertical shading systems for rooms on the east side of a building.
Table 12.
Variation in solar gain with H values.
As the H value increased, solar gain tended to decrease both in summer and in the heating season, and the rate of decline slowed down (Figure 16). The decrease in solar gain in winter led to an increase in heating energy consumption in winter, and this trend was consistent with the change in annual energy consumption with the H values reported in Section 3.3. The decline in solar gain was more moderate in the heating season than in the summer, and the application of shading devices played a greater role in the reduction in solar radiation in the summer than in the heating season.
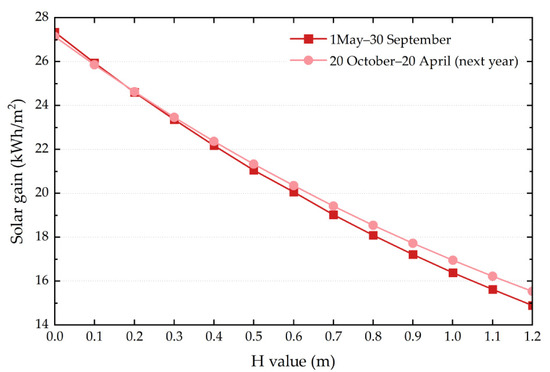
Figure 16.
Solar gain variation with H values.
Integrated shading devices also had a significant impact on the indoor daylight environment, especially after H exceeded 0.5 m. Systematic design efforts are required to determine the parameters before application. It has been suggested that the application of shading devices to mitigate overheating can have an impact on the daylight environment and winter energy consumption [84]. These research findings seem to respond to this concern. Evaluating the impact through a rational simulation design and selecting appropriate parameters for shading devices can effectively improve indoor thermal comfort while maintaining daylight levels and controlling the increase in energy consumption. The methodology adopted can be used to guide the selection of integrated shading device parameters for different buildings and has practical significance.
4.3. Recommended Parameters for Integrated Shading Device Design
The impact of integrated shading devices on the indoor environment was taken into account and appropriate parameters were selected to balance the benefits of both thermal comfort and daylight according to the adaptive criteria. Detailed information on the three sets of optimal parameters, H = 0.1 m, 0.5 m, and 0.7 m, is shown in Table 13. When H = 0.1 m, the ratio of the decrease in overheating duration to the increase in annual energy consumption was the largest, due to the minimum increase in annual energy consumption. However, the actual overheating duration only decreased by 14 h, a decrease of 9%. The annual energy consumption increased by 0.7%, at which point sDA300/50% = 56.12%. When H = 0.5 m, the overheating duration decreased by 49 h and 32%, and the annual energy consumption increased by 3.2%, at which point sDA300/50% = 53.06%. When H = 0.7 m, the overheating duration decreased by 64 h and 42%, while the energy consumption increased by 4.3%, and at this point, sDA300/50% = 49.49%. Based on these results, the shading devices had a significant impact on the indoor daylight environment.
Table 13.
Comparison of various elements at H = 0.1 m, 0.5 m, and 0.7 m.
The efficacy of applying shading devices to a single room was limited. When applying integrated shading devices to all south-facing classrooms in the building, the evaluation results based on CIBSE TM52 showed that in the 216 main functional spaces, when H = 0.1 m, the number of rooms passing the standard increased from 94 to 98; when H = 0.5 m, 150 rooms passed the standard; and when H = 0.7 m, 171 rooms passed the standard. Although the sunlight environment and energy consumption in the classroom were optimal at H = 0.1 m, shading devices played a minimal role in mitigating overheating and had a weak impact on the indoor thermal environment. When H = 0.7 m, there was a significant negative impact on the classroom daylight environment, and the sDA300/50% value dropped by 50%, demanding more artificial lighting compensation. In summary, for the simulated building, the recommended H value is 0.5 m.
4.4. Limitations and Outlook
The major limitation of this study is the size of the sample. This work is based on a real case building, and the same method can be applied to different types of buildings. Indeed, different buildings have different positions, orientations, and window sizes, all of which can affect the indoor overheating situation. Therefore, more university buildings need to be analysed to extract representative building models for more extensive evaluation conclusions.
Integrated shading devices come in a variety of forms. This paper simplifies the setting of integrated shading devices when assessing the potential to mitigate overheating. In fact, different combinations of parameters will affect the performance of integrated shading devices. In addition, this study did not consider technical application issues, such as the impact of winter snow load on fixed external shading devices. Consideration could be given to quantifying the effects of different parameters of integrated shading devices on the indoor thermal and daylight environment, and to providing more practical and flexible guidance for shading applications.
Future work will expand the sample size and conduct long-term monitoring of different university buildings. Furthermore, the overheating risk in the past years will be traced back and predicted for future years, thus providing a systematic and comprehensive assessment of overheating in university buildings in the severe cold regions of China.
5. Conclusions
The risk of summer overheating at high latitudes due to climate warming cannot be ignored, and this paper provides evidence of overheating in a university building in the severe cold regions of China. The potential of integrated shading devices to mitigate overheating and the impact of applying shading devices on the indoor environment and energy consumption are discussed through software simulations of selected real-life cases. The main findings are as follows:
- Overheating does occur in summer in university buildings in the severe cold regions of China, as determined by the static threshold criteria and CIBSE TM52 criteria, and as measured in a representative university building in Harbin. Overheating can occur in a south-facing classroom for up to 152 h and in a north-facing classroom for up to 80 h during summer use, with 69% of the functional rooms in the building not meeting the CIBSE TM52 overheating standards. The risk of overheating cannot be ignored, and regional standards may need to be improved.
- The static threshold criteria determine a higher overheating duration and degree than the adaptive criteria. The static threshold determines 220 h of overheating, compared with 152 h for the adaptive standard, which is more accurate in monitoring overheating than the static threshold standard.
- Integrated shading devices show good potential to mitigate overheating. By applying integrated shading devices, overheating in naturally ventilated classrooms can be reduced by up to 90 h, a reduction of approximately 59.2%. The overheating time decreases as the H value increases, and largely stabilises when H exceeds 1.1 m.
- A reasonable integrated shading design can effectively improve indoor thermal comfort while maintaining daylight levels and controlling the increase in energy consumption. This paper balances the three elements of overheating duration, daylight environment, and energy consumption to propose recommended integrated shading parameters, with a recommended H value of 0.5 m. The research ideas can provide a reference for the design of integrated shading devices for other university buildings.
Author Contributions
Conceptualization, Y.L. and S.Q.; methodology, S.Q.; software, S.Q.; validation, G.Y.; formal analysis, R.L.; investigation, R.L.; resources, Y.L.; data curation, G.Y.; writing—original draft preparation, S.Q.; writing—review and editing, S.Q.; visualization, S.Q.; supervision, Y.L.; project administration, Y.L.; funding acquisition, Y.L. All authors have read and agreed to the published version of the manuscript.
Funding
This research was funded by the National Natural Science Foundation of China, grant number 52238002.
Data Availability Statement
Not applicable.
Conflicts of Interest
The authors declare no conflict of interest.
References
- NASA Says 2022 Fifth Warmest Year on Record, Warming Trend Continues|NASA. Available online: https://www.nasa.gov/press-release/nasa-says-2022-fifth-warmest-year-on-record-warming-trend-continues (accessed on 10 June 2023).
- CMA Climate Change Centre. Blue Book on Climate Chage in China 2022; Science Press: Beijing, China, 2022. [Google Scholar]
- Editorial Committee of the Third China’s National Assessment Report on Climate Change. The Third China’s National Assessment Report on Climate Change; Science Press: Beijing, China, 2015. [Google Scholar]
- Reveshti, A.M.; Ebrahimpour, A.; Razmara, J.; Geving, S. Investigating the effect of new and old weather data on the energy consumption of buildings affected by global warming in different climates. Int. J. Thermofluids 2023, 19, 100377. [Google Scholar]
- Fan, J.L.; Hu, J.W.; Zhang, X. Impacts of climate change on electricity demand in China: An empirical estimation based on panel data. Energy 2019, 170, 880–888. [Google Scholar]
- Bartholy, J.; Pongrácz, R. A brief review of health-related issues occurring in urban areas related to global warming of 1.5 °C. Curr. Opin. Environ. Sustain. 2018, 30, 123–132. [Google Scholar]
- Deng, S.; Han, A.; Jin, S.; Wang, S.; Zheng, J.; Jalaludin, B.B.; Hajat, S.; Liang, W.; Huang, C. Effect of extreme temperatures on asthma hospital visits: Modification by event characteristics and healthy behaviors. Environ. Res. 2023, 226, 115679. [Google Scholar] [PubMed]
- Akimoto, T.; Tanabe, S.I.; Yanai, T.; Sasaki, M. Thermal comfort and productivity- Evaluation of workplace environment in a task conditioned office. Build. Environ. 2010, 45, 45–50. [Google Scholar]
- Zhang, F.; de Dear, R. University students’ cognitive performance under temperature cycles induced by direct load control events. Indoor Air 2017, 27, 78–93. [Google Scholar]
- Touchie, M.; Tzekova, E.; Siegel, J.; Purcell, B.; Morier, J. Evaluate Summertime Overheating in Multi-Unit Residential Buildings Using Surveys and In-Suite Monitoring. In Proceedings of the Thermal Performance of the Exterior Envelopes of Whole Buildings XIII International Conference, Clearwater, FL, USA, 4–8 December 2016. [Google Scholar]
- Sehizadeh, A.; Ge, H. Impact of Future Climate Change on the Overheating of Canadian Housing Retrofitted to the PassiveHaus Standard: A case study. In Proceedings of the eSim, Ottawa, ON, Canada, 7–10 May 2014. [Google Scholar]
- Bertug, O.; Heba, E. Assessing overheating risk and thermal comfort in state-of-the-art prototype houses that combat exacerbated climate change in UK. Energy Build. 2019, 187, 201–217. [Google Scholar]
- Beizaee, A.; Lomas, K.J.; Firth, S.K. National survey of summertime temperatures and overheating risk in English homes. Build. Environ. 2013, 65, 1–17. [Google Scholar]
- Morgan, C.; Foster, J.A.; Poston, A.; Sharpe, T.R. Overheating in Scotland: Contributing factors in occupied homes. Build. Res. Inf. 2017, 45, 143–156. [Google Scholar]
- Bugenings, L.A.; Kamari, A. Overheating in existing and renovated Danish single -and multi-family houses. J. Build. Eng. 2022, 57, 104835. [Google Scholar]
- For the First Time Ever, Dozens of B.C. Schools Had to Close Due to Extreme Heat Wave|Globalnews.ca. Available online: https://globalnews.ca/news/7987756/first-time-ever-bc-schools-closeextreme-heat/ (accessed on 10 June 2023).
- Baba, F.M.; Ge, H.; Wang, L.; Zmeureanu, R. Assessing and mitigating overheating risk in existing Canadian school buildings under extreme current and future climates. Energy Build. 2023, 279, 112710. [Google Scholar]
- Mohamed, S.; Rodrigues, L.; Omer, S.; Calautit, J. Overheating and indoor air quality in primary schools in the UK. Energy Build. 2021, 250, 111291. [Google Scholar]
- Camacho-Montano, S.C.; Cook, M.; Wagner, A. Avoiding overheating in existing school buildings through optimized passive measures. Build. Res. Inf. 2020, 48, 349–363. [Google Scholar]
- Su, X. Research on Occupants’ Window Opening Behaviour and Thermal Comfort of Passive Dewelling in the Severe Cold Region. Master’s Thesis, Harbin Institute of Technology, Harbin, China, 2018. [Google Scholar]
- Liu, Y.; Zhou, S.; Yan, H.; Zou, M.; Gao, L. Field research of indoor thermal comfort in summer for residential buildings in Baotou. J. Xi’an Univ. Archit. Technol. 2012, 44, 369–375. [Google Scholar]
- Xu, Y.; Bo, R.; Chang, W.S.; Guo, H.; Shao, Y. The Use of Horizontal Shading Devices to Alleviate Overheating in Residential Buildings in the Severe Cold Region and Cold Region of China. Buildings 2022, 12, 408. [Google Scholar]
- Bo, R.; Chang, W.S.; Yu, Y.; Xu, Y.; Guo, H. Overheating of residential buildings in the severe cold and cold regions of China: The gap between building policy and performance. Build. Environ. 2022, 225, 109601. [Google Scholar]
- Yu, Y.; Shao, Y.; Zhao, B.; Yu, J.; Guo, H.; Chen, Y. Study on Summer Overheating of Residential Buildings in the Severe Cold Region of China in View of Climate Change. Buildings 2023, 13, 244. [Google Scholar]
- Burman, E.; Mumovic, D. The impact of ventilation strategy on overheating resilience and energy performance of schools against climate change: The evidence from two UK secondary schools. In Proceedings of the 7th International Building Physics Conference, Syracuse, NY, USA, 23–26 September 2018. [Google Scholar]
- Lv, X.; Jin, H.; Xi, T. Analysis and lmprovement of Thermal Comfort of Teaching Space in Severe Cold Region in Summer. Archit. Cult. 2021, 3, 208–209. [Google Scholar]
- Jain, N.; Burman, E.; Robertson, C.; Stamp, S.; Shrubsole, C.; Aletta, F.; Barrett, E.; Oberman, T.; Kang, J.; Raynham, P.; et al. Building performance evaluation: Balancing energy and indoor environmental quality in a UK school building. Build. Serv. Eng. Res. Technol. 2018, 41, 343–360. [Google Scholar]
- Guo, H.; Huang, L.; Song, W.; Wang, X.; Wang, H.; Zhao, X. Evaluation of the summer overheating phenomenon in reinforced concrete and cross laminated timber residential buildings in the cold and severe cold regions of China. Energies 2020, 13, 6305. [Google Scholar]
- Sun, H.; Calautit, J.K.; Jimenez-Bescos, C. Examining the regulating impact of thermal mass on overheating, and the role of night ventilation, within different climates and future scenarios across China. Clean. Eng. Technol. 2022, 9, 100534. [Google Scholar]
- Roberts, B.M.; Beizaee, A.; Onyenokporo, N.; Oyinlola, M. Upcycled construction materials to reduce dwelling overheating in tropical climates: The bottle house. Build. Environ. 2023, 234, 110183. [Google Scholar]
- Jimenez-Bescos, C. An evaluation on the effect of night ventilation on thermal mass to reduce overheating in future climate scenarios. Energy Procedia 2017, 122, 1045–1050. [Google Scholar]
- Baba, F.M.; Ge, H.; Wang, L.; Zmeureanu, R. Do high energy-efficient buildings increase overheating risk in cold climates? Causes and mitigation measures required under recent and future climates. Build. Environ. 2022, 219, 109230. [Google Scholar]
- Gupta, R.; Howard, A.; Davies, M.; Mavrogianni, A.; Tsoulou, I.; Jain, N.; Oikonomou, E.; Wilkinson, P. Monitoring and modelling the risk of summertime overheating and passive solutions to avoid active cooling in London care homes. Energy Build. 2021, 252, 111418. [Google Scholar]
- Valladares-Rendón, L.G.; Schmid, G.; Lo, S.L. Review on energy savings by solar control techniques and optimal building orientation for the strategic placement of façade shading systems. Energy Build. 2017, 140, 458–479. [Google Scholar]
- Grynning, S.; Gustavsen, A.; Time, B.; Jelle, B.P. Windows in the buildings of tomorrow: Energy losers or energy gainers? Energy Build. 2013, 61, 185–192. [Google Scholar]
- Koç, S.G.; Kalfa, S.M. The effects of shading devices on office building energy performance in Mediterranean climate regions. J. Build. Eng. 2021, 44, 102653. [Google Scholar]
- Krstić-Furundžić, A.; Vujošević, M.; Petrovski, A. Energy and environmental performance of the office building facade scenarios. Energy 2019, 183, 437–447. [Google Scholar]
- Kirimtat, A.; Koyunbaba, B.K.; Chatzikonstantinou, I.; Sariyildiz, S. Review of simulation modeling for shading devices in buildings. Renew. Sustain. Energy Rev. 2016, 53, 23–49. [Google Scholar]
- Zhang, Y.; Barrett, P. Factors influencing occupants’ blind-control behaviour in a naturally ventilated office building. Build. Environ. 2012, 54, 137–147. [Google Scholar] [CrossRef]
- Wang, Y.; Yang, W.; Wang, Q. Multi-objective parametric optimization of the composite external shading for the classroom based on lighting, energy consumption, and visual comfort. Energy Build. 2022, 275, 112441. [Google Scholar] [CrossRef]
- Calama-González, C.M.; Suárez, R.; León-Rodríguez, Á.L. Thermal and Lighting Consumption Savings in Classrooms Retrofitted with Shading Devices in a Hot Climate. Energies 2018, 11, 2790. [Google Scholar] [CrossRef]
- Arifin, N.A.; Denan, Z. An Analysis of Indoor Air Temperature and Relative Humidity in Office Room with Various External Shading Devices in Malaysia. Procedia-Social. Behav. Sci. 2015, 179, 290–296. [Google Scholar] [CrossRef]
- Al-Tamimi, N.; Fadzil, S.F. The Potential of Shading Devices for Temperature Reduction in High-Rise Residential Buildings in the Tropics. Procedia Eng. 2011, 21, 273–282. [Google Scholar] [CrossRef]
- Cho, J.; Yoo, C.; Kim, Y. Viability of exterior shading devices for high-rise residential buildings: Case study for cooling energy saving and economic feasibility analysis. Energy Build. 2014, 82, 771–785. [Google Scholar] [CrossRef]
- Figueroa-Lopez, A.; Arias, A.; Oregi, X.; Rodríguez, I. Evaluation of passive strategies, natural ventilation and shading systems, to reduce overheating risk in a passive house tower in the north of Spain during the warm season. J. Build. Eng. 2021, 43, 102607. [Google Scholar] [CrossRef]
- Heidari, A.; Taghipour, M.; Yarmahmoodi, Z. The Effect of Fixed External Shading Devices on Daylighting and Thermal Comfort in Residential Building. J. Daylight. 2021, 8, 165–180. [Google Scholar] [CrossRef]
- Sghiouri, H.; Mezrhab, A.; Karkri, M.; Naji, H. Shading devices optimization to enhance thermal comfort and energy performance of a residential building in Morocco. J. Build. Eng. 2018, 18, 292–302. [Google Scholar] [CrossRef]
- ISO 7730; Ergonomics of the Thermal Environment—Analytical Determination and Interpretation of Thermal Comfort Using Calculation of the PMV and PPD Indices and Local Thermal Comfort Criteria. International Organization for Standardization (ISO): Geneva, Switzerland, 2005.
- EN 15251; Indoor Environmental Input Parameters for Design and Assessment of Energy Performance of Buildings Addressing Indoor Air Quality, Thermal Environment, Lighting and Acoustics. The European Committee for Standardization: Brussels, Belgium, 2007.
- EN 16798; Energy Performance of Buildings. Ventilation for Buildings. The European Committee for Standardization: Brussels, Belgium, 2018.
- ANSI/ASHRAE 55–2017; Thermal Environmental Conditions for Human Occupancy. American Society of Heating Refrigerating and Air Conditioning Engineers: Atlanta, GA, USA, 2017.
- ANSI/ASHRAE 55–2020; Thermal Environmental Conditions for Human Occupancy. American Society of Heating Refrigerating and Air Conditioning Engineers: Atlanta, GA, USA, 2021.
- CIBSE. Guide A: Environmental Design; The Chartered Institution of Building Services Engineers: London, UK, 2006. [Google Scholar]
- CIBSE TM52. The Limits of Thermal Comfort: Avoiding Overheating in European Buildings; The Chartered Institution of Building Services Engineers: London, UK, 2013. [Google Scholar]
- CIBSE TM59. Design Methodology for the Assessment of Overheating Risk in Homes; The Chartered Institute of Building Service Engineers: London, UK, 2017. [Google Scholar]
- BB101. Building Bulletin 101: Guidelines on Ventilation, Thermal Comfort and Indoor Air Quality in Schools; Education and Skills Funding Agency: London, UK, 2018. [Google Scholar]
- GB 50176–2016; Code for Thermal Design of Civil Building. Ministry of Housing and Urban-Rural Development of the People’s Republic of China: Beijing, China, 2016.
- GB 50189–2015; Design Standard for Energy Efficiency of Public Buildings. Ministry of Housing and Urban-Rural Development of the People’s Republic of China: Beijing, China, 2015.
- JGJ 91–2019; Standard for Design of Scientific Research Buildings. Ministry of Housing and Urban-Rural Development of the People’s Republic of China: Beijing, China, 2019.
- DB21/T1899–2011; Design Standard for (65%) Energy Saving of Public Buildings. Liaoning Department of Housing and Urban-Rural Development: Shenyang, China, 2011.
- DB23/T2706–2020; Design Standard for Energy Efficiency of Public Buildings in Heilongjiang Province. Heilongjiang Department of Housing and Urban-Rural Development: Harbin, China, 2020.
- GB 50736–2012; Design Code for Heating Ventilation and Air Conditioning of Civil Buildings. Ministry of Housing and Urban-Rural Development of the People’s Republic of China: Beijing, China, 2012.
- GB/T 18883–2022; Standards for Indoor Air Quality. The State Administration for Market Regulation: Beijing, China, 2022.
- IES Virtual Environment. Available online: https://www.iesve.com/software/virtual-environment (accessed on 10 June 2023).
- American Society of Heating and Air-Conditioning Engineers. Available online: https://www.ashrae.org (accessed on 6 April 2023).
- Hersbach, H.; Bell, B.; Berrisford, P.; Biavati, G.; Horányi, A.; Muñoz Sabater, J.; Nicolas, J.; Peubey, C.; Radu, R.; Rozum, I.; et al. ERA5 Hourly Data on Single Levels from 1940 to Present. Copernicus Climate Change Service (C3S) Climate Data Store (CDS) 2023. Available online: https://cds.climate.copernicus.eu/cdsapp#!/dataset/reanalysis-era5-single-levels?tab=overview (accessed on 10 July 2023).
- 06J908–1; Energy-Efficient Construction of Public Buildings-Severe Cold and Cold Regions. Ministry of Housing and Urban-Rural Development of the People’s Republic of China: Beijing, China, 2006.
- GB 50099–2011; Code for Design of School. Ministry of Housing and Urban-Rural Development of the People’s Republic of China: Beijing, China, 2011.
- Proposed Non-Infectious Air Delivery Rates (NADR) for Reducing Exposure to Airborne Respiratory Infectious Diseases. The Lancet COVID-19 Commission Task Force on Safe Work, Safe School, and Safe Travel. Available online: https://covid19commission.org/commpub/lancet-covid-commission-tf-report-nov-2022 (accessed on 15 June 2023).
- Korsavi, S.S.; Montazami, A.; Mumovic, D. Ventilation rates in naturally ventilated primary schools in the UK; Contextual, Occupant and Building-related (COB) factors. Build. Environ. 2020, 181, 107061. [Google Scholar] [CrossRef]
- Abhijith, K.V.; Kukadia, V.; Kumar, P. Investigation of air pollution mitigation measures, ventilation, and indoor air quality at three schools in London. Atmos. Environ. 2022, 289, 119303. [Google Scholar] [CrossRef]
- Dagher, S.; Akhozheya, B.; Slimani, H. Energy analysis studying the effect of solar shading on daylight factors and cooling hours in an extreme weather. Energy Rep. 2022, 8, 443–448. [Google Scholar] [CrossRef]
- Jenkins, D.P.; Peacock, A.D.; Banfill, P.F.G. Will future low-carbon schools in the UK have an overheating problem? Build. Environ. 2009, 44, 490–501. [Google Scholar] [CrossRef]
- Yu, J.; Dong, Y.; Zhao, Y.; Yu, Y.; Chen, Y.; Guo, H. Using phase change materials to alleviate overheating phenomenon of residential buildings in severe cold and cold regions of China. Case Stud. Therm. Eng. 2023, 49, 103207. [Google Scholar] [CrossRef]
- IES LM-83–2012; Approved Method: IES Spatial Daylight Autonomy (sDA) and Annual Sunlight Exposure (ASE). The llluminating Engineering Society of North America: New York, NY, USA, 2012.
- LEED v4.1; Building Design +Construction. U.S. Green Building Council: Washington, DC, USA, 2023.
- GB/T 5699–2017; Method of Daylighting Measurements. The State Administration for Market Regulation: Beijing, China, 2017.
- GB 50033–2013; Standard for Daylighting Design of Buildings. Ministry of Housing and Urban-Rural Development of the People’s Republic of China: Beijing, China, 2013.
- Bo, R.; Shao, Y.; Xu, Y.; Yu, Y.; Guo, H.; Chang, W. Research on the Relationship between Thermal Insulation Thickness and Summer Overheating Risk: A Case Study in Severe Cold and Cold Regions of China. Buildings 2022, 12, 1032. [Google Scholar] [CrossRef]
- Morey, J.; Beizaee, A.; Wright, A. An investigation into overheating in social housing dwellings in central England. Build. Environ. 2020, 176, 106814. [Google Scholar] [CrossRef]
- Alrasheed, M.; Mourshed, M. Domestic overheating risks and mitigation strategies: The state-of-the-art and directions for future research. Indoor Built Environ. 2023, 32, 1057–1077. [Google Scholar] [CrossRef]
- Arriazu-Ramos, A.; Bes-Rastrollo, M.; Gutiérrez, A.S.; Monge-Barrio, A. Building parameters that influence overheating of apartment buildings in a temperate climate in Southern Europe. Build. Environ. 2023, 228, 109899. [Google Scholar] [CrossRef]
- De Luca, F.; Voll, H.; Thalfeldt, M. Horizontal or vertical? Windows’ layout selection for shading devices optimization. Manag. Environ. Qual. An. Int. J. 2016, 27, 623–633. [Google Scholar] [CrossRef]
- Grussa, Z.D.; Andrews, D.; Lowry, G.; Newton, E.J.; Yiakoumetti, K.; Chalk, A.; Bush, D. A London residential retrofit case study: Evaluating passive mitigation methods of reducing risk to overheating through the use of solar shading combined with night-time ventilation. Build. Serv. Eng. Res. Technol. 2019, 40, 389–408. [Google Scholar] [CrossRef]
Disclaimer/Publisher’s Note: The statements, opinions and data contained in all publications are solely those of the individual author(s) and contributor(s) and not of MDPI and/or the editor(s). MDPI and/or the editor(s) disclaim responsibility for any injury to people or property resulting from any ideas, methods, instructions or products referred to in the content. |
© 2023 by the authors. Licensee MDPI, Basel, Switzerland. This article is an open access article distributed under the terms and conditions of the Creative Commons Attribution (CC BY) license (https://creativecommons.org/licenses/by/4.0/).