
Reaction Molecular Dynamics Study on the Mechanism of Alkali Metal Sodium at the Initial Stage of Naphthalene Pyrolysis Evolution


 ,
,  ,
, 
Abstract
:1. Introduction
2. Method
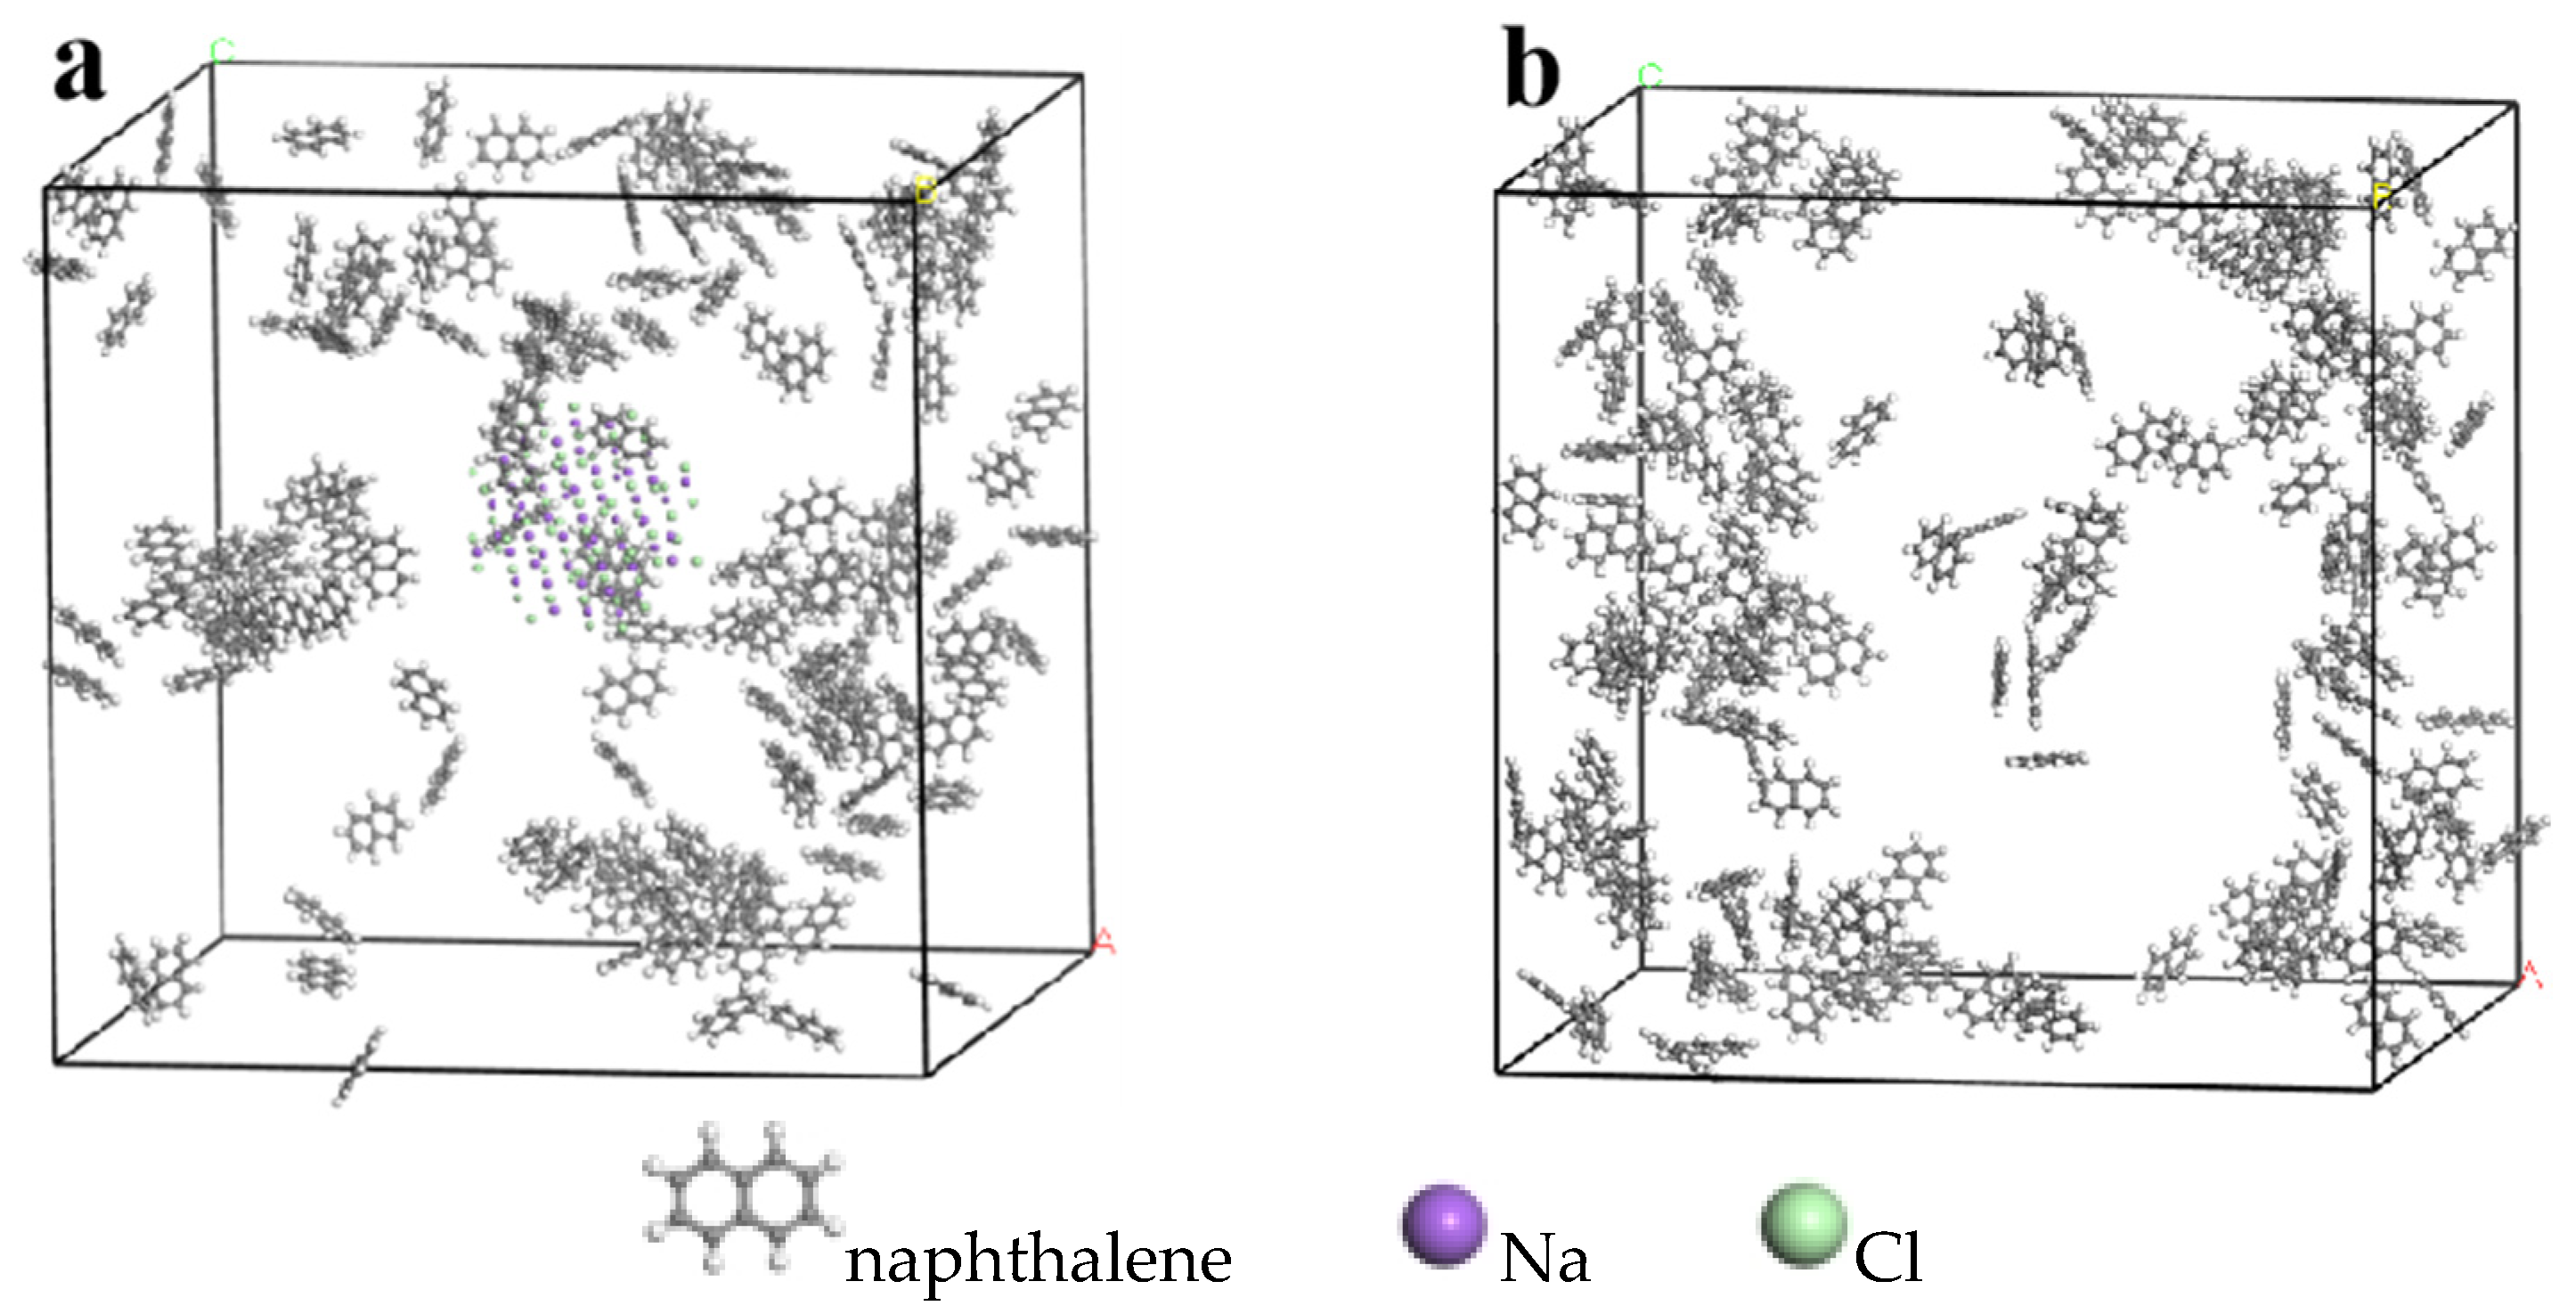
2.1. Model Establishment
2.2. Molecular Dynamics Simulation of Reaction
2.2.1. Effect of Reaction Temperature on the Model Pyrolysis Process
2.2.2. Selection and Setting of Simulation Process Parameters
2.2.3. Data Processing Methods
3. Results and Discussion
3.1. Selection of Simulation Temperature
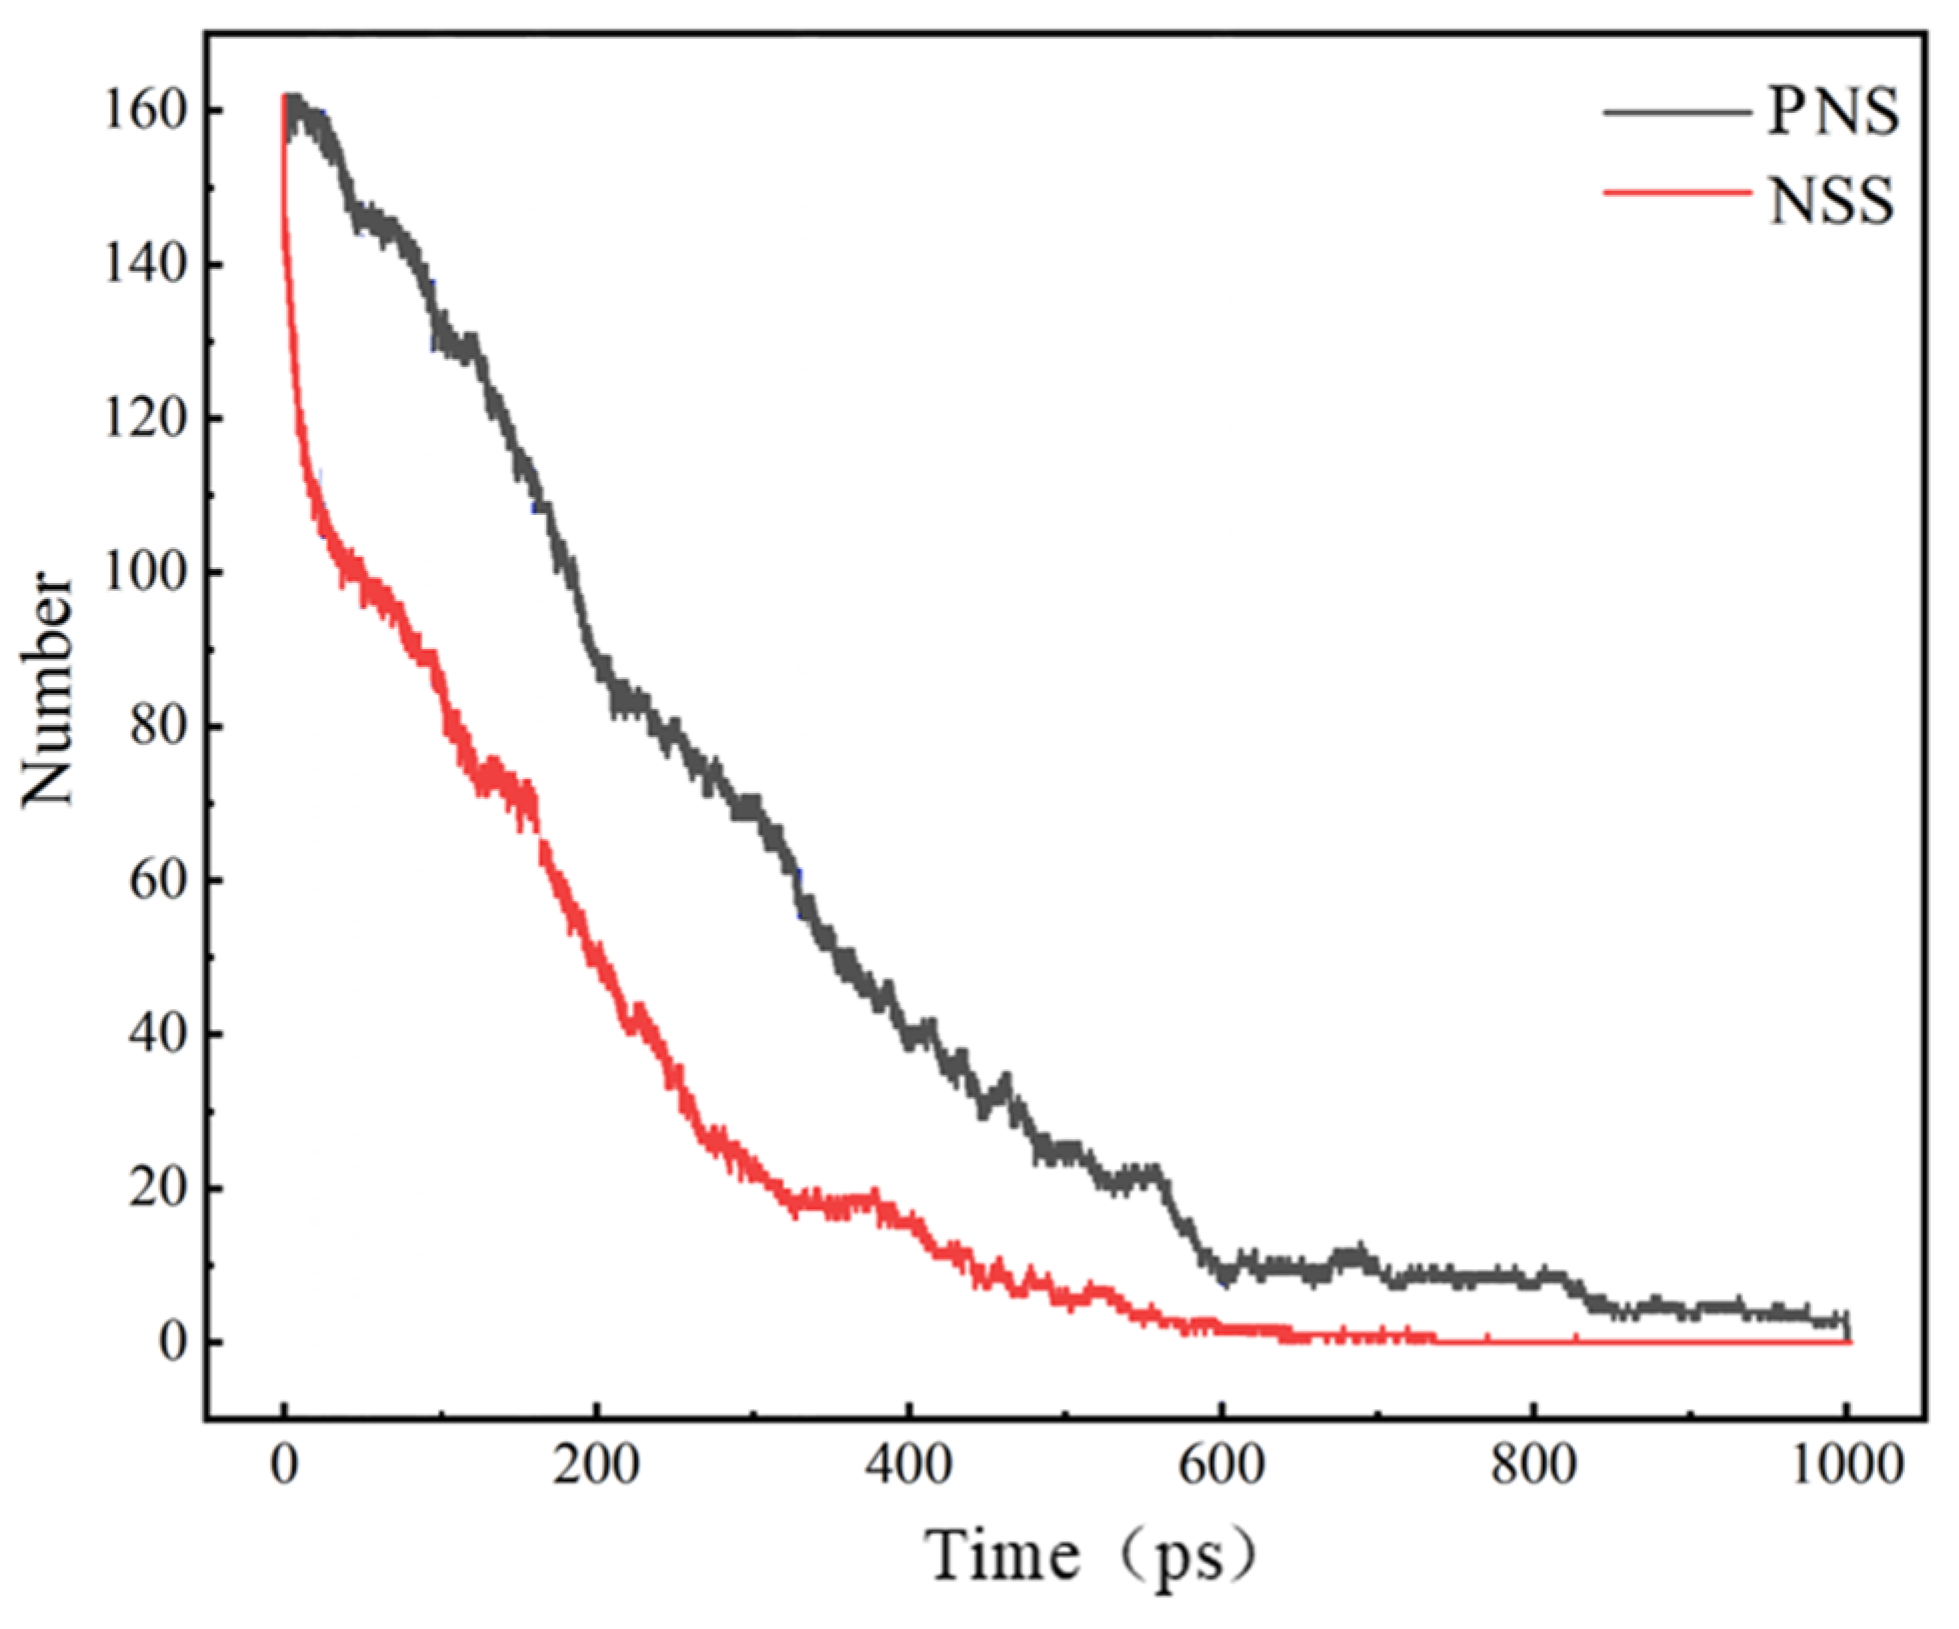
3.2. Comparison of the NSS and PNS Naphthalene Molecular Evolution Process
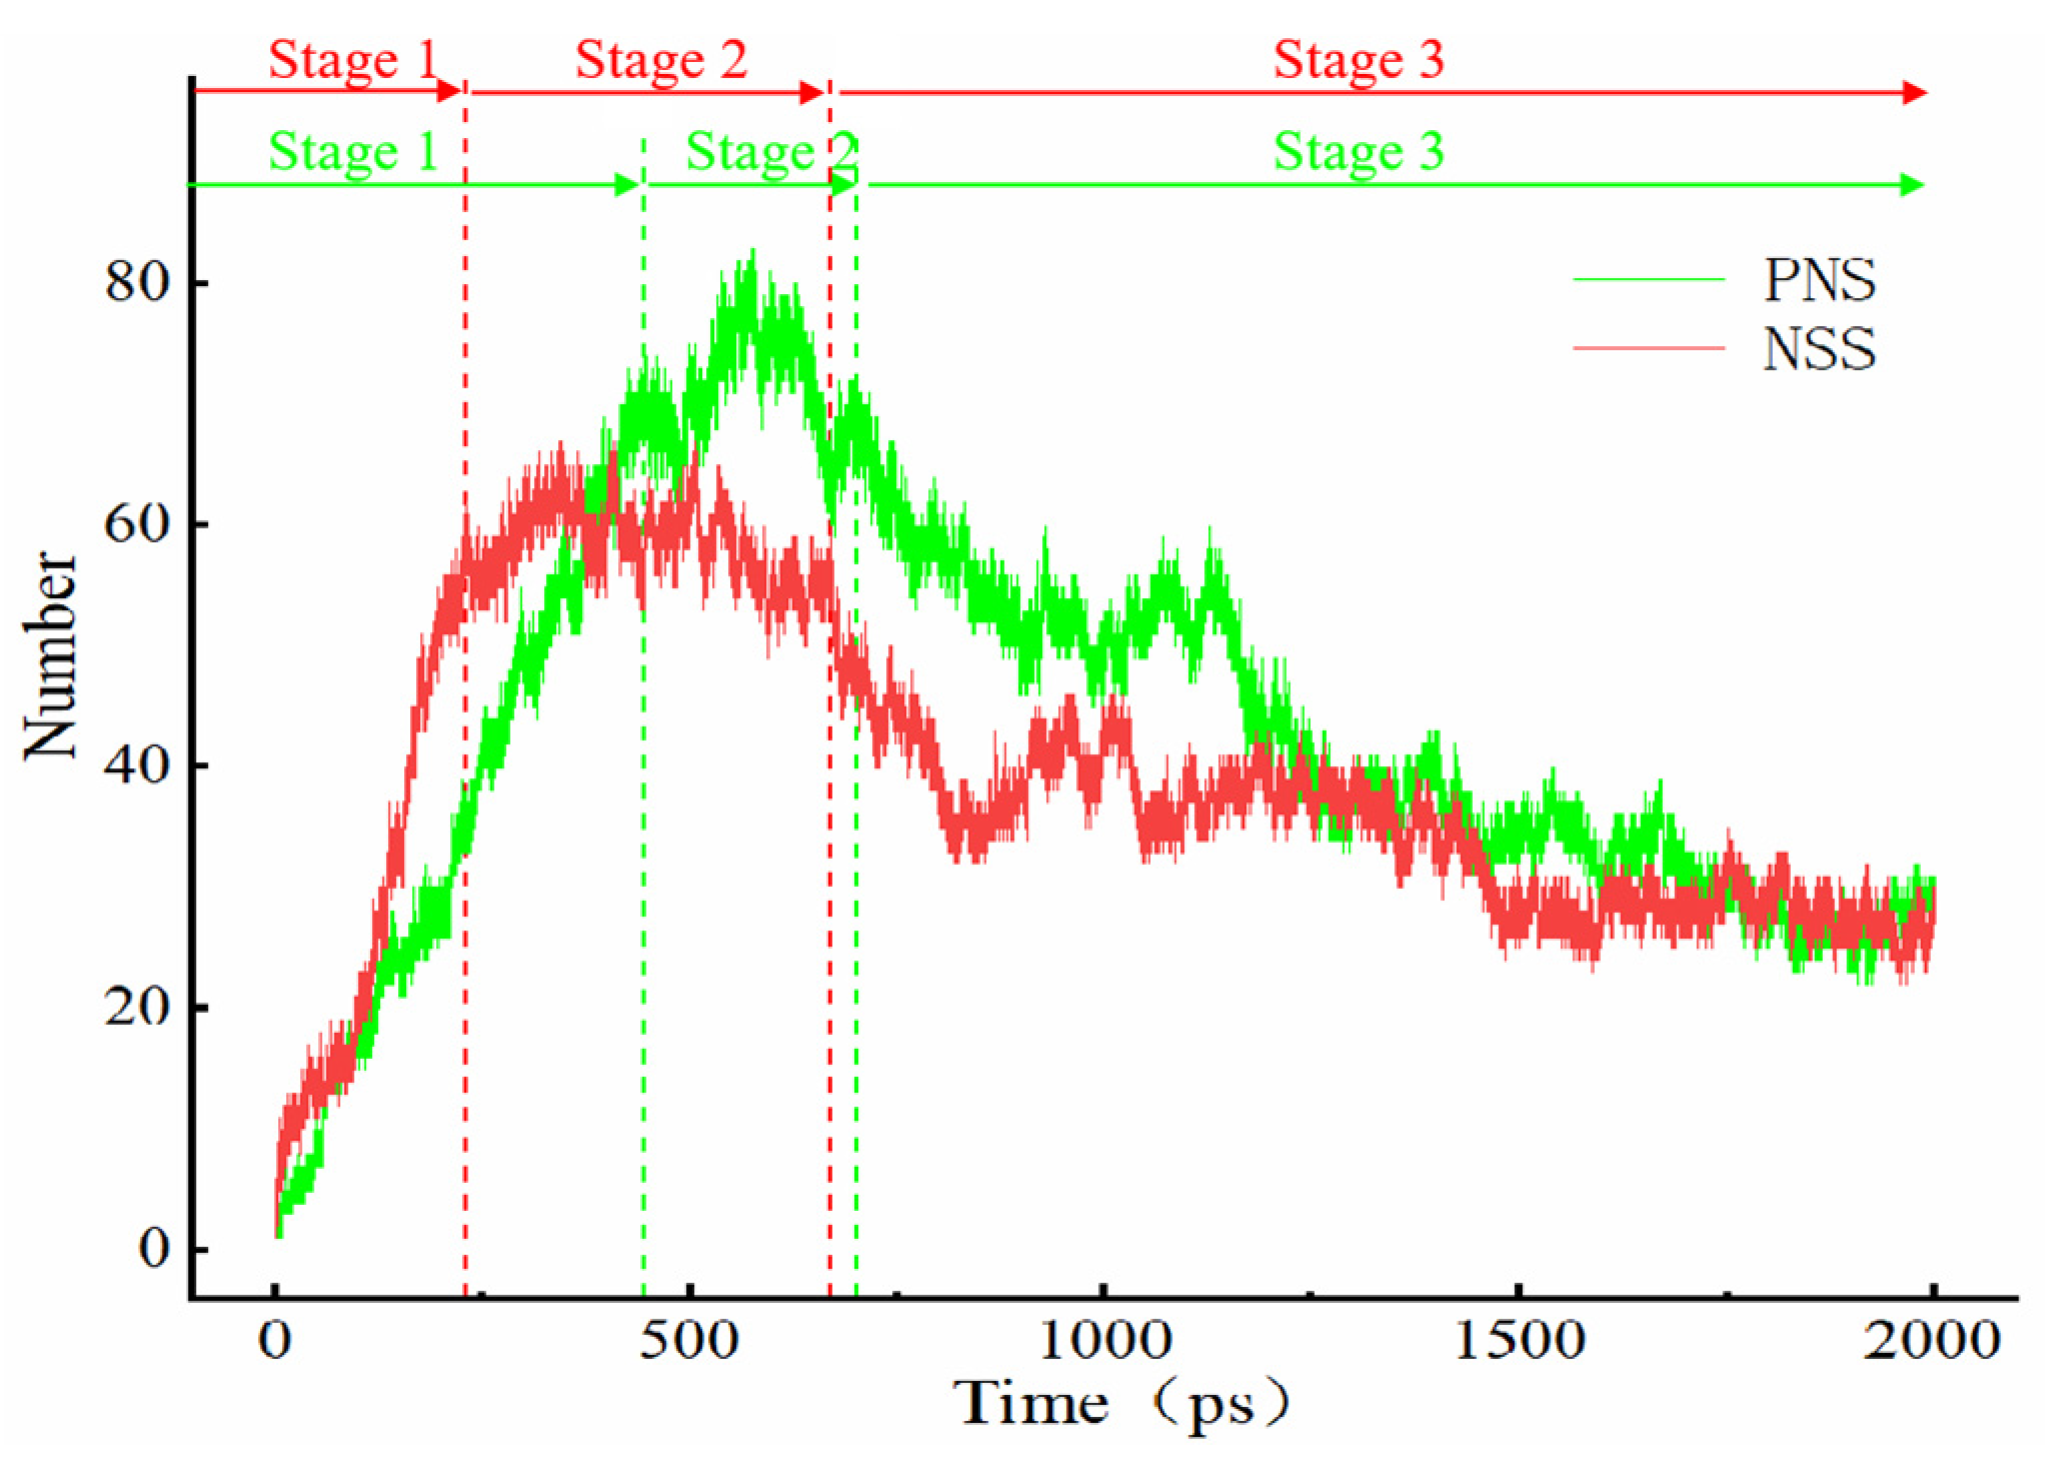
3.3. Evolution of the Pyrolytic Condensation of NSS and PNS
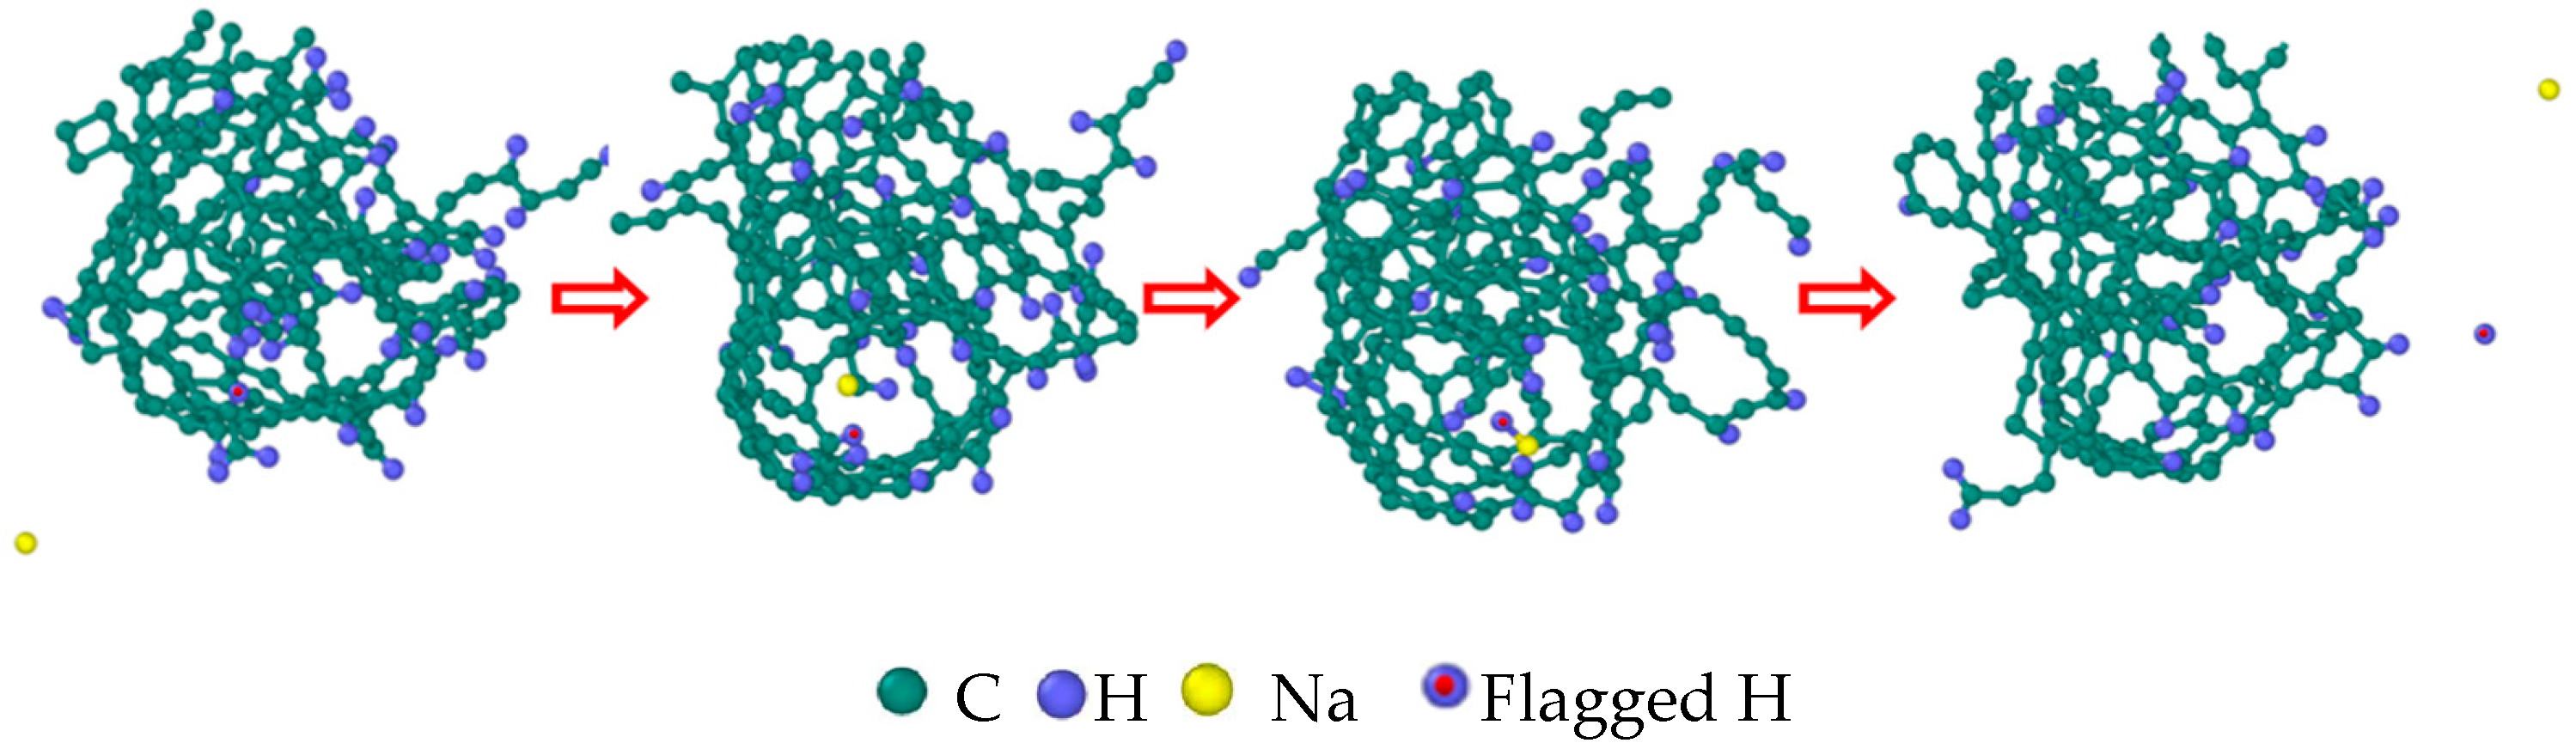
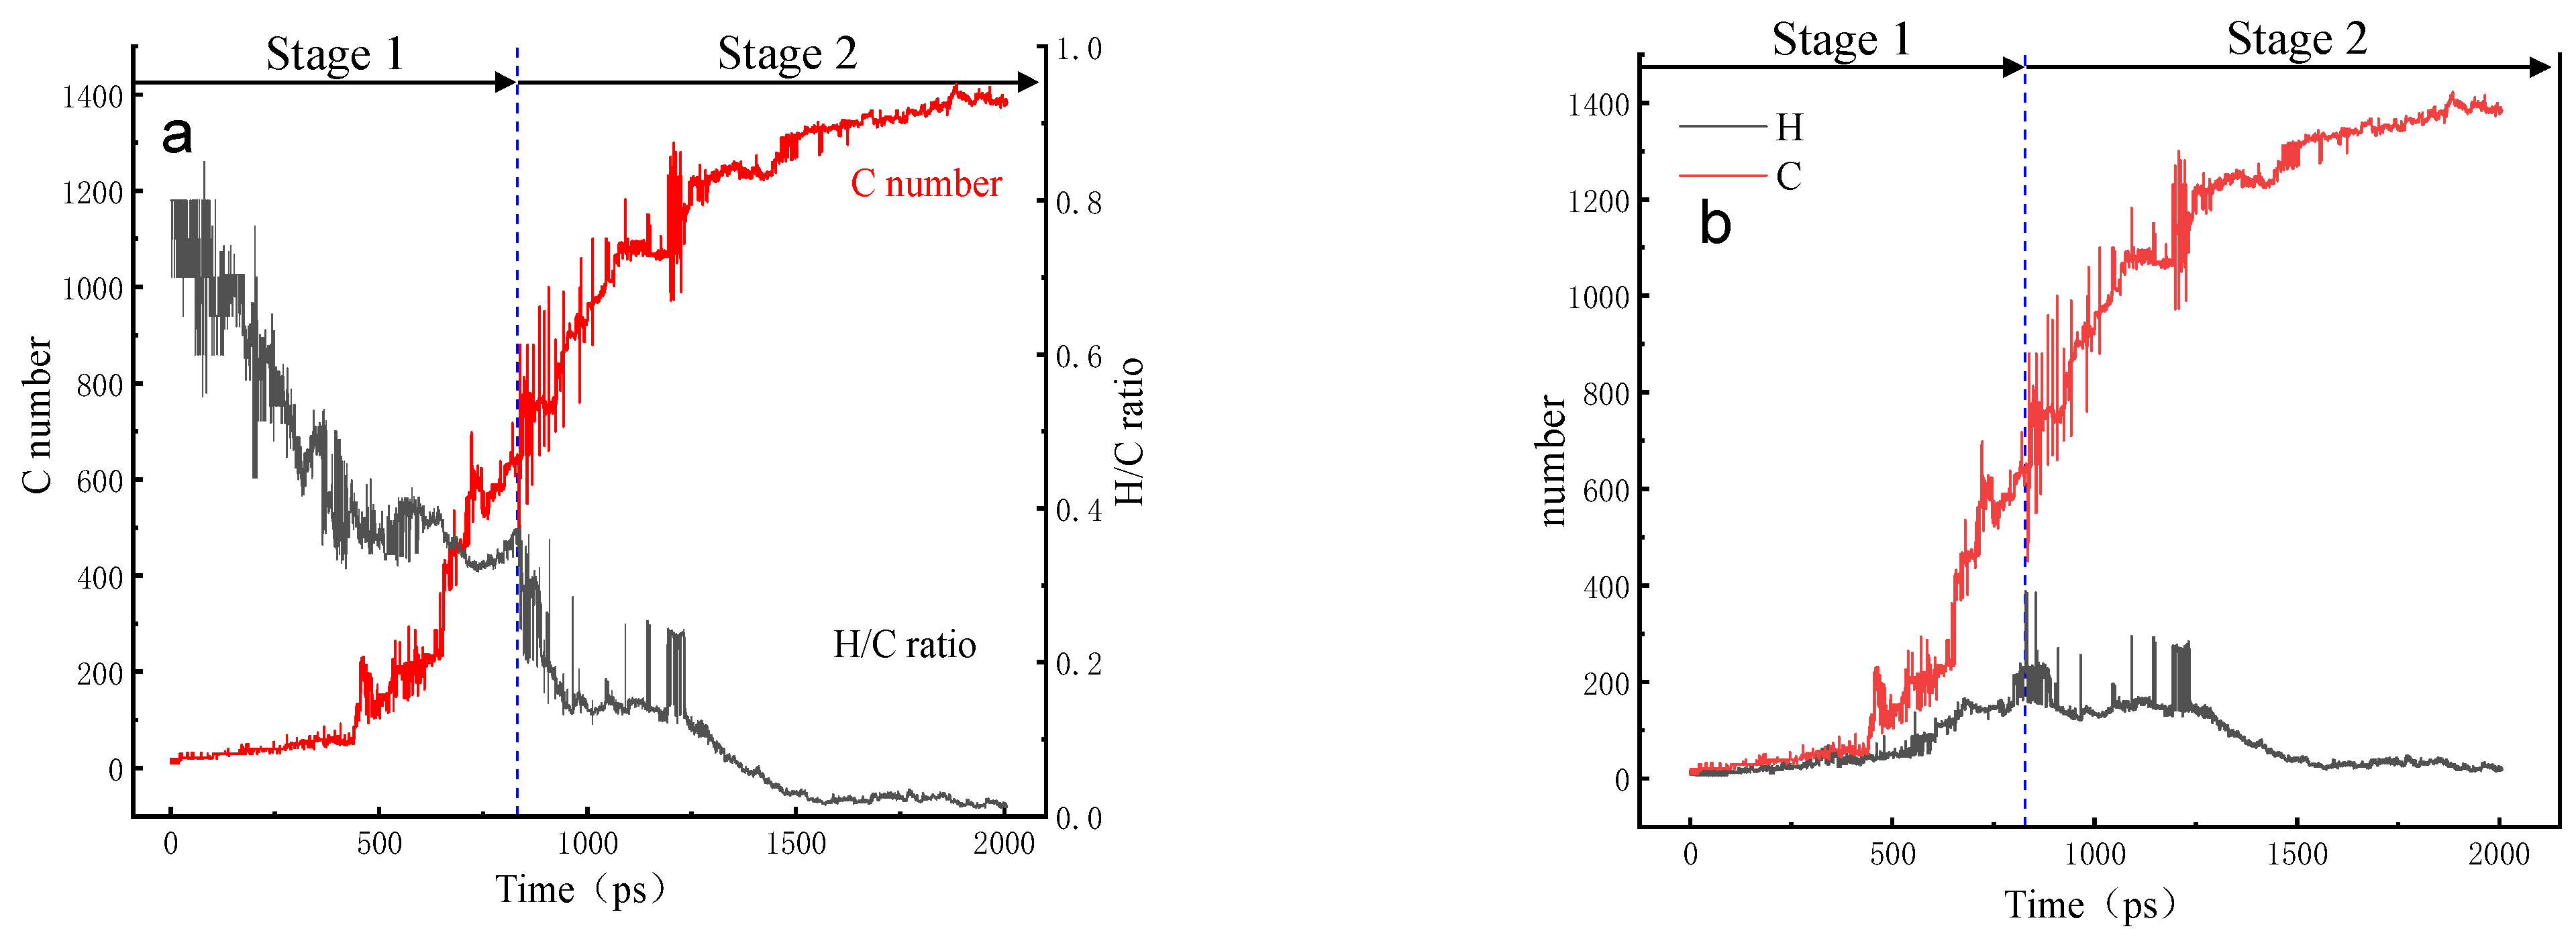
3.4. Evolution of the Largest Molecule
3.5. Evolution of the H/C Ratio of the Largest Molecule
3.6. Changing Pattern of Carbon Rings in NSS System
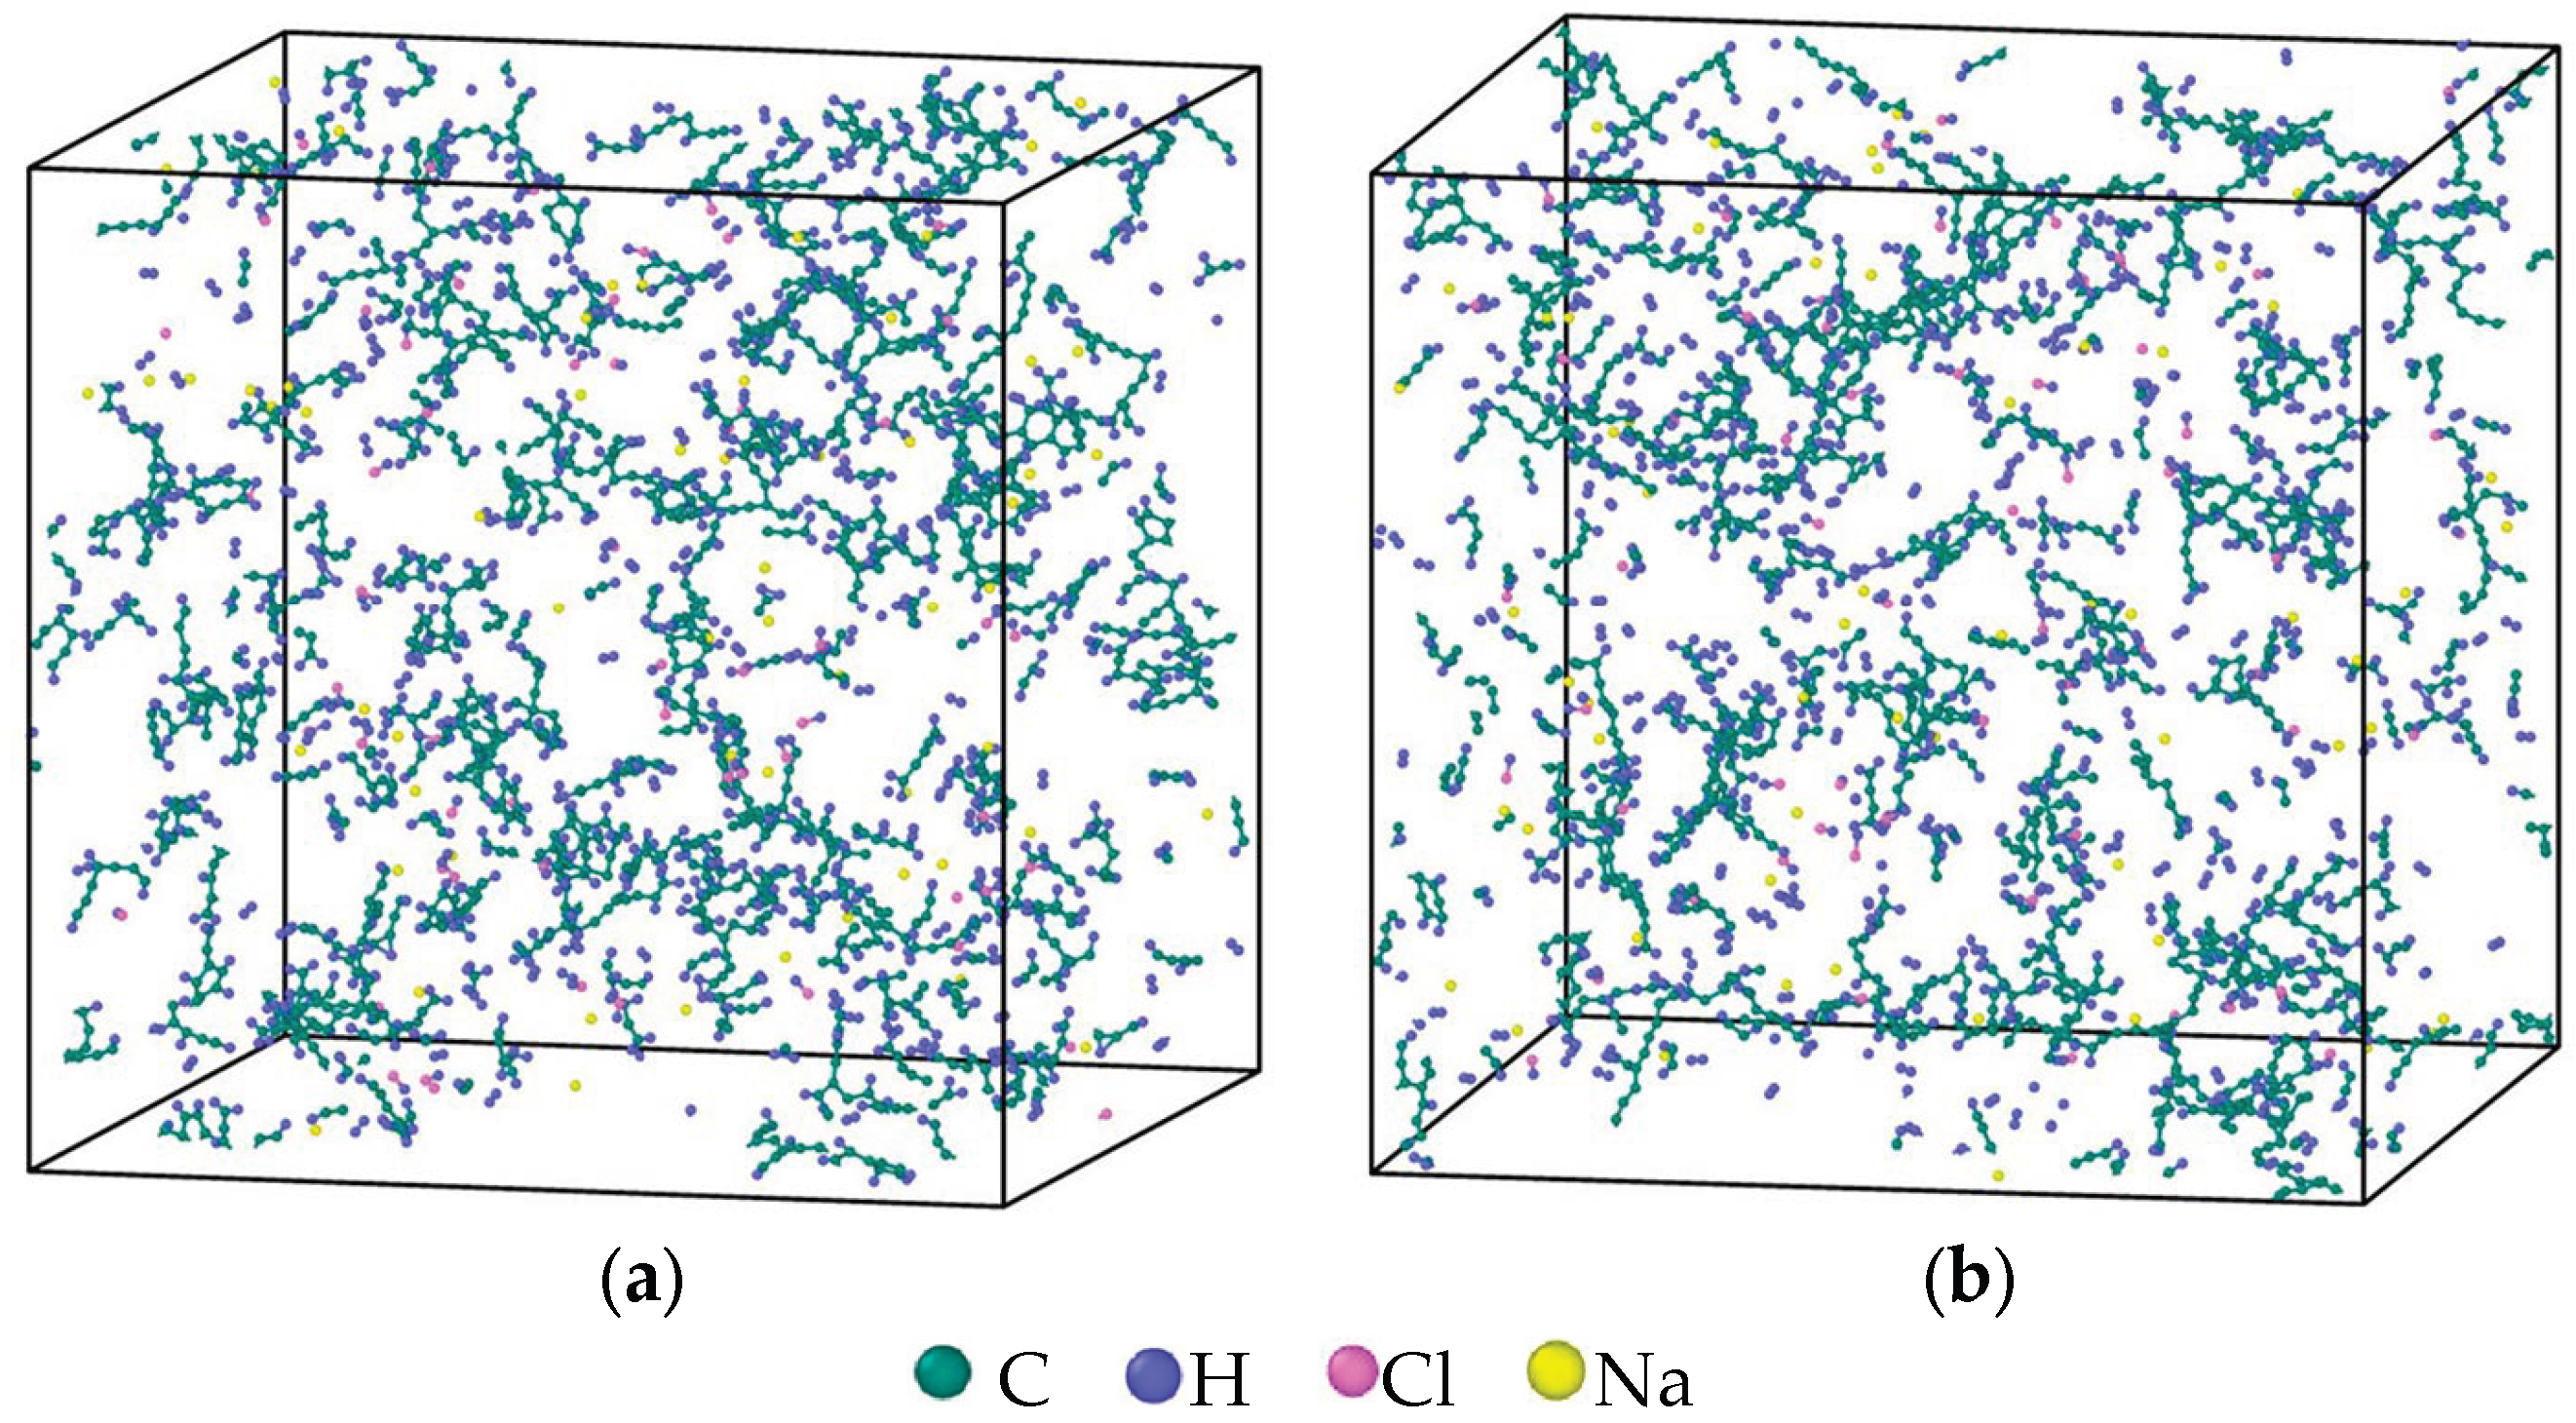
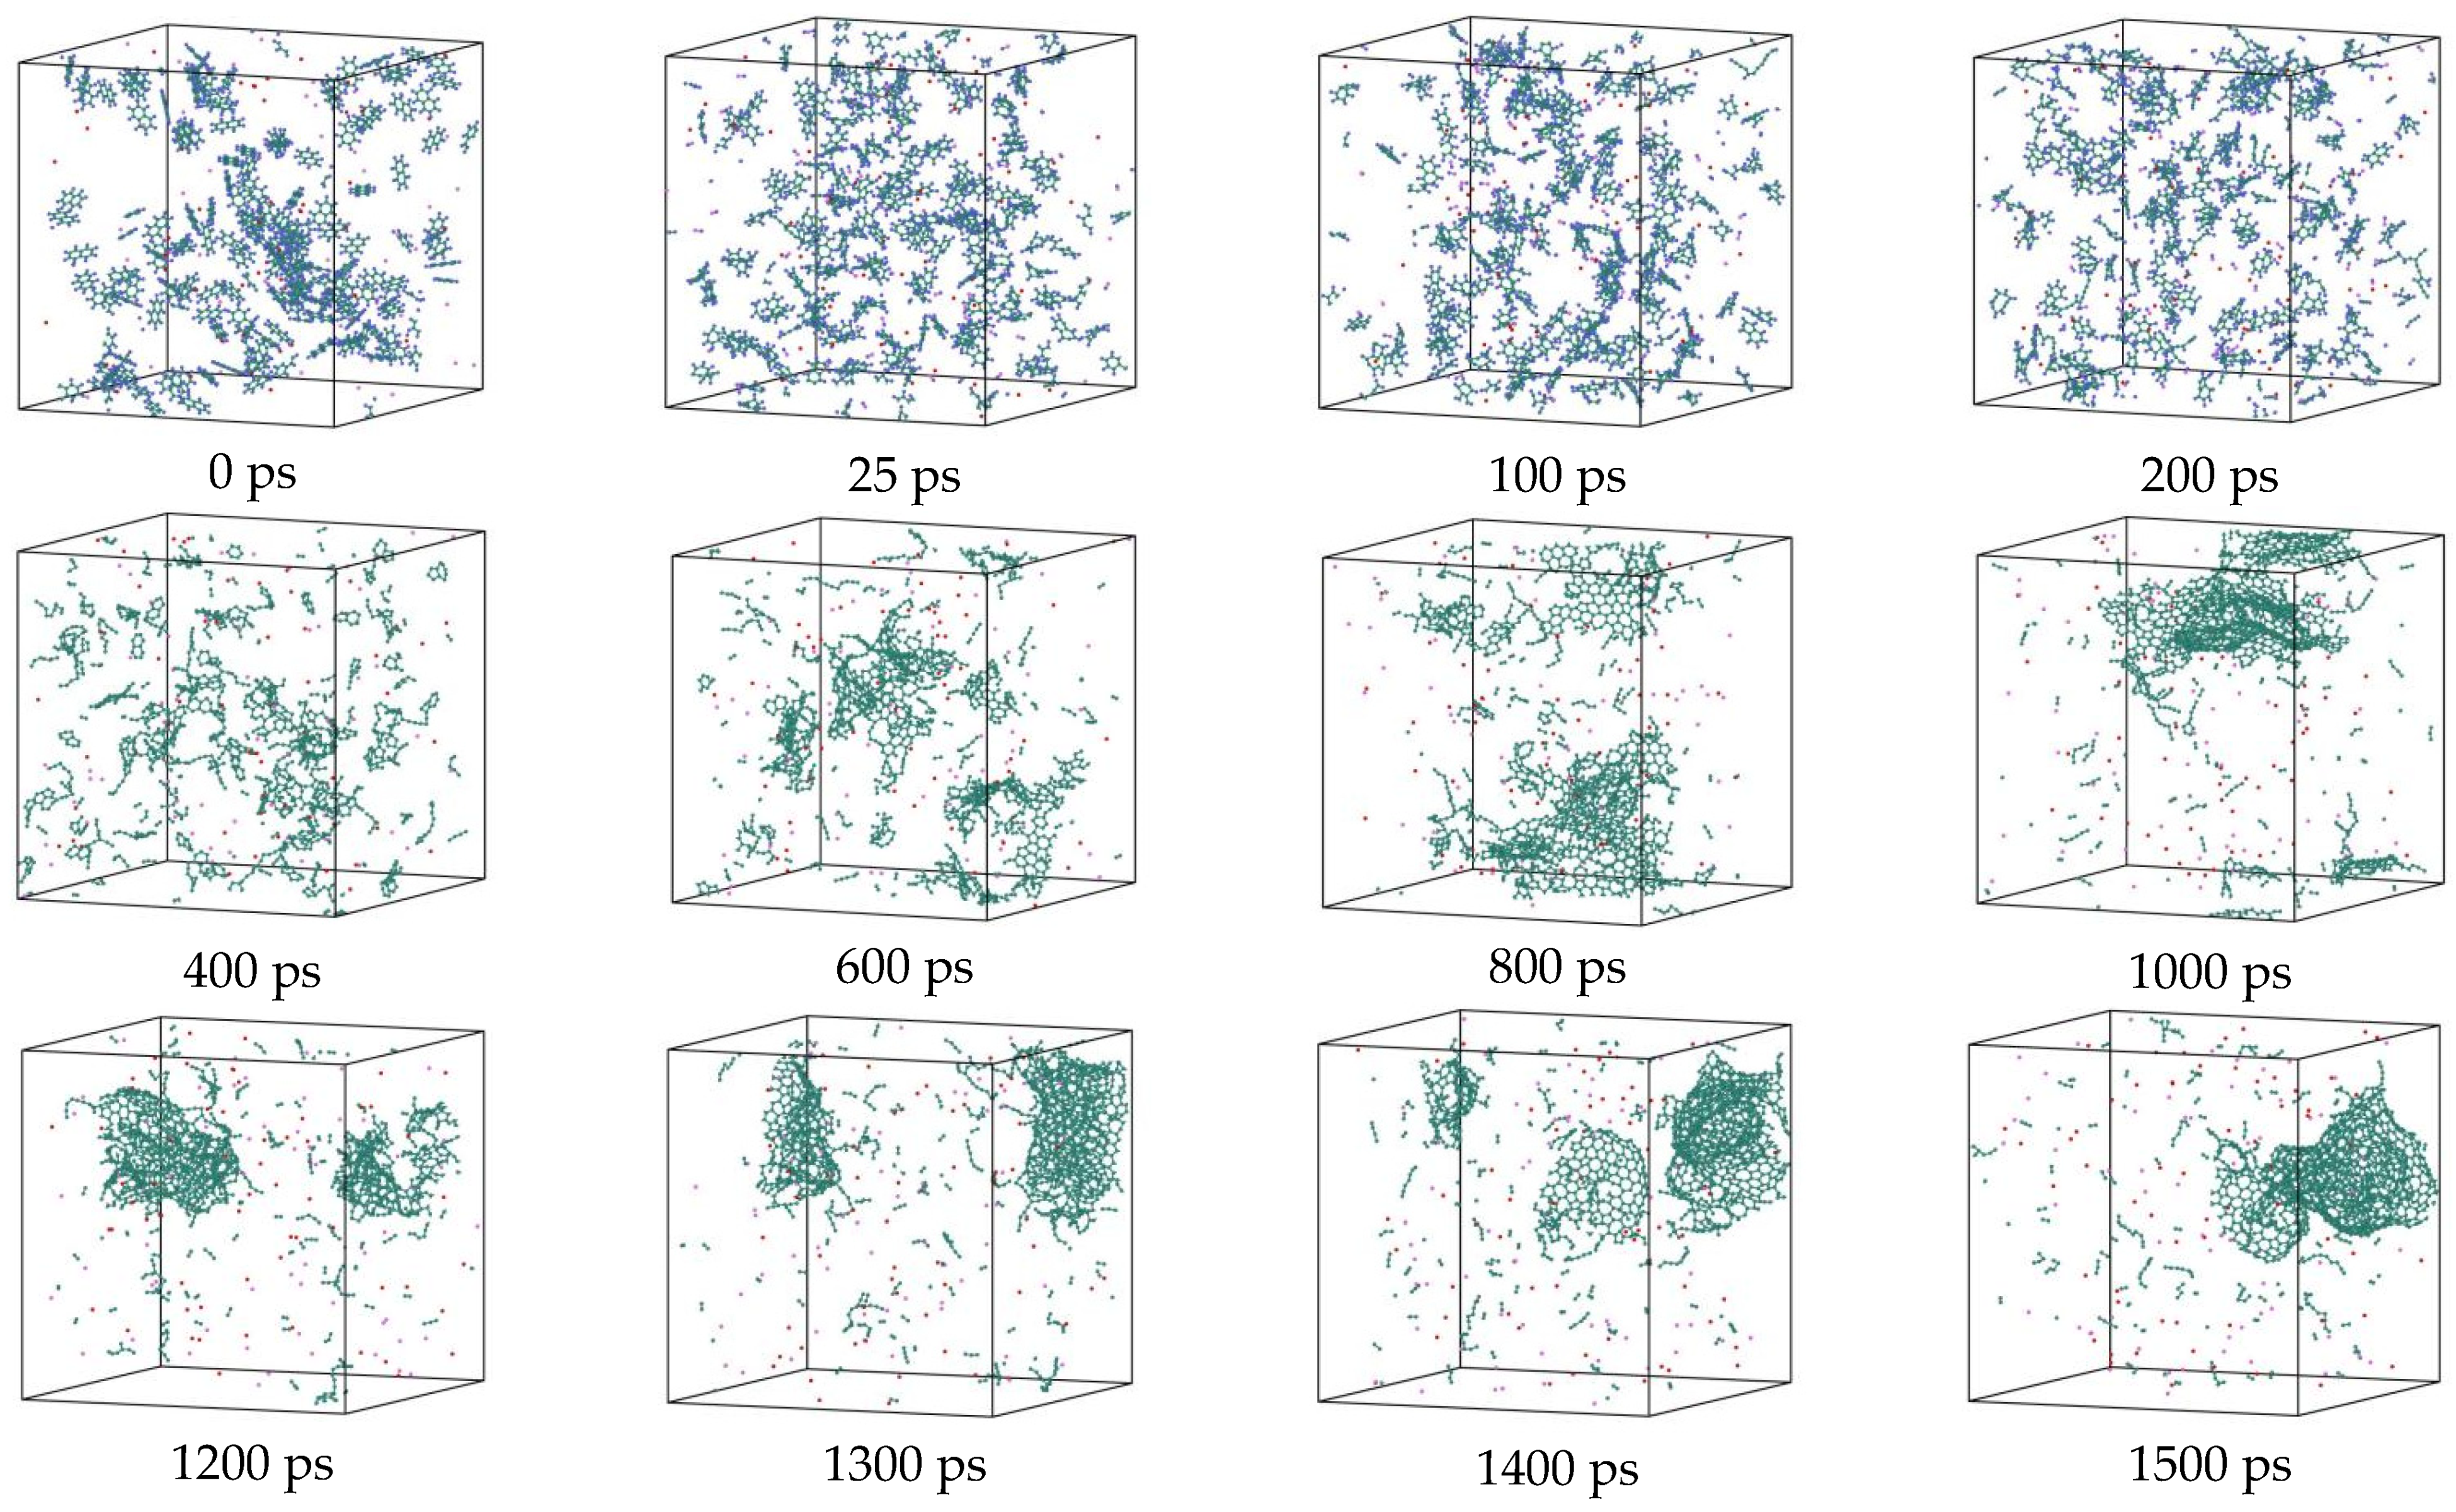
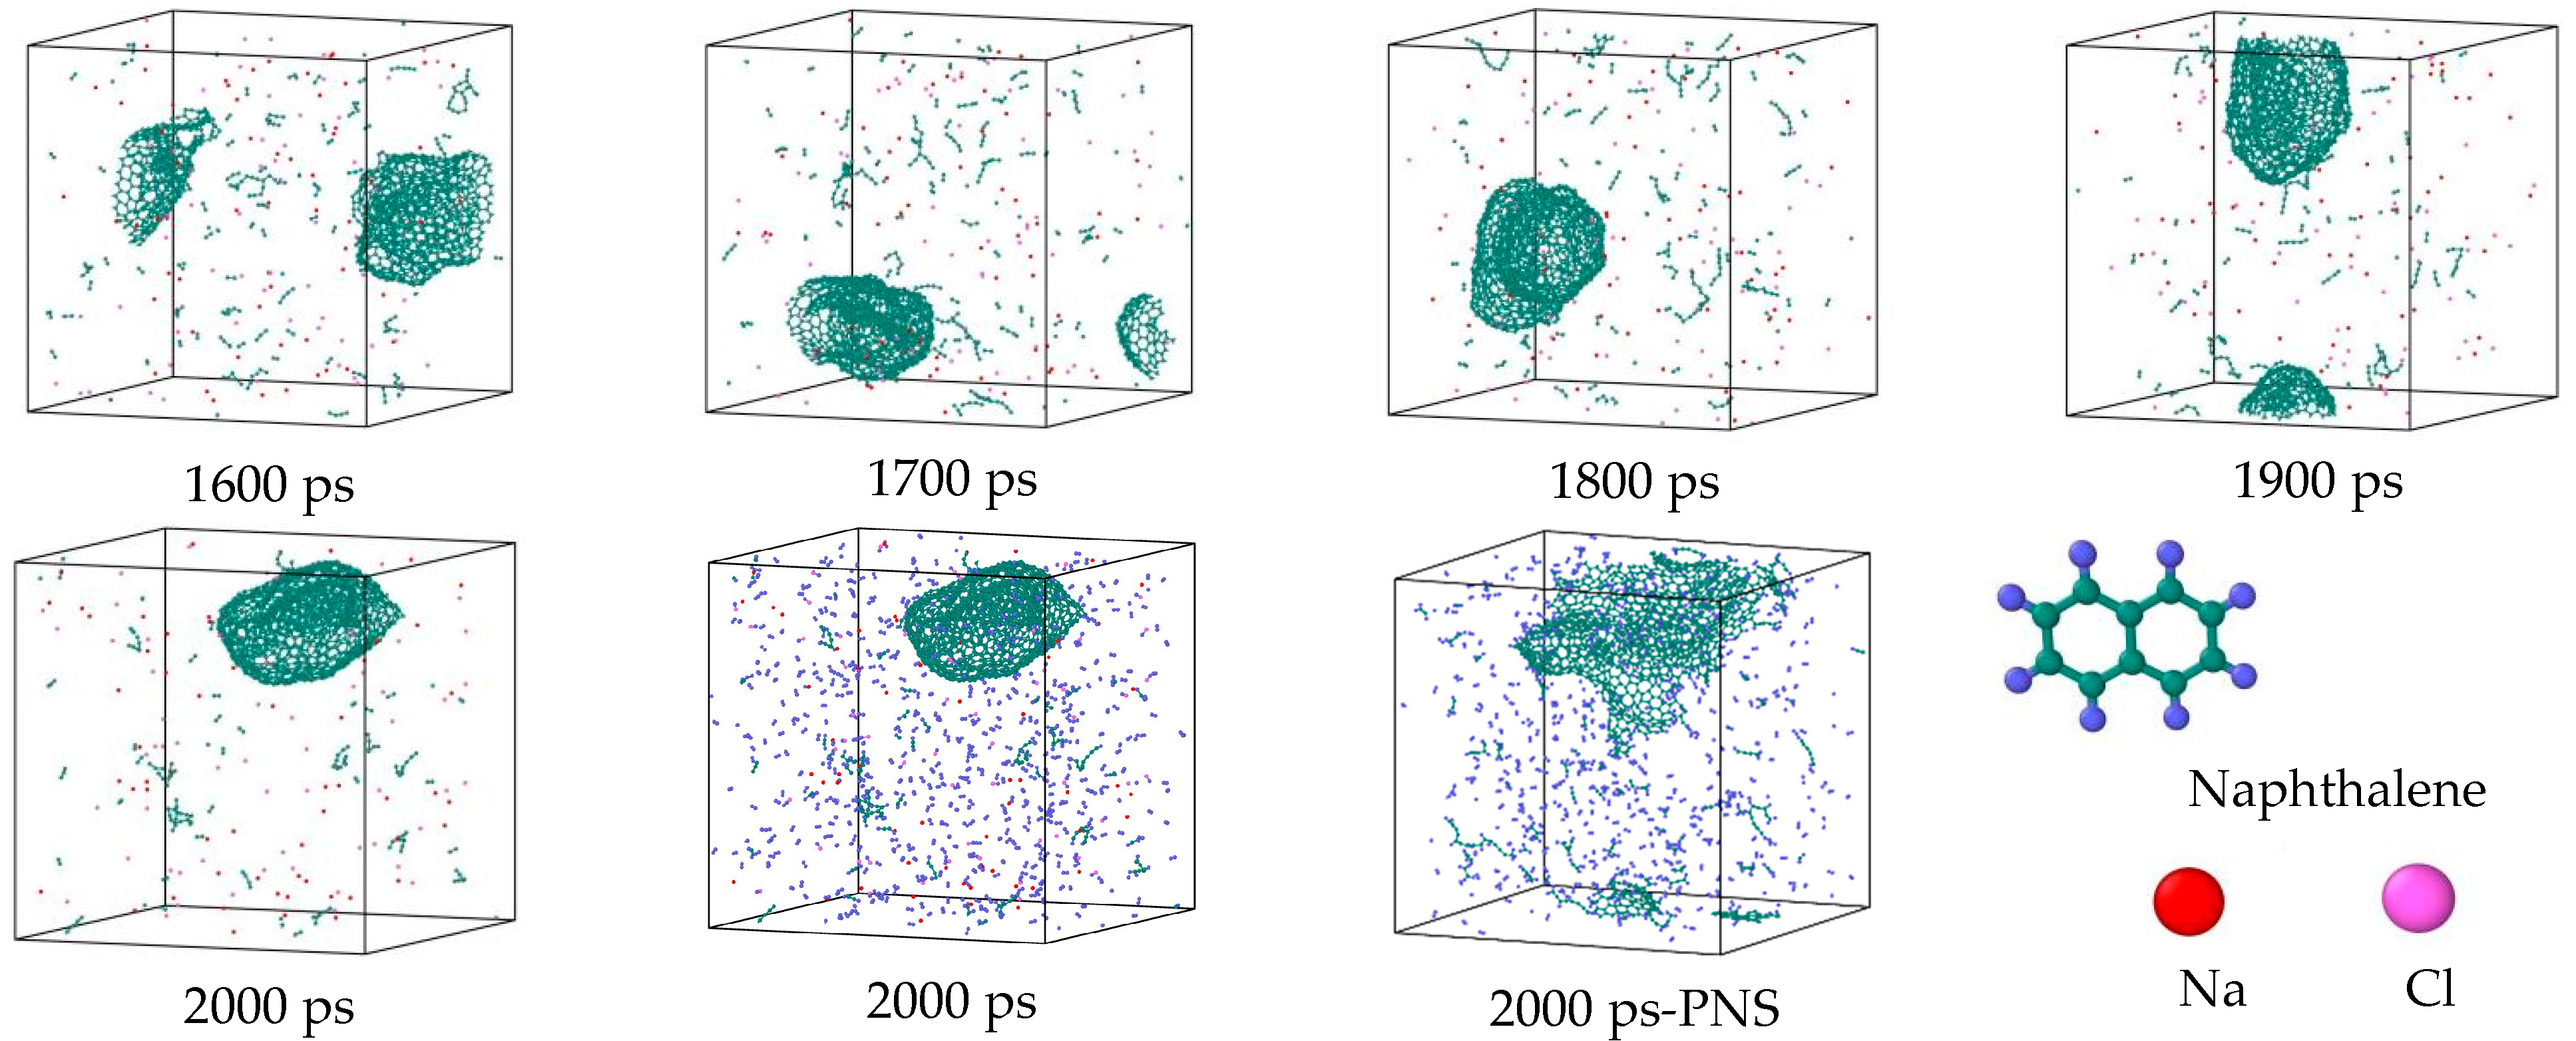
3.7. Detailed Visualization of the NSS Pyrolysis Process
4. Conclusions
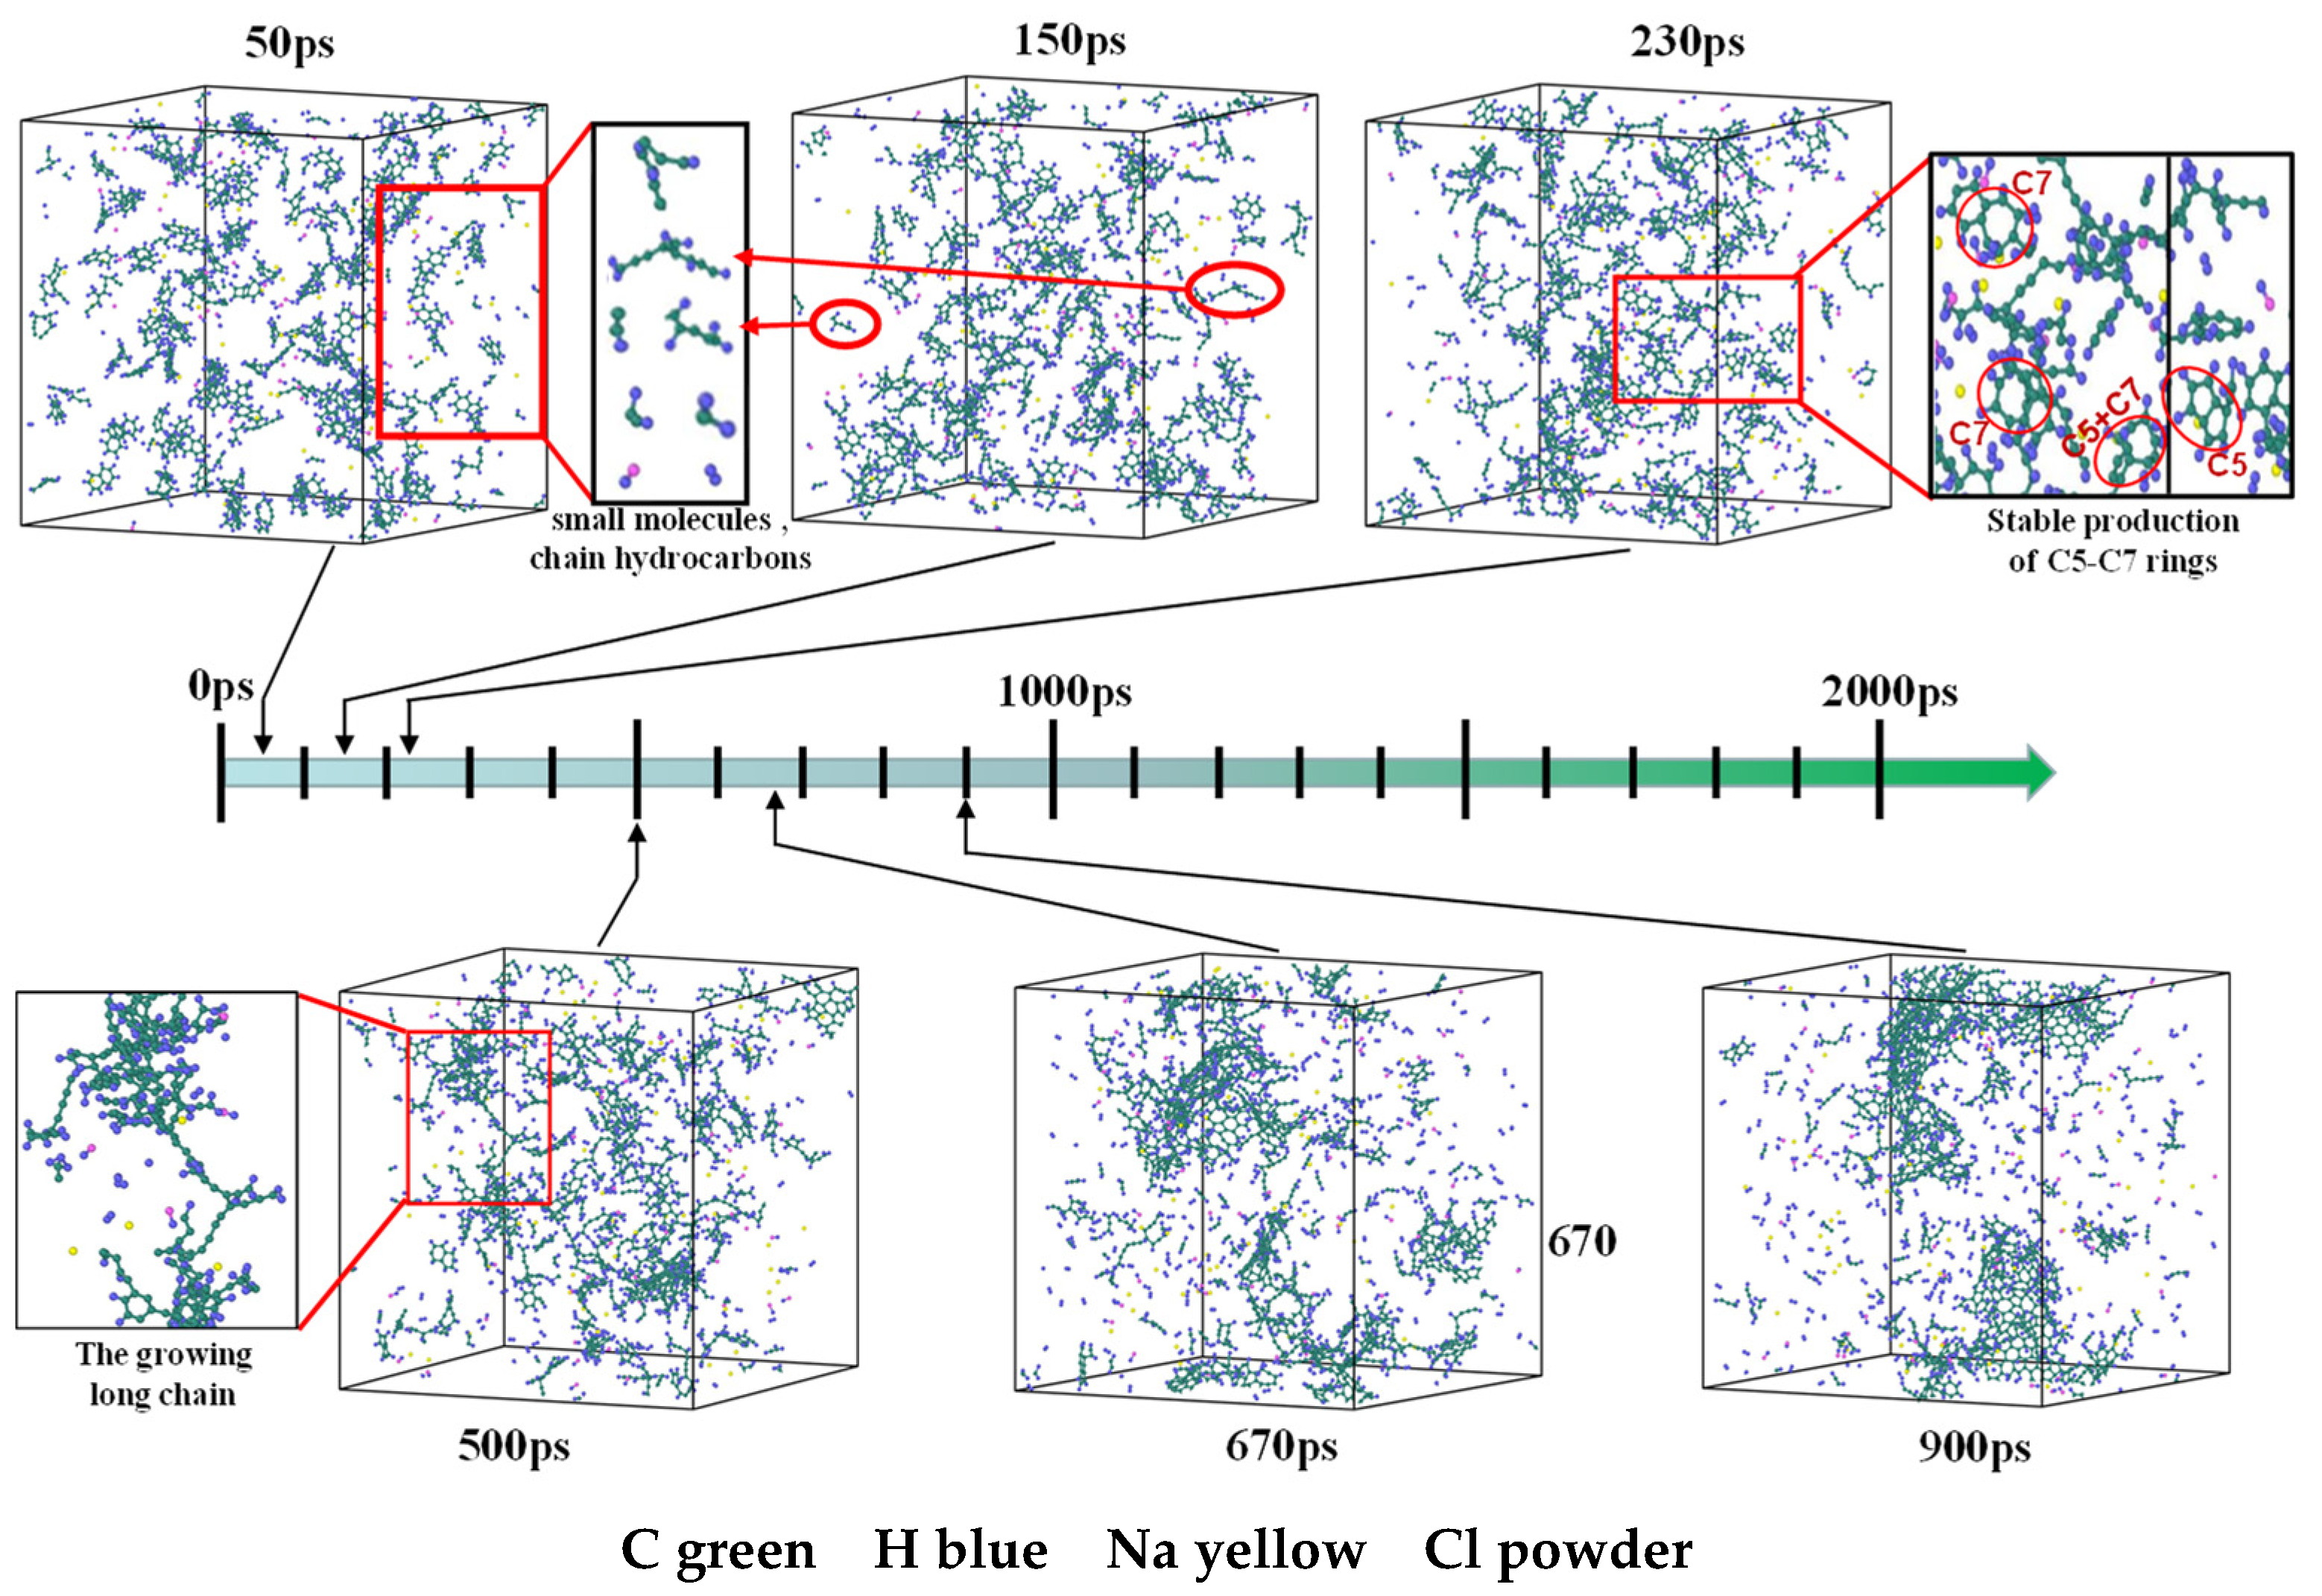
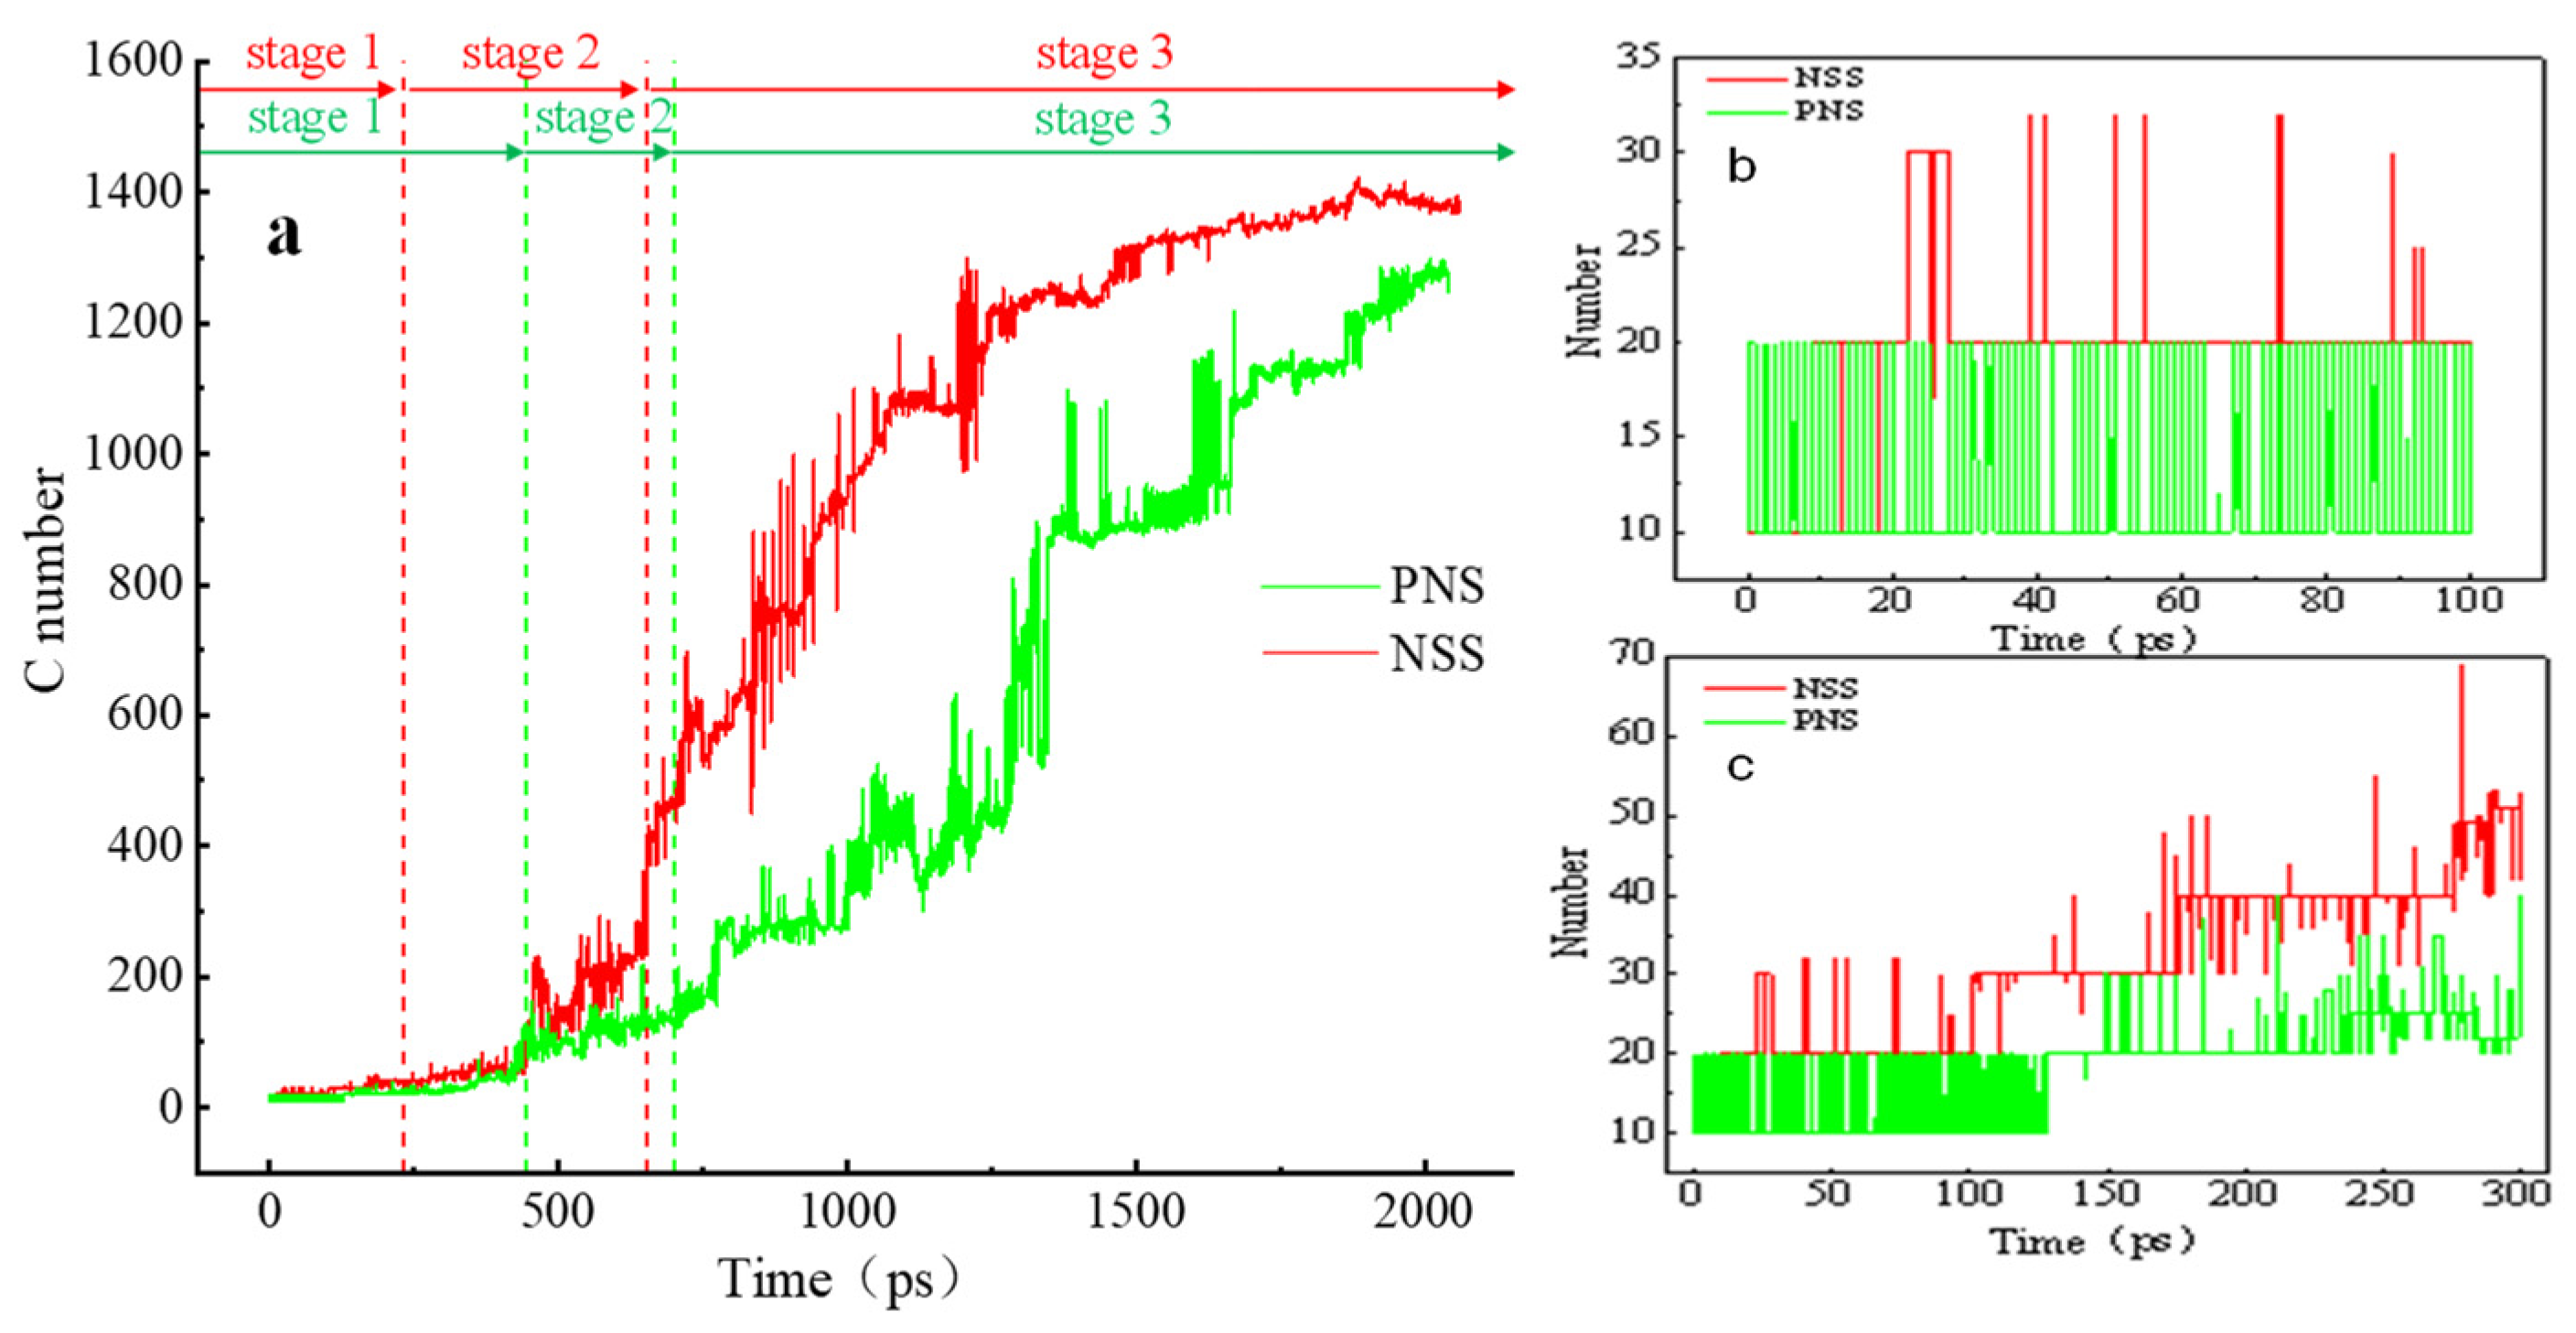
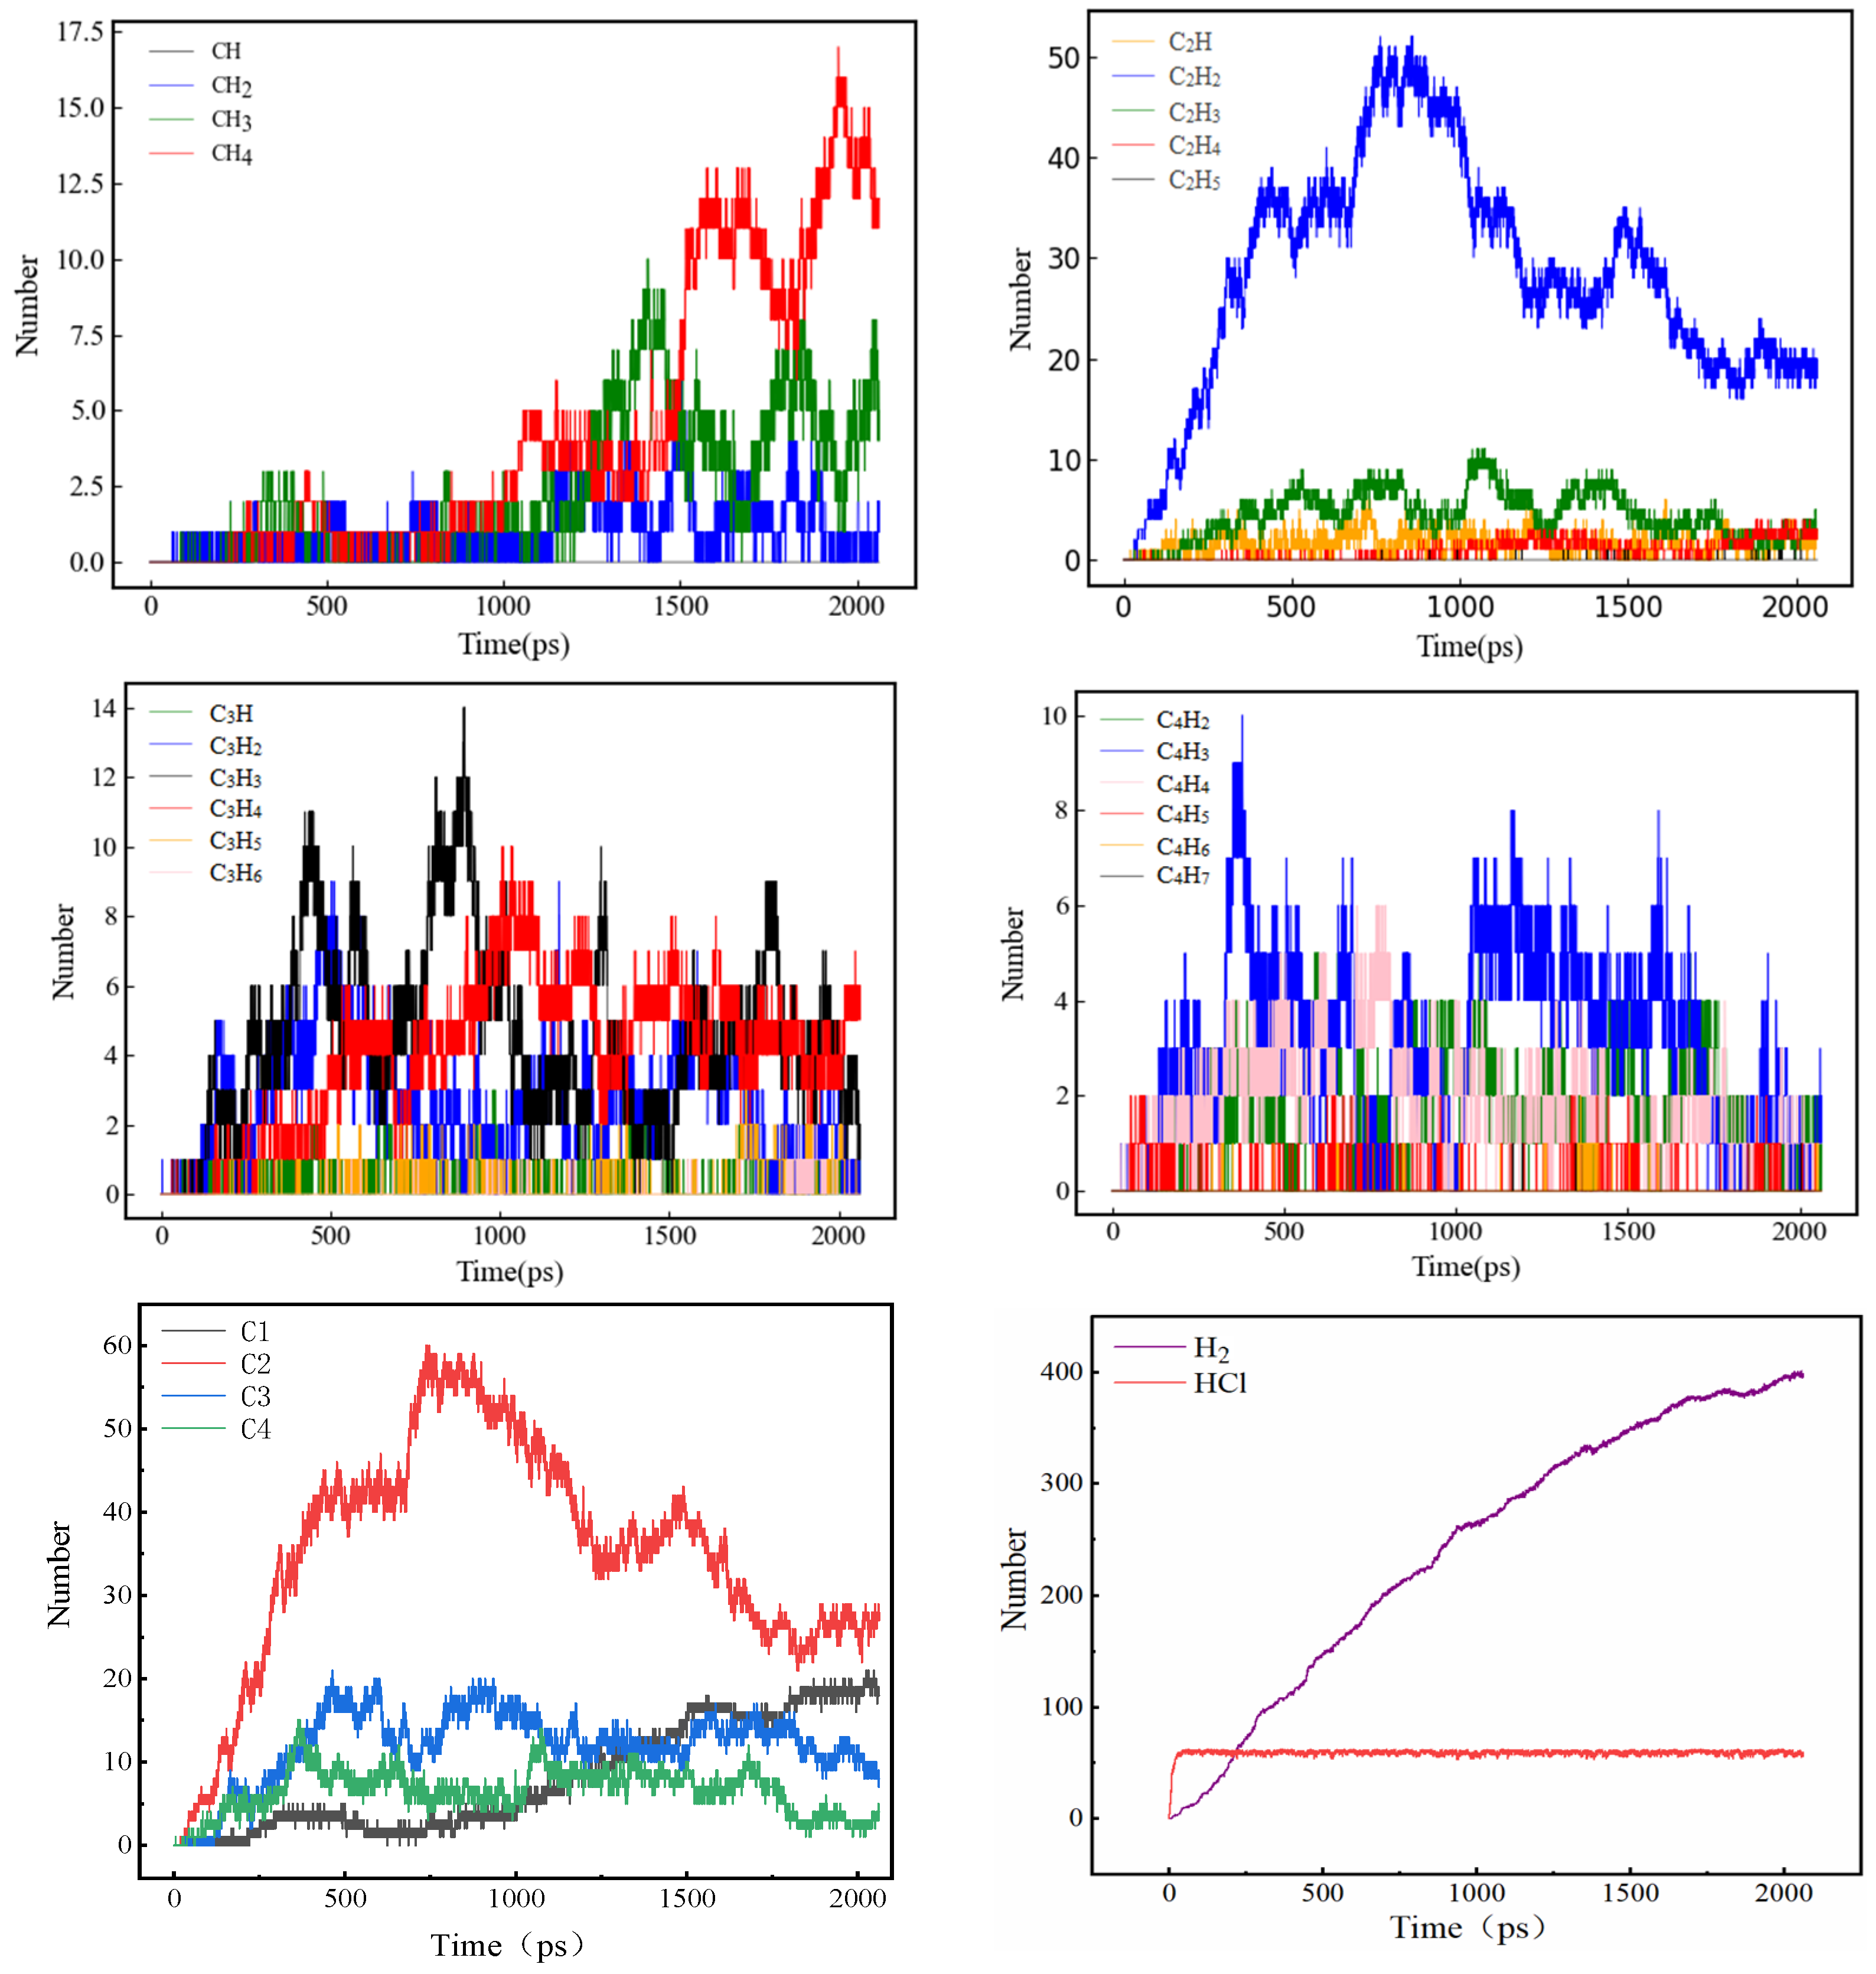
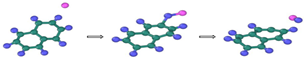
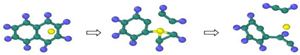
- The first stage: naphthalene molecules undergo dehydrogenation and ring opening fragmentation. Na+ and Cl− are prone to substitution and complexation reactions on naphthalene molecules and C-H fracture and aromatic ring opening are accelerated. The fragmentation of naphthalene molecules is faster in NSS than in PNS.
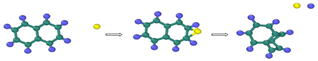
- The second stage: linear chain and fatty ring growth. Compared with PNS, there is a Na+-positive-electric-field effect in NSS, which increases the collision combination probability of heteroelectric radicals and promotes linear chain growth. Na+ forms a transition-state bridge bond and shortens the ring closing time.
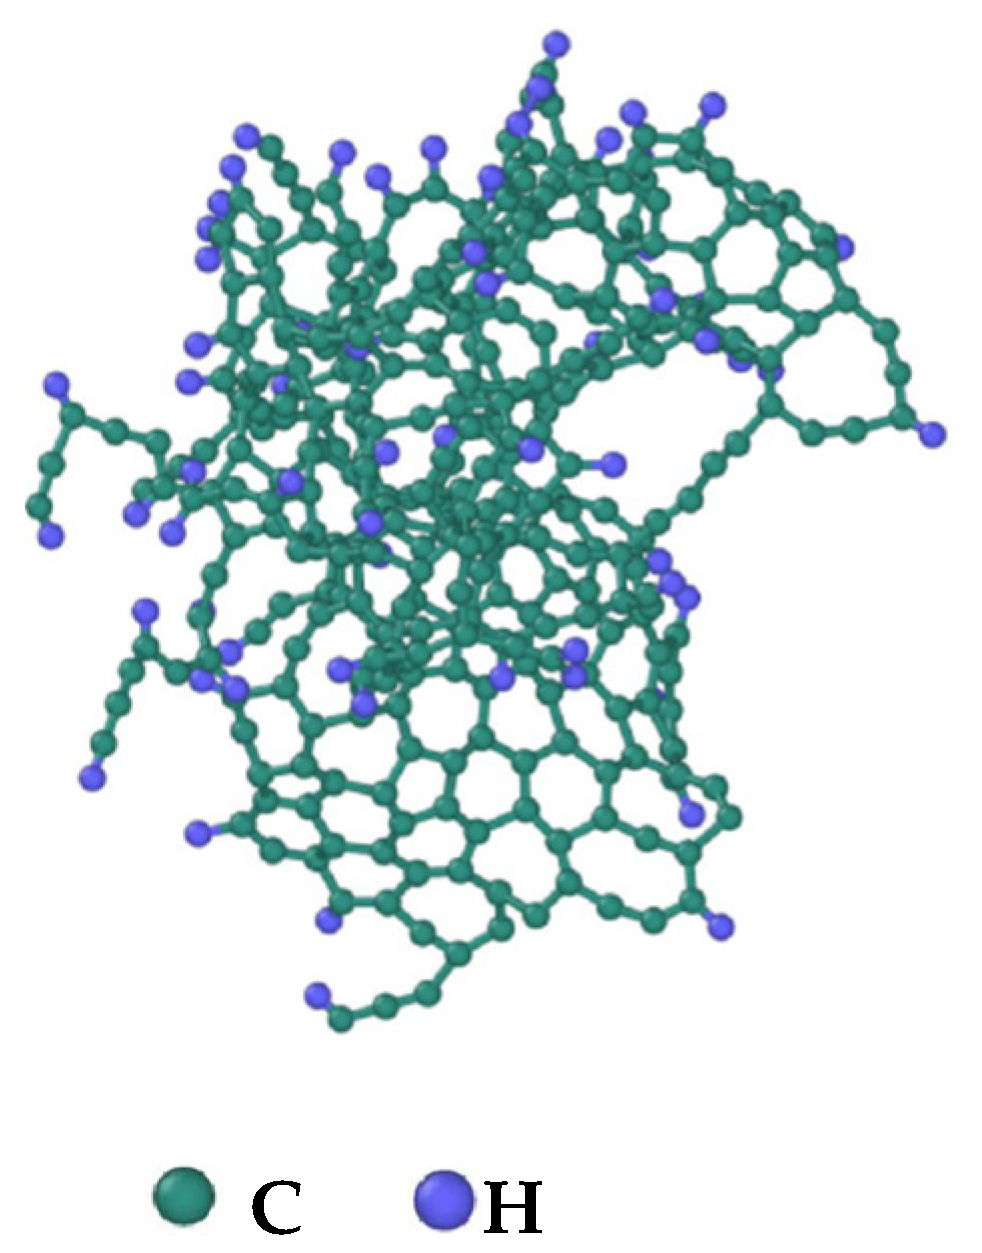
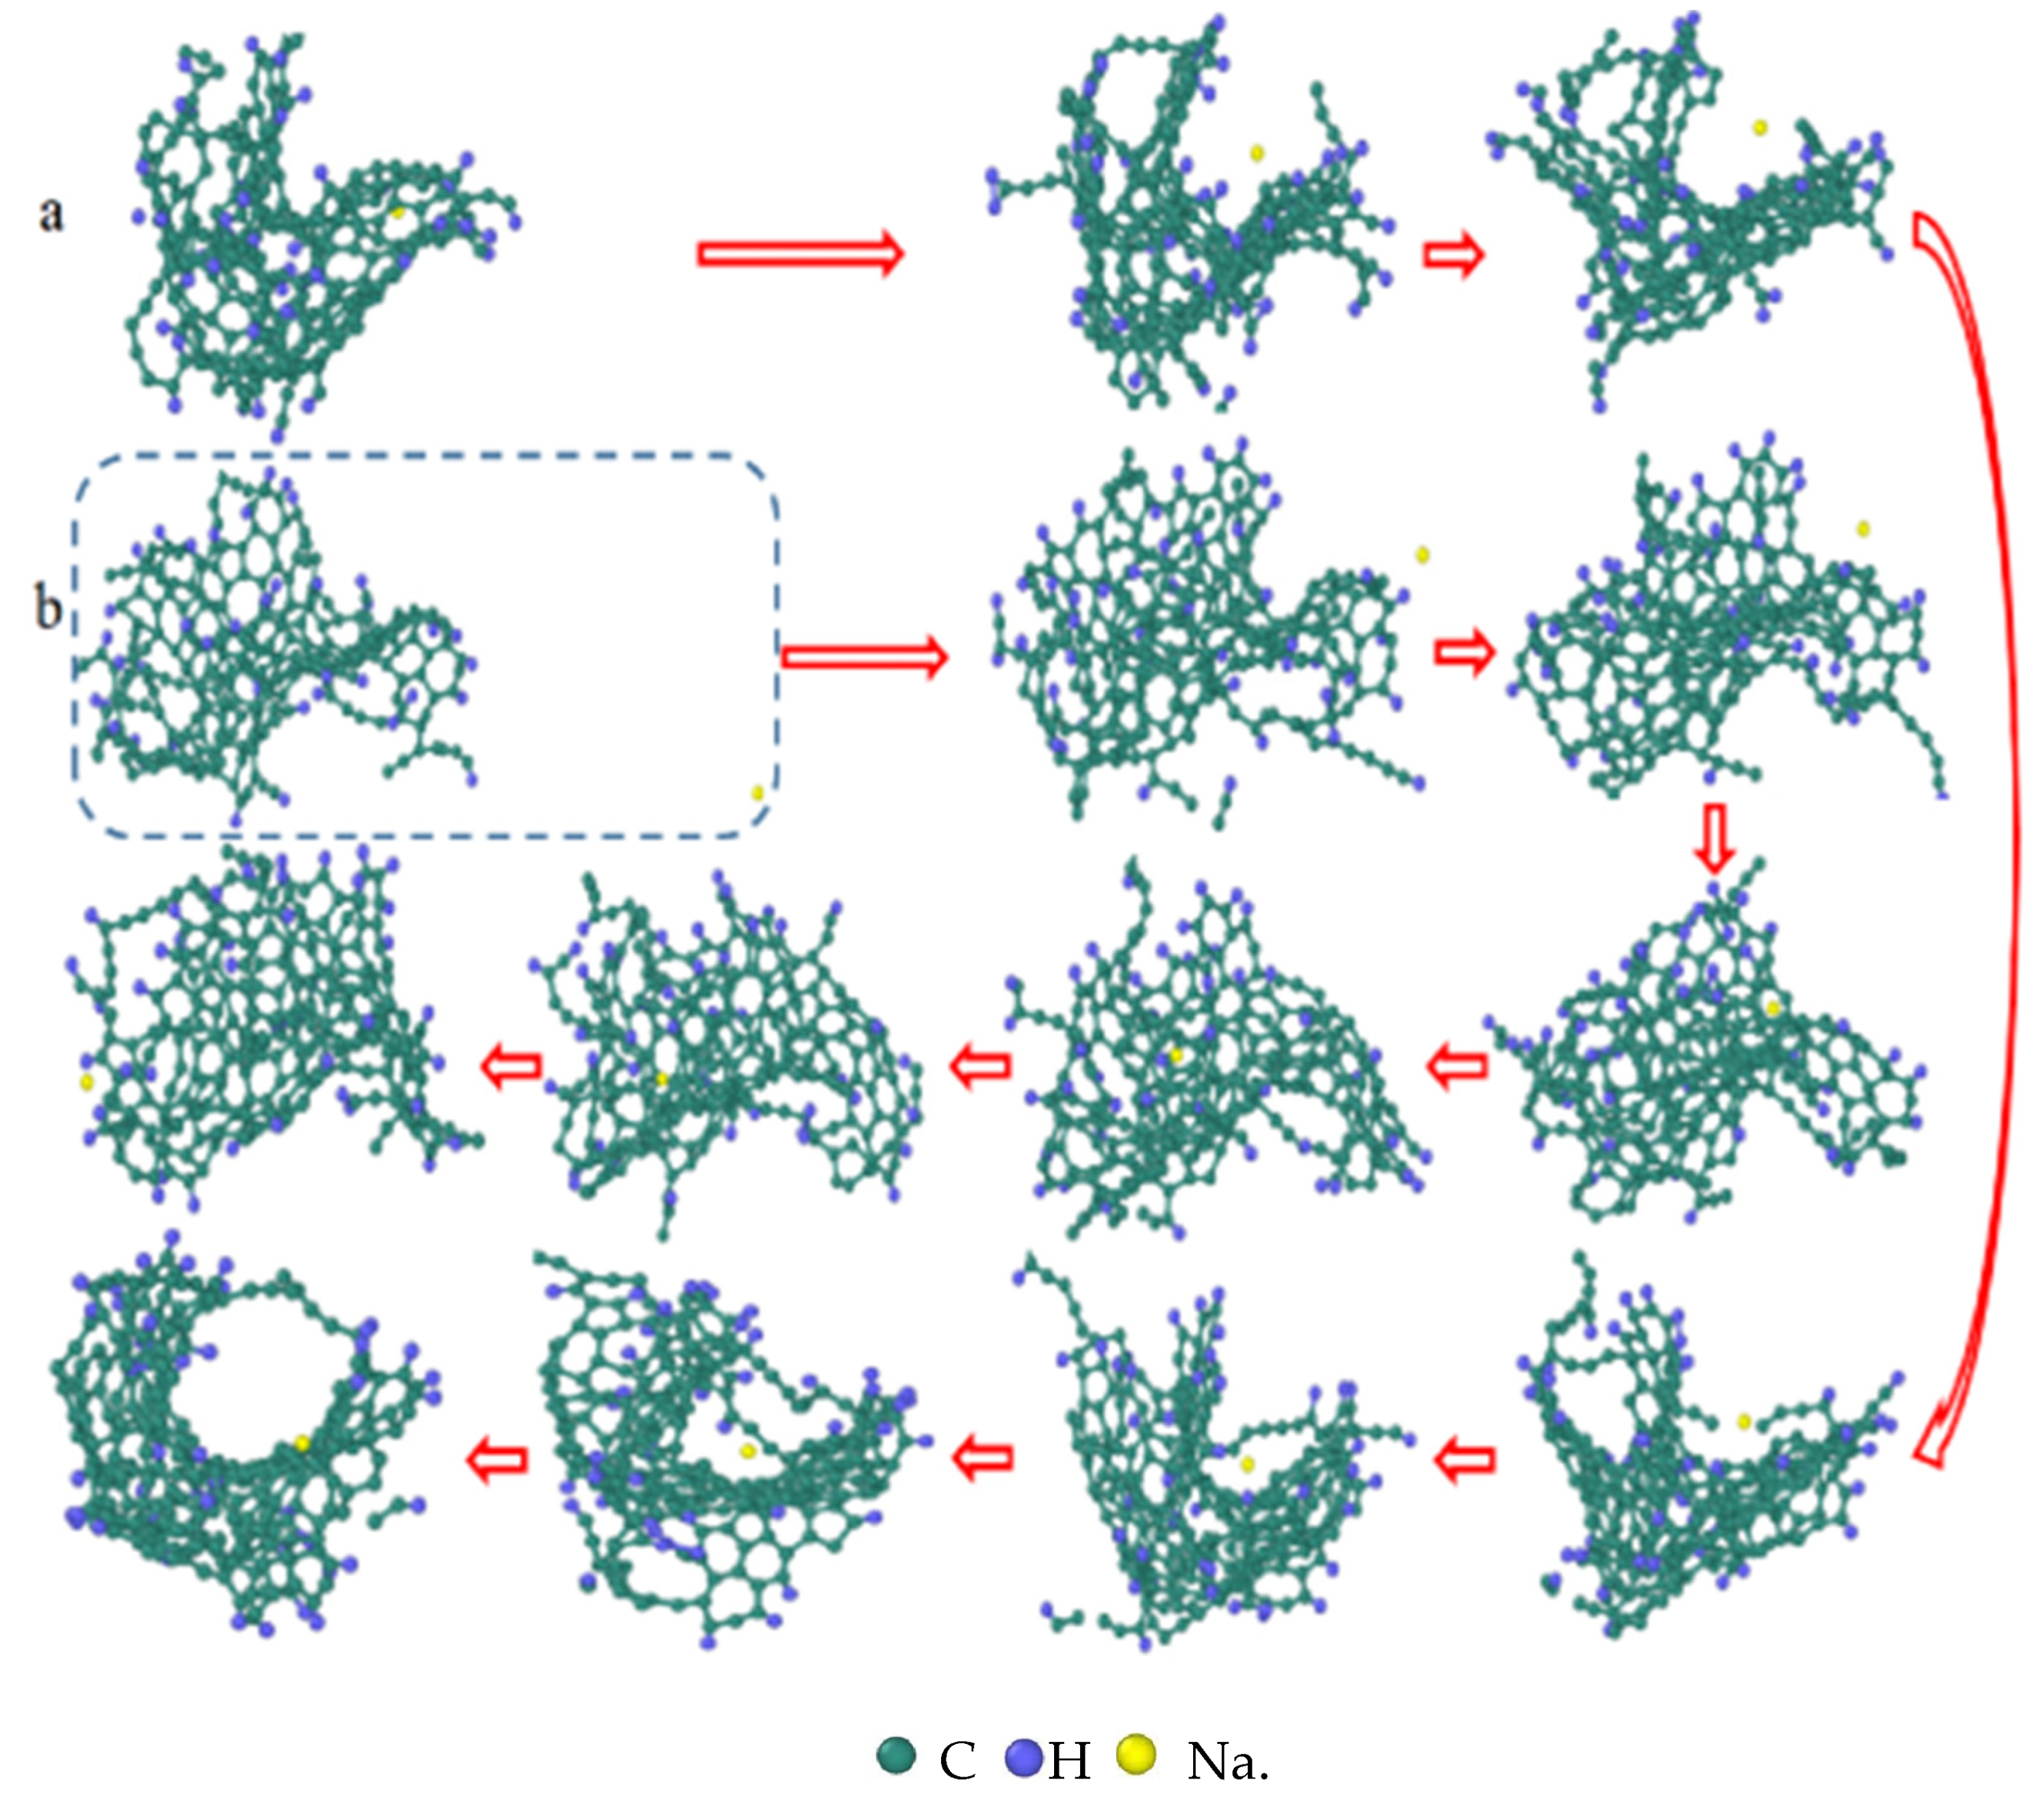
- The third stage: Polymerization and carbonization of macromolecules. Na+ interacts with macromolecular edge C-H, shortens the generation time of the edge carbon active site, and accelerates macromolecular condensation polymerization. The Na+-π structure formed by electropositive Na+ and negative graphite layers improves the bending efficiency of graphite layers. This structure facilitates the formation of spherical particles.
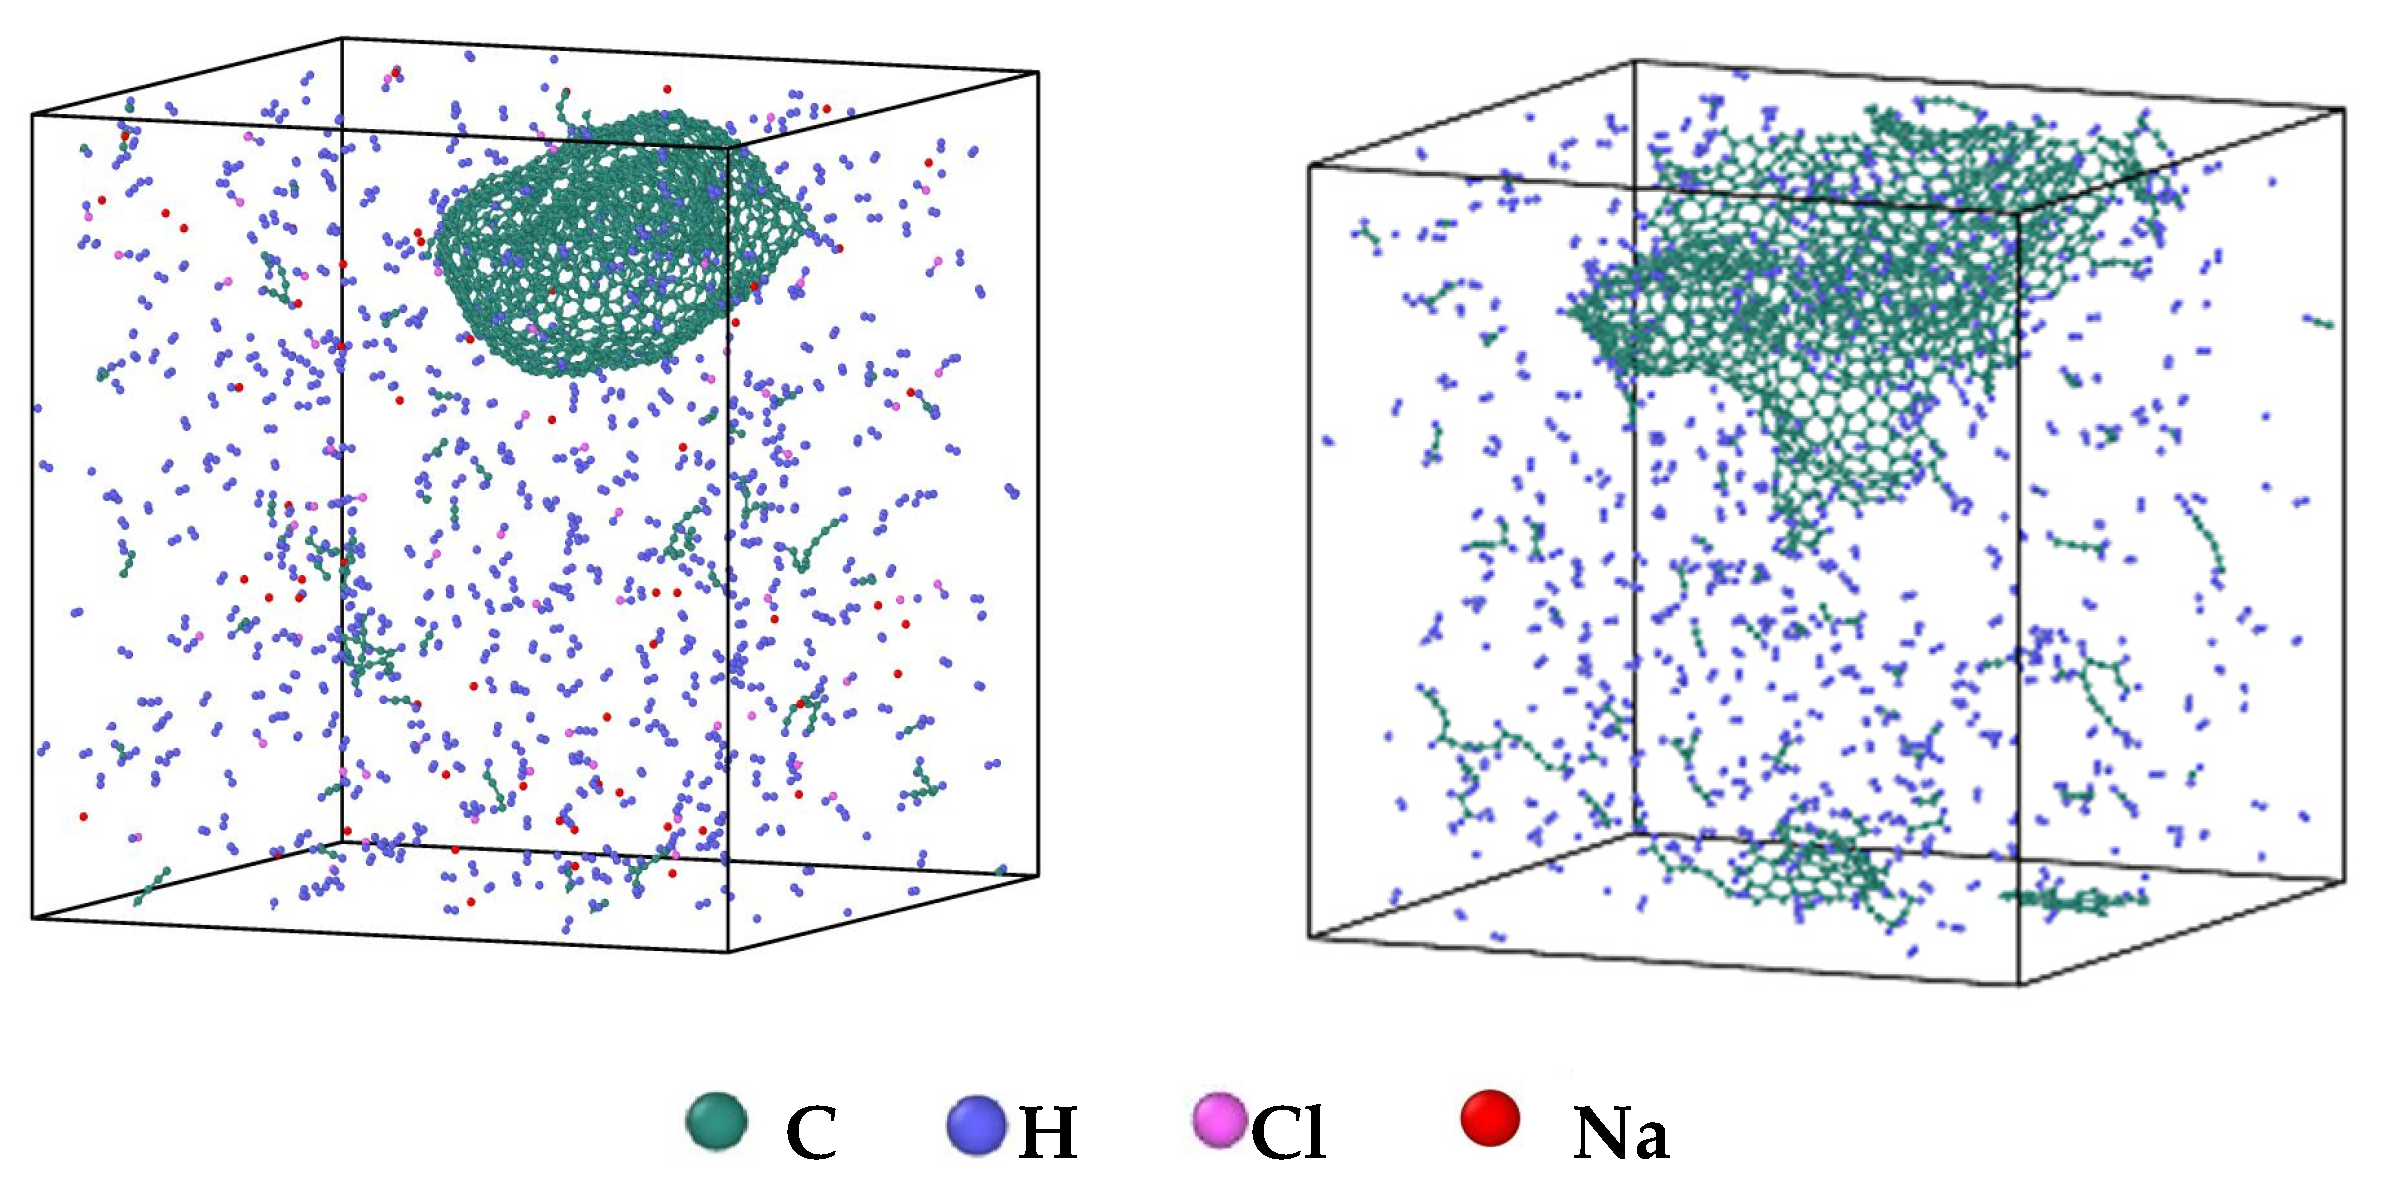
- During a Reaxff MD simulation of 2 ns at 3500 K, NSS is a three-dimensional sphere, while PNS is a two-dimensional layer. It has been confirmed that sodium salts can promote the formation of early soot cores during organic matter pyrolysis.
Supplementary Materials
Author Contributions
Funding
Data Availability Statement
Conflicts of Interest
References
- Gibbins, J.; Chalmers, H. Carbon capture and storage. Energy Policy 2008, 36, 4317–4322. [Google Scholar] [CrossRef]
- Omodolor, I.; Otor, H. Dual Function Materials for CO2 Capture and Conversion: A Review. Ind. Eng. Chem. Res. 2020, 59, 17612–17631. [Google Scholar] [CrossRef]
- Wang, J.; Wang, L. Recent progress in porous organic polymers and their application for CO2 capture. Chin. J. Chem. Eng. 2022, 2, 91–103. [Google Scholar] [CrossRef]
- Chan, F.; Tanksale, A. Review of recent developments in Ni-based catalysts for biomass gasification. Renew. Sustain. Energy Rev. 2014, 38, 428–438. [Google Scholar] [CrossRef]
- Solis, A.; Rocha, S. Preliminary assessment of hazelnut shell biomass as a raw material for pellet production. Fuel 2023, 333, 126517. [Google Scholar] [CrossRef]
- Salid, T.; Gari, A. Case study of autocatalysis reactions on tetra hybrid binary nanofluid flow via Riga wedge: Biofuel thermal application. Case Stud. Therm. Eng. 2023, 47, 103058. [Google Scholar] [CrossRef]
- Li, C.; Suzuki, K. Tar property, analysis, reforming mechanism and model for biomass gasification—An overview. Renew. Sustain. Energy Rev. 2009, 13, 594–604. [Google Scholar] [CrossRef]
- Devi, L.; Ptasinski, K. Catalytic decomposition of biomass tars: Use of dolomite and untreated olivine. Renew. Energy 2005, 30, 565–587. [Google Scholar] [CrossRef]
- Leng, J.; Wang, Z. Advances in nanostructures fabricated via spray pyrolysis and their applications in energy storage and conversion. Chem. Soc. Rev. 2019, 48, 3015–3072. [Google Scholar] [CrossRef] [PubMed]
- Ji, J.; Im, K. Spray pyrolysis-assisted synthesis of hollow cobalt nitrogen-doped carbon catalyst for the performance enhancement of membraneless fuel cells. Int. J. Energy Res. 2021, 46, 760–773. [Google Scholar] [CrossRef]
- Yu, L.; Hu, H. Complex Hollow Nanostructures: Synthesis and Energy-Related Applications. Adv. Mater. 2017, 29, 1604563. [Google Scholar] [CrossRef] [PubMed]
- Li, Y.; Li, X. Distinct impact of cobalt salt type on the morphology, microstructure, and electrochemical properties of Co3O4 synthesized by ultrasonic spray pyrolysis. J. Alloys Compd. 2017, 696, 836–843. [Google Scholar] [CrossRef]
- Geng, H.; Yang, J. Co9S8/MoS2 Yolk-Shell Spheres for Advanced Li/Na Storage. Small 2017, 13, 1603490. [Google Scholar] [CrossRef] [PubMed]
- Im, K.; Kim, D. Hollow-sphere Co-NC synthesis by incorporation of ultrasonic spray pyrolysis and pseudomorphic replication and its enhanced activity toward oxygen reduction reaction. Appl. Catal. B Environ. 2020, 260, 118192. [Google Scholar] [CrossRef]
- Hart, N.; Shi, J. Lithium Sulfide-Carbon Composites via Aerosol Spray Pyrolysis as Cathode Materials for Lithium-Sulfur Batteries. Front. Chem. 2018, 6, 476. [Google Scholar] [CrossRef]
- Oh, S.; Im, K. Spray pyrolysis facilitated construction of carbon nanotube-embedded hollow CoFe electrocatalysts demonstrating excellent durability and activity for the oxygen reduction reaction. J. Alloys Compd. 2023, 944, 169232. [Google Scholar] [CrossRef]
- Yu, M.; Sun, Y. Hollow porous carbon spheres doped with a low content of Co3O4 as anode materials for high performance lithium-ion batteries. Electrochim. Acta 2019, 317, 562–569. [Google Scholar] [CrossRef]
- Warsi, K.; Kaif, K. Evaluating ionic liquids for its potential as eco-friendly solvents for naproxen removal from water sources using COSMO-RS: Computational and experimental validation. Environ. Res. 2023, 231, 116058. [Google Scholar] [CrossRef]
- Dong, H.; Zhang, Y. Effect of different forms of Na and temperature on soot formation during lignite pyrolysis. Fuel 2020, 280, 118514. [Google Scholar] [CrossRef]
- Dong, H.; Du, Q. Impact of Sodium on the Formation Mechanism and Physicochemical Properties of Coal-Derived Soot. Energy Fuels 2020, 34, 1453–1466. [Google Scholar] [CrossRef]
- Feng, D.; Shang, Q. Catalytic mechanism of Na on coal pyrolysis-derived carbon black formation: Experiment and DFT simulation. Fuel Process. Technol. 2021, 224, 107011. [Google Scholar] [CrossRef]
- Chen, Y.; Luo, Z. The promotion effect of pyrolysis conditions on alkali metal pretreatment during pyrolysis of sub-bituminous Zhundong coal: Carbon engulfment control and subsequent sodium transformation. Fuel Process. Technol. 2022, 226, 107067. [Google Scholar] [CrossRef]
- Sun, D.; Li, F. Qualitative and quantitative investigation on adsorption mechanisms of Cd(II) on modified biochar derived from co-pyrolysis of straw and sodium phytate. Sci. Total Environ. 2022, 829, 154599. [Google Scholar] [CrossRef] [PubMed]
- Wang, W.; Lemaire, R. Review on the catalytic effects of alkali and alkaline earth metals (AAEMs) including sodium, potassium, calcium and magnesium on the pyrolysis of lignocellulosic biomass and on the co-pyrolysis of coal with biomass. J. Anal. Appl. Pyrol. 2022, 163, 105479. [Google Scholar] [CrossRef]
- Kim, J.; Yoo, Y. Scalable green synthesis of hierarchically porous carbon microspheres by spray pyrolysis for high-performance supercapacitors. Chem. Eng. J. 2020, 382, 122805. [Google Scholar] [CrossRef]
- Van Duin, A.; Dasgupta, S. ReaxFF: A Reactive Force Field for Hydrocarbons. J. Phys. Chem. A 2001, 105, 9396–9409. [Google Scholar] [CrossRef]
- Chenoweth, K.; van Duin, A.; Goddard, W.A., 3rd. ReaxFF reactive force field for molecular dynamics simulations of hydrocarbon oxidation. J. Phys. Chem. A 2008, 112, 1040–1053. [Google Scholar] [CrossRef]
- Xuan, W.; Wang, H. Exploration on the steam gasification mechanism of waste PE plastics based on ReaxFF-MD and DFT methods. Fuel 2022, 315, 123121. [Google Scholar] [CrossRef]
- Wang, Y.; Gu, M.; Zhu, Y. Analysis of soot formation of CH4 and C2H4 with H2 addition via ReaxFF molecular dynamics and pyrolysis-gas chromatography/mass spectrometry. J. Energy Inst. 2022, 100, 177–188. [Google Scholar] [CrossRef]
- Kowalik, M.; Ashraf, C. Atomistic scale analysis of the carbonization process for C/H/O/N-based polymers with the ReaxFF reactive force field. J. Phys. Chem. B 2019, 123, 5357–5367. [Google Scholar] [CrossRef]
- Purse, M.; Holmes, B. Simulating the complete pyrolysis and charring process of phenol-formaldehyde resins using reactive molecular dynamics. J. Mater. Sci. 2022, 57, 7600–7620. [Google Scholar] [CrossRef]
- Orekhov, N.; Ostroumova, G. High temperature pure carbon nanoparticle formation: Validation of AIREBO and ReaxFF reactive molecular dynamics. Carbon 2020, 170, 606–620. [Google Scholar] [CrossRef]
- Yang, H.; Wang, L. Reactive molecular dynamics simulation in the early stage of naphthalene carbonization. Mol. Simul. 2021, 47, 1282–1289. [Google Scholar] [CrossRef]
- Russo, M.F.; van Duin, A. Atomistic-scale simulations of chemical reactions: Bridging from quantum chemistry to engineering. Nucl. Inst. Methods Phys. Res. B 2011, 269, 1549–1554. [Google Scholar] [CrossRef]
- Bal, K.M.; Neyts, E.C. Merging metadynamics into hyperdynamics: Accelerated molecular simulations reaching time scales from microseconds to seconds. J. Chem. Theory Comput. 2015, 11, 4545–4554. [Google Scholar] [CrossRef]
- Zhang, Z.; Zhang, H. Reactive molecular dynamics simulation of oil shale combustion using the ReaxFF reactive force field. Energ. Source Part A. 2019, 43, 349–360. [Google Scholar] [CrossRef]
- Han, S.; Li, X. Revealing the Initial Chemistry of Soot Nanoparticle Formation by ReaxFF Molecular Dynamics Simulations. Energy Fuels 2017, 31, 8434–8444. [Google Scholar] [CrossRef]
- Montgomery-Walsh, R.; Nimbalkar, S. Molecular dynamics simulation of evolution of nanostructures and functional groups in glassy carbon under pyrolysis. Carbon 2021, 184, 627–640. [Google Scholar] [CrossRef]
- Quyn, D.M.; Wu, H. Volatilisation and catalytic effects of alkali and alkaline earth metallic species during the pyrolysis and gasification of Victorian brown coal. Part I. Volatilisation of Na and Cl from a set of NaCl-loaded samples. Fuel 2002, 81, 143–149. [Google Scholar] [CrossRef]
- Guo, S.; Jiang, Y. Investigations on interactions between sodium species and coal char by thermogravimetric analysis. Fuel 2018, 214, 561–568. [Google Scholar] [CrossRef]
- Kolakkandy, S.; Pratihar, S. Properties of complexes formed by Na(+), Mg(2+), and Fe(2+) binding with benzene molecules. J. Phys. Chem. A 2014, 118, 9500–9511. [Google Scholar] [CrossRef] [PubMed]
- Cao, C.; Xing, L. Diesel soot elimination over potassium-promoted Co3O4 nanowires monolithic catalysts under gravitation contact mode. Appl. Catal. B Environ. 2017, 218, 32–45. [Google Scholar] [CrossRef]
- Xu, L.; Liu, H. Effects of various inorganic sodium salts present in Zhundong coal on the char characteristics. Fuel 2017, 203, 120–127. [Google Scholar] [CrossRef]
- Chen, H.; Zhang, Y. Dipole-moment-driven diesel soot oxidation in the presence of alkali metal chloridesElectronic supplementary information (ESI) available. Catal. Sci. Technol. 2018, 8, 970–974. [Google Scholar] [CrossRef]


| Reaction Equation | OVITO Visualization Capture Structure |
|---|---|
 | |
 | |
 | |
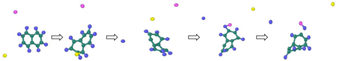 |
 C
C  H
H  Cl
Cl  Na.
Na.| System | Stage 1 (ps) | Stage 2 (ps) | Stage 3 (ps) |
|---|---|---|---|
| NSS | 0–230 | 230–670 | 670–2000 |
| PNS | 0–445 | 445–700 | 700–2000 |
Disclaimer/Publisher’s Note: The statements, opinions and data contained in all publications are solely those of the individual author(s) and contributor(s) and not of MDPI and/or the editor(s). MDPI and/or the editor(s) disclaim responsibility for any injury to people or property resulting from any ideas, methods, instructions or products referred to in the content. |
© 2023 by the authors. Licensee MDPI, Basel, Switzerland. This article is an open access article distributed under the terms and conditions of the Creative Commons Attribution (CC BY) license (https://creativecommons.org/licenses/by/4.0/).
Share and Cite
Wu, D.; Dong, H.; Luan, J.; Du, Q.; Gao, J.; Feng, D.; Zhang, Y.; Zhao, Z.; Li, D. Reaction Molecular Dynamics Study on the Mechanism of Alkali Metal Sodium at the Initial Stage of Naphthalene Pyrolysis Evolution. Energies 2023, 16, 6186. https://doi.org/10.3390/en16176186
Wu D, Dong H, Luan J, Du Q, Gao J, Feng D, Zhang Y, Zhao Z, Li D. Reaction Molecular Dynamics Study on the Mechanism of Alkali Metal Sodium at the Initial Stage of Naphthalene Pyrolysis Evolution. Energies. 2023; 16(17):6186. https://doi.org/10.3390/en16176186
Chicago/Turabian StyleWu, Di, Heming Dong, Jiyi Luan, Qian Du, Jianmin Gao, Dongdong Feng, Yu Zhang, Ziqi Zhao, and Dun Li. 2023. "Reaction Molecular Dynamics Study on the Mechanism of Alkali Metal Sodium at the Initial Stage of Naphthalene Pyrolysis Evolution" Energies 16, no. 17: 6186. https://doi.org/10.3390/en16176186
APA StyleWu, D., Dong, H., Luan, J., Du, Q., Gao, J., Feng, D., Zhang, Y., Zhao, Z., & Li, D. (2023). Reaction Molecular Dynamics Study on the Mechanism of Alkali Metal Sodium at the Initial Stage of Naphthalene Pyrolysis Evolution. Energies, 16(17), 6186. https://doi.org/10.3390/en16176186