Article

Anaerobic Digestion of Spoiled Maize, Lucerne and Barley Silage Mixture with and without Cow Manure: Methane Yields and Kinetic Studies

1
School of Engineering and Built Environment, Nathan Campus, Griffith University, Brisbane, QLD 4111, Australia
2
School of Veterinary Science, The University of Queensland, Gatton, QLD 4343, Australia
*
Author to whom correspondence should be addressed.
Energies 2023, 16(17), 6179; https://doi.org/10.3390/en16176179
Submission received: 20 July 2023 / Revised: 19 August 2023 / Accepted: 21 August 2023 / Published: 25 August 2023
(This article belongs to the Section A4: Bio-Energy)

Abstract

:
The effect of different inoculum-to-substrate ratios (ISRs) and feed mix (FM) ratios on the kinetics of methane production and yields during anaerobic digestion of spoiled silage mixture (SM) alone or co-digestion with cow manure (CM) was investigated in batch experiments at 37 °C. The silage mixture was prepared from spoiled silages of maize, lucerne and barley in equal proportions of 33% by wet weight. The effect of ISRs of 0.5, 1, 2 and 4 showed that methane yields increased with an increased ISR ratio. At ISRs of 1, 2 and 4, methane yields of 262.18 ± 14.96, 387.77 ± 14.43 and 482.23 ± 38.47 NmL CH4/gVSadded were obtained, respectively. Incubation at ISR 0.5 resulted in low methane yields (174.49 ± 9.29 NmL CH4/gVSadded) due to build-up of volatile fatty acids (VFAs). Further, co-digestion of spoiled SM with CM showed that the highest methane yields of 387.77 and 382.86 NmL CH4/gVSadded were obtained at SM:CM feed mix ratios of 100–0 and 75–25, respectively. The corresponding volatile solids (VS) removal rates were 72.80% and 70.82%, respectively. However, the best synergistic effect was noticed at a SM:CM = 50–50 feed mix ratio. Thus, this study shows that anaerobic digestion of spoiled silages is feasible and co-digestion of spoiled silage mixed with cow manure at a SM:CM feed mix ratio of 75–25 is recommended.

1. Introduction

Animal feed often includes crop residues such as wheat straw and annual forage crops. Ensilation is a traditional process practiced for preservation of seasonally harvested forage or energy crops, ensuring a constant supply of feed for animals. In Australia, 5.26 million tonnes per year of hay and silage are produced at 17,938 commercial-scale farms [1]. Silage can be made from annual crops such as wheat, maize, barley and lucerne, etc. However, producing high-quality forage crops as silage and avoiding organic matter losses are challenges.
Wastage of silage during storage and use occurs due to the infrastructural and atmospheric conditions of farms. The reasons for wastage of silage include feedstock composition, silage preparation, silage storage conditions, method of feeding out, palatability, wet weather, etc. [2]. Maintaining optimal storage conditions such as acidic pH and anaerobic conditions is crucial for preserving energy and nutrients in silage [3]. By proper management, the methane yield of crops can be almost completely preserved for up to one year [4]. However, exposure of silage to atmospheric air during opening or feed-out phases triggers the growth of aerobic microbes. Aerobic microbes utilize water-soluble components and other organic substrates, leading to silage deterioration [5]. It has been reported that dry matter loss after 14 days of exposure to air can reach 400 and 300 kg/t for maize and sorghum, respectively [6]. Further, volatile solids (VS) loss due to aerobic spoilage under suboptimal conditions can reach 37% and 52% of the methane yield of grass and ryegrass, respectively [7]. Mould growth in both silage and hay preparation is considered a hazard for both livestock and humans as fungal spores can cause allergies and respiratory distress [8]. Use of silage waste as feedstock for biogas production through anaerobic digestion is considered as an alternate sustainable waste management option for renewable energy generation and for reducing greenhouse gas (GHG) emissions associated with these wastes’ management [9].
Biogas is mainly composed of methane (CH4), carbon dioxide (CO2) and hydrogen sulphide (H2S) with traces of ammonia and water vapour [10]. The produced biogas can be converted into compressed biomethane (bioCNG) for use as vehicle fuel in dual-fuel vehicles and/or for heat and electricity generation in a combined heat and power plant. Further, the nutrient-rich digestate obtained from biogas plants can be used as soil conditioner to recycle nutrients and organic carbon for forage crop production and avoid the GHG emissions associated with the production and use of inorganic fertilisers [11].
Among the factors that affect anaerobic digestion, inoculum-to-substrate ratio (ISR) and feed mix (FM) ratio during anaerobic co-digestion are recognized as critical process optimisation parameters for their practical applicability at large-scale biogas plants. The inoculum type and its quantity are considered as significant factors that affect the hydrolysis and acidification of lignocellulosic feedstocks [12]. There are several studies on biogas production from freshly prepared silage crops alone or co-digested with animal manure [13]. Further, previous studies on co-digestion of manure with energy crops have focused mainly on maize silage and other cereal silages [14], while less attention has been paid to the use of spoiled silage mixtures. Maize silage is considered as an ideal substrate for biogas production at both lab- and farm-scale levels. Methane yields of 0.316 Nm3 CH4/kgVSadded were reported during long-term mono-digestion of maize silage in a lab-scale reactor [15]. Further, co-digestion of maize silage with chicken manure in 5 L reactors reported a methane yield of 0.31 L CH4/gVSadded [16]. However, maize silage was shown to have a slightly lower anaerobic conversion rate than sugar beet silage due to a large number of complex chemicals [17].
There is a growing interest in evaluating the methane potential of different silage mixtures during mono-digestion or co-digestion with manures. For instance, methane yields of 229 mL/gVSadded were obtained during the anaerobic digestion of a mixed silage of waterweeds and wheat straw at an ISR of 2:5:1 [18]. Further, the ratios of silage mixtures have been shown to influence methane yields. For instance, anaerobic digestion of maize silage and white sweet clover at different silage mixtures (maize:white sweet clover ratios of 3:7, 1:1, 7:3, 8:2, 8.5:1.5 and 9:1) showed that methane yields and methane content in biogas decreased when the amount of white sweet clover biomass was increased in the silage mixture [19]. In the above study, the highest methane yield of 0.36 m3/kgVSadded was recorded in maize mono-digestion and in 9:1 maize:white sweet clover co-digestion. On the other hand, the lowest methane yield was recorded in white sweet clover mono-digestion (0.22 m3/kgVSadded). The decrease in methane yields with an increasing share of white sweet clover in the mixed silage was attributed to the increased content of poorly degradable organic substances and the presence of fermentation inhibitors (e.g., coumarin). Therefore, co-digestion of silages with manure was shown to alleviate the potential inhibition and/or provide sufficient buffering capacity. Co-digestion of a mixture of grass silage (GS) and chicken litter (CL) at different GS:CL ratios of 0:1, 1:0, 1:1, 1:2, 1:3, 2:3, 3:2, 3:1 and 2:1 showed that the highest methane yields of 124, 137 and 135 L CH4/kgVSadded were obtained at GS:CL ratios of 1:0, 1:1 and 1:3, respectively [20]. On the other hand, co-digestion of different animal manures with maize silage was shown to achieve maximum VS reduction in a cattle and goat manure and maize silage combination (46.86%), but the maximum methane yield was obtained in a cattle manure and maize silage mixture (215.2 mL CH4/gVSdegraded). The methane yield was increased by adding maize silage compared to not adding an additional maize silage supplement [21].
Literature shows that there are many studies based on mono-digestion of fresh silages or co-digestion of fresh individual silages with animal manures. However, there are no studies on the mono-digestion of a mixture of spoiled silages or co-digestion with cow manure at different silage-to-manure ratios. In this study, the effect of ISR on methane yield from a mixture of spoiled silages consisting of maize, lucerne and barley on an equal wet weight (w/w) basis was determined in batch experiments. In addition, the effect of different feed mix ratios of spoiled silage mixture and cow manure on methane yield was also evaluated.

2. Materials and Methods

Grab samples of silages of lucerne, maize and barley along with fresh cow manure were collected from a dairy farm at Gatton campus, University of Queensland (Toowoomba, Queensland, Australia). The collected samples were transported immediately in sealed containers and stored at 4 °C until further use.
Anaerobically digested material from a full-scale biogas plant treating waste-activated sludge and primary sludge under mesophilic conditions was used as inoculum (Queensland Urban Utilities, Brisbane, Australia). Inoculum was incubated for five days at 37 °C to remove the residual methane. The incubated inoculum was analysed for volatile fatty acids (VFA), total Kjeldahl nitrogen (TKN) and phosphorus (TKP), pH, total solids (TS) and VS to validate the optimal composition of inoculum as outlined elsewhere [22,23].
Cellulose was used as positive control and was obtained from Sigma-Aldrich, Castle Hill, Australia.

2.1. Experimental Set-Up

Two different experimental set-ups were used in this study. In experimental set-up I, the effect of ISR (0.5, 1.0, 2.0 and 4.0) on methane yield of spoiled silages was studied. A biochemical methane potential (BMP) test was performed in glass serum bottles (160 mL) with a working volume of 100 mL. To each assay, 90 mL of inoculum was transferred, and silage mix was added to achieve the desired ISRs of 0.5, 1.0, 2.0 and 4.0 on a VS basis. pH in the assays was adjusted to 7.5 by using a NaOH (5M) solution. Butyl rubber stoppers and aluminium crimps were used to seal the assays. Sealed assays were flushed with N2 (99%) gas for five minutes to create anaerobic conditions. Assays with inoculum only were used as blanks, whilst assays with cellulose only were used as positive controls. Methane production in blank assays was subtracted from that in sample assays. Experiments were conducted in triplicate. The prepared assays were incubated statically at 37 °C in incubators. Biogas production and its composition were measured on a regular basis. The experiments were terminated after 45 days of incubation when the deviation in methane production was less than 5%.
In experimental set-up II, the effect of four different feed mixtures (FM) during the co-digestion of a spoiled silage mixture with cow manure was evaluated in batch experiments, as described elsewhere [22]. Four different FM ratios of silage mixture (SM) to cow manure (CM) were tested: 100–0, 75–25, 50–50, 25–75 and 100–0. The silage mixture consisted of 33.33% w/w of lucerne, corn and barley silages. Similar to experimental set-up I, the assays were prepared and incubated as mentioned above.

2.2. Kinetic Modelling

The hydrolysis rate constant (Khyd) and lag phase of methane production in different assays were estimated by using the first-order kinetic model (Equation (1)), modified Gompertz model (Equation (2)) as described elsewhere [24].
B(t) = B0 [1 − e^(−khyd × t)]
where B(t) is the cumulative methane yield in mL/gVSadded. B0 is the maximum methane production, k is methane production rate constant (day−1) and t is time in days.
B t = B 0 × e x p e x p R max × e G 0 λ t + 1
where Rmax is the highest methane yield rate (mL/gVS. day), t represents the time of the fermentation stage, λ is the period of the lag phase (day), while e is equal to 2.718282. The lag phase is defined as the least time required to generate biogas or the time necessary for the bacteria to adjust to the digestion environment. Rmax defines the exact growth rate of the bacteria. The greater the Rmax is, the better the rate of methane production.
The Chen and Hashimoto model (Equation (3)) predicts the digestion of substrates with significant TS content.
B t = B 0 × 1 K C H H R T × μ m + K C H 1
where HRT is the digestion time or hydraulic retention time (days), KCH is the dimensionless Chen and Hashimoto kinetic constant and µm is the maximum specific growth rate of microorganisms (day−1).

2.3. Theoretical Methane Yield

The Buswell–Neave equation [19], which is derived from the stoichiometric balance between the amount of biodegradable organic matter and gaseous products resulting from its anaerobic biodegradation, was used to estimate the theoretical methane potential. The composition of the organic matter must be known in order to determine the empirical substrate formula for theoretical methane potential estimation. By assuming that all organic material has been transformed into biogas, the theoretical methane potential can be estimated by using Buswell’s equation (Equation (4)):
C c H h N n O o S s   + 1 8   ( 4 c h 2 o + 3 n + 2 s )   H 2 O 1 8   ( 4 c + h 2 o 3 n 2 s )   CH 4 + 1 8   ( 4 c h + 2 o + 3 n + 2 s )   CO 2 + n NH 3 + s H 2 S
Equation (4) was created by balancing the overall conversion of organic material, which mostly results in CH4 and CO2, with water serving as the only external source, as it would under anaerobic conditions. This equation does not take into consideration the nutrients needed for cell maintenance.
The biodegradability index (BI) was calculated as the ratio of experimental methane production to theoretical methane production. Higher digesting efficiency is correlated with a higher biodegradability index.

2.4. Statistical Analysis

Results from the three replicates utilised in the study for the chemical analysis and the methane potential test were provided as average values ± standard errors of the mean. To evaluate the effect of ISR (Equation (4)) and feed ratio (Equation (5)) on methane yields, sample mean methane yields were assessed for significance using one-way analysis of variance (ANOVA) or a t-test with a Tukey’s post-hoc test at a significance level of 0.05 by using IBM SPSS Statistics 26® software.

2.5. Synergistic Effect

Synergistic effect can be calculated by a summation of weighted methane yield of co-digestion—as in an addition of methane yield of silage mix and cow manure multiplied by percentage of silage mix and cow manure in the feed mix as shown in the Equation (5) [25]. The synergistic or antagonistic effect can be determined by using a co-digestion performance index (CPI) which is obtained as the ratio of cumulative methane yield and weighted methane yield and is presented in Equation (6).
Weighted CH4 yield = CH4 yield (silage) × %silage + CH4 yield (cow manure) × %cow manure
Co-digestion Performance Index = Cumulative Methane Yield/Weighted Methane Yield

2.6. Analytical Methods

TS and VS were analysed according to standard methods [26]. pH was monitored by using a pH meter (OHAUS starter300). A gas chromatograph (Agilent technologies 7890A, Santa Clara, CA, USA) fitted with a flame ionisation detector (FID) and an Agilent DB-FFAP column was used to analyse VFAs [27]. Ammonium nitrogen (NH4–N) was analysed by utilising the Lachat QuikChem 8500 Series 2 Flow Injection Analyzer (FIA). TKP and TKN were determined by using the PerkinElmer ICP-OES Optima 7300DV system [28]. Biogas composition (CH4 and CO2) was analysed by using a gas chromatograph (Shimadzu 2014, Sercon Ltd., Crewe, UK) equipped with a thermal conductivity detector (TCD) according to protocol described elsewhere [29]. The amount of total carbon (C) and nitrogen (N) was determined by using a stable isotope analyser (Sercon Hydra 20–22, Sercon Ltd., Crewe, UK) according to methodology published elsewhere [30]. A Flashsmart elemental analyser was used to determine the carbon, hydrogen, nitrogen, oxygen and sulphur content [31]. VFA composition in the liquid phase, i.e., acetic (C2), propionic (C3), butyric and iso-butyric (C4 and iC4), valeric and iso-valeric (C5 and iC5) and caproic (C6) acids, were determined by using a gas chromatograph fitted with a flame ionization detector (FID) as per protocol described elsewhere [32].
Biogas volume in the headspace was calculated according to Equation (7), where headspace is assumed as V1. The methane production potential (defined as CH4 potential) of the substrates is given as the amount of CH4 produced in NmL g/VSadded.
B M P t = m L   C H 4   s a m p l e   a s s a y m L   C H 4   i n o c u l u m   a s s a y V o l a t i l e   s o l i d s s u b s t r a t e
where mL CH4 sample assay − mL CH4 inoculum assay is the net methane volume (mL) obtained from one substrate only, adjusted to the standard temperature (0 °C) and pressure (1 atm) condition (STP); VSadded is the mass of substrate VS in the sample bottle (g).

3. Results and Discussion

3.1. Chemical Composition of Substrates and Inoculum

The chemical composition of the substrates and inoculum is presented in Table 1. Results showed that TS contents of maize, lucerne and barley silages were 88.08%, 87.77% and 84.03% w/w, respectively. The corresponding VS values for silages were 81.94%, 76.23% and 75.98%, respectively. On the other hand, TS and VS contents in cow manure were 14.64% and 11.64% w/w, respectively. The high organic matter and VS/TS ratio of 0.87 to 0.93 noticed for the three silage substrates suggests that these three substrates are rich in organic matter and could be good feedstocks for biogas production. The carbon content in the substrates is within the range of 43 to 48% TS (Table 1). Barley silage had the highest carbon content of 47.39% TS, whilst cow manure had the lowest carbon content of 43.45% TS. The nitrogen content in the substrates was between 1.5 and 4. On the other hand, lucerne silage had the highest nitrogen content while maize silage had the lowest nitrogen content (Table 1). The highest carbon-to-nitrogen (C/N) ratio was noticed in maize silage (28.96) followed by barley silage, cow manure and lucerne silage. A low C/N ratio in substrates may result in ammonia accumulation during anaerobic digestion, leading to an increase in pH (>8.5) and inhibition of methanogenic bacteria activity [33]. A high C/N ratio, on the other hand, leads to low biogas production as methanogens consume the nitrogen swiftly. The ideal C/N ratio for anaerobic digestion ranges from 10 to 40, with 20–30:1 being the optimal C/N ratio for wet anaerobic digestion [34]. Thus, mixing the three silage materials might achieve an ideal C/N ratio.
The concentrations of TKN and TKP in the substrates are presented in Table 1. TKN values ranged from 17.2 gN/kgTS in maize silage to 35.7 gN/kgTS in lucerne silage. Conversely, barley silage had the highest TKP (12.23 gN/kgTS).
The three silage materials were mixed at 33% each w/w and the sample was used for determining the elemental carbon, hydrogen, nitrogen, oxygen and sulphur content. The results are presented in Table 2. The results showed that CHNOS contents in the silage mixture were lower than that of cow manure.

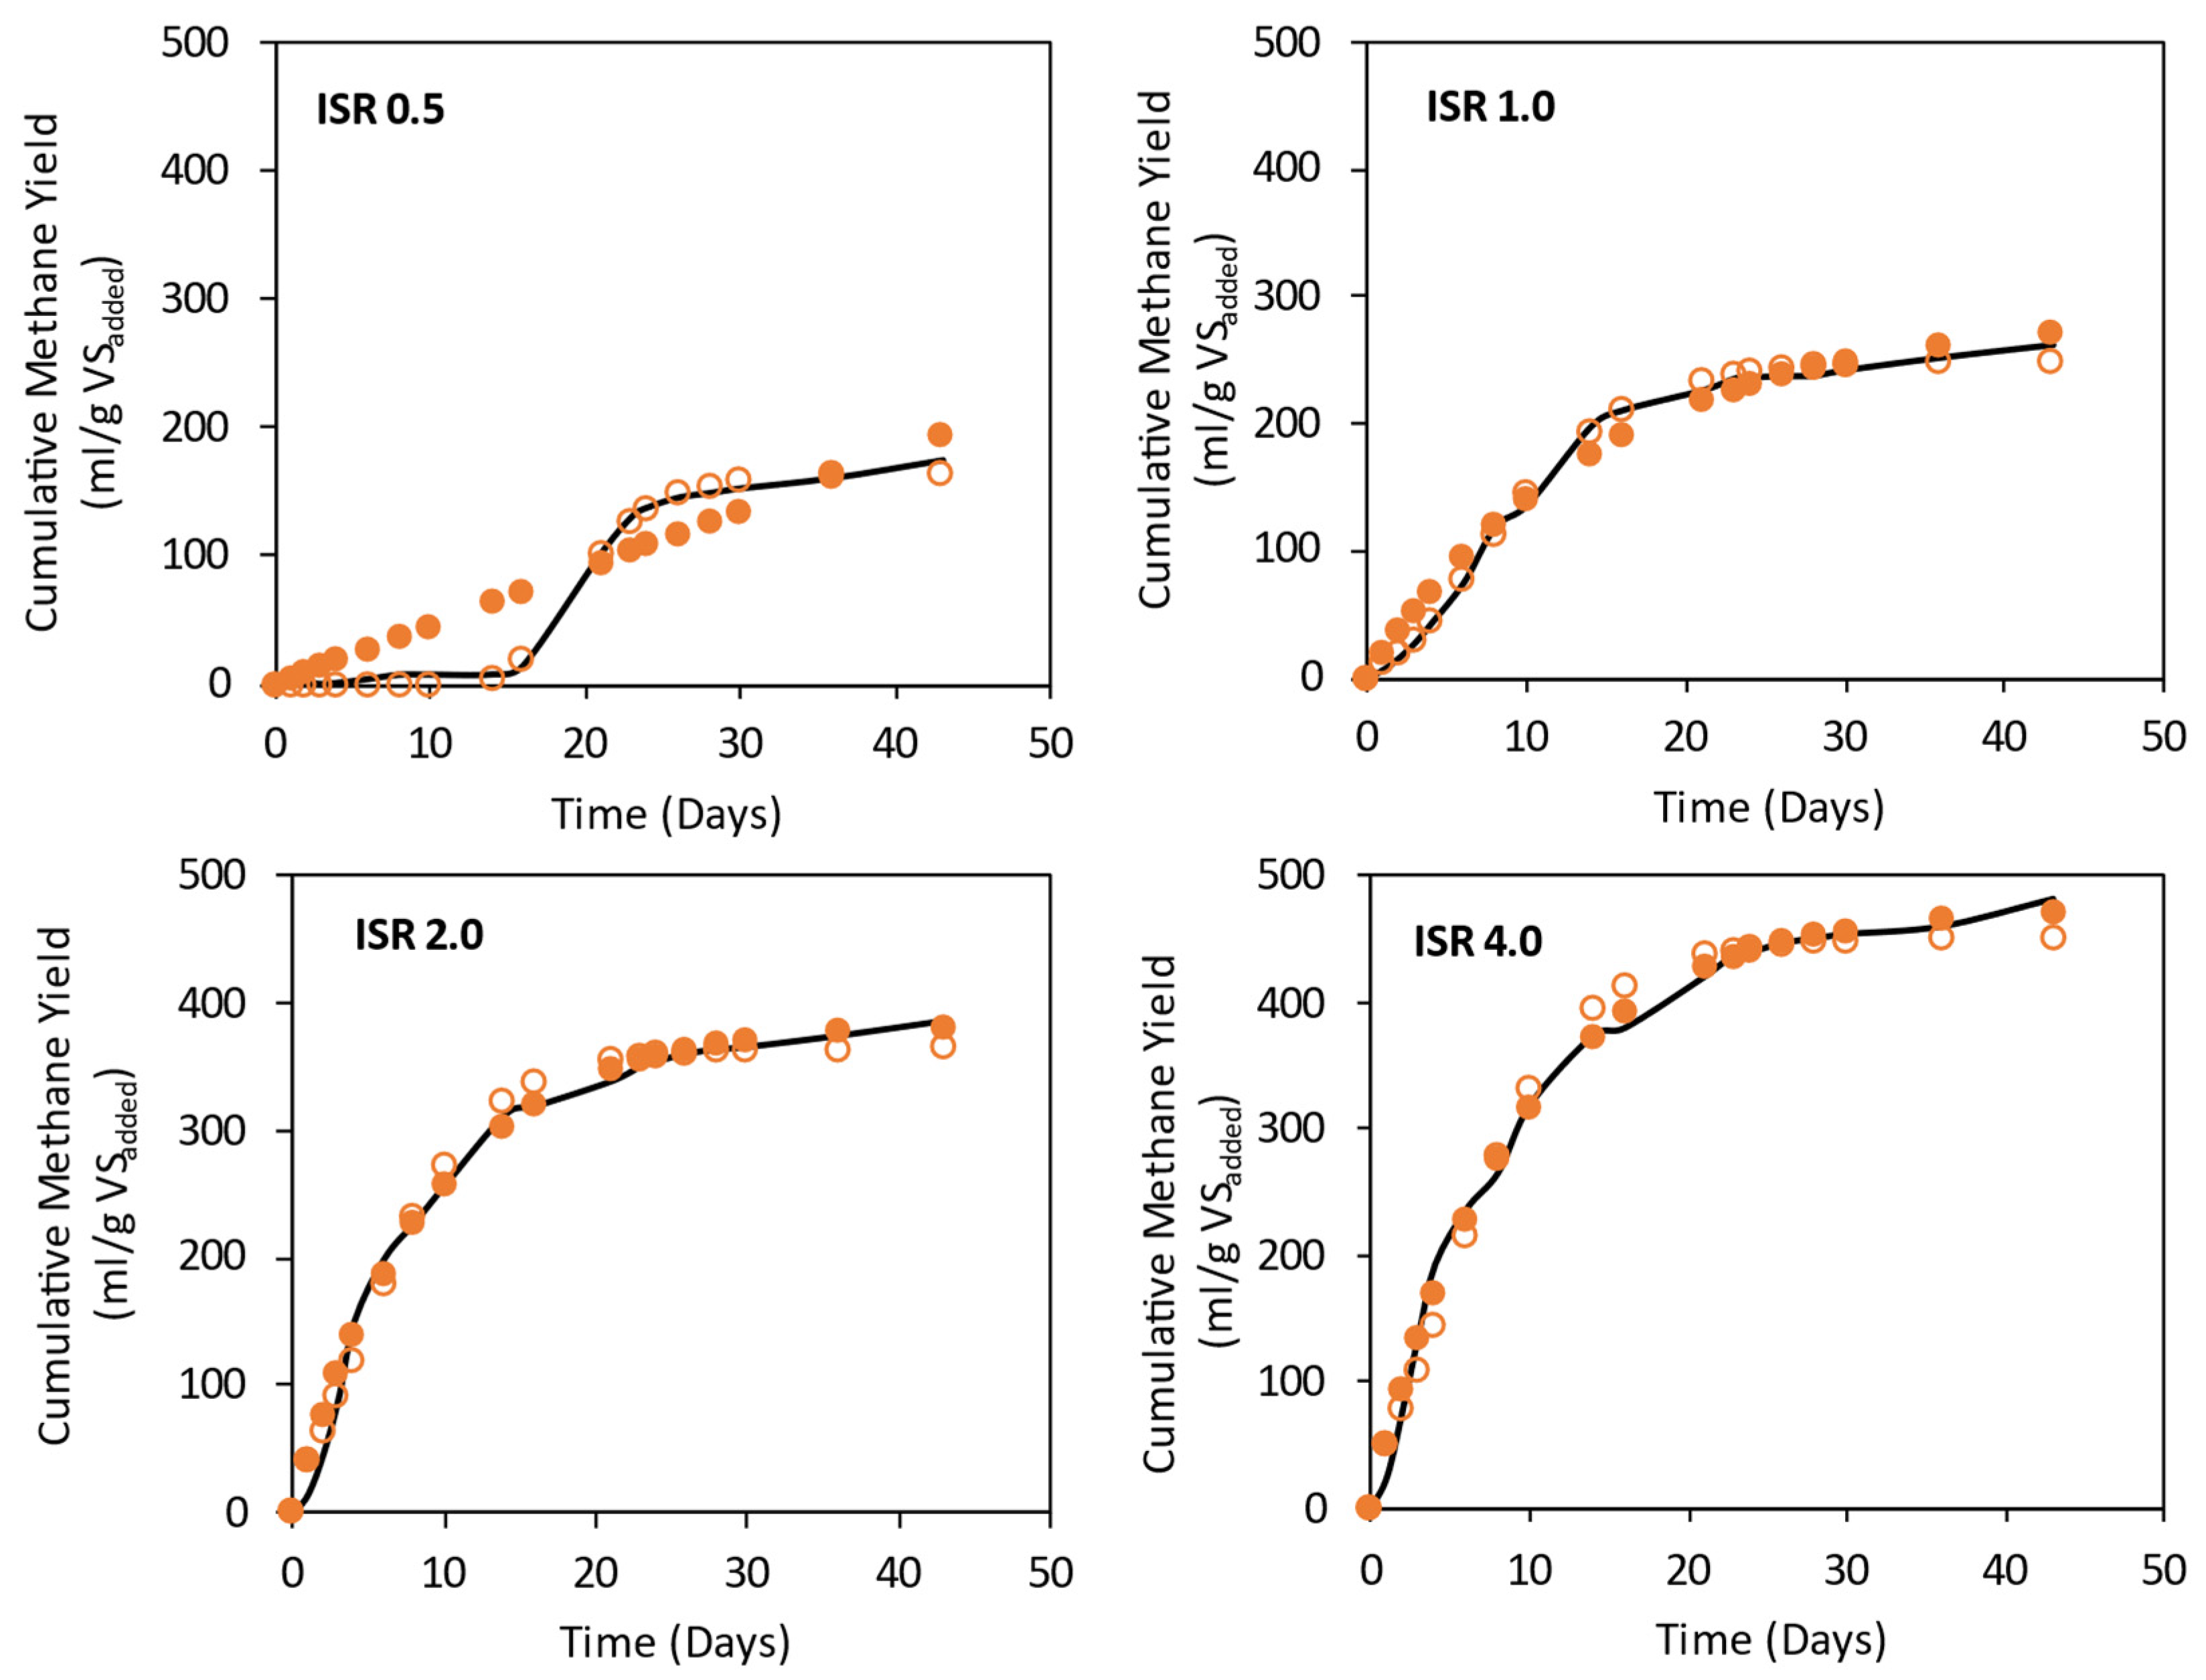
3.2. Effect of ISR on Methane Yields for Mono-Digestion of Spoiled Silage Mixture

The effect of four different ISRs (0.5, 1, 2 and 4) on methane production rates and yields during the anaerobic mono-digestion of spoiled silage mixture is presented in Figure 1. Methane production started immediately at ISRs of 4 and 2 and was delayed by 1 day at an ISR of 1.0 and by 15 days at an ISR of 0.5. Higher methane production rates and yields were noticed with increase in ISR from 0.5 to 4.0. The maximum methane yields of 174.49 ± 9.29, 262.18 ± 14.96, 387.77 ± 14.43 and 482.23 ± 38.47 NmL/gVSadded were obtained at ISRs of 0.5, 1, 2 and 4, respectively. Interestingly, the variation in methane yields among the triplicate assays was higher at a higher ISR than at a lower ISR (Figure 1). It should be noted that an amount of substrate equal to that of VS was used in respective triplicates. Further, digested material from a biogas plant treating sewage sludge was used as inoculum and was degassed by incubation at 37 °C for 5 days. Methane yields obtained from inoculum and cellulose at an ISR of 2 (positive control) were 217.18 ± 16.92 and 357.90 ± 26.45 NmL/gVSadded, respectively. Therefore, care must be taken in the selection of an inoculum source to conduct the BMP of lignocellulosic substrates such as silages. Further, the existence of a pertinent microbial population in correct proportion is essential for complete degradation of lignocellulosic substrates. Use of an optimal ISR for a specific substrate ensures the maximisation of substrate conversion and realises ultimate methane yields, B0 [35]. Moset et al. demonstrated that inoculum source and the amount of the inoculum added, i.e., ISR ratio, clearly affect the biodegradability of maize silage [36]. In their study, the effect of the ISR in the range of 0.25–2.5 on a VS basis was studied and the results showed that the optimal ISR range for maize silage was 1.0–1.5. Higher methane yields without any process inhibition, noticed in the present study at higher ISRs of 2 and 4 than at 0.5 and 1, were in accordance with previous studies [37]. Further, ISR was found to affect the methane production rate or hydrolysis rate of lignocellulosic substrates [38]. Thus, substrate composition, through ensilation, was shown to affect biodegradability and B0 [39].
The low methane yields at ISRs of 0.5 and 1 could be due to overload, the unfavourable condition wherein the amount of substrate is too high such that microorganisms cannot convert or utilise it either during the hydrolysis, acidogenesis or methanogenesis stages. This was evident from the lower (negative) methane production noticed during the initial 15 days at an ISR of 0.5 compared to the blank (Figure 1). The obvious reason for this discrepancy is due to higher methane production from blanks than assays and when the methane from the blanks was subtracted from that of the assays, this resulted in negative methane yield from the assays. Lack of methanogens may typically lead to VFA build-up and a subsequent lowering of the pH due to acidification. It has been shown that methanogenesis is typically inhibited when pH drops below 6.5 [40]. Similarly, lack of hydrolytic microorganisms can also lead to an inefficient hydrolysis of the substrate especially for lignocellulosic substrates, where hydrolysis is considered as the rate-limiting step [41]. Thus, ISRs of 2 and 4 could provide sufficient inoculum and were able to process high concentration metabolites such as hydrogen, acetate and VFA [40]. This result is in accordance with previous studies [12,42]. In a study by Raposo et al. [42], the methane yields of sunflower oil cake decreased from 227 ± 23 to 107 ± 11 mL CH4/gVSadded with decreases in ISRs from 3.0, 2.0, 1.5, 1.0 and 0.8 to 0.5 by using inoculum from an industrial anaerobic reactor treating brewery wastewater. Similarly, a decrease in methane yields from 521.9, 519.5, 475.0 and 332.4 mL/gTSadded at ISRs of 4, 3, 2, and 1, respectively, was also reported [12]. The results, thus, suggest that BMP assays for mixed spoiled silages consisting of 33% w/w of maize, lucerne and barley should be carried out at ISRs higher than 2 in order to obtain a more representative result of methane production and yields.

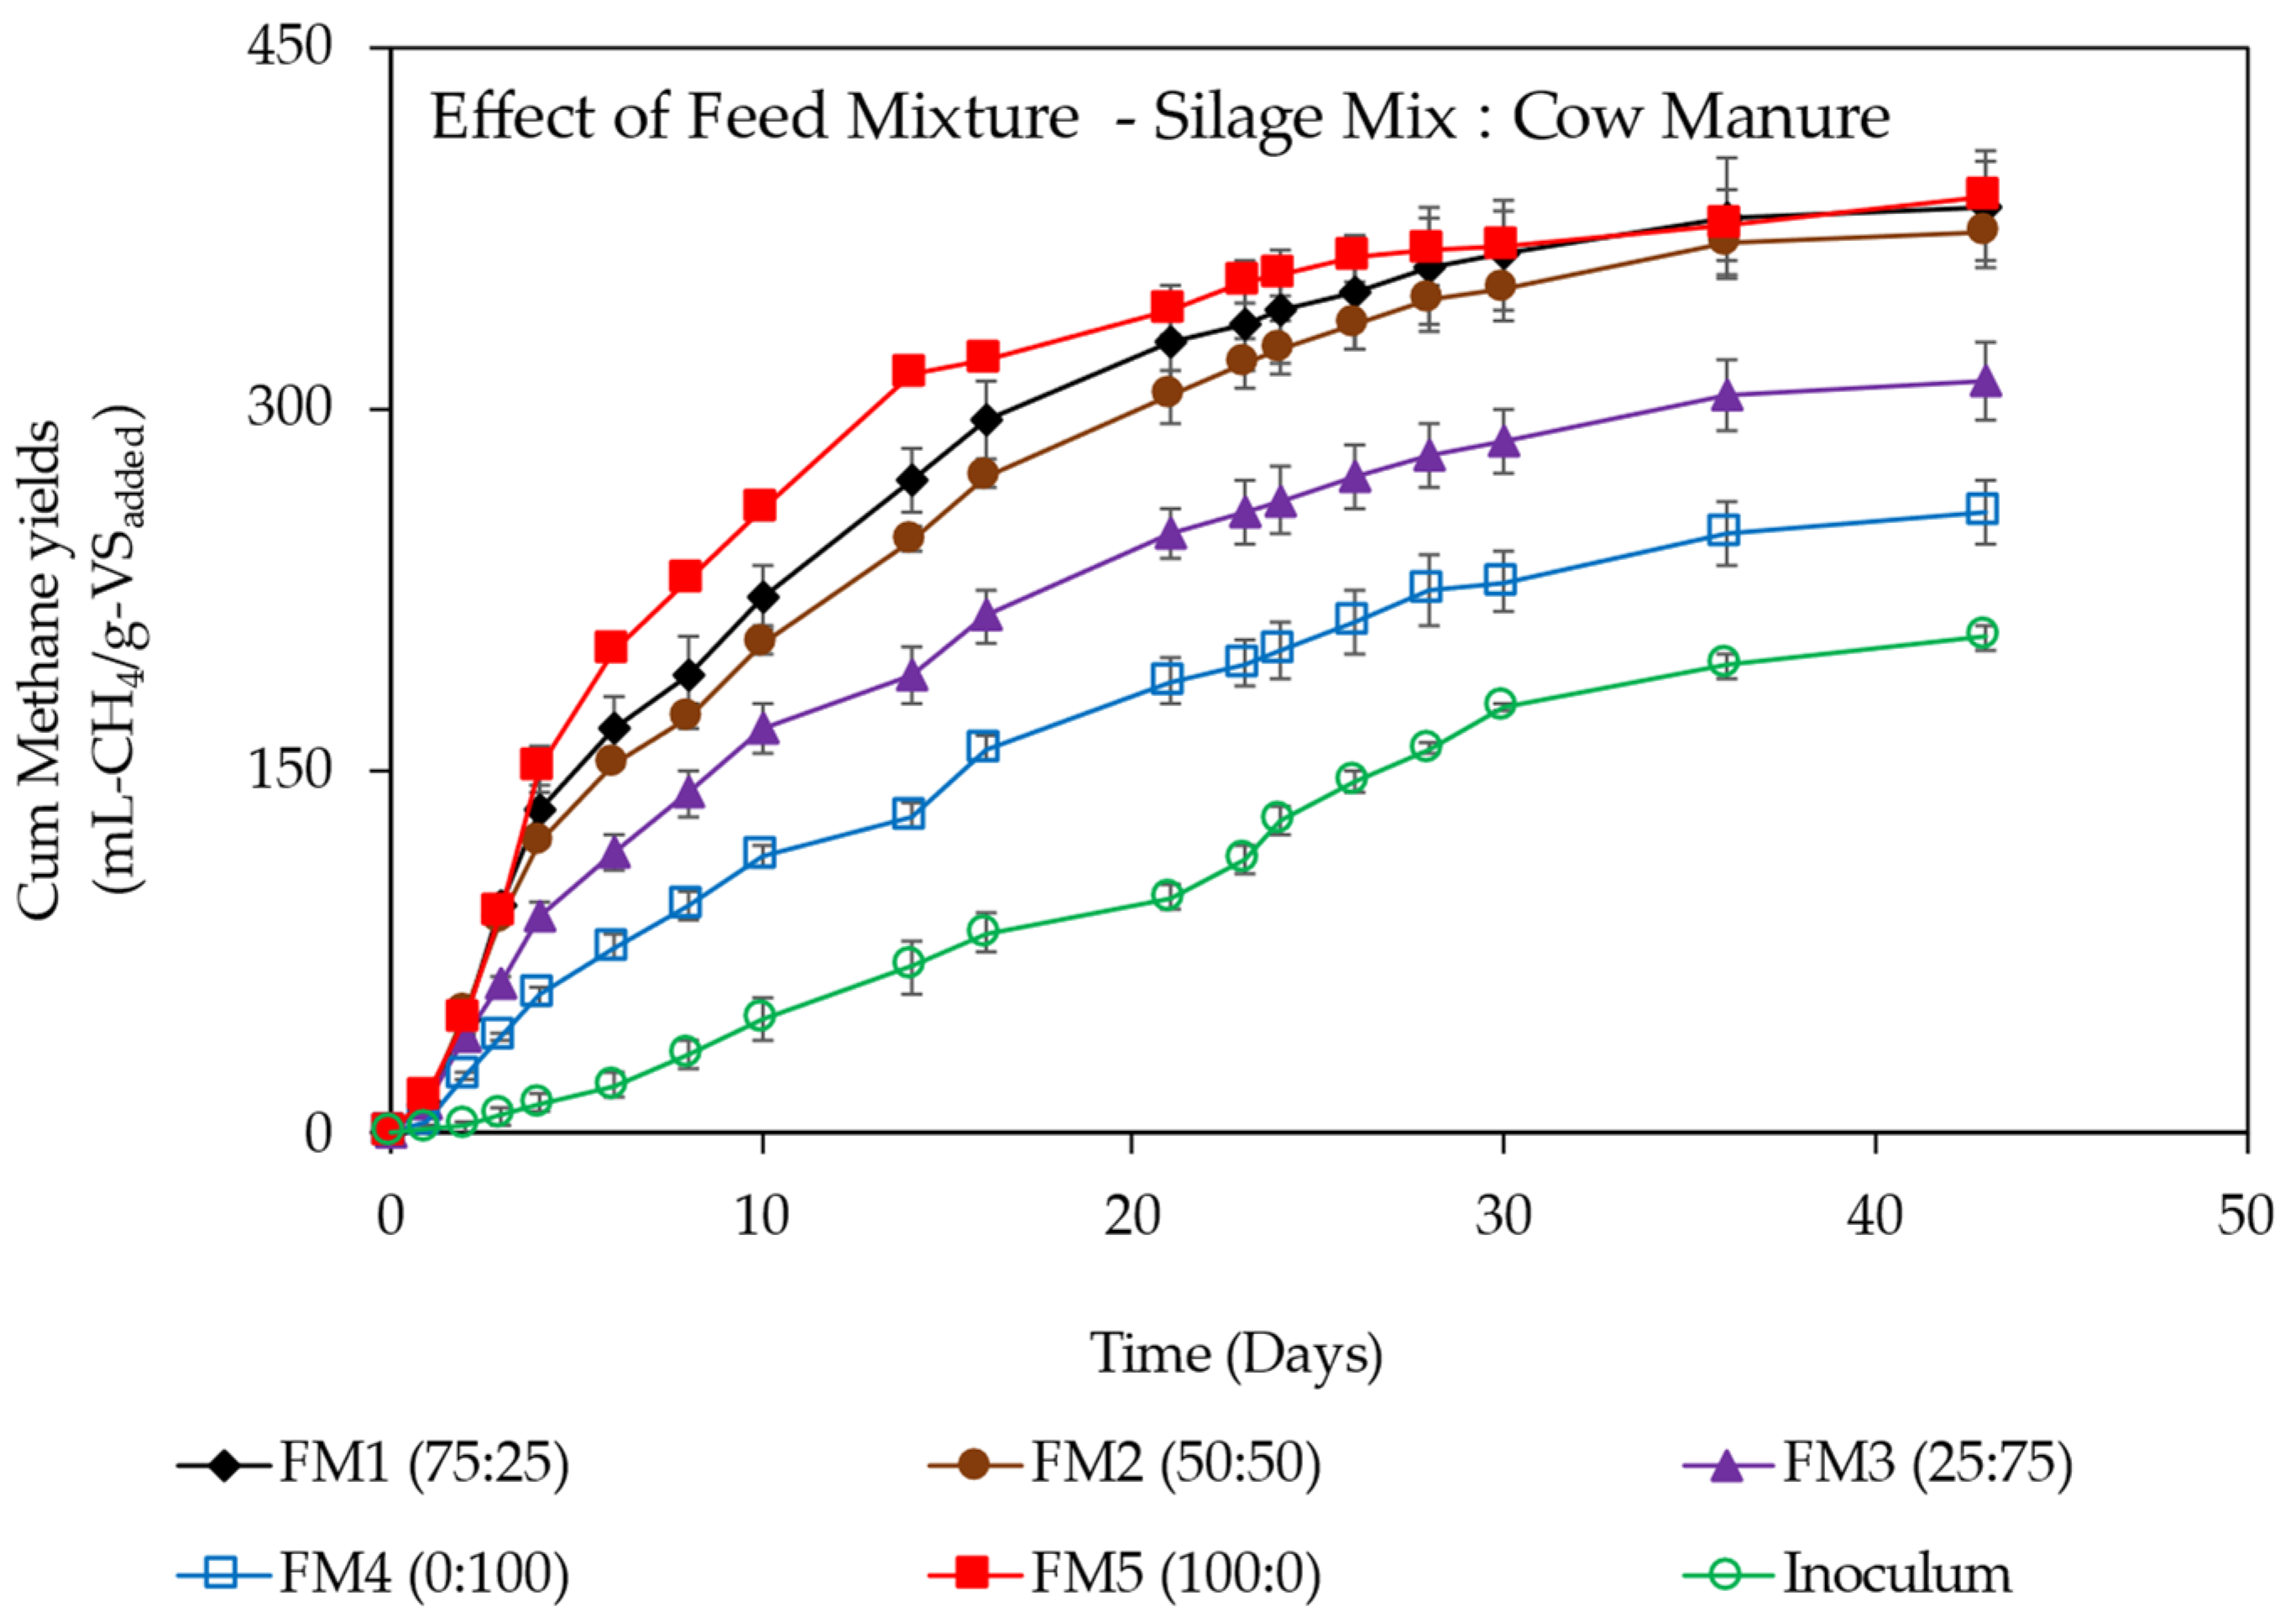
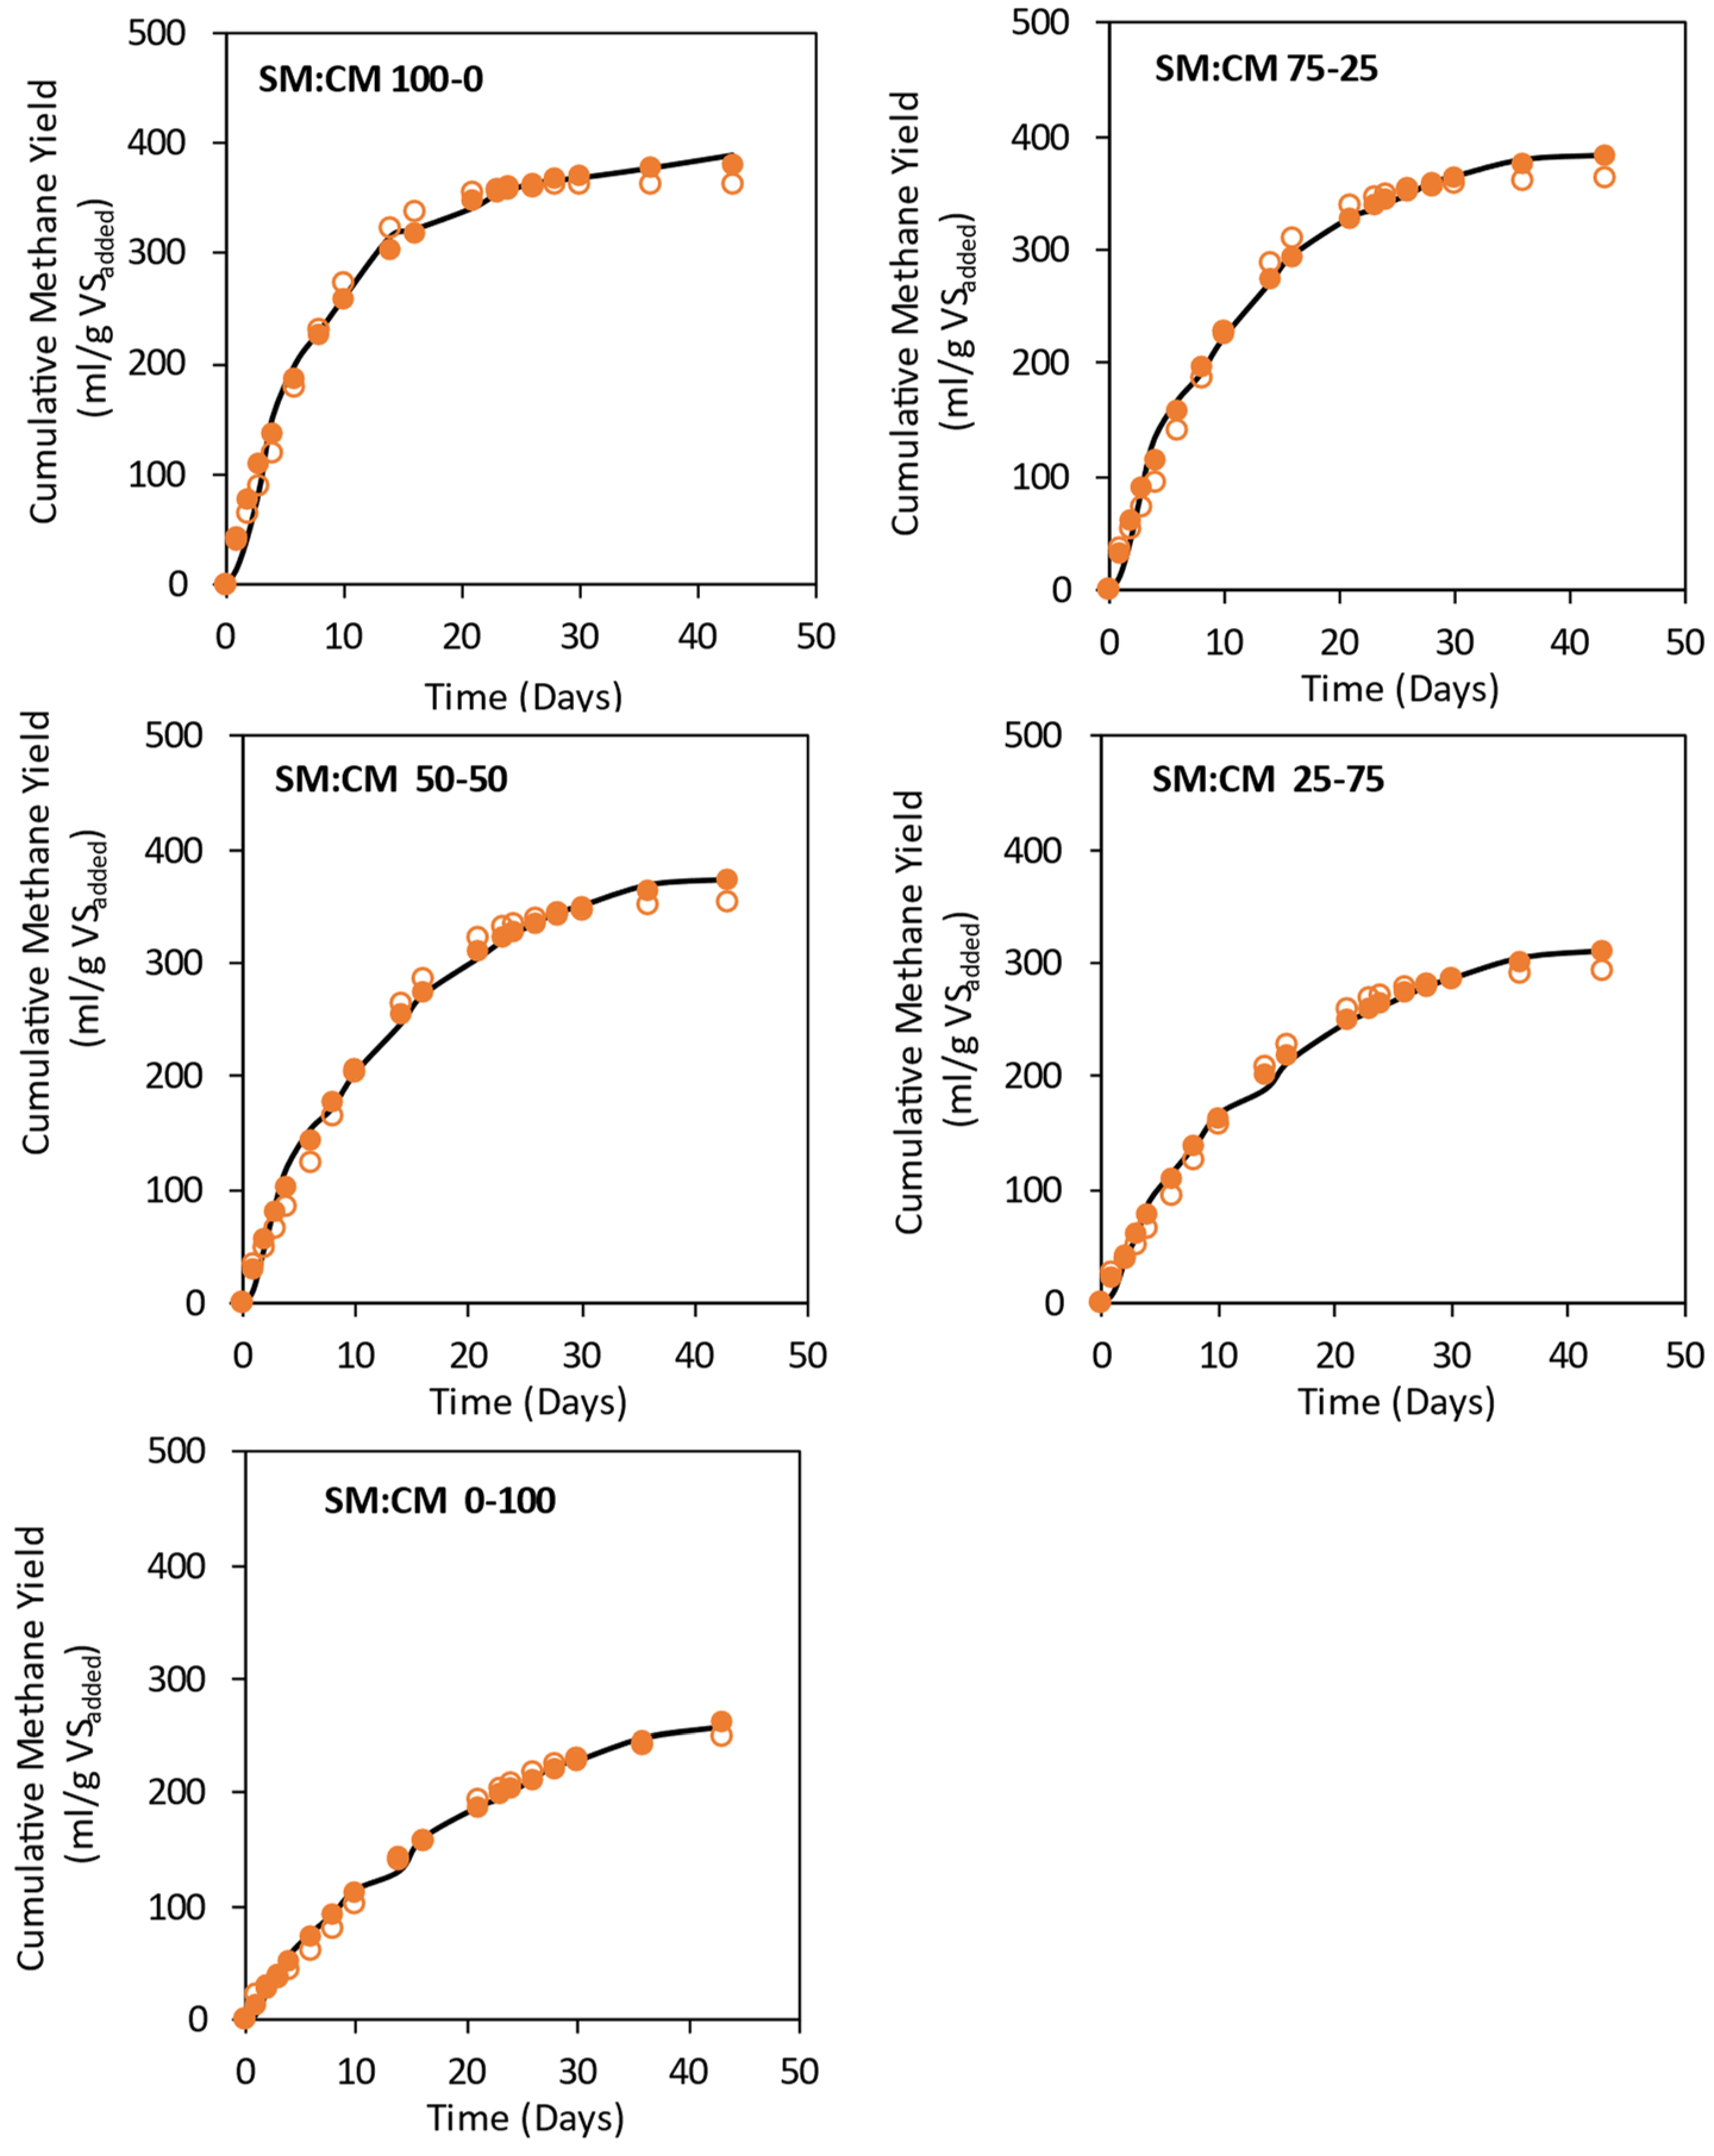
3.3. Effect of Feed Mix Ratios on Methane Yields for Co-Digestion of Spoiled Silage Mix with Cow Manure

The effect of five feed mix ratios during the anaerobic co-digestion of the spoiled silage mixture with cow manure is presented in Figure 2. The experiment was terminated after 42 days of incubation (Figure 2). At all tested feed ratios, methane production started after an initial lag phase of 1 day. Thereafter, methane production increased steadily (between days 2 and 10) and further increased after day 14. Overall, methane production rates and yields were noticed to decrease with an increase in the amount of cow manure in the feed mix. The maximum methane yields obtained were 387.77 ± 14.43, 382.86 ± 24.63, 373.19 ± 11.79, 311.26 ± 16.49 and 257.40 ± 12.76 NmL/gVSadded at SM:CM feed mix ratios of 100:0, 75:25, 50:50, 25:75 and 0:100, respectively. The two-phase methane production rates noticed in all assays were attributed to the presence of readily biodegradable organic substances from cow manure and less biodegradable organic substances from lignocellulosic substrates. The sharp increase in methane yields after day 14 indicates the hydrolysis and subsequent methanogenesis of less biodegradable lignocellulosic substrates and/or enrichment of methanogens in the assays. At the end of the experiment (day 43), methane production declined, indicating the degradation of soluble biodegradable organic substances.
The lowest methane yield noticed at a SM:CM feed mix ratio of 0:100 was obviously due to the low solids content of cow manure and its inherent deficiency in carbon, i.e., a low C/N ratio [43]. In general, low C/N ratios (less than 15) and a lack of carbon may cause ammonia–N build-up and, thus, prevent methanogenesis [44]. On the other hand, the increase in methane yields with an increase in the SM:CM feed mix ratio from 25:75 to 100:00 was due to a progressive increase in carbon substrate in the assays. Previously, addition of carbon-rich substrates such as lignocellulosic feedstocks to cow manure has been reported to improve methane yields with an increase in the amount of carbon [45]. However, if the C/N ratio is too high, the amount and buffering capacity of manure are not sufficient to avoid acidification and lead to N deficiency [46]. For instance, anaerobic co-digestion of concentrated pig manure (PM) with grass silage (GS) at five different PM:GS ratios of 1:0, 3:1, 1:1, 1:3 and 0:1 on a VS basis showed that hydrolysis constant linearly decreased when increasing the fraction of GS and the amount of methane produced decreased as the percentage of cow manure increased in the feed mix [47]. The above study recommended a PM-to-GS co-digestion ratio of 1:1 as the ideal feed mix ratio due to a high methane yield (304.2 mL CH4/gVSadded) and a short lag phase. In a similar study, anaerobic co-digestion of cow manure and barley at a mixing ratio of 2:1 (216 mL CH4/gVSadded) resulted in lower methane yields than at 1:1 (230 mL CH4/gVSadded) [48]. It should be noted that the chemical composition of the substrates in the present study showed that cow manure and lucerne silage had a lower C/N ratio than maize or barley silages. Therefore, co-digestion of lucerne silage with high C/N substrates can achieve the required C/N ratio of 20–30 [49].

3.4. Effect of ISR and Feed Mix Ratio on Chemical Composition of Digestates

Table 3 presents the chemical composition of digestates obtained at the end of the experiments. Chemical composition of the digestates revealed that ISR had a profound effect on methane yields. pH in all assays (except for an ISR of 0.5) was 7.4–7.5, indicating that there was no build-up of VFAs in the assays. Contrary, the pH in assays for an ISR of 0.5 was 7.2. Among the tested ISRs, TKN values increased with increases in ISR: from a low 17.5 gN/kgTS for an ISR of 0.5 to maximum value of 61.9 gN/kgTS at an ISR of 4. Conversely, NH4–N levels decreased from 1606 mg/L at an ISR of 0.5 to 1414 mg/L at an ISR of 4. The increase in NH4–N levels with concomitant decreases in TKN indicates ammonification of nitrogen-containing substrates [50].
The chemical composition of digestates at the end of the feed mix experiment is shown in Table 3. Among the tested ratios, a SM:CM feed mix ratio of 50–50 had the highest NH4–N and TKN concentrations. The high NH4–N content in the digestates was mainly contributed by inoculum (Table 1). The NH4–N concentrations in the digestates were below the threshold concentration of 3000 mg/L that induces inhibition during anaerobic digestion processes [51]. Temperature, pH and TAN concentration determine the free ammonia concentration, and an increase in pH results in a significant rise in free ammonia concentration [52]. According to Table 3, a SM:CM feed mix ratio of 50–50 had the highest pH, TKN, NH4–N and TKP concentration across the feed mix ratios.

3.5. VS Removal

VS removal rates at different ISRs and feed mix ratios are shown in Table 3. Overall, VS removal rate was proportional to the cumulative methane yield. For the ISR experiment, incubation at a higher ISR led to higher methane yields and VS removal rates. ISRs of 2 and 4 resulted in the highest VS removal rates of 75.10% and 67.37%, respectively. The corresponding values at ISRs of 0.5 and 1 were 52.50% and 65.08%, respectively. The high VS removal at ISRs of 2 and 4 was induced by the large amount of inoculum, which provided sufficient buffering capacity and could process large amounts of intermediate metabolites such as hydrogen, acetate and VFAs [40]. Conversely, low VS removal rates at ISRs of 1 and 0.5 could be due to overload and unfavourable conditions, where there was too much substrate such that the amount of inoculum could not convert it into methane. Lack of methanogens typically leads to VFA accumulation and subsequent accumulation of VFAs. Further, lack of hydrolytic microorganisms also brought about inefficient hydrolysis of the substrates, especially for lignocellulosic substrates. A similar trend was also noticed with feed mix experiment. VS removal rates decreased with increases in the cow manure ratio from 72.18% noticed in a SM:CM ratio of 100–0 to 0–100 (Table 4).

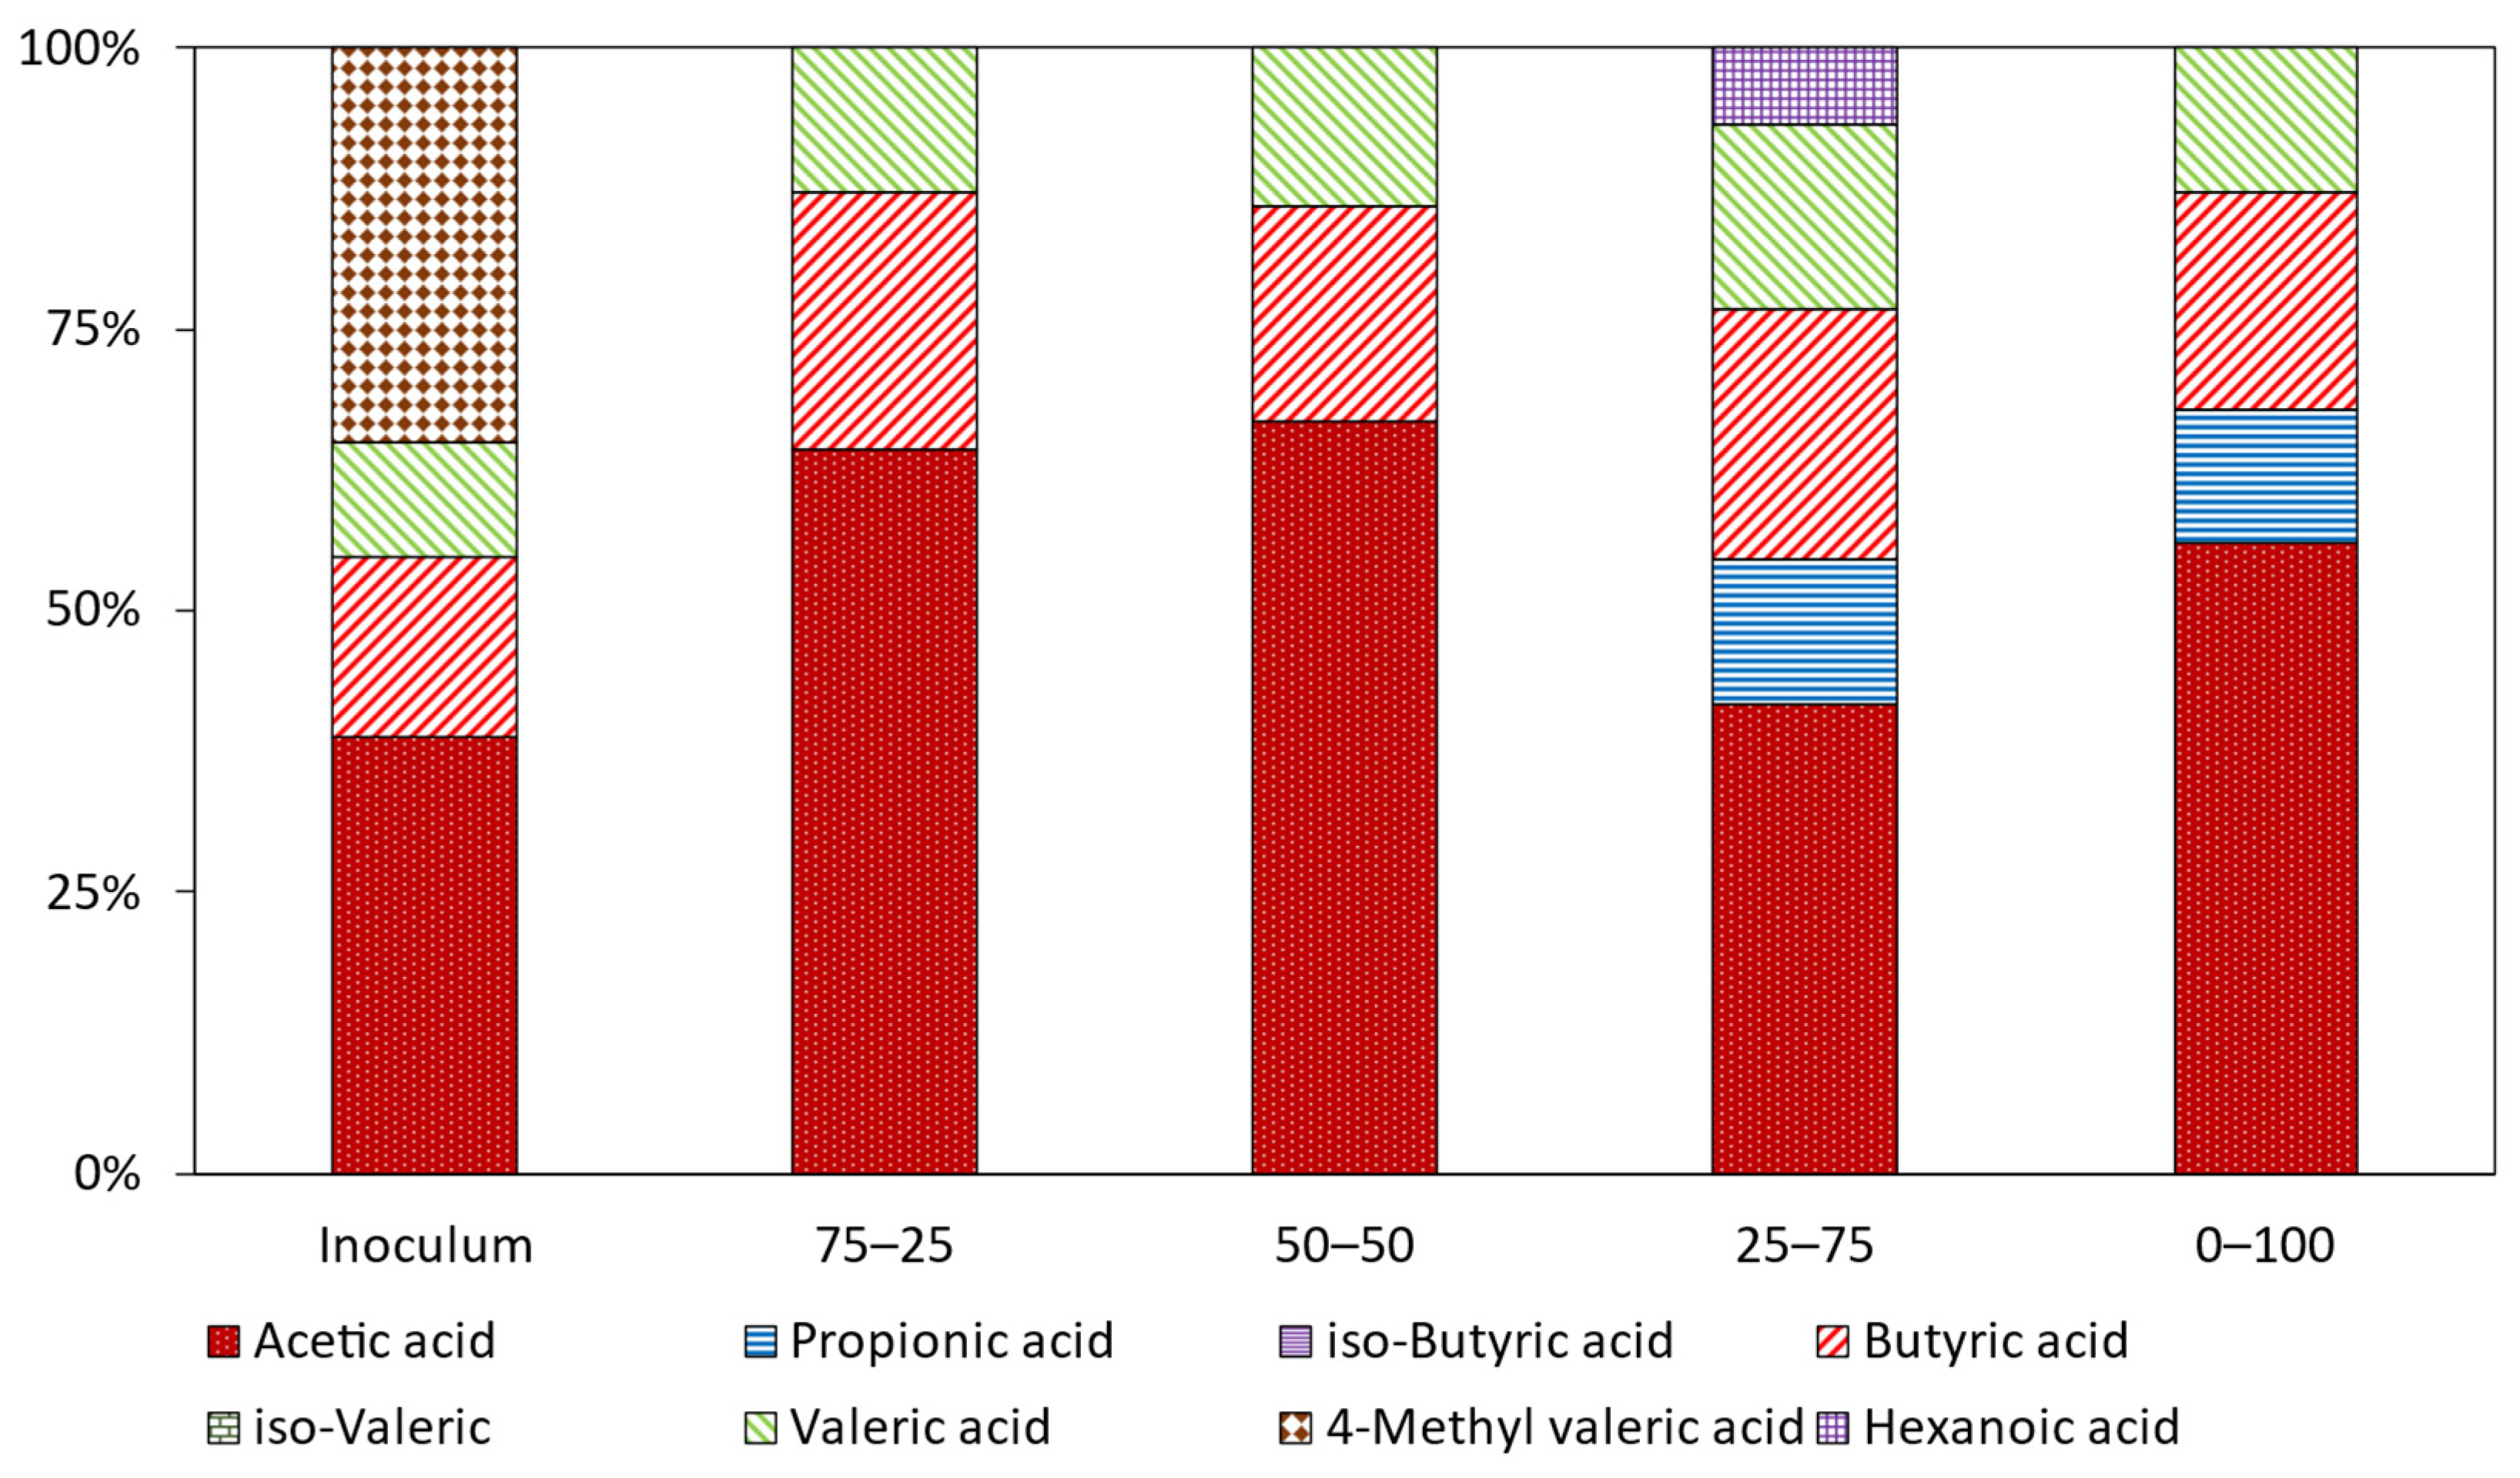
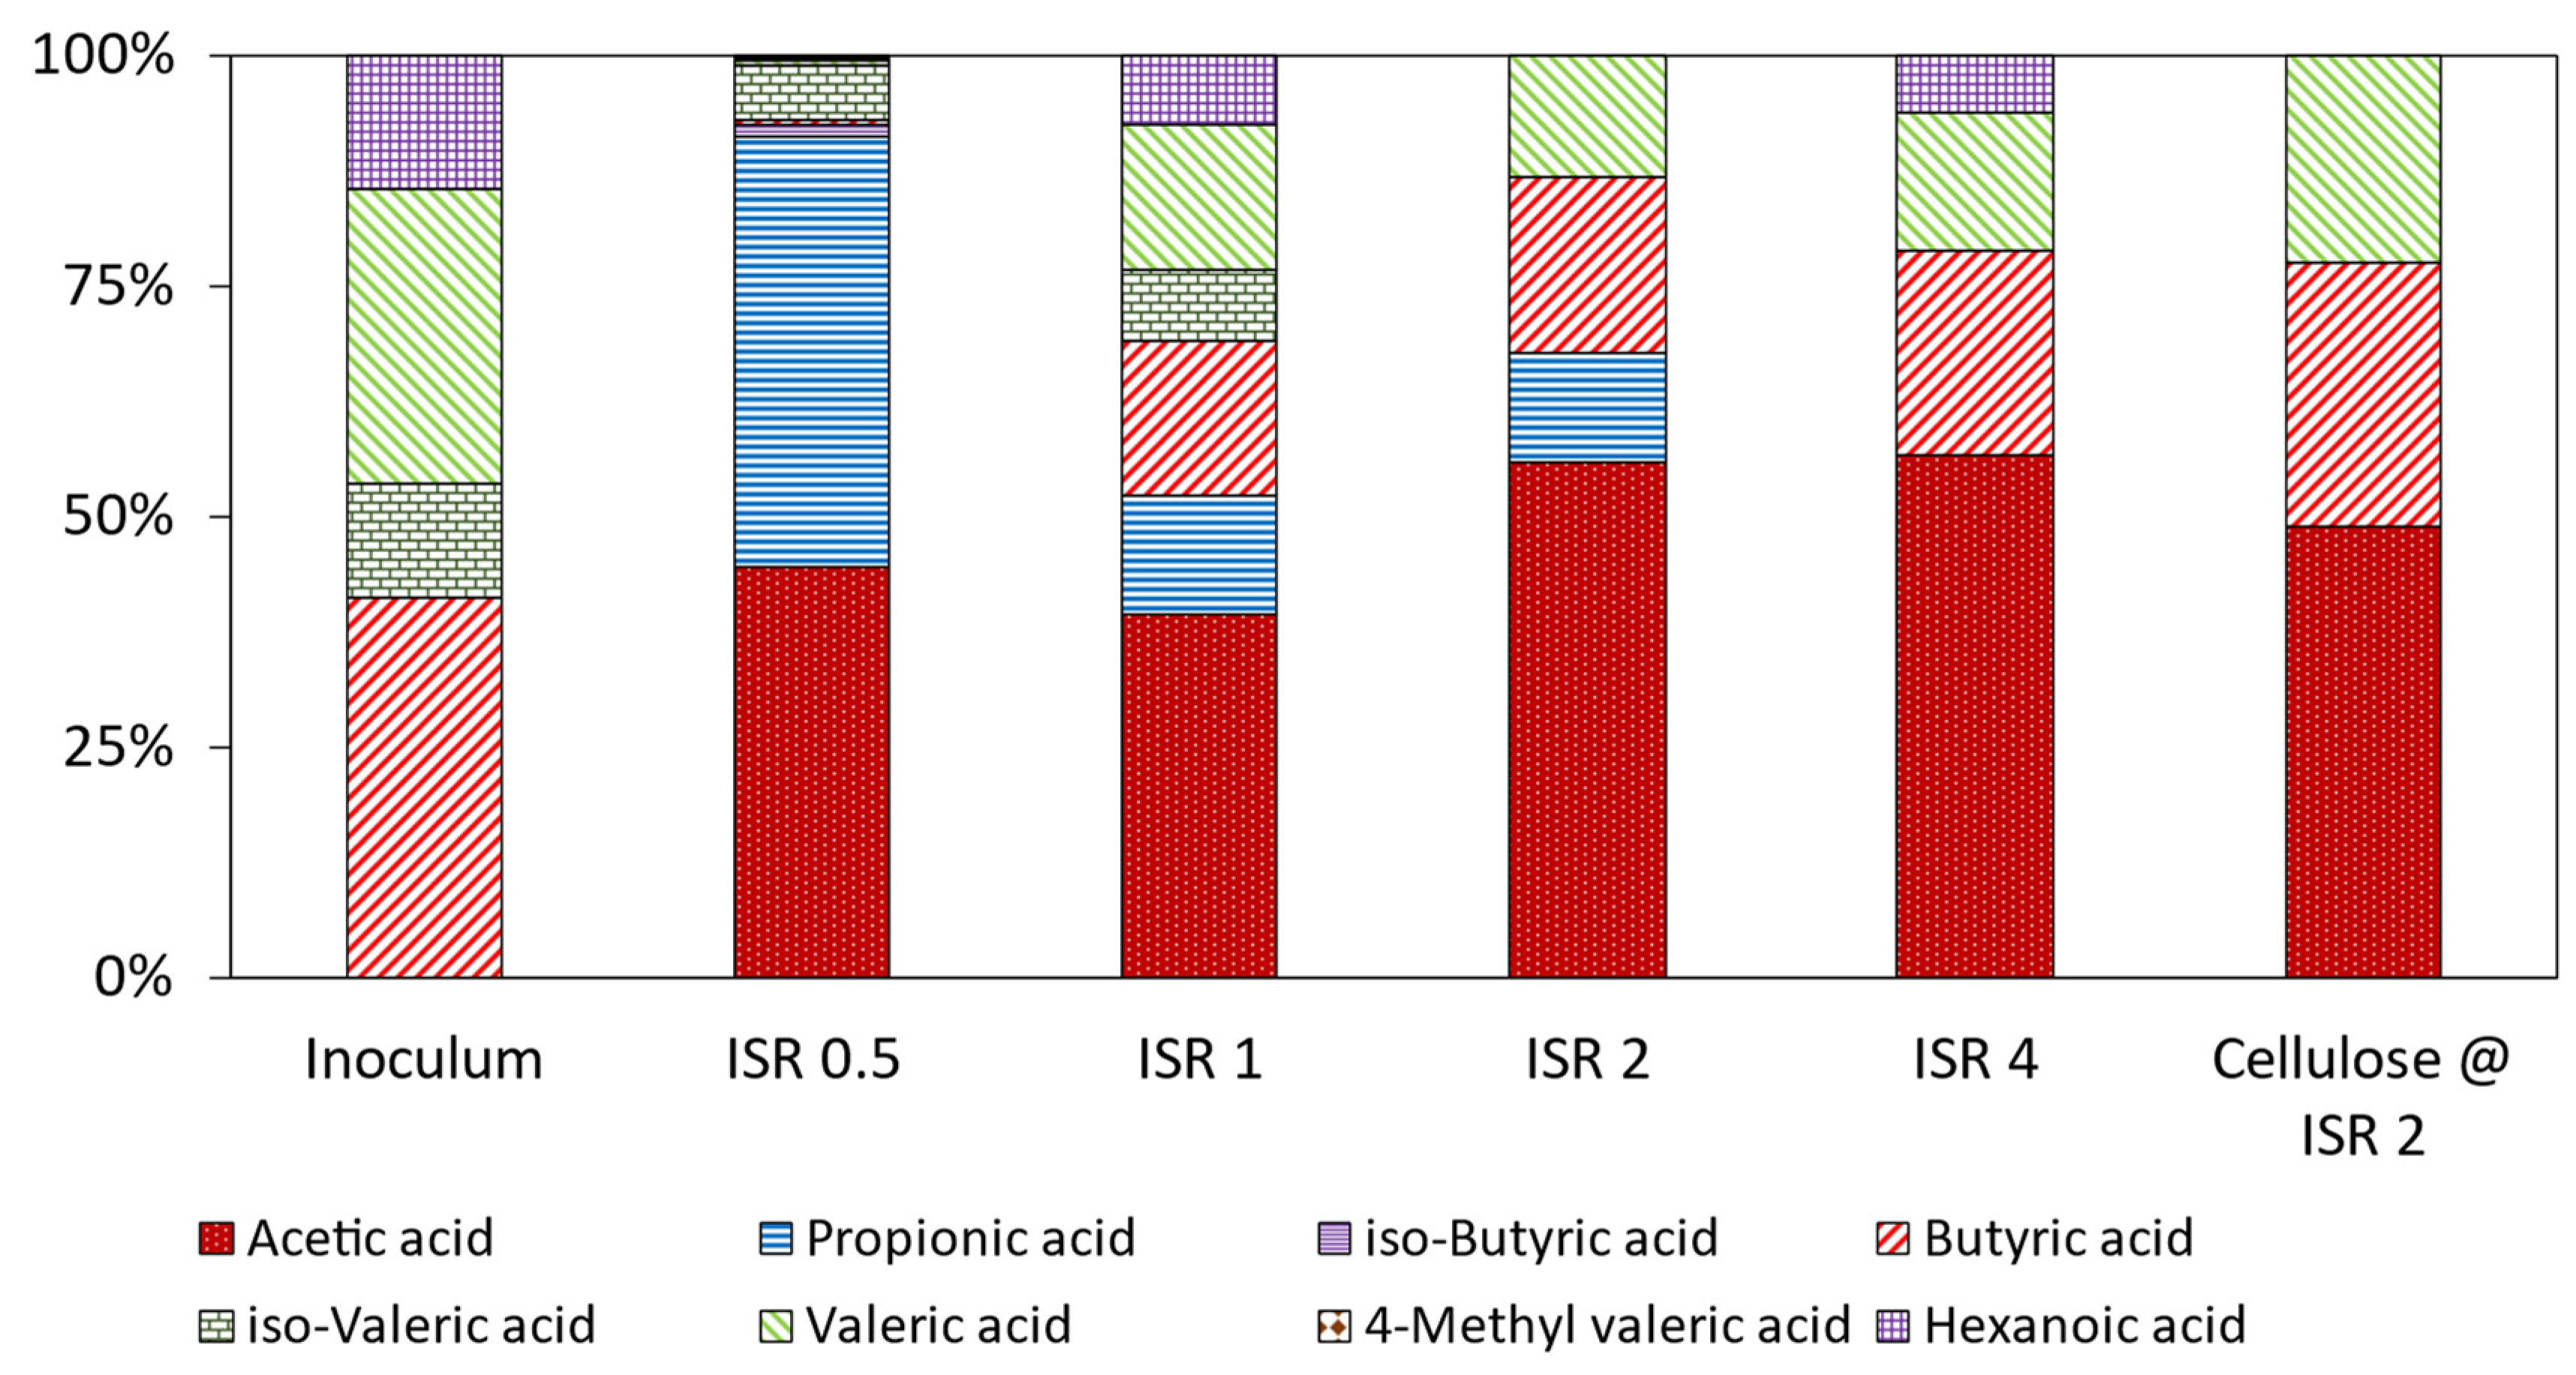
3.6. Volatile Fatty Acids Profile in the Digestates

Total VFA and its individual components in the digestate during experimental set-ups 1 and 2 are shown in Table 4 and Figure 3 and Figure 4. For an ISR of 0.5, the amount of substrate was higher compared with inoculum, which resulted in high levels of metabolites, e.g., VFA accumulation that resulted a in lag phase of >10 days. Total VFA at an ISR of 0.5 was 2805 mg/L with acetate and propionate accounting for 44.5% and 46.7% of total VFA, respectively (Figure 3). Conversely, VFA levels at ISRs of 1–4 were below 21 mg/L, suggesting that the produced VFAs were efficiently converted into methane. In several previous studies, propionic acid accumulation was reported to cause severe process inhibition and threshold concentrations can range from 800 to 21,600 mg/L [53]. In the present study, propionic acid levels (1310 mg/L) at an ISR of 0.5 were within the above-reported threshold range, leading to the lowest cumulative methane yield and VS removal rates. On the other hand, propionic acid levels at ISRs of 2 and 4 were less than 2 mg/L and, thereby, resulted in good biodegradability and methane yields without any inhibition [54]. The effectiveness of the digestion process is determined by the rate of generation and conversion of VFAs during the digestion process [55]. The most prevalent anaerobic digestion process inhibition is acidification due to build-up of VFAs. VFAs are produced by acidogenic and acetogenic bacteria and represent an imbalance in the kinetics of acid production and consumption, which also results in drop in pH [56]. Low pH (5.0) due to built-up of VFAs has a significant impact on microbial growth and metabolic processes, thereby resulting in decreased methane generation [57].
Figure 4 shows the VFA profiles of the various feed mix ratios. VFA levels in this experiment were between 10.87 and 16.47 m/L, indicating good conversion of substrates to methane, and acetate levels were well below the inhibitory threshold levels for methanogens [58].

4. Effect of ISR and Feed Ratio on Methane Production Kinetics

Three kinetic models were used to evaluate the kinetics of methane production and generate model parameters for the best fit description. Figure 5 and Figure 6 present comparisons between the experimental and predicted methane yields. Table 5 summaries the estimated kinetic parameters for the first-order kinetic model (Equation (1)), modified Gompertz model (Equation (2)) and Chen and Hashimoto model (Equation (3)). The kinetic parameters estimated include hydrolysis constant (Khyd), lag phase (λ) and Rmax during the anaerobic digestion of the silage mixture. Further, the statistical indicators (rRMSE and R2 values) were calculated and are presented in the Table 5. Table 5 presents the experimental and predicted methane yields at ISRs of 0.5, 1, 2 and 4 using the first-order kinetic and modified Gompertz models. An ISR of 0.5 had a coefficient of determination (R2) value of 0.92 while the corresponding values at ISRs of 1, 2 and 4 were 0.99. The Khyd, i.e., hydrolysis constant or first-order disintegration constant (day−1), values were 0.000018, 0.06, 0.11 and 0.1 at ISRs of 0.5, 1, 2 and 4 respectively. Moreover, ISR ratios affected the time taken to achieve 90% methane production (T90). Maximum CH4 production occurred in the first 33 days of anaerobic digestion, showing that degradable organic compounds were hydrolysed, according to the hydrolysis constant range of 0.000018 to 0.11 (day1).
Figure 5 shows that the first-order kinetic model fits well for all ISRs except for an ISR of 0.5. The experimental and predicted methane yields (B0) were more or less similar for ISRs of 2 and 4 with error < 1.6%. Despite a high R2 value for an ISR of 0.5, the first-order kinetic model did not provide a very accurate fit to the experimental data. The modified Gompertz model was found to be a better fit at an ISR of 0.5. The possible reason for this observation is due to lag phase noticed at an ISR of 0.5 in the study.
In the modified Gompertz model, λ represents the lag phase. A low value of λ represents rapid onset of anaerobic reactions. An ISR of 0.5 had a lag phase of 15.29 days whilst the lag phase for an ISR of 1 was 1.72 days. Conversely, no lag phase was noticed at ISRs of 2 and 4 (Table 5). These results are in accordance with previous studies where a decrease in λ value with an increase in ISR was reported [25]. The R2 values were in the range of 0.98–0.99 for all tested ISRs. Both these results suggest that the first-order kinetic model was shown to be a better fit model to predict the methane yields at ISRs of 2 and 4, whilst the modified Gompertz model was a better fit at ISRs of 0.5 and 1.0. The possible reason for this observation could be due to the accumulation of VFAs during the hydrolysis of lignocellulosic substrates, thereby inhibiting propionic acid’s degradation into smaller chain organic acids (Table 4). A similar phenomenon of VFA build-up at a lower ISR was reported and was attributed to the kinetic latency as the methanogenic microbial community growth was inhibited [59]. In a similar study, an imbalance between acidification and methanogenesis at a low ISR was reported and was also indicated by low methane content [60]. A zero λ value noticed at ISRs of 2 and 4 confirms that the methane production started immediately from day 1 owing to the favourable conditions for microbial growth. Further, a strong decrease in the lag phase was noticed with a relative increase in the amount of inoculum. Thus, selection of an appropriate ISR is crucial for optimising the methane production from silage mixes.
For the feed mix ratio experiment, a high R2 value of 0.99 was obtained at all tested feed mix ratios with the first-order model suggesting that it was a better fit model to predict the methane yields. The Khyd values ranged from 0.04 to 0.11 with the highest value noticed for a feed mix ratio of 100:0. The difference in methane yields between experimental and predicted data decreased gradually from 14.99% at SM:CM = 0:100 to 0.76% at SM:CM = 100–0 (Table 5). In case of the modified Gompertz model, methane production started immediately at all feed mix ratios and was evident with the lag phase λ value of 0 and the R2 value of 0.99. The difference in predicted and experimental methane yields was <6%, which makes the modified Gompertz model a better fit model to predict methane yields compared to the first-order kinetic model. In both experiments, the first-order kinetic model was shown as a better fit model to predict the methane yields compared to the modified Gompertz model. Both these results indicate that the methanogenic activity and methane production rates are highly dependent on the organic matter of the substrates.
Table 5 presents the effective methane production period (Tef), calculated by subtracting the lag time (k) from T90. ISR had a profound influence on Tef values with an increase in ISR from 0.5 to 4 resulting in an increase in Tef from 18.04 d for ISR = 0.5 to 22.40 d for ISR = 4. The possible reason for the high Tef values at an ISR of 0.5 could be due to rapid acidification, thereby inhibiting the methanogenic activity. On the other hand, there was no clear trend in Rmax values. It should be noted that a high Rmax value indicates that the rates of digestion are fast. An ISR of 2 had a low Tef (22.39 d) and high Rmax values (29.97 NmL CH4/gVSadded/d) but resulted in production of a relatively high methane yield of 387.77 ± 14.43 NmL/gVSadded. Hydrolysis of lignocellulosic substrates such as silages has been considered as the rate-limiting step. Conversely, an ISR of 4 had a low Tef value (22.40 d) and the lowest Rmax value (13.69 NmL CH4/gVSadded/d), indicating the rates of digestion were slow, resulting in production of the high methane yield of 482.23 ± 38.47 NmL/gVSadded. However, a clear trend was noticed with feed mix ratio. Tef values decreased with a decrease in silage mix concentration in the feed ratio from 100:0 to 0:100. The possible reason for the high Tef values at an ISR of 0.5 could be due to rapid acidification, thereby inhibiting the methanogenic activity. On the other hand, there was no clear trend in Rmax values. A high Rmax value indicates that the rates of digestion are fast. An ISR of 2 had a low Tef value (22.39 d) and a high Rmax value (29.97 NmL CH4/gVSadded/d) but resulted in production of a relatively high methane yield of 387.77 ± 14.43 NmL/gVSadded.
The kinetic model of Chen and Hashimoto describes the relationship between population density and specific growth rate of bacteria (Table 5). In this model, HRT represents the hydraulic retention time (days), the dimensionless kinetic constant KCH determines the inhibition phenomenon and µm determines the maximum specific growth rate of methanogens. For the ISR experiment, The KCH value at an ISR of 4 was 5.84 whilst the corresponding values at ISRs < 4 were between 0.5 and 0.9 (Table 5). Similarly, the µm value at an ISR of 4 was 3.06 whereas the µm value ranged from 0.18 to 0.30 at the remaining ISRs. Finally, the highest HRT value of 5.43 was obtained at an ISR of 0.5 whist the lowest value was obtained at an ISR of 4. The highest HRT obtained at the lowest ISR of 0.5 was due to the fact that the quantity of inoculum in the assay was less compared to substrate. For the feed mix ratio experiments, KCH values were in the range of 0.4–1.0 at all tested feed mix ratios. The µm values were between 0.24 and 0.26 whist HRT values were between 3 to 4. Among the tested FM ratios, SM:CM at a 25–75 ratio had the lowest HRT of 3.8 d as these assays contained higher amounts of inoculum that could degrade the limited amount of substrate.

Synergistic and Antagonistic Effect

Table 6 presents the calculated values on the synergistic and antagonistic effects during the anaerobic co-digestion of silage mixture with cow manure. Synergistic effect refers to an increase in the amount of methane produced compared to the sum of the methane contributed by individual substrates [61]. In this study, the highest percentage difference between weighted and observed methane yields of 13.66% was noticed at a SM:CM feed mix ratio of 50–50 (Table 6). Conversely, the lowest percentage difference was noticed for a SM:CM feed mix ratio of 25–75. It can be observed that methane yields for all tested feed mix ratios were higher than their respective weighted methane yields. However, CPI gives the cut-off threshold for the effect of co-digestion on methane yield. If CPI > 1.1, it indicates a synergistic effect while CPI < 0.9 indicates an antagonistic effect. When CPI is between 0.9 and 1.1, it describes no significant effect of co-digestion [62].
The positive synergy effects observed at a SM:CM ratio of 50:50 compared to other tested feed ratios was obviously due to the balancing of several parameters at this feed mixture ratio [63,64]. Manure provides buffering capacity and a wide range of nutrients, while the silage mix with high carbon provides the necessary carbon for microbial growth and improves the C/N ratio of the feedstock, thereby reducing the risk of ammonia inhibition and improving the overall methane yield [43]. The C/N ratio is considered as a fundamental parameter in defining the synergistic effect during anaerobic co-digestion. It is reported that at an optimal C/N ratio, the anaerobic digestion process is stable as it allows the growth of all pertinent microbial populations [61]. On the contrary, antagonism is observed as a reduction in methane production during the co-digestion and is due to an increase in the organic load and/or accumulation of intermediate metabolites and prolonged lag phase [65]. Nevertheless, the highest methane yields in the present study were observed at an SM:CM ratio of 75–25 rather than at 50–50. The possible reason for this discrepancy is attributed to substrate composition, especially the type of carbon and its bioavailability, and the biodegradability of substrates.
Table 6 presents the theoretical methane yield and biodegradability index (BI) of feed mix ratios. Theoretical methane yields decreased from 516.60 NmL CH4/gVSadded for a SM:CM ratio of 100–0 to 417.93 NmL CH4/gVSadded for a SM:CM ratio of 0–100, suggesting that a decrease in the concentration of carbon-rich silage mixture in the feed mix resulted in a decrease in methane yields. On the other hand, BI did not follow the same trend as that of theoretical methane yield (Table 6). The highest BI of 79.70% was noticed at a SM:CM ratio 50–50 ratio followed by BI values of 77.42%, 70.25% and 61.59% at SM:CM ratios of 75–25, 25–75 and 0–100, respectively. This trend was similar to the trend noticed with CPI at various FM ratios. However, care must be taken in referring to the biodegradability of the spoiled silage substrates as storage duration and conditions can greatly affect the fibre and lignin contents in the silages. Ensilation is generally practised to extend the storage time and fodder quality of crops. The storage of lucerne with high water content is challenging because the material decays rapidly when it comes in contact with air. Thus, ensiling with crops such as maize and barley would improve the silage quality by adjusting the solids content, buffer capacities, etc. [66]. Exposure to ambient conditions and to air leads to aerobic fermentation producing butyric, acetic or formic acids, rendering silages useless. Typical total losses of silage under good management practices have been estimated at 213 g/kg of original crop dry matter for grass silage and 206 g/kg of original crop dry matter for maize silage [67].
The possible solution to utilising spoiled silages is as feedstock for biogas production and recycling nutrient-rich digestate for crop production. However, care should be taken to avoid the accumulation of VFAs especially propionic acid, butyric acid and acetic acid. Thus, co-digestion of spoiled silage mixture with cow manure should be practised to improve the process performance and methane yields from these substrates. Previous studies have shown that co-digestion of spoiled maize silage with cattle manure improved methane yields as the amount of spoiled maize silage in the feed mixture increased [68]. With 30–40% losses in dry matter during silage storage [5], we can estimate an annual spoiled silage generation of 1.59–2.11 m t/yr in Australia. Use of spoiled silage for biogas production would generate 317.73 m3 CH4/t FM per year or 246.42 m3 CH4/t FM per year when co-digested with cow manure. The lucerne silage and barley silages can individually produce 294.62 m3 CH4/t FM per year and 295.59 m3 CH4/t FM per year, respectively. The produced methane can be used for on-site renewable electricity and/or vehicle fuel generation and avoid the GHG emissions associated with silage production and use. The carbon footprint of grass silage and whole maize silage production were estimated to be 382 [67] and 253 kg CO2 eq/kgTS [69], respectively.
The current regulation for biomethane composition for natural gas network injection in Australia is predominantly based on meeting the existing natural gas standard AS-4564 [70]. According to AS-4564, the Wobbe index should be 46–52 MJ/m2 with a higher heating value of 42.3 MJ/m3. Further, the limit values for various contaminants are 0.2 mol% for O2, 5.7 mg/m3 for H2S, 50 mg/m3 for total S and 7 mol% for total inert gases. Finally, the water content should be at a dew point of 0 °C at the highest maximum allowable operating pressure in the relevant transmission system (<112 mg/m3) and the hydrocarbon dew point at 3500 kPag should be 2 °C. Therefore, the quality of allowable biomethane contaminant concentrations in biogas and existing natural gas pipelines should be carefully assessed before injecting at the designed pressure in the pipeline as there is a potential interaction between new and existing pipeline contaminants.
Increasing use of silage as feedstock for biogas production is being practiced especially in Europe and has been encouraged through government support for small farm-scale biogas plants. Challenges for the future lie in improving methane yields through use of fodder cultivars with higher concentrations of fermentable substrates and cell wall digestibility, using pretreatments to improve biodegradability and understanding the factors affecting the ensiling process on methanogenesis. Finally, use of a wide range of feedstocks in addition to conventional silage crops and wastes, such as chicken manure, vegetable wastes and food wastes, either separately or together, should be investigated. However, the effects of mixtures of feedstocks on methane yield have yet to be fully elucidated.

5. Conclusions

The results from this study showed that spoiled silage substrates such as maize, barley and lucerne have high solids contents with good VS/TS ratios suggesting that these substrates could be ideal feedstock for biogas production. Results from the batch experiments showed that methane yields of 387.77 ± 14.43 and 482.23 ± 38.47 NmL CH4/gVSadded were obtained at ISR ratios of 2 and 4, respectively, suggesting that BMP assays of the studied substrates should be carried out at ISRs higher than 2. Incubation at an ISR of 0.5 resulted in low methane yields due to VFA build-up. Further, co-digestion of the spoiled silage mixture with cow manure showed that addition of cow manure had a positive effect on the methane yields. The highest methane yields of 387.8 and 382.9 NmL CH4/gVSadded were obtained at SM:CM feed mix ratios of 100–0 and 75–25, respectively. However, the best synergistic effect was noticed at a SM:CM feed mix ratio of 50–50.

Author Contributions

Conceptualization, S.D.S., D.K. and P.K.; methodology, S.D.S., D.K. and D.M. (Divya Mathias); ANOVA analyses, P.K.; validation, D.M. (Divya Mathias), D.M. (David McNeill) and P.K.; formal analysis, S.D.S., D.K. and D.M. (Divya Mathias); investigation, S.D.S. and D.K.; resources, D.M. (David McNeill) and P.K.; data curation, D.M. (Divya Mathias), D.M. (David McNeill) and P.K.; writing—original draft preparation, S.D.S.; writing—review and editing, D.M. (Divya Mathias), D.M. (David McNeill) and P.K.; visualization, D.M. (Divya Mathias) and P.K.; supervision, D.M. (Divya Mathias) and P.K. All authors have read and agreed to the published version of the manuscript.

Funding

This research received no external funding.

Acknowledgments

The authors acknowledge The University of Queensland, Gatton, Queensland, for the supply of silage and cow manure.

Conflicts of Interest

The authors declare no conflict of interest.

References

  1. Australian Bureau of Statistics. Australia Agricultural Commities. 2023. Available online: https://www.abs.gov.au/statistics/industry/agriculture/agricultural-commodities-australia/latest-release (accessed on 24 June 2023).
  2. Stockdale, C. Wastage of conserved fodder when feeding livestock. Anim. Prod. Sci. 2010, 50, 400–404. [Google Scholar] [CrossRef]
  3. Driehuis, F.; Elferink, S.O. The impact of the quality of silage on animal health and food safety: A review. Vet. Q. 2000, 22, 212–216. [Google Scholar] [CrossRef] [PubMed]
  4. Herrmann, C.; Idler, C.; Heiermann, M. Improving aerobic stability and biogas production of maize silage using silage additives. Bioresour. Technol. 2015, 197, 393–403. [Google Scholar] [CrossRef] [PubMed]
  5. Wilkinson, J.; Davies, D. The aerobic stability of silage: Key findings and recent developments. Grass Forage Sci. 2013, 68, 1–19. [Google Scholar] [CrossRef]
  6. Tabacco, E.; Righi, F.; Quarantelli, A.; Borreani, G. Dry matter and nutritional losses during aerobic deterioration of corn and sorghum silages as influenced by different lactic acid bacteria inocula. J. Dairy Sci. 2011, 94, 1409–1419. [Google Scholar] [CrossRef] [PubMed]
  7. Pakarinen, O.; Lehtomäki, A.; Rissanen, S.; Rintala, J. Storing energy crops for methane production: Effects of solids content and biological additive. Bioresour. Technol. 2008, 99, 7074–7082. [Google Scholar] [CrossRef]
  8. Robinson, N.E.; Derksen, F.; Olszewski, M.; Buechner-Maxwell, V. The pathogenesis of chronic obstructivepulmonary disease of horses. Br. Vet. J. 1996, 152, 283–306. [Google Scholar] [CrossRef]
  9. Wang, J. Decentralized biogas technology of anaerobic digestion and farm ecosystem: Opportunities and challenges. Front. Energy Res. 2014, 2, 10. [Google Scholar] [CrossRef]
  10. Villadsen, S.N.; Fosbøl, P.L.; Angelidaki, I.; Woodley, J.M.; Nielsen, L.P.; Møller, P. The potential of biogas; the solution to energy storage. ChemSusChem 2019, 12, 2147–2153. [Google Scholar] [CrossRef]
  11. Zhang, Y.; Jiang, Y.; Wang, S.; Wang, Z.; Liu, Y.; Hu, Z.; Zhan, X. Environmental sustainability assessment of pig manure mono-and co-digestion and dynamic land application of the digestate. Renew. Sustain. Energy Rev. 2021, 137, 110476. [Google Scholar] [CrossRef]
  12. Dechrugsa, S.; Kantachote, D.; Chaiprapat, S. Effects of inoculum to substrate ratio, substrate mix ratio and inoculum source on batch co-digestion of grass and pig manure. Bioresour. Technol. 2013, 146, 101–108. [Google Scholar] [CrossRef] [PubMed]
  13. Beausang, C.; McDonnell, K.; Murphy, F. Assessing the environmental sustainability of grass silage and cattle slurry for biogas production. J. Clean. Prod. 2021, 298, 126838. [Google Scholar] [CrossRef]
  14. Wall, D.M.; Allen, E.; Straccialini, B.; O’Kiely, P.; Murphy, J.D. Optimisation of digester performance with increasing organic loading rate for mono-and co-digestion of grass silage and dairy slurry. Bioresour. Technol. 2014, 173, 422–428. [Google Scholar] [CrossRef] [PubMed]
  15. Da Silva, T.; Santos, E.M. Advances in Silage Production and Utilization; BoD–Books on Demand: McFarland, WI, USA, 2016. [Google Scholar]
  16. Sun, C.; Cao, W.; Banks, C.J.; Heaven, S.; Liu, R. Biogas production from undiluted chicken manure and maize silage: A study of ammonia inhibition in high solids anaerobic digestion. Bioresour. Technol. 2016, 218, 1215–1223. [Google Scholar] [CrossRef] [PubMed]
  17. Klang, J.; Theuerl, S.; Szewzyk, U.; Huth, M.; Tölle, R.; Klocke, M. Dynamic variation of the microbial community structure during the long-time mono-fermentation of maize and sugar beet silage. Microb. Biotechnol. 2015, 8, 764–775. [Google Scholar] [CrossRef]
  18. Gallegos, D.; Wedwitschka, H.; Moeller, L.; Weinrich, S.; Zehnsdorf, A.; Nelles, M.; Stinner, W. Mixed silage of Elodea and wheat straw as a substrate for energy production in anaerobic digestion plants. Energy Sustain. Soc. 2018, 8, 7. [Google Scholar] [CrossRef]
  19. Kintl, A.; Elbl, J.; Vítěz, T.; Brtnický, M.; Skládanka, J.; Hammerschmiedt, T.; Vítězová, M. Possibilities of using white sweetclover grown in mixture with maize for biomethane production. Agronomy 2020, 10, 1407. [Google Scholar] [CrossRef]
  20. Bhatnagar, N.; Ryan, D.; Murphy, R.; Enright, A. Effect of co-digestion ratio and enzyme treatment on biogas production from grass silage and chicken litter. Waste Biomass Valoriz. 2019, 10, 3271–3277. [Google Scholar] [CrossRef]
  21. Arici, Ş.; Koçar, G. The effect of adding maize silage as a co-substrate for anaerobic animal manure digestion. Int. J. Green Energy 2015, 12, 453–460. [Google Scholar] [CrossRef]
  22. Filer, J.; Ding, H.H.; Chang, S. Biochemical methane potential (BMP) assay method for anaerobic digestion research. Water 2019, 11, 921. [Google Scholar] [CrossRef]
  23. Holliger, C.; Alves, M.; Andrade, D.; Angelidaki, I.; Astals, S.; Baier, U.; Bougrier, C.; Buffière, P.; Carballa, M.; De Wilde, V. Towards a standardization of biomethane potential tests. Water Sci. Technol. 2016, 74, 2515–2522. [Google Scholar] [CrossRef] [PubMed]
  24. Pererva, Y.; Miller, C.D.; Sims, R.C. Existing empirical kinetic models in biochemical methane potential (BMP) testing, their selection and numerical solution. Water 2020, 12, 1831. [Google Scholar] [CrossRef]
  25. Tsapekos, P.; Kougias, P.G.; Kuthiala, S.; Angelidaki, I. Co-digestion and model simulations of source separated municipal organic waste with cattle manure under batch and continuously stirred tank reactors. Energy Convers. Manag. 2018, 159, 1–6. [Google Scholar] [CrossRef]
  26. Association, A.P.H.; Association, A.P.H. Standard methods for the Examination of Water and Wastewater, APHA. In American Water Works Association and Water Environment Federation, 21st ed.; American Public Health Association: Washington, DC, USA, 2005. [Google Scholar]
  27. Latif, M.A.; Mehta, C.M.; Batstone, D.J. Influence of low pH on continuous anaerobic digestion of waste activated sludge. Water Res. 2017, 113, 42–49. [Google Scholar] [CrossRef] [PubMed]
  28. Sarojam, P. Analysis of Wastewater for Metals Using ICP-OES; Perkin Elmer Instruments: Shelton, CT, USA, 2010; p. 11. Available online: https://resources.perkinelmer.com/lab-solutions/resources/docs/app_metalsinwastewater.pdf (accessed on 17 July 2023).
  29. Paulose, P.; Kaparaju, P. Anaerobic mono-digestion of sugarcane trash and bagasse with and without pretreatment. Ind. Crops Prod. 2021, 170, 113712. [Google Scholar] [CrossRef]
  30. Beckett, N.M.; Cresswell, S.L.; Grice, D.I.; Carter, J.F. Isotopic profiling of seized benzylpiperazine and trifluoromethylphenylpiperazine tablets using δ13C and δ15N stable isotopes. Sci. Justice 2015, 55, 51–56. [Google Scholar] [CrossRef]
  31. Krotz, L.; Giazzi, G. Elemental Analysis: CHNS/O characterization of Carbon Black Compliance with ASTM D5373 Method; Thermo Fisher Scientific: Milan, Italy, 2017; Available online: https://assets.thermofisher.com/TFS-Assets/CMD/Application-Notes/AN-42238-OEA-CHNSO-Carbon-Black-AN42238-EN.pdf (accessed on 21 July 2023).
  32. Sambusiti, C.; Ficara, E.; Malpei, F.; Steyer, J.; Carrère, H. Benefit of sodium hydroxide pretreatment of ensiled sorghum forage on the anaerobic reactor stability and methane production. Bioresour. Technol. 2013, 144, 149–155. [Google Scholar] [CrossRef] [PubMed]
  33. Chong, C.C.; Cheng, Y.W.; Ishak, S.; Lam, M.K.; Lim, J.W.; Tan, I.S.; Show, P.L.; Lee, K.T. Anaerobic digestate as a low-cost nutrient source for sustainable microalgae cultivation: A way forward through waste valorization approach. Sci. Total Environ. 2022, 803, 150070. [Google Scholar] [CrossRef]
  34. Yan, Z.; Song, Z.; Li, D.; Yuan, Y.; Liu, X.; Zheng, T. The effects of initial substrate concentration, C/N ratio, and temperature on solid-state anaerobic digestion from composting rice straw. Bioresour. Technol. 2015, 177, 266–273. [Google Scholar] [CrossRef]
  35. Rodriguez, C.; Alaswad, A.; El-Hassan, Z.; Olabi, A.G. Waste paper and macroalgae co-digestion effect on methane production. Energy 2018, 154, 119–125. [Google Scholar] [CrossRef]
  36. Moset, V.; Al-zohairi, N.; Møller, H.B. The impact of inoculum source, inoculum to substrate ratio and sample preservation on methane potential from different substrates. Biomass Bioenergy 2015, 83, 474–482. [Google Scholar] [CrossRef]
  37. Zeng, S.; Yuan, X.; Shi, X.; Qiu, Y. Effect of inoculum/substrate ratio on methane yield and orthophosphate release from anaerobic digestion of Microcystis spp. J. Hazard. Mater. 2010, 178, 89–93. [Google Scholar] [CrossRef] [PubMed]
  38. Raposo, F.; Fernández-Cegrí, V.; De la Rubia, M.; Borja, R.; Béline, F.; Cavinato, C.; Demirer, G.; Fernández, B.; Fernández-Polanco, M.; Frigon, J. Biochemical methane potential (BMP) of solid organic substrates: Evaluation of anaerobic biodegradability using data from an international interlaboratory study. J. Chem. Technol. Biotechnol. 2011, 86, 1088–1098. [Google Scholar] [CrossRef]
  39. Lallement, A.; Siaud, A.; Peyrelasse, C.; Kaparaju, P.; Schraauwers, B.; Maunas, S.; Monlau, F. Impact of operational factors, inoculum origin, and feedstock preservation on the biochemical methane potential. Bioengineering 2021, 8, 176. [Google Scholar] [CrossRef] [PubMed]
  40. Neves, L.; Oliveira, R.; Alves, M. Influence of inoculum activity on the bio-methanization of a kitchen waste under different waste/inoculum ratios. Process Biochem. 2004, 39, 2019–2024. [Google Scholar] [CrossRef]
  41. Jensen, M.B.; De Jonge, N.; Dolriis, M.D.; Kragelund, C.; Fischer, C.H.; Eskesen, M.R.; Noer, K.; Møller, H.B.; Ottosen, L.D.M.; Nielsen, J.L. Cellulolytic and xylanolytic microbial communities associated with lignocellulose-rich wheat straw degradation in anaerobic digestion. Front. Microbiol. 2021, 12, 645174. [Google Scholar] [CrossRef]
  42. Raposo, F.; Borja, R.; Rincon, B.; Jimenez, A. Assessment of process control parameters in the biochemical methane potential of sunflower oil cake. Biomass Bioenergy 2008, 32, 1235–1244. [Google Scholar] [CrossRef]
  43. Wu, X.; Yao, W.; Zhu, J. Biogas and CH4 Productivity by Co-Digesting Swine Manure with Three Crop Residues as an External Carbon Source. Bioresour. Technol. 2010, 101, 4042–4047. [Google Scholar] [CrossRef]
  44. Neshat, S.A.; Mohammadi, M.; Najafpour, G.D.; Lahijani, P. Anaerobic co-digestion of animal manures and lignocellulosic residues as a potent approach for sustainable biogas production. Renew. Sustain. Energy Rev. 2017, 79, 308–322. [Google Scholar] [CrossRef]
  45. Kaparaju, P.; Rintala, J. Anaerobic co-digestion of potato tuber and its industrial by-products with pig manure. Resour. Conserv. Recycl. 2005, 43, 175–188. [Google Scholar] [CrossRef]
  46. Ma, G.; Ndegwa, P.; Harrison, J.H.; Chen, Y. Methane yields during anaerobic co-digestion of animal manure with other feedstocks: A meta-analysis. Sci. Total Environ. 2020, 728, 138224. [Google Scholar] [CrossRef]
  47. Xie, S.; Lawlor, P.G.; Frost, J.; Hu, Z.; Zhan, X. Effect of pig manure to grass silage ratio on methane production in batch anaerobic co-digestion of concentrated pig manure and grass silage. Bioresour. Technol. 2011, 102, 5728–5733. [Google Scholar] [CrossRef]
  48. Akyol, Ç.; Ozbayram, E.G.; Ince, O.; Kleinsteuber, S.; Ince, B. Anaerobic co-digestion of cow manure and barley: Effect of cow manure to barley ratio on methane production and digestion stability. Environ. Prog. Progress Sustain. Energy 2016, 35, 589–595. [Google Scholar] [CrossRef]
  49. Zhang, W.; Kong, T.; Xing, W.; Li, R.; Yang, T.; Yao, N.; Lv, D. Links between carbon/nitrogen ratio, synergy and microbial characteristics of long-term semi-continuous anaerobic co-digestion of food waste, cattle manure and corn straw. Bioresour. Technol. 2022, 343, 126094. [Google Scholar] [CrossRef]
  50. Isaksson, S. Biogas Production at High Ammonia Levels: The Importance of Temperature and Trace Element Supplementation on Microbial Communities. Student Thesis, Faculty of Science and Technology, Uppsala University, Uppsala, Sweden, 2018. Available online: https://www.diva-portal.org/smash/get/diva2:1203787/FULLTEXT01.pdf (accessed on 12 July 2023).
  51. McCarty, P. Anaerobic waste treatment fundamentals: Part III. Toxic Materials and their Control. Public Works. 1964, 95, 91–94. [Google Scholar]
  52. Yangin-Gomec, C.; Ozturk, I. Effect of maize silage addition on biomethane recovery from mesophilic co-digestion of chicken and cattle manure to suppress ammonia inhibition. Energy Convers. Manag. 2013, 71, 92–100. [Google Scholar] [CrossRef]
  53. Alavi-Borazjani, S.A.; Capela, I.; Tarelho, L.A. Over-acidification control strategies for enhanced biogas production from anaerobic digestion: A review. Biomass Bioenergy 2020, 143, 105833. [Google Scholar] [CrossRef]
  54. Zhang, S.; Ren, Y.; Ma, X.; Guan, W.; Gao, M.; Li, Y.-Y.; Wang, Q.; Wu, C. Effect of zero-valent iron addition on the biogas fermentation of food waste after anaerobic preservation. J. Environ. Chem. Eng. 2021, 9, 106013. [Google Scholar] [CrossRef]
  55. Egwu, U.; Onyelowe, K.; Tabraiz, S.; Johnson, E.; Mutshow, A.D. Investigation of the effect of equal and unequal feeding time intervals on process stability and methane yield during anaerobic digestion grass silage. Renew. Sustain. Energy Rev. 2022, 158, 112092. [Google Scholar] [CrossRef]
  56. Babel, S.; Fukushi, K.; Sitanrassamee, B. Effect of acid speciation on solid waste liquefaction in an anaerobic acid digester. Water Res. 2004, 38, 2417–2423. [Google Scholar] [CrossRef]
  57. Gyenge, L.; Crognale, S.; Lányi, S.; Abraham, B.; Ráduly, B. Anaerobic digestion of corn-DDGS: Effect of pH-control, agitation and batch repetition. UPB Sci. Bull. Ser. B Chem. Mater. Sci. 2014, 76, 163–172. [Google Scholar]
  58. Siegert, I.; Banks, C. The effect of volatile fatty acid additions on the anaerobic digestion of cellulose and glucose in batch reactors. Process Biochem. 2005, 40, 3412–3418. [Google Scholar] [CrossRef]
  59. Yu, Q.; Liu, R.; Li, K.; Ma, R. A review of crop straw pretreatment methods for biogas production by anaerobic digestion in China. Renew. Sustain. Energy Rev. 2019, 107, 51–58. [Google Scholar] [CrossRef]
  60. Fathya, S.; Assia, K.; Hamza, M. Influence of inoculums/substrate ratios (ISRs) on the mesophilic anaerobic digestion of slaughterhouse waste in batch mode: Process stability and biogas production. Energy Procedia 2014, 50, 57–63. [Google Scholar]
  61. Zhou, Y.; Huang, K.; Jiao, X.; Stanisavljevic, N.; Li, L.; Vujovic, S.; Peng, X.; Wang, X. Anaerobic co-digestion of organic fractions of municipal solid waste: Synergy study of methane production and microbial community. Biomass Bioenergy 2021, 151, 106137. [Google Scholar] [CrossRef]
  62. Mata-Alvarez, J.; Macé, S.; Llabres, P. Anaerobic digestion of organic solid wastes. An overview of research achievements and perspectives. Bioresour. Technol. 2000, 74, 3–16. [Google Scholar] [CrossRef]
  63. Marcos, A.; Al-Kassir, A.; López, F.; Cuadros, F.; Brito, P. Environmental treatment of slaughterhouse wastes in a continuously stirred anaerobic reactor: Effect of flow rate variation on biogas production. Fuel Process. Technol. 2012, 103, 178–182. [Google Scholar] [CrossRef]
  64. Donoso-Bravo, A.; Ortega, V.; Lesty, Y.; Bossche, H.V.; Olivares, D. Addressing the synergy determination in anaerobic co-digestion and the inoculum activity impact on BMP test. Water Sci. Technol. 2019, 80, 387–396. [Google Scholar] [CrossRef]
  65. Kouas, M.; Torrijos, M.; Sousbie, P.; Harmand, J.; Sayadi, S. Modeling the anaerobic co-digestion of solid waste: From batch to semi-continuous simulation. Bioresour. Technol. 2019, 274, 33–42. [Google Scholar] [CrossRef]
  66. Kreuger, E.; Nges, I.A.; Björnsson, L. Ensiling of crops for biogas production: Effects on methane yield and total solids determination. Biotechnol. Biofuels 2011, 4, 1–8. [Google Scholar] [CrossRef]
  67. Wilkinson, J.; Garnsworthy, P. Dietary options to reduce the environmental impact of milk production. J. Agric. Sci. 2017, 155, 334–347. [Google Scholar] [CrossRef]
  68. Aybek, A.; Solak, M.; Ekinci, K. Co-digestion of spoiled maize silage with cattle manure. Mediterr. Agric. Sci. 2021, 34, 287–291. [Google Scholar] [CrossRef]
  69. Vellinga, T.V.; Blonk, H.; Marinussen, M.; Van Zeist, W.; Starmans, D. Methodology used in Feedprint: A Tool Quantifying Greenhouse Gas Emissions of Feed Production and Utilization; 1570-8616; Wageningen UR Livestock Research: Wageningen, The Netherlands, 2013. [Google Scholar]
  70. AS 4564-2011; Specification for General Purpose Natural Gas. Australian Standard: Sydney, Australia, 2011.
Figure 1. Effect of inoculum-to-substrate ratio (ISR) on methane production rates and yields during the anaerobic mono-digestion of spoiled silage mixture at 37 °C.
Energies 16 06179 g001
Figure 2. Effect of feed mix (FM) ratio on methane production rates and yields during anaerobic co-digestion of spoiled silage mix (SM) with cow manure (CM) at 37 °C.
Energies 16 06179 g002
Figure 3. VFA profile during the anaerobic mono-digestion of silage mixture at different ISRs at 37 °C.
Energies 16 06179 g003
Figure 4. VFA profile during the anaerobic co-digestion of silage mixture with cow manure at different feed mix ratios at 37 °C.
Energies 16 06179 g004
Figure 5. Comparison of experimental and modelled data during the anaerobic mono-digestion of spoiled silage mix at different ISRs in batch assays at 37 °C. () Modified Gompertz model data, () First-order model data and (–) experimental data.
Energies 16 06179 g005
Figure 6. Comparison of experimental and modelled data during the anaerobic co-digestion of spoiled silage mix (SM) with cow manure (CM) at different feed mix ratios on a VS basis in batch assays at 37 °C. () Modified Gompertz model data, () First-order model data and (–) experimental data.
Energies 16 06179 g006
Table 1. Chemical composition of substrates and inoculum.
SubstrateTSVSVS/TSCNC/NTKNTKP
%% %TS%TS gN/kgTSgN/kgTS
Cow Manure14.6411.640.7943.452.8115.4925.163.25
Lucerne Silage87.7775.980.8743.714.1710.4735.713.32
Maize Silage88.0881.940.9346.801.6228.9617.212.85
Barley Silage84.0376.230.9147.392.4019.7322.2512.23
Table 2. CHNOS Analysis of silage mixture and cow manure.
ParametersSilage MixtureCow Manure
Carbon (% of TS)39.7543.45
Nitrogen (% of TS)2.512.81
Hydrogen (% of TS)5.225.31
Oxygen (% of TS)29.2541.25
Sulphur (% of TS)01
Table 3. Chemical composition of digestates at various ISRs and feed mix (FM) ratios.
pHTS (%) VS (%) VS/TSC (%TS)N (%TS)C/NNH4–N (mg/L)TKN (gN/kgTS)TKP (gP/kgTS)VS Removal (%)
Effect of ISR
Inoculum7.571.701.180.6934.645.656.131494.853.0428.3019.93
ISR 0.57.203.512.560.7336.194.627.831605.917.508.1152.50
ISR 17.422.361.690.7235.224.877.231414.043.1422.6065.08
ISR 27.452.011.390.6934.975.106.861323.147.7825.5275.10
ISR 47.451.871.300.7035.485.276.731272.661.9333.1166.46
Cellulose @ ISR 27.371.781.240.7035.466.025.891191.863.8333.9992.25
Effect of Feed Mix
Inoculum7.601.771.210.6835.415.786.131494.855.750.0217.78
100–07.452.011.390.6934.975.106.861323.147.7825.5275.10
75–257.422.061.410.6834.214.597.461313.046.0625.3172.18
50–507.392.191.520.6935.634.637.701292.848.8328.6358.19
25–757.402.221.510.6835.404.477.921272.643.4426.1958.58
0–1007.382.301.600.7035.114.657.561262.545.0425.9347.60
Table 4. Total VFA and individual VFA components in digestates at various ISRs and feed mix (FM) ratios.
Acetic AcidPropionic AcidIso-Butyric AcidButyric AcidIso-Valeric AcidValeric Acid4-Methyl Valeric AcidHexanoic AcidTotal VFA
Effect of ISR
Inoculum0.000.00.02.30.71.60.00.85.6
ISR 0.512501310.935.415.2164.216.110.52.92805.9
ISR 18.22.70.03.61.63.40.01.621.5
ISR 27.11.50.02.40.01.70.00.012.8
ISR 460.00.02.40.01.60.00.710.8
Cellulose @ ISR 24.10.00.02.40.01.90.00.08.5
Effect of Feed ratio
Inoculum7.20,00.02.30.02.30.00.011.8
75–256.30.00.02.60.01.75.80.016.5
50–507.80.00.02.80.01.60.00.012.2
25–757.70.00.02.20.01.60.00.011.5
0–1004.51.40.02.40.01.80.00.810.9
100–07.11.50.02.40.01.70.00.012.8
Table 5. Kinetic parameters during the anaerobic mono-digestion of silage mixtures at different inoculum-to-substrate ratios (ISRs) and co-digestion of silage mixture with cow manure at different feed mix (FM) (silage mixture (SM):cow manure (CM)) ratios in batch experiments at 37 °C.
Experimental Methane YieldsFirst-Order Kinetic ModelModified Gompertz ModelChen and Hashimoto Model
(NmL/gVSadded)Khyd
(Day−1)
B0
(NmL/gVSadded)
R2RMSE (%)% Differenceλ
(Day)
RMax (NmL/gVS.Day)B90
(NmL/gVSadded)
T90 (Days)Teff (Days)R2RMSE (%)% DifferenceKCHµm (Day−1)HRTCritical (Day)
ISR
0.5174.49± 9.290.000018240,578.30.9227.16NA15.2918.38157.0433.3318.040.994.716.170.90.185.43
1.0262.18 ± 14.960.06287.460.9914.078.791.7217.68235.9521.6819.950.995.395.320.690.283.48
2.0387.77 ± 14.430.11384.810.9911.290.76029.97348.9922.3922.390.9814.766.070.50.283.47
4.0482.23 ± 38.470.1474.410.9910.391.61013.69434.0022.4022.400.9820.716.745.843.060.32
Feed Mix ratio (SM:CM)
100–0387.77 ± 14.430.11384.810.9911.290.76029.97348.9922.3922.390.9814.766.070.50.283.47
75–25382.86 ± 24.630.08392.590.998.102.47023.64344.5725.0825.080.9916.545.090.480.244.13
50–50373.19 ± 11.790.07388.210.997.583.86020.70335.8726.0926.090.9916.744.830.610.254.04
25–75311.26 ± 16.490.06327.850.995.465.06015.84280.1327.8627.860.9913.395.140.830.263.8
0–100257.40 ± 12.760.04302.820.994.4814.99010.17231.6631.0031.000.999.080.640.960.254.07
T90—Time taken for 90% methane production. Tef—Effective methane production duration (T90λ).
Table 6. Theoretical and experimental methane yields, biodegradability index (BI) and co-digestion performance index (CPI).
Feed Mix Ratio (SM:CM)Theoretical
Methane Yield
(NmL CH4/gVSadded)
BI (%)Weighted
Methane Yield
(NmL CH4/gVSadded)
Experimental
Methane Yields
(NmL CH4/gVSadded)
%
Difference
CPISynergistic or Antagonistic Effect
100–0516.6075.06387.77387.77 ± 14.430.001.00No Effect
75–25493.4377.42354.60382.86 ± 24.637.171.07No Effect
50–50468.2679.70322.20373.19 ± 11.7913.661.15Synergistic
25–75443.0970.25289.80311.26 ± 16.496.891.07No Effect
0–100417.9361.59257.40257.40 ± 12.760.001.00No Effect
Disclaimer/Publisher’s Note: The statements, opinions and data contained in all publications are solely those of the individual author(s) and contributor(s) and not of MDPI and/or the editor(s). MDPI and/or the editor(s) disclaim responsibility for any injury to people or property resulting from any ideas, methods, instructions or products referred to in the content.

