
Effect of H2O Content on the Corrosion Behavior of X52 Steel in Supercritical CO2 Streams Containing O2, H2S, SO2 and NO2 Impurities

 ,
,
Abstract
:1. Introduction
2. Materials and Methods
3. Results and Discussion
3.1. Corrosion Rate
3.2. Morphological Observation of Corrosion Product Film
3.2.1. H2O Content of between 20 and 100 ppmv
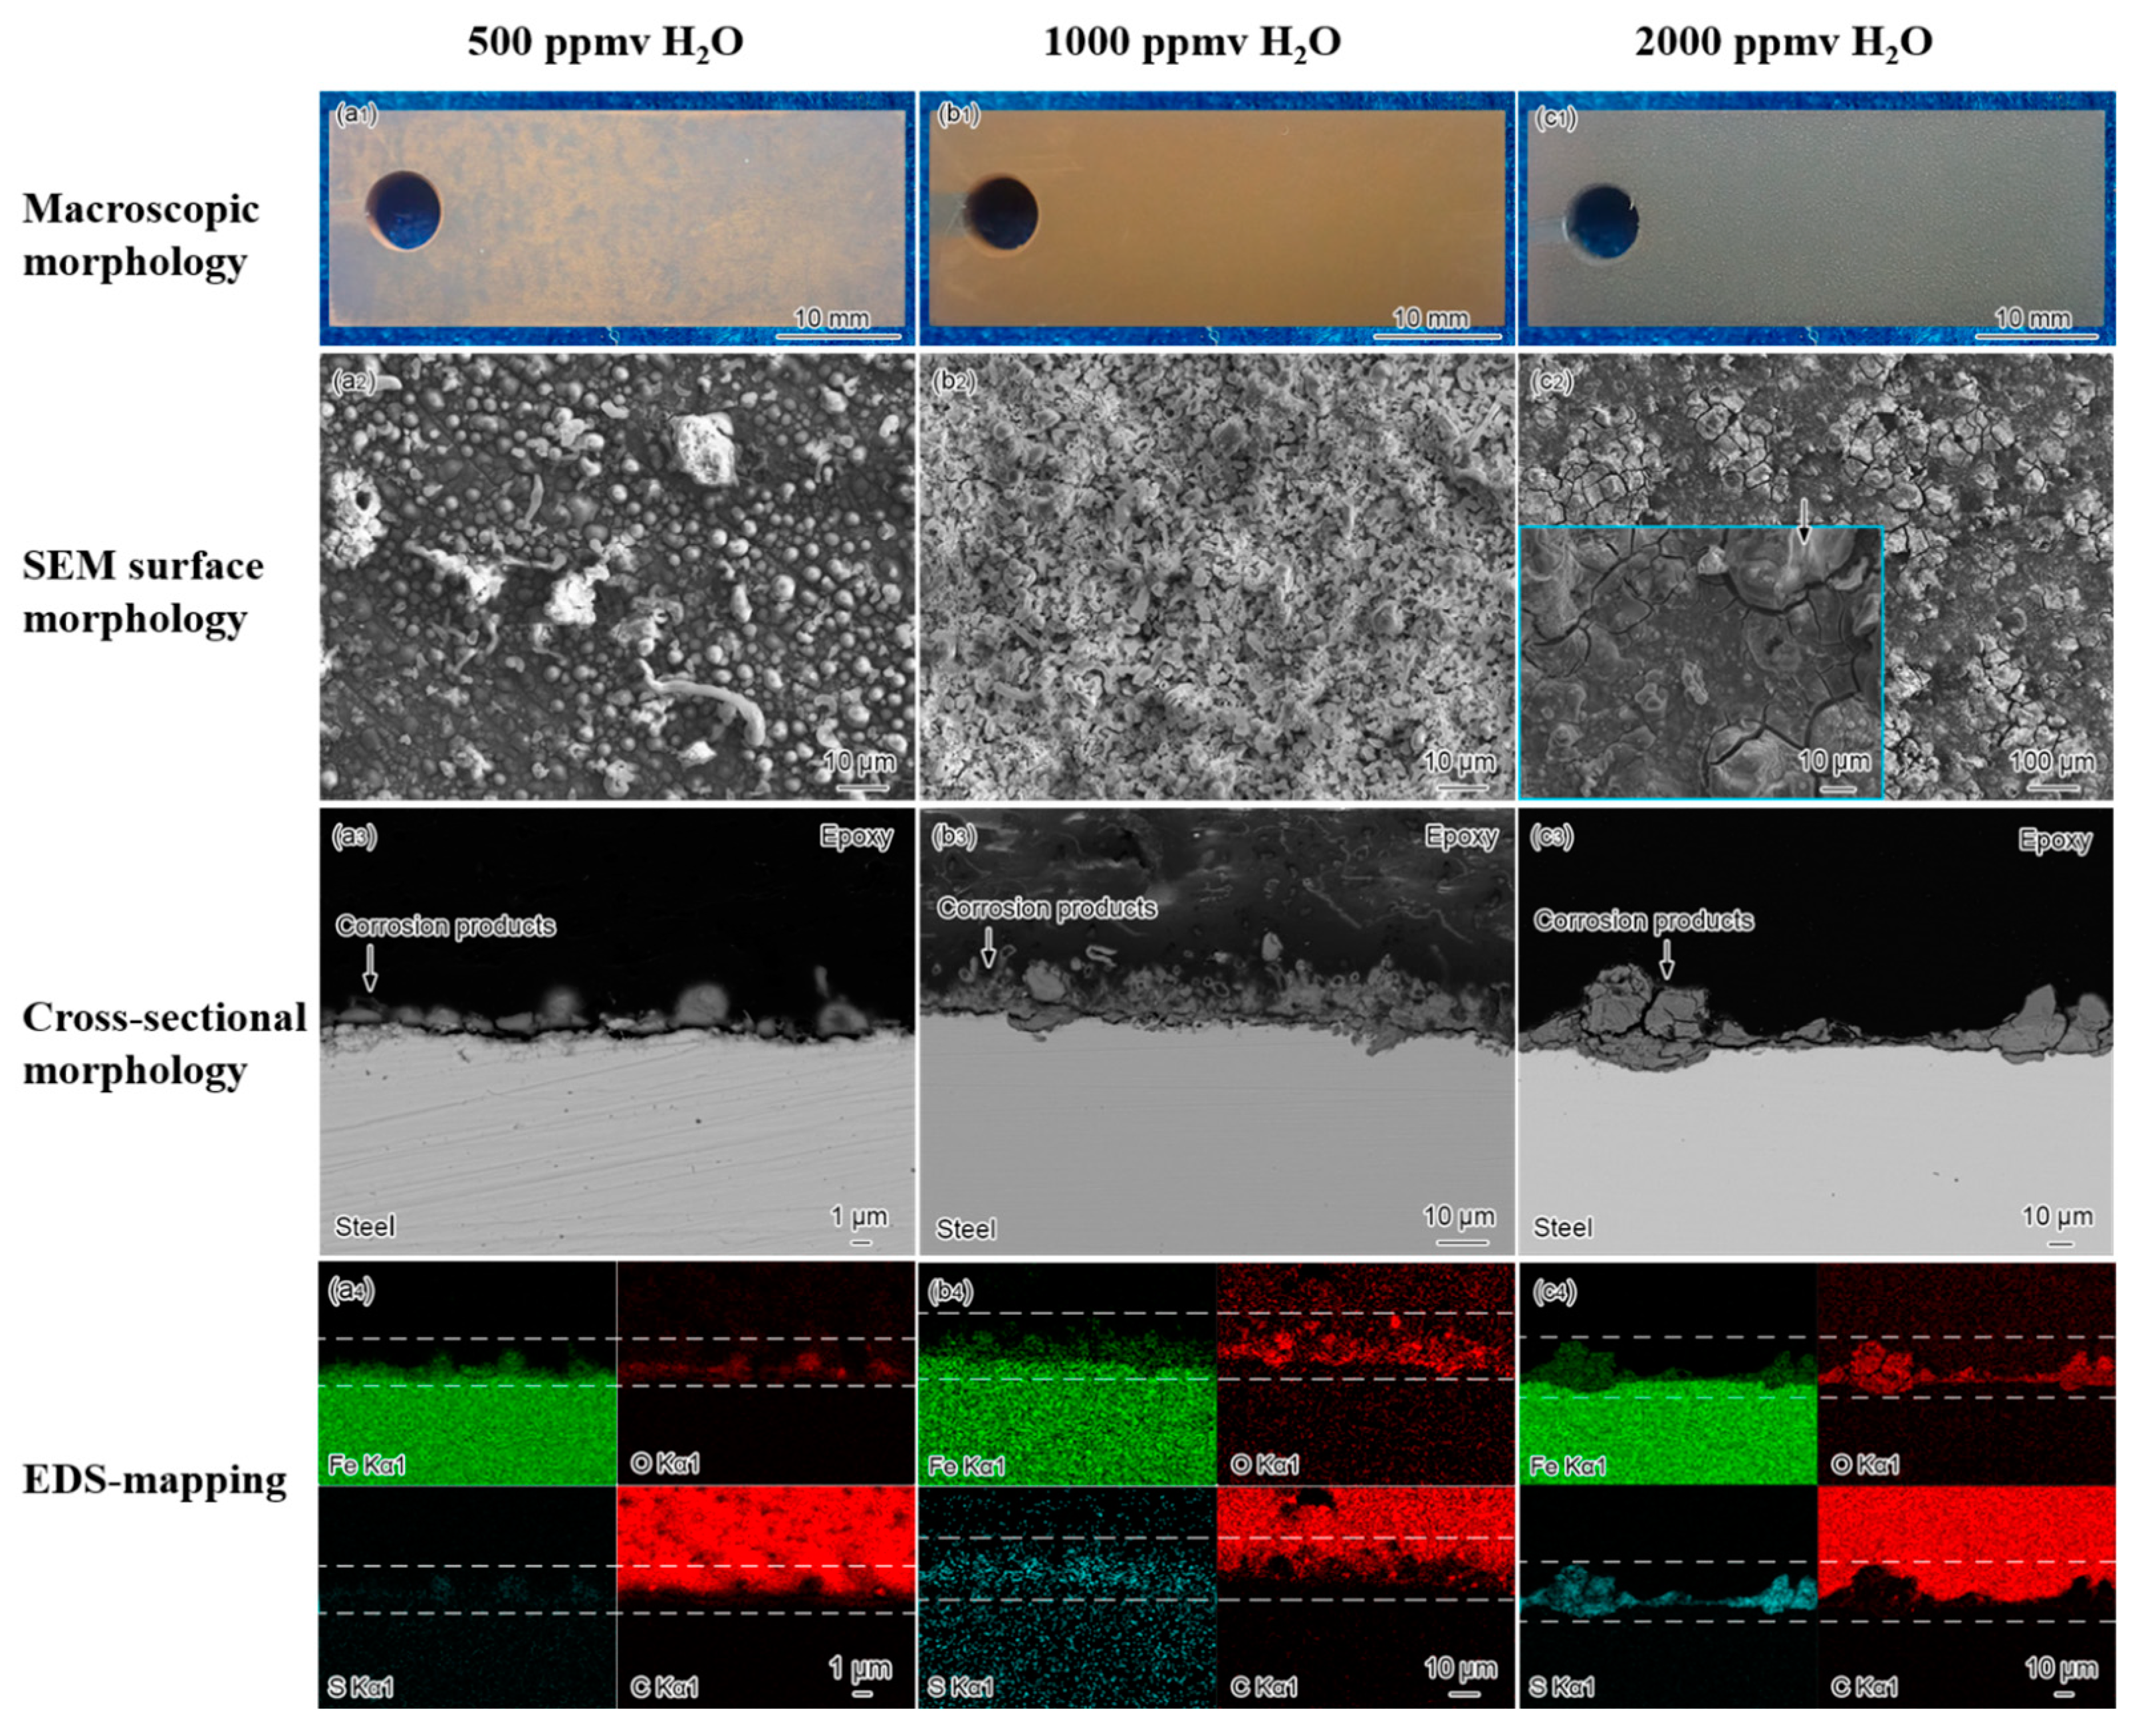
3.2.2. H2O Content of between 500 and 2000 ppmv
3.2.3. H2O Content of over 2000 ppmv
3.3. Analysis of Corrosion Products
3.3.1. XRD Analysis
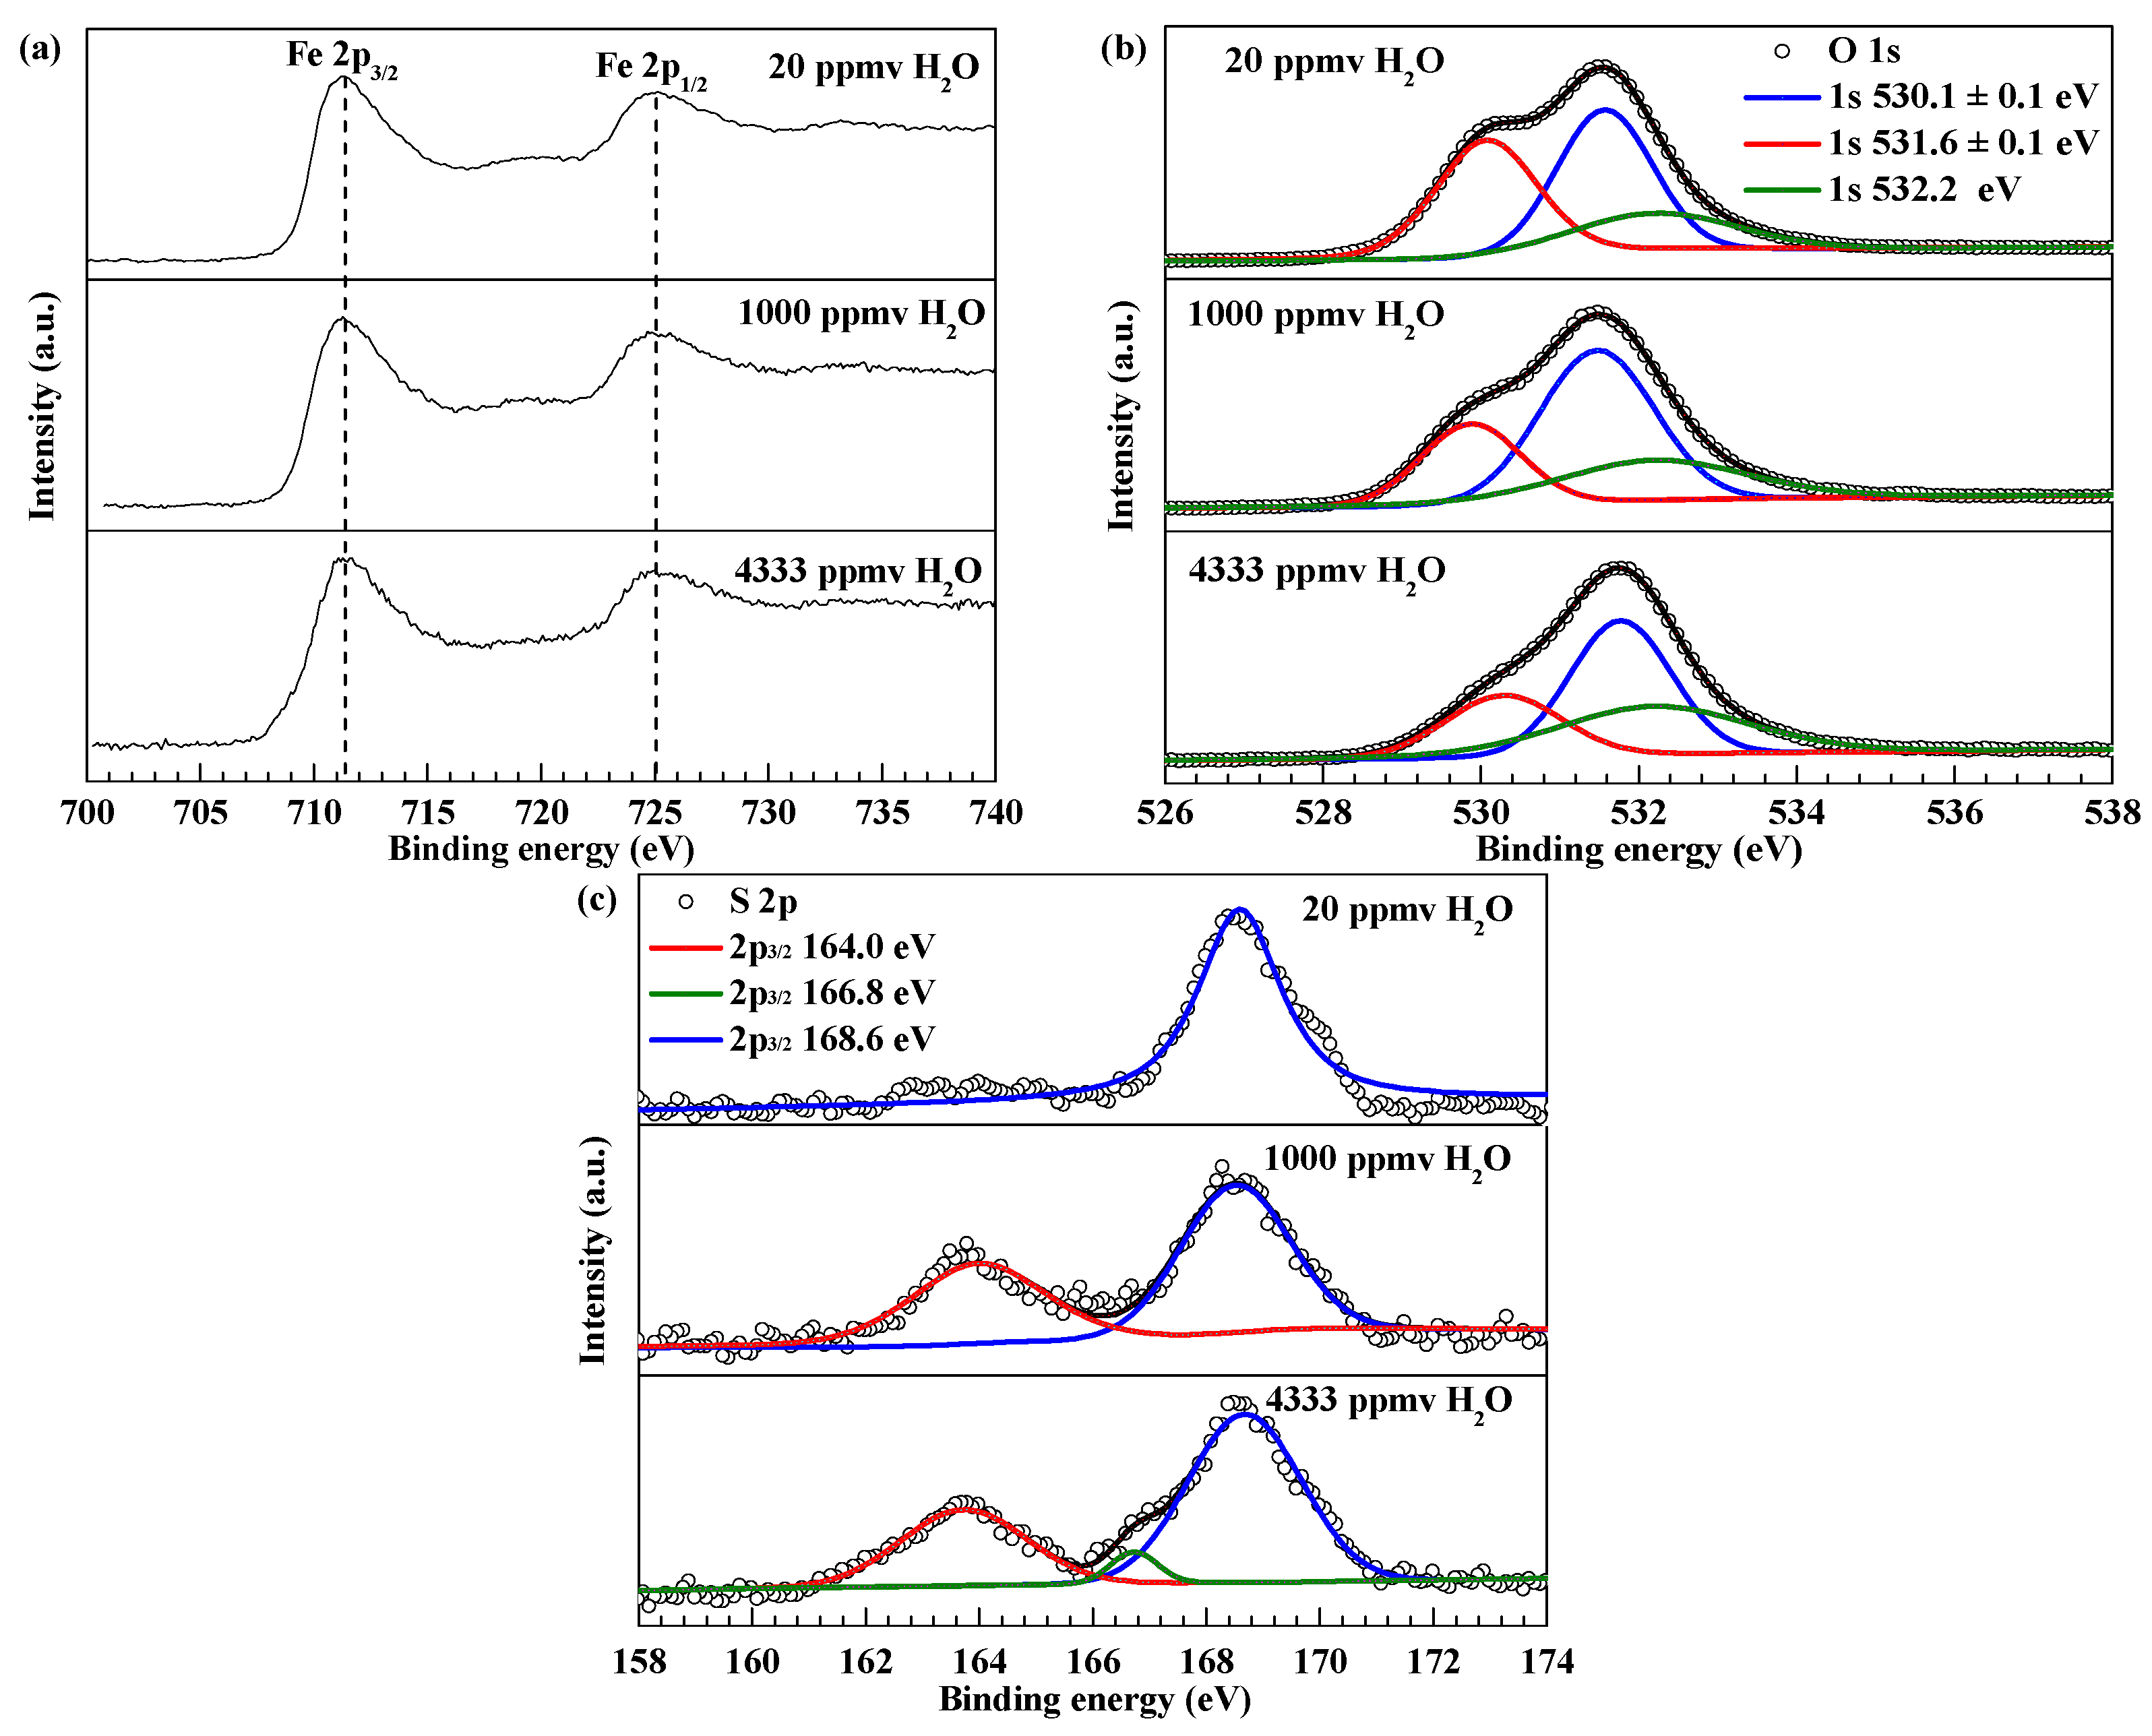
3.3.2. XPS Analysis
3.4. Analysis of Corrosion Mechanism
4. Conclusions
- (1)
- The corrosion rate of X52 steel increases from 0.0199 mm/y to 0.2838 mm/y as the H2O content increases from 20 ppmv to saturation solubility (4333 ppmv), while the critical H2O content that causes a significant change in the corrosion rate is 100 ppmv.
- (2)
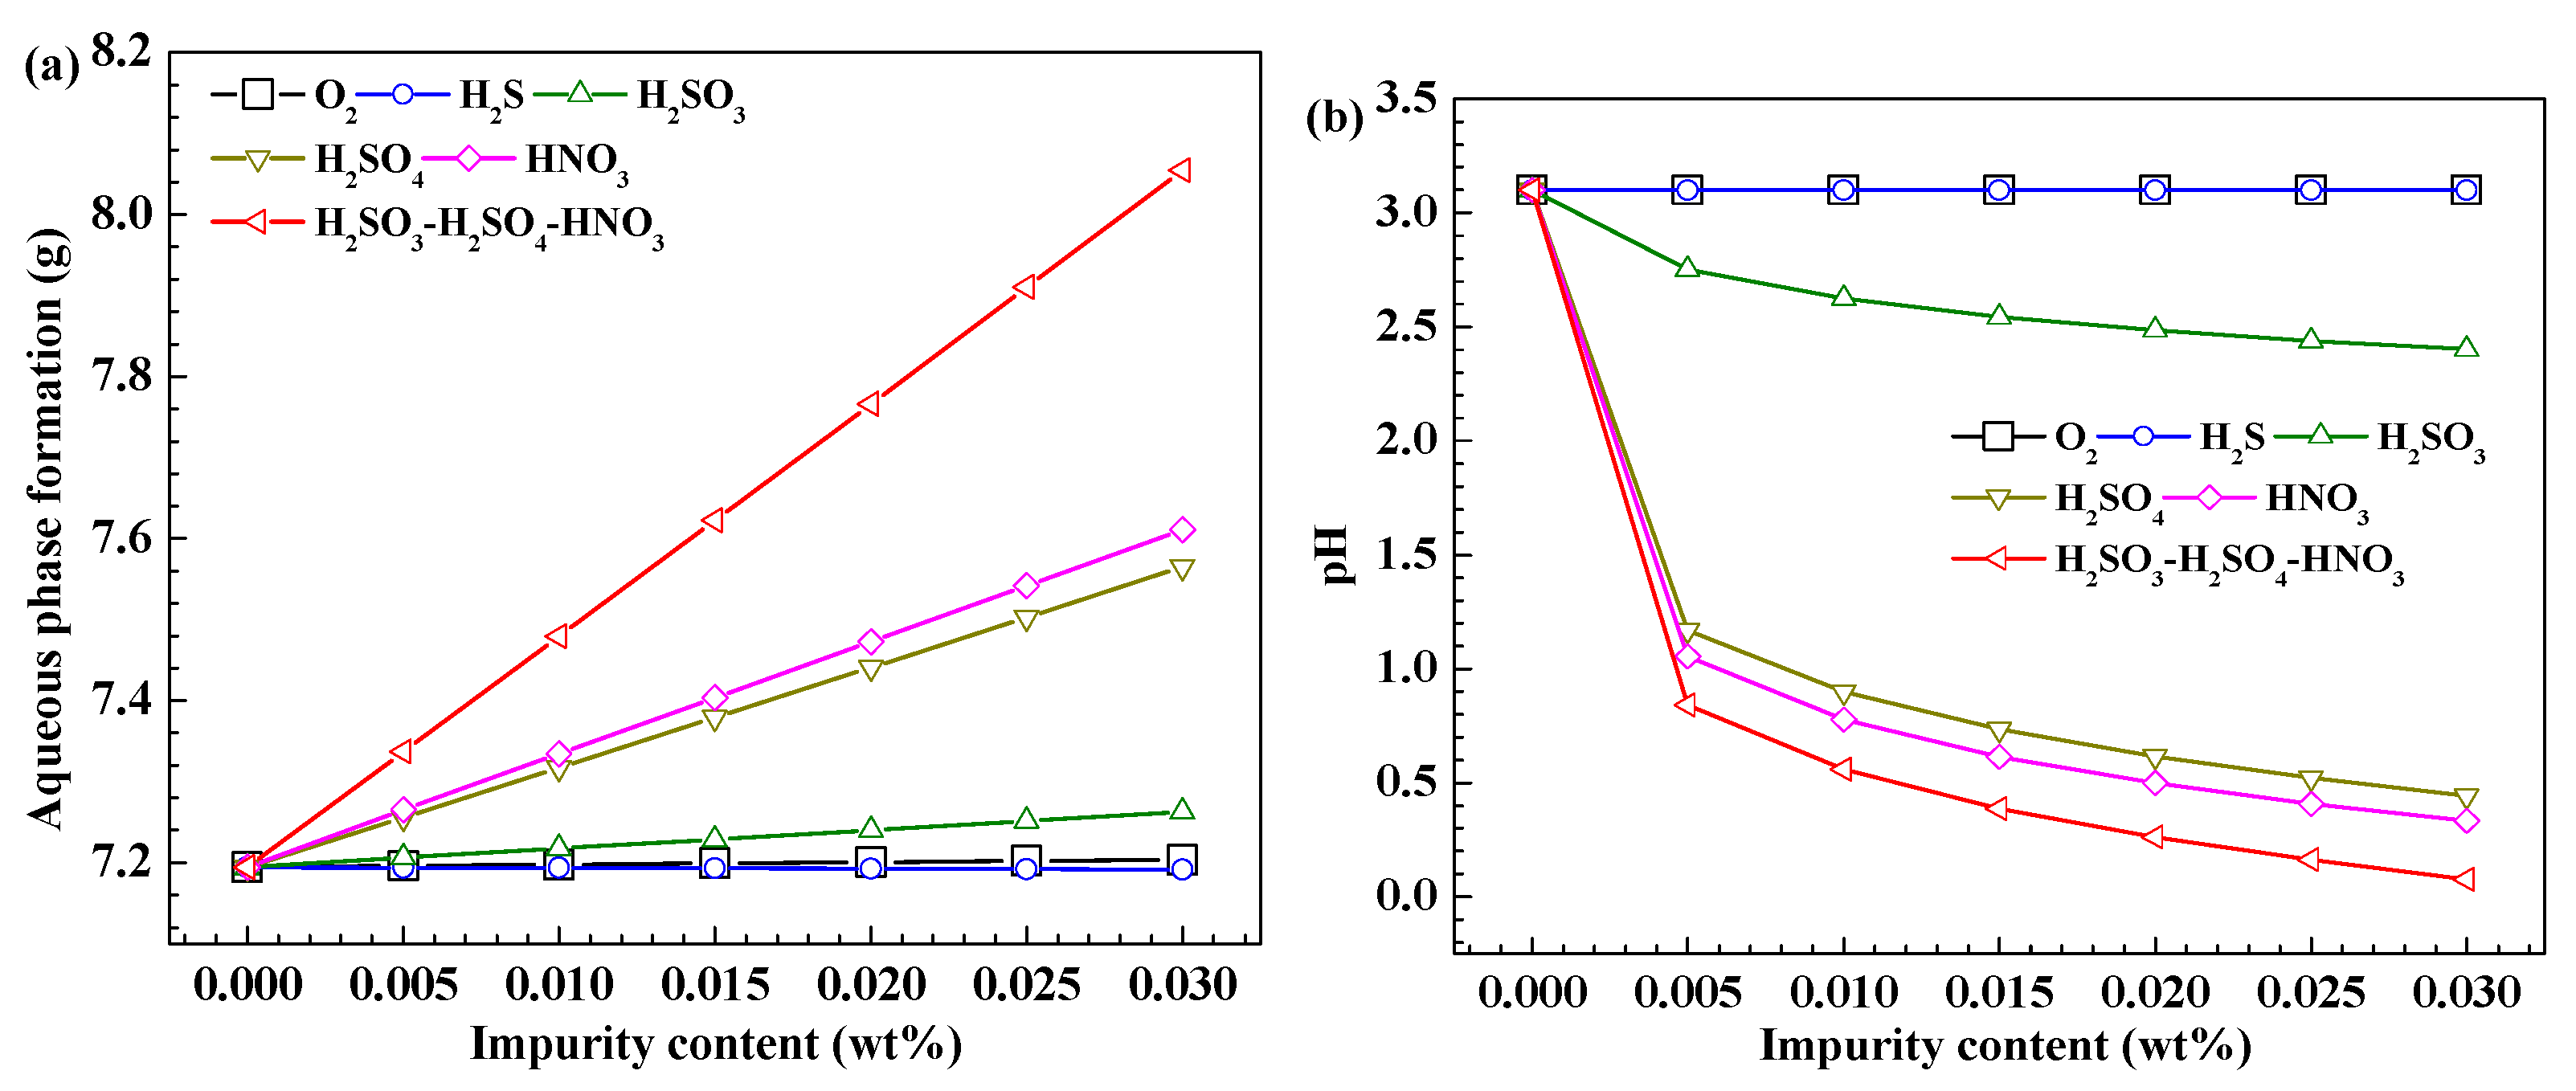
- O2, H2S, SO2 and NO2 impurities and their interactions jointly promote the formation of corrosive aqueous phases and aggravate the corrosion of X52 steel. With the increase in H2O content, the corrosion product film of X52 steel gradually changes from FeOOH-dominated film to FeSO4 and FeOOH mixed film. Correspondingly, the corrosion process of X52 steel, which is controlled by the products of impurity reactions at a low H2O content, is transformed to be under the joint control of impurities and the products of impurity reactions at a high H2O content.
- (3)
- The change in the corrosion rate of X52 steel strongly depends on the amount of aqueous phase precipitation in the environment and the amount of corrosive aqueous phase generated by the chemical reactions between impurities. The increase in H2O content and the direct participation of impurities in the corrosion process greatly aggravate the corrosion of X52 steel.
Author Contributions
Funding
Data Availability Statement
Conflicts of Interest
References
- Jones, A.C.; Lawson, A.J. Carbon Capture and Sequestration (CCS) in the United States; Congressional Research Service: Washington, DC, USA, 2021.
- Kairy, S.K.; Zhou, S.; Turnbull, A.; Hinds, G. Corrosion of pipeline steel in dense phase CO2 containing impurities: A critical review of test methodologies. Corros. Sci. 2023, 214, 110986. [Google Scholar] [CrossRef]
- Yao, J.; Han, H.; Yang, Y.; Song, Y.; Li, G. A review of recent progress of carbon capture, utilization, and storage (CCUS) in China. Appl. Sci. 2023, 13, 1169. [Google Scholar] [CrossRef]
- Peletiri, S.P.; Rahmanian, N.; Mujtaba, I.M. CO2 Pipeline design: A review. Energies 2018, 11, 2184. [Google Scholar] [CrossRef]
- Leung, D.Y.C.; Garamanna, G.; Maroto-Valer, M.M. An overview of current status of carbon dioxide capture and storage technologies. Renew. Sustain. Energy Rev. 2014, 39, 426–443. [Google Scholar] [CrossRef]
- Barker, R.; Hua, Y.; Neville, A. Internal corrosion of carbon steel pipelines for dense-phase CO2 transport in carbon capture and storage (CCS)—A review. Int. Mater. Rev. 2017, 62, 1–31. [Google Scholar] [CrossRef]
- Halseid, M.; Dugstad, A.; Morland, B. Corrosion and bulk phase reactions in CO2 transport pipelines with impurities: Review of recent published studies. Energy Procedia 2014, 63, 2557–2569. [Google Scholar] [CrossRef]
- Sun, C.; Sun, J.B.; Liu, S.B.; Wang, Y. Effect of water content on the corrosion behavior of X65 pipeline steel in supercritical CO2-H2O-O2-H2S-SO2 environment as relevant to CCS application. Corros. Sci. 2018, 137, 151–162. [Google Scholar] [CrossRef]
- Morland, B.H.; Tadesse, A.; Svenningsen, G.; Springer, R.D.; Anderko, A. Nitric and sulfuric acid solubility in dense phase CO2. Ind. Eng. Chem. Res. 2019, 58, 22924–22933. [Google Scholar] [CrossRef]
- Xiang, Y.; Xu, M.H.; Choi, Y.S. State-of-the-art overview of pipeline steel corrosion in impure dense CO2 for CCS transportation: Mechanisms and models. Corros. Eng. Sci. Technol. 2017, 52, 485–509. [Google Scholar] [CrossRef]
- Sun, C.; Wang, Y.; Sun, J.B.; Lin, X.Q.; Li, X.D.; Liu, H.F.; Cheng, X.K. Effect of impurity on the corrosion behavior of X65 steel in water-saturated supercritical CO2 system. J. Supercrit. Fluids 2016, 116, 70–82. [Google Scholar] [CrossRef]
- Zhao, G.X.; Wang, Y.C.; Zhang, S.Q.; Song, Y. Influence mechanism of H2S/CO2-charging on corrosion of J55 steel in an artificial solution. J. Chin. Soc. Corros. Prot. 2022, 42, 785–790. [Google Scholar]
- Sun, C.; Liu, J.X.; Sun, J.B.; Li, H.; Zhao, Z.; Lin, X.Q.; Wang, Y. Corrosion behaviors of X65 steel in gaseous CO2 environment containing impurities. J. China Univ. Petrol. 2022, 43, 129–139. [Google Scholar]
- Li, C.; Xiang, Y.; Song, C.C.; Ji, Z.L. Assessing the corrosion product scale formation characteristics of X80 steel in supercritical CO2-H2O binary systems with flue gas and NaCl impurities relevant to CCUS technology. J. Supercrit. Fluids 2019, 146, 107–119. [Google Scholar] [CrossRef]
- Cui, G.; Yang, J.G.; Liu, J.G.; Li, Z.L. A comprehensive review of metal corrosion in a supercritical CO2 environment. Int. J. Greenh. Gas. Control 2019, 90, 102814. [Google Scholar] [CrossRef]
- Jiang, X.; Qu, D.R.; Song, X.L.; Liu, X.H.; Zhang, Y.L. Critical water content for corrosion of X65 mild steel in gaseous, liquid and supercritical CO2 stream. Int. J. Greenh. Gas. Control 2019, 85, 11–22. [Google Scholar] [CrossRef]
- Sun, C.; Sun, J.B.; Luo, J.-L. Unlocking the impurity-induced pipeline corrosion based on phase behavior of impure CO2 streams. Corros. Sci. 2020, 165, 108367. [Google Scholar] [CrossRef]
- Morland, B.; Norby, T.; Tjelta, M.; Sevenningsen, G. Effect of SO2, O2, NO2, and H2O concentrations on chemical reactions and corrosion of carbon steel in dense phase CO2. Corrosion 2019, 75, 1327–1338. [Google Scholar] [CrossRef]
- Choi, Y.-S.; Hassani, S.; Vu, T.N.; Nešić, S.; Abas, A.Z.B. Effect of H2S on the corrosion behavior of pipeline steels in supercritical and liquid CO2 environments. Corrosion 2016, 72, 999–1009. [Google Scholar] [CrossRef]
- Sun, J.; Sun, C.; Zhang, G.; Li, X.; Zhao, W.; Jiang, T.; Liu, H.; Cheng, X.; Wang, Y. Effcet of O2 and H2S impurities on the corrosion behavior of X65 steel in water-saturated supercritical CO2 system. Corros. Sci. 2016, 107, 31–40. [Google Scholar] [CrossRef]
- De Visser, E.; Hendriks, C.; Barrio, M.; Molnvik, M.J.; de Koeijer, G.; Liljemark, S.; Le Gallo, Y. Dynamis CO2 quality recommendations. Int. J. Greenh. Gas. Control 2008, 2, 478–484. [Google Scholar] [CrossRef]
- Xiang, Y.; Wang, Z.; Yang, X.X.; Zheng, L.; Ni, W.D. The upper limit of moisture content for supercritical CO2 pipeline transport. J. Supercrit. Fluids 2012, 67, 14–21. [Google Scholar] [CrossRef]
- Sun, C.; Sun, J.B.; Wang, Y.; Lin, X.Q.; Li, X.D.; Cheng, X.K.; Liu, H.F. Synergistic effect of O2, H2S and SO2 impurities on the corrosion behavior of X65 steel in water-saturated supercritical CO2 system. Corros. Sci. 2016, 107, 193–203. [Google Scholar] [CrossRef]
- ISO 27913:2016; Carbon Dioxide Capture, Transportation and Geological Storage—Pipeline Transportation Systems. International Organization for Standardization: Geneva, Switzerland, 2016.
- Shirley, P.; Myles, P. Quality Guidelines for Energy System Studies: CO2 Impurity Design Parameters; National Energy Technology Laboratory: Pittsburgh, PA, USA, 2019; pp. 12–18.
- Brown, J.; Graver, B.; Gulbrandsen, E.; Dugstad, A.; Morland, B. Update of DNV recommended practice RP-J202 with focus on CO2 corrosion with impurities. Energy Procedia 2014, 63, 2432–2441. [Google Scholar] [CrossRef]
- ASTM G1-03:2011; Standard Practice for Preparing, Cleaning, and Evaluating Corrosion Test Specimens. ASTM International: West Conshohocken, PA, USA, 2011.
- Liu, J.; Saw, R.E.; Kiang, Y.-H. Calculation of effective penetration depth in X-ray diffraction for pharmaceutical solids. J. Pharm. Sci. 2010, 99, 3807–3814. [Google Scholar] [CrossRef]
- Heuer, J.K.; Stubbins, J.F. An XPS characterization of FeCO3 films from CO2 corrosion. Corros. Sci. 1999, 41, 1231–1243. [Google Scholar] [CrossRef]
- Xiang, Y.; Wang, Z.; Xu, C.; Zhou, C.; Li, Z.; Ni, W. Impact of SO2 concentration on the corrosion rate of X70 steel and iron in water-saturated supercritical CO2 mixed with SO2. J. Supercrit. Fluids 2011, 58, 286–294. [Google Scholar] [CrossRef]
- Dugstad, A.; Halseid, M.; Morland, B. Effect of SO2 and NO2 on corrosion and solid formation in dense phase CO2 pipelines. Energy Procedia 2013, 37, 2877–2887. [Google Scholar] [CrossRef]
- Xu, M.; Zhang, Q.; Yang, X.X.; Wang, Z.; Liu, J.; Li, Z. Impact of surface roughness and humidity on X70 steel corrosion in supercritical CO2 mixture with SO2, H2O, and O2. J. Supercrit. Fluids 2016, 107, 286–297. [Google Scholar] [CrossRef]
- Sim, S.; Cole, I.S.; Choi, Y.-S.; Birbilis, N. A review of the protection strategies against internal corrosion for the safe transport of supercritical CO2 via steel pipelines for CCS purposes. Int. J. Greenh. Gas. Con. 2014, 29, 185–199. [Google Scholar] [CrossRef]
- Mclntire, G.; Lippert, J.; Yedelson, J. The effect of dissolved CO2 and O2 on the corrosion of iron. Corrosion 1990, 46, 91–95. [Google Scholar] [CrossRef]
- Choi, Y.S.; Nešić, S.; Young, D. Effect of impurities on the corrosion behavior of CO2 transmission pipeline steel in supercritical CO2-water environments. Environ. Sci. Technol. 2010, 44, 9233–9238. [Google Scholar] [CrossRef]


| Temperature (°C) | CO2 (MPa) | O2 (ppmv) | H2S (ppmv) | SO2 (ppmv) | NO2 (ppmv) | H2O (ppmv) |
|---|---|---|---|---|---|---|
| 50 | 10 | 200 | 200 | 200 | 200 | 20, 100, 500 1000, 2000, 4333 |
| Region | Fe | O | S |
|---|---|---|---|
| A | 27.2 | 65.1 | 4.6 |
| B | 33.7 | 64.6 | 1.1 |
Disclaimer/Publisher’s Note: The statements, opinions and data contained in all publications are solely those of the individual author(s) and contributor(s) and not of MDPI and/or the editor(s). MDPI and/or the editor(s) disclaim responsibility for any injury to people or property resulting from any ideas, methods, instructions or products referred to in the content. |
© 2023 by the authors. Licensee MDPI, Basel, Switzerland. This article is an open access article distributed under the terms and conditions of the Creative Commons Attribution (CC BY) license (https://creativecommons.org/licenses/by/4.0/).
Share and Cite
Liu, J.; Yao, D.; Chen, K.; Wang, C.; Sun, C.; Pan, H.; Meng, F.; Chen, B.; Wang, L. Effect of H2O Content on the Corrosion Behavior of X52 Steel in Supercritical CO2 Streams Containing O2, H2S, SO2 and NO2 Impurities. Energies 2023, 16, 6119. https://doi.org/10.3390/en16176119
Liu J, Yao D, Chen K, Wang C, Sun C, Pan H, Meng F, Chen B, Wang L. Effect of H2O Content on the Corrosion Behavior of X52 Steel in Supercritical CO2 Streams Containing O2, H2S, SO2 and NO2 Impurities. Energies. 2023; 16(17):6119. https://doi.org/10.3390/en16176119
Chicago/Turabian StyleLiu, Jia, Dengzun Yao, Kai Chen, Chao Wang, Chong Sun, Huailiang Pan, Fanpeng Meng, Bin Chen, and Lili Wang. 2023. "Effect of H2O Content on the Corrosion Behavior of X52 Steel in Supercritical CO2 Streams Containing O2, H2S, SO2 and NO2 Impurities" Energies 16, no. 17: 6119. https://doi.org/10.3390/en16176119
APA StyleLiu, J., Yao, D., Chen, K., Wang, C., Sun, C., Pan, H., Meng, F., Chen, B., & Wang, L. (2023). Effect of H2O Content on the Corrosion Behavior of X52 Steel in Supercritical CO2 Streams Containing O2, H2S, SO2 and NO2 Impurities. Energies, 16(17), 6119. https://doi.org/10.3390/en16176119