1. Introduction
The study examines the relationship between the E.U.’s 2010–2019 energy management variables and the Union’s economic growth. The analysis of past data enables the recognition of time-related trends and the identification of correlations between energy variables and critical points that may affect the future energy management processes of the E.U. The data analysis from 2010–2019 helps us to understand past events’ causes and consequences and can improve the quality of future decisions regarding the E.U.’s energy management.
Researchers should be aware that analyzing past data generally does not guarantee future results but can help reduce the risk and increase opportunities to make better decisions for the future. The current energy situation cannot be considered ideal from several points of view since it has few energy carrier assets that would adequately satisfy a significant part of its needs. The decrease in production resulting from the depletion of traditional energy resources currently needs to be offset by nonconventional (oil shale, oil sand, shale gas) resources, the exploitation of which needs to be improved by several factors.
After the 2008 global economic crisis, the European Union is trying to create mechanisms to prevent adverse effects on global energy management. The new instrument was necessary because the E.U.’s economic growth was threatened by growing import dependence, limited diversification, high and variable energy prices, and growing global energy demand. The data confirm a previous claim, showing that Europe produced only 39% of the energy it needed in 2019, with the rest imported [
1]. Additional sources of danger were the security problems that affect the producing and transit countries, the growing threat from climate change, and decarbonization. Following the subprime crisis, there was a need to accelerate the slow progress achieved in energy efficiency in the E.U., to increase the share of renewable energy sources, and for greater transparency, further integration, and interconnection of energy markets.
The study has several objectives, one of which is to determine recommendations for improving the energy efficiency and sustainability of the European Union’s economy in the current situation showing an energy crisis. The study examines the correlation between the European Union’s G.D.P. between 2010–2019 and its four energy management variables (energy consumption, CO2 emissions, average energy price, and renewable energy use) to determine the proposals. Based on the analysis results, the study formulates public policy conclusions to develop a more efficient, environmentally friendly, and sustainable energy policy.
Another goal of the research is to present the evolution of the E.U.’s energy efficiency with statistical data. The European Union achieved robust economic growth during the examined period, and the combined G.D.P. of the member countries showed a continuous rise. Theoretically, the continuously growing economic output of the E.U. required the use of more and more energy, which led to an increase in the economy’s harmful emissions and energy demand—the rising demand for energy carriers—in theory—increased energy prices. One of the aims of this study is to prove or disprove the theoretical relationships formulated in the previous sentences. The data in the study tables also answered these questions, but this was not the primary goal of the research.
According to a study, energy policy in the E.U. significantly impacts the design and implementation of environmental and energy policies in member states and globally. One of the critical challenges of the European energy policy is climate change. The European Commission (E.C.) sought to create an energy union in the 2010s to provide Europe with safe, affordable, and climate-friendly energy. To achieve this, some have proposed a compromise that includes fossil fuel efficiency and different types of power in the energy mix. In contrast, others have supported measures brought about by the Circular Economy (C.E.) and Cradle Cradle (C2C) [
2].
The energy sector is transforming from traditional energy to new and renewable technologies. By defining the energy policy guidelines, the European Union adopted the following energy sector development goals for the period 2010–2020, following the principle of sustainable development: a 20% reduction in greenhouse gas emissions, a 20% increase in renewable energy, and a minimum 10% increase in the percentage of biofuels in the final energy consumption [
3].
Much research has appeared in recent years on the interaction between economic growth and other macroeconomic variables. A study that correlates the economic growth of the E.U. in the selected period (2010–2019) with the independent variables presented here has yet to be published. The study’s originality lies in the analysis examining energy management variables that have yet to be linked in detail and directly with the G.D.P. of the European Union.
At the end of the introductory chapter, the study describes the future energy ecosystem of the E.U.
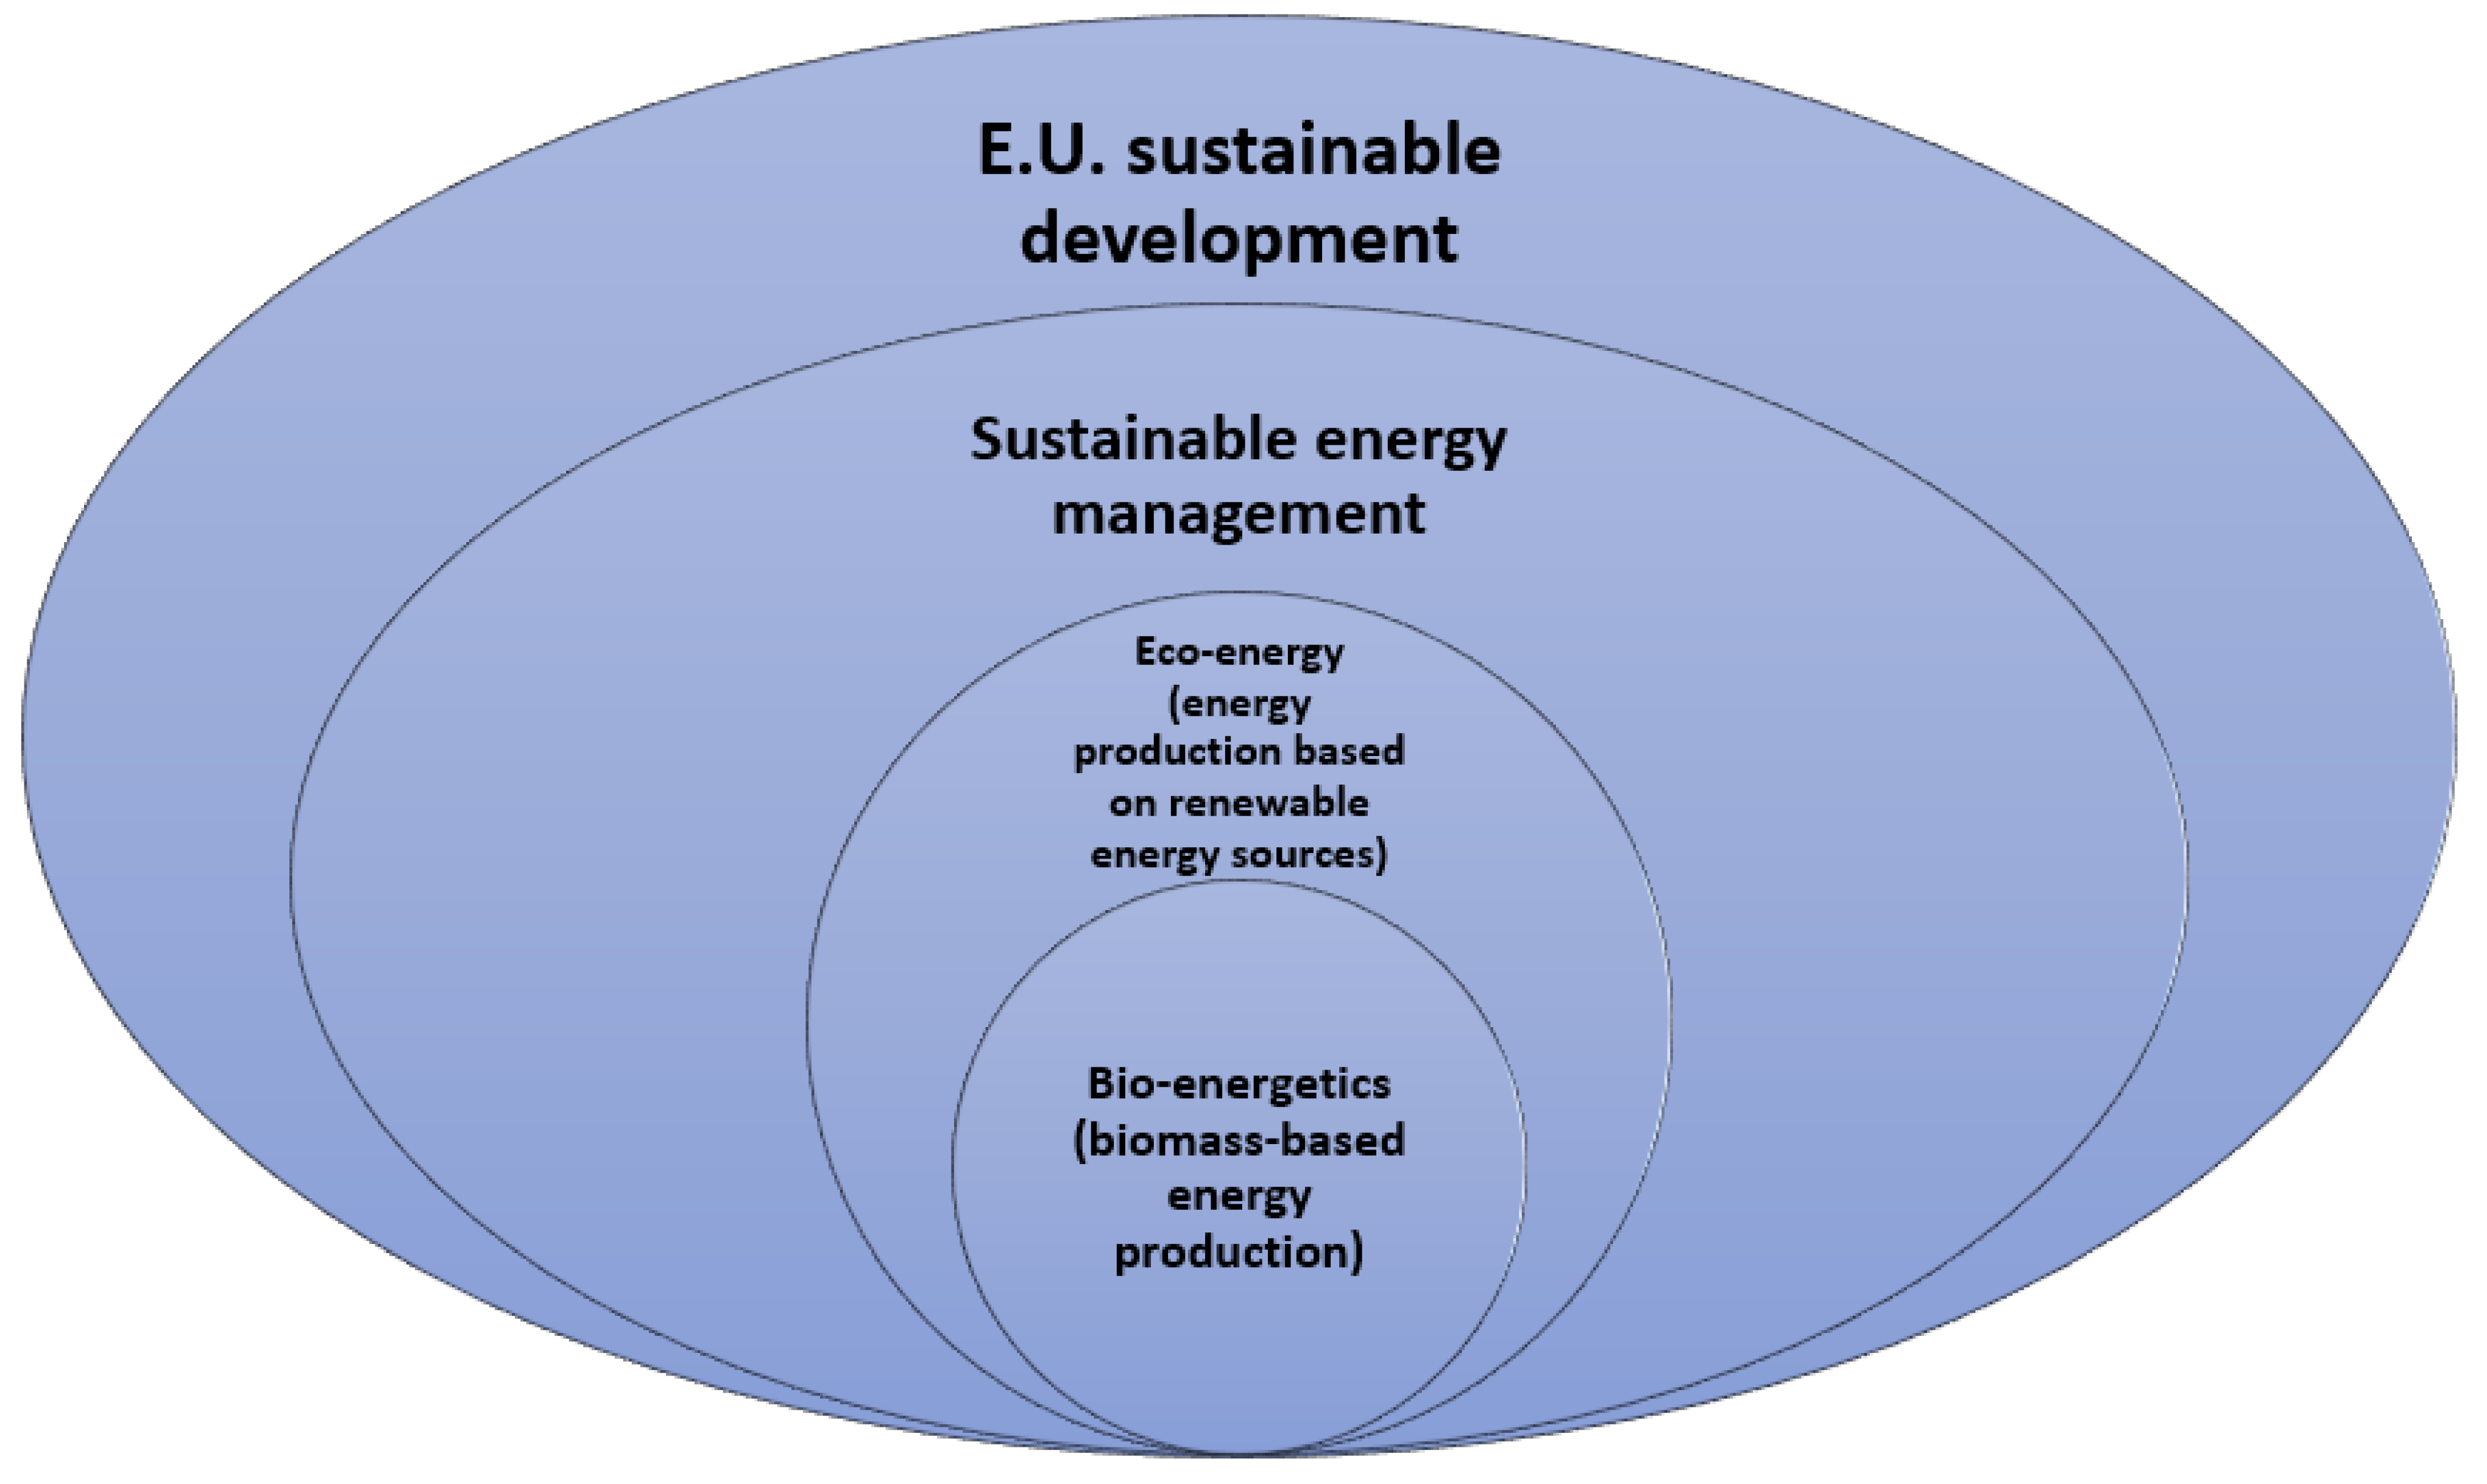
At the heart of the energy ecosystem of the future is the concept of sustainable development, which includes the principles and practices of sustainable energy management, eco-energetics, and bio-energetics. Sustainable energy management aims to ensure the long-term sustainability of energy production and use, considering ecological, economic, and social factors. And eco-energetics and bio-energetics focus on exploiting alternative, renewable energy sources, such as solar energy, wind energy, biomass, and other green technologies, which reduce the environmental load and the sustainability of energy production.
The sketched system is shown in the figure below:
Figure 1 includes the following concepts, which can be summarized in a hierarchy: 1. Sustainable development: development that meets the needs of the present without compromising the needs of future generations. 2. Sustainable energy management: implementing the complex process of energy production, storage, transport, and use, integrating social, economic, and ecological aspects; transforming classical energy management into sustainable development. 3. Eco-energetics: the system of activities of the energy vertical based on renewable resources—only renewable and renewable energy sources are included in this scope. 4. Bio-energetics: in an energetic interpretation, the system of activities of the energy vertical based on biomass refers to a particular group of renewable energy sources. Accordingly, one of the critical areas of sustainable energy management is eco-energy, the use of renewable energy sources. Nonrenewable energy sources must also be managed as part of sustainable energy management, as their total replacement is impossible in the foreseeable future.
2. Review
The relationship between the energy economic variables examined in this study and economic growth was analyzed separately by several articles [
4,
5,
6,
7,
8,
9,
10,
11].
Energy management underwent significant changes following the 2008–2009 financial crisis. Increasing energy efficiency has become one of the most important objectives of the E.U. The setting of energy efficiency targets in the E.U. and related legislation and programs have helped to ensure that the reduction of energy consumption contributes to the economic growth of the E.U., environmental protection, and increased competitiveness [
12,
13,
14].
The second significant change in the energy management objectives was the increase in the use of renewable energy sources. The European Union strengthened its policies to switch to renewable energy sources (such as solar, wind, etc.) and reduce carbon dioxide emissions. The member states of the E.U. undertook the task of ensuring that 20% of their total energy consumption uses renewable sources by 2020 [
15,
16,
17]. Improving energy security became the third-priority objective in the E.U. The E.U. also strengthened efforts to improve energy security after the crisis. The Commission aimed to ensure that the energy supply is reliable and safe, and that the energy balance is sustainable in the E.U. member states. In this context, the E.U. paid more attention to the diversification of gas supply, the expansion of energy infrastructure, and the creation of more efficient energy networks [
18,
19,
20].
Reducing energy prices has also become an essential objective in E.U.’s energy management. As a result of the financial crisis, the cost of energy carriers temporarily decreased, but energy prices started to rise again after 2010. Fluctuations in energy prices represented a substantial economic risk. Rising prices motivated the European Union to reduce its energy needs further and diversify energy sources. Ensuring competitiveness has become a vital issue for the E.U., but this has been made difficult by significant primary energy imports and high energy prices [
21,
22].
Abbreviations used in this study: gross domestic product (G.D.P.), energy price (EnP), renewable energy (ReE), energy consumption (EnC), greenhouse gas emissions (CO2), and European Union (E.U.).
The relevance of the topic of this research is that it connects the economic growth of the E.U. with the selected four independent variables for the period 2010–2019. The investigation will reveal which independent energy economic variables (EnC, CO2, EnP, ReF) positively correlated with economic growth as a target variable (G.D.P.). The energy economy variables showing a positive correlation can provide the E.U. with guidance on which energy management areas need to be vigorously developed for the E.U.’s economy to grow sustainably and competitively.
The values of the target variable and independent variables presented in the study also indicate what results the E.U. achieved in the objectives mentioned above during the period under review. In recent years, more and more research has appeared on the interaction between economic growth and other macroeconomic variables in the last eight years (United Nations Framework Convention on Climate Change, UNFCCC) since its signing in 2015. However, a study that correlates the economic growth of the E.U. in this selected period (2010–2019) with the independent variables presented here has yet to be published.
The fully adjusted ordinary least squares estimates of the panel show that a 1% increase in energy consumption increases the real value added by the industrial sectors by 0.871%, and a 1% increase in the real value added by the industrial sectors increases energy consumption by 1.103%. The panel vector error correction models of the causality tests were estimated using the system-wide moment method. For example, economists use various measurement methods to study statistical data from different periods to explore the intrinsic relationship between an economy’s energy consumption and economic development. The data show that the results vary widely. Researchers have found a one-way cause-and-effect relationship from economic growth to energy consumption in the short term [
23,
24].
Some researchers also included the economic development of national economies in their investigation. The empirical results indicate a long-term equilibrium relationship between economic growth, the structure of energy consumption, and the emission of greenhouse gases within the examined panels [
25]. Empirical results from other research show that natural resources have a positive effect on the ecological footprint because they degrade the quality of the environment, and these natural resources contribute to strengthening the Environmental Kuznets Hypothesis (EKC) [
26].
Table 1 summarizes the relevant studies related to economic growth in the group of authors, examined period, country or group of countries, macroeconomic variables, applied methodology, and more critical findings.
After reviewing the literature, this study formulates a critical statement. The crux of the criticism is that the results of individual studies sometimes need to be more consistent because they arrive at different impacts on the same research topic. The other effects can be explained by the researchers conducting their research over a distant time horizon. Another explanation could be that a methodology needs to be applied more consistently or that researchers use different methods. In the case of research that compares countries and covers an extended period, it can also lead to inconsistent results if the research needs to consider that the industry structures, components of energy consumption, and many other macroeconomic factors have changed in the countries.
3. Materials and Methods
The primary data from the PLS-SEM analysis are contained in the table below:
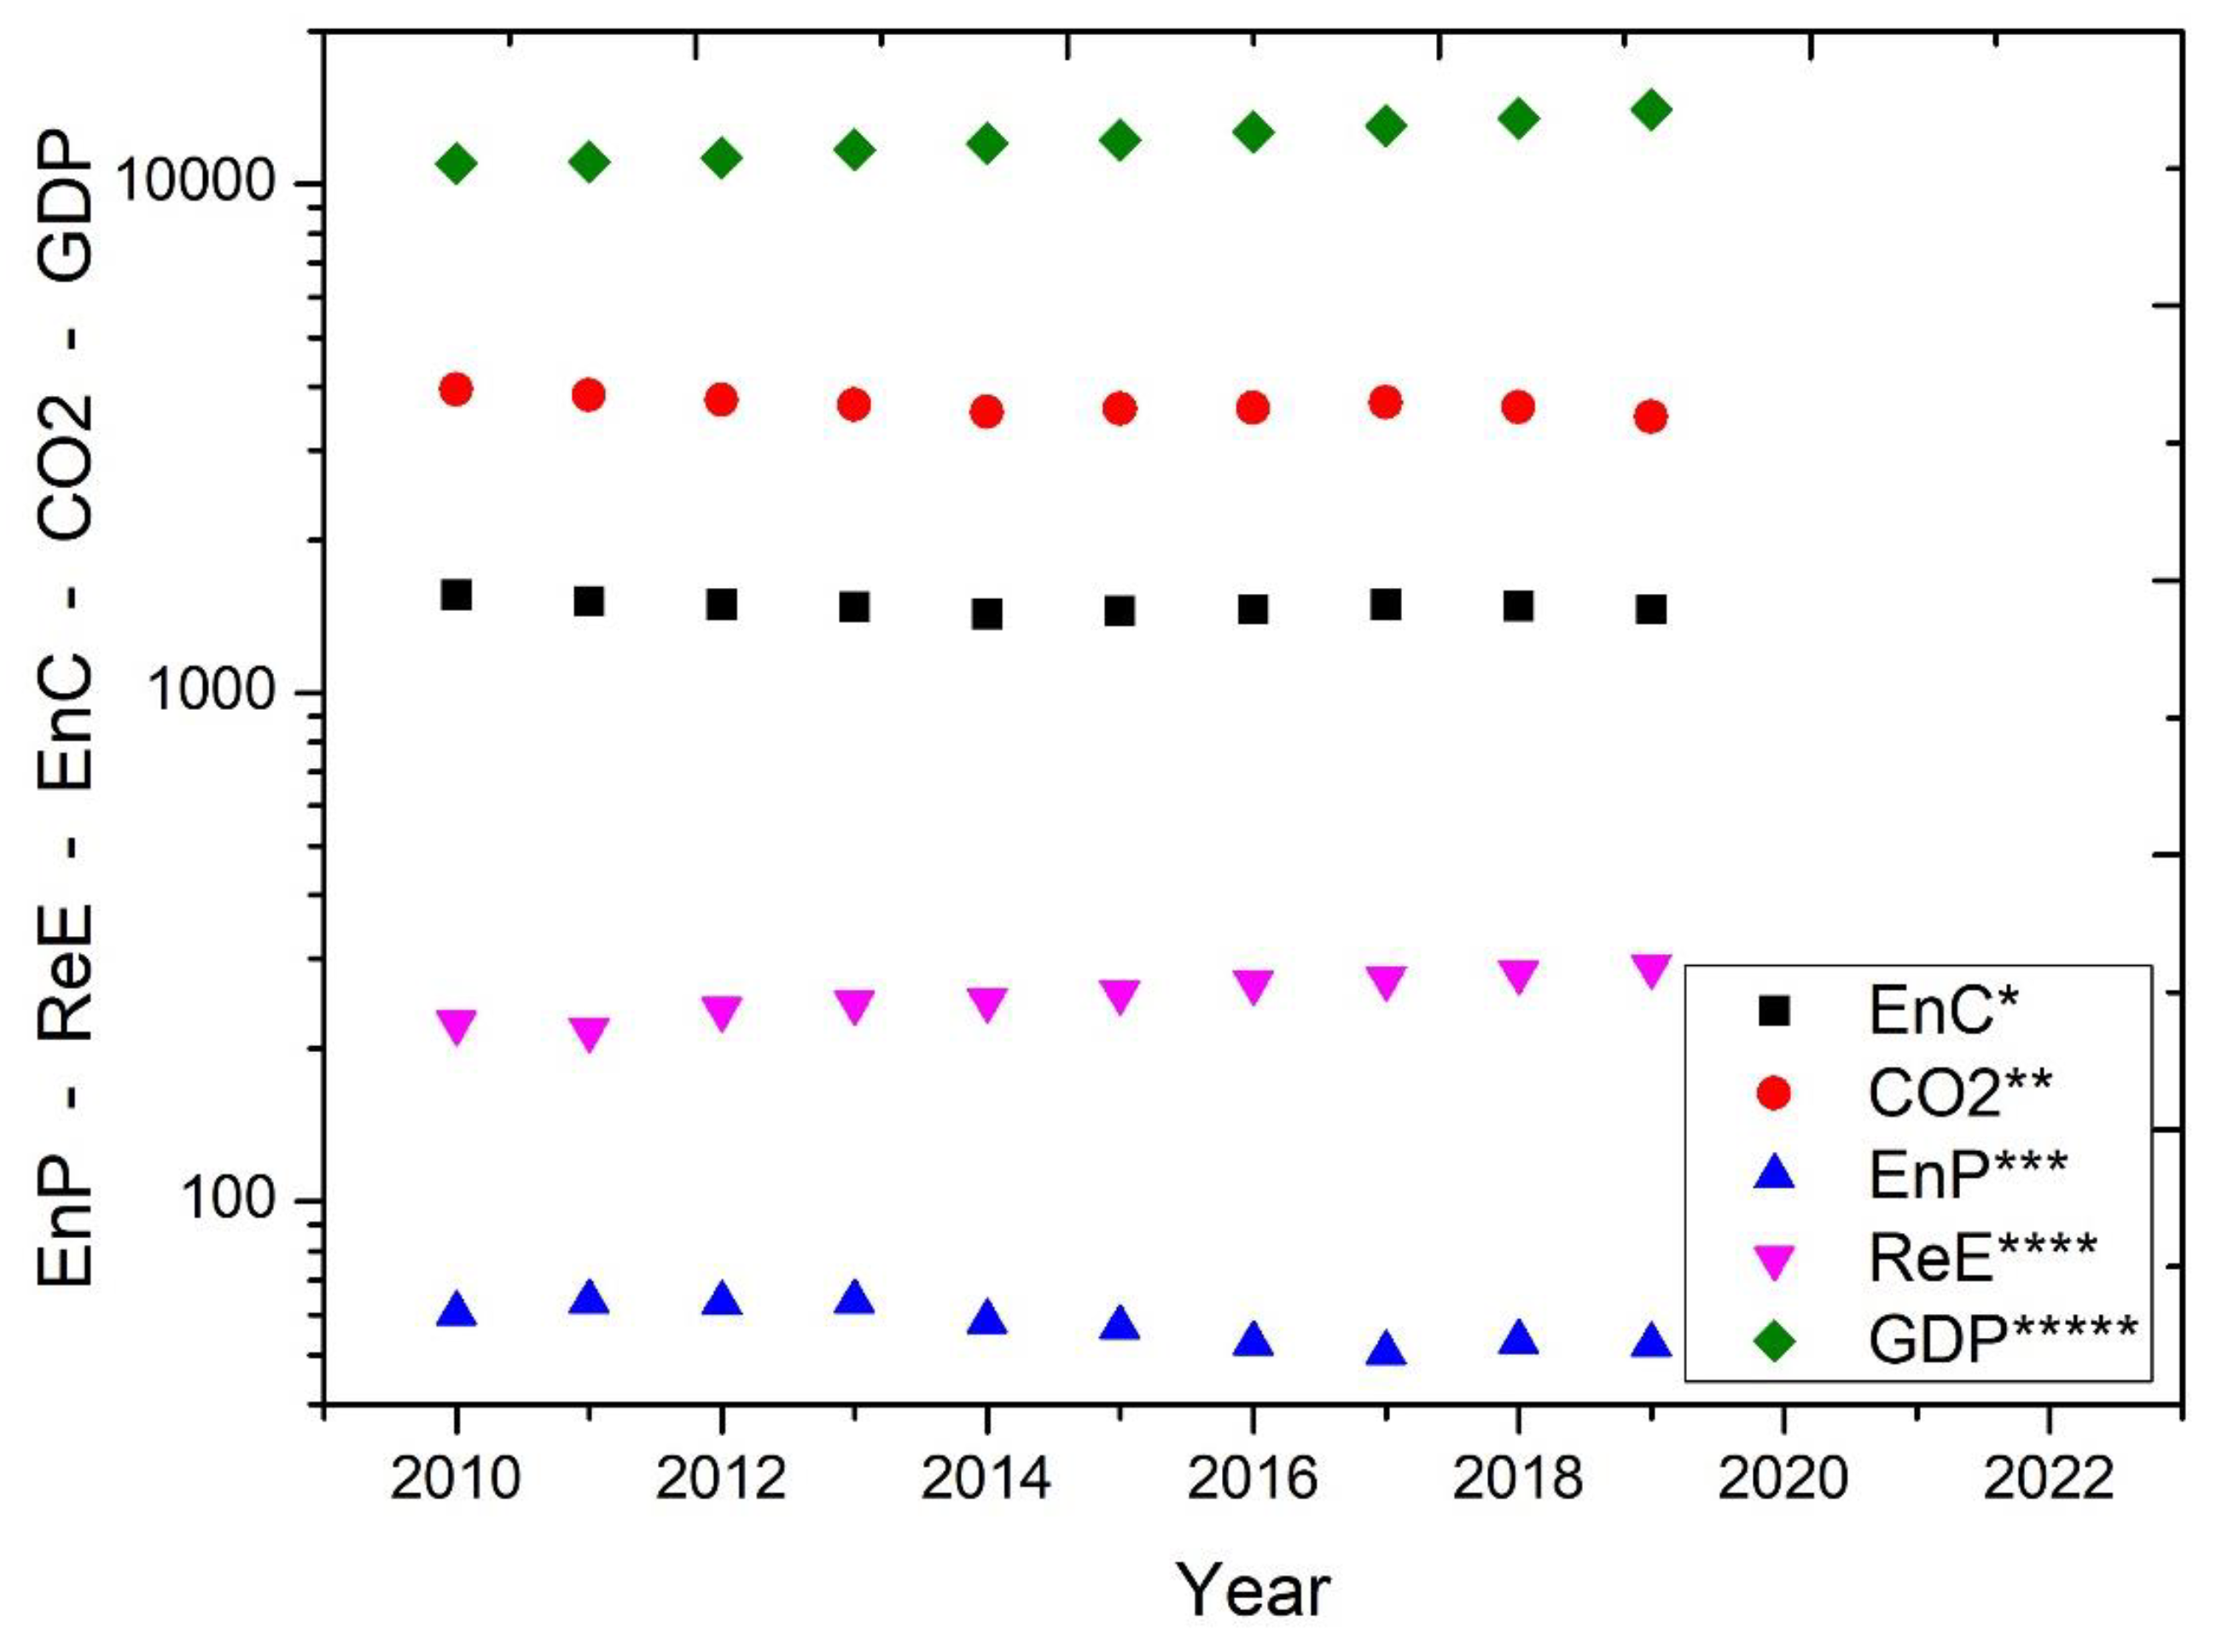
Based on the time series data, the values of G.D.P. and ReE show a continuous increase, while the importance of EnC and CO2 show a permanent decrease. However, fluctuations in the EnP values can be observed.
Table 2 illustrates the primary data on the economic growth and energy management of the European Union. When comparing the data for the last (2019) and first (2010) years of the examined period, the following data results are available: energy consumption of 6.1, CO
2 emissions of 11.5, the average energy price decreased by 13.1%, renewable energy consumption increased by 28.9%, and G.D.P. grew by 27.6% in 2019 compared to 2010.
Data on economic growth and energy management in the E.U. are shown logarithmically in
Figure 2.
The PLS-PM method was initially developed for exploratory research, but it can also support other research endeavors thanks to its improvements. The fit test and adaptation of the entire model based on Bootstrap make the method suitable for confirmatory research. In these cases, when the goal is to test the theory and understand the relationships between the variables, the investigation is based on the evaluation of the difference between the empirical and the variance/covariance matrices created by the model and the newly introduced model fit indicators support this, which provides an opportunity for the constructions for the consistent estimation of relationships. Based on these findings, the PLS-PM methodology can already support five research endeavors: confirmatory, explanatory, exploratory, descriptive, and predictive research.
In addition to measuring these constructions, it is necessary to create an opportunity to learn about the relationships between them and measure their impact on each other. The method of structural equations, i.e., S.E.M. (structural equation modeling), is suitable for this [
32]. There are two approaches to exploring the relationships: CB-SEM (covariance-based) approaches the model connections on a covariance basis, while PLS-SEM approaches the model connections on a variance basis [
33]. The P.L.S. method is the most appropriate for several sample elements [
34].
In the case of models consisting of purely created variables (emergent variables) and constellations with a small number of elements, PLS-PM performs exceptionally well compared to other variance-based methods [
35], as precision plays a prominent role when estimating path coefficients [
36]. Due to the nature of PLS-SEM, it always uses a composite model for estimation, regardless of whether it is a latent or hybrid model. Due to the previous statement, the rules for identifying blended models must be strictly followed [
37,
38].
During the definition of the model, it must be ensured that each concept is related to at least one other image (with a path coefficient different from 0), thus ensuring that the weights can be individually retrieved from the variance/covariance matrix of the indicators. The sign of importance of the different indicator blocks can be ambiguous; therefore, the dominant indicator approach is recommended, according to which the direction of the value of the concepts must be recorded [
39].
This study chose PLS-PM because of its minimal sample size requirement and precise computational and modern approach to model development. In addition, PLS-PM has low data dependence and does not need to constrain parameters, and the model setup is simple and easy to handle [
40,
41].
Table 3 presents the variables used in the analysis and their values for the years 2010–2019.
The study performed reliability and validity tests with the data of the samples selected for the study. The test results are as follows:
- I.
AVE (Average Variance Extracted) test:
AVE shows the average ratio of the squared loadings of all factors to the variance among the factors. The statement about values between 0 and 1 is correct because the AVE value lies between 0 and 1, which means that the variance explained by the factors is large enough to measure the constructs reliably.
- II.
C.R. test:
The C.R. value shows how reliable the construct is if it lies between 0 and 1. Generally, a value above 0.7 is desirable as it indicates that factors reliably measure a construct.
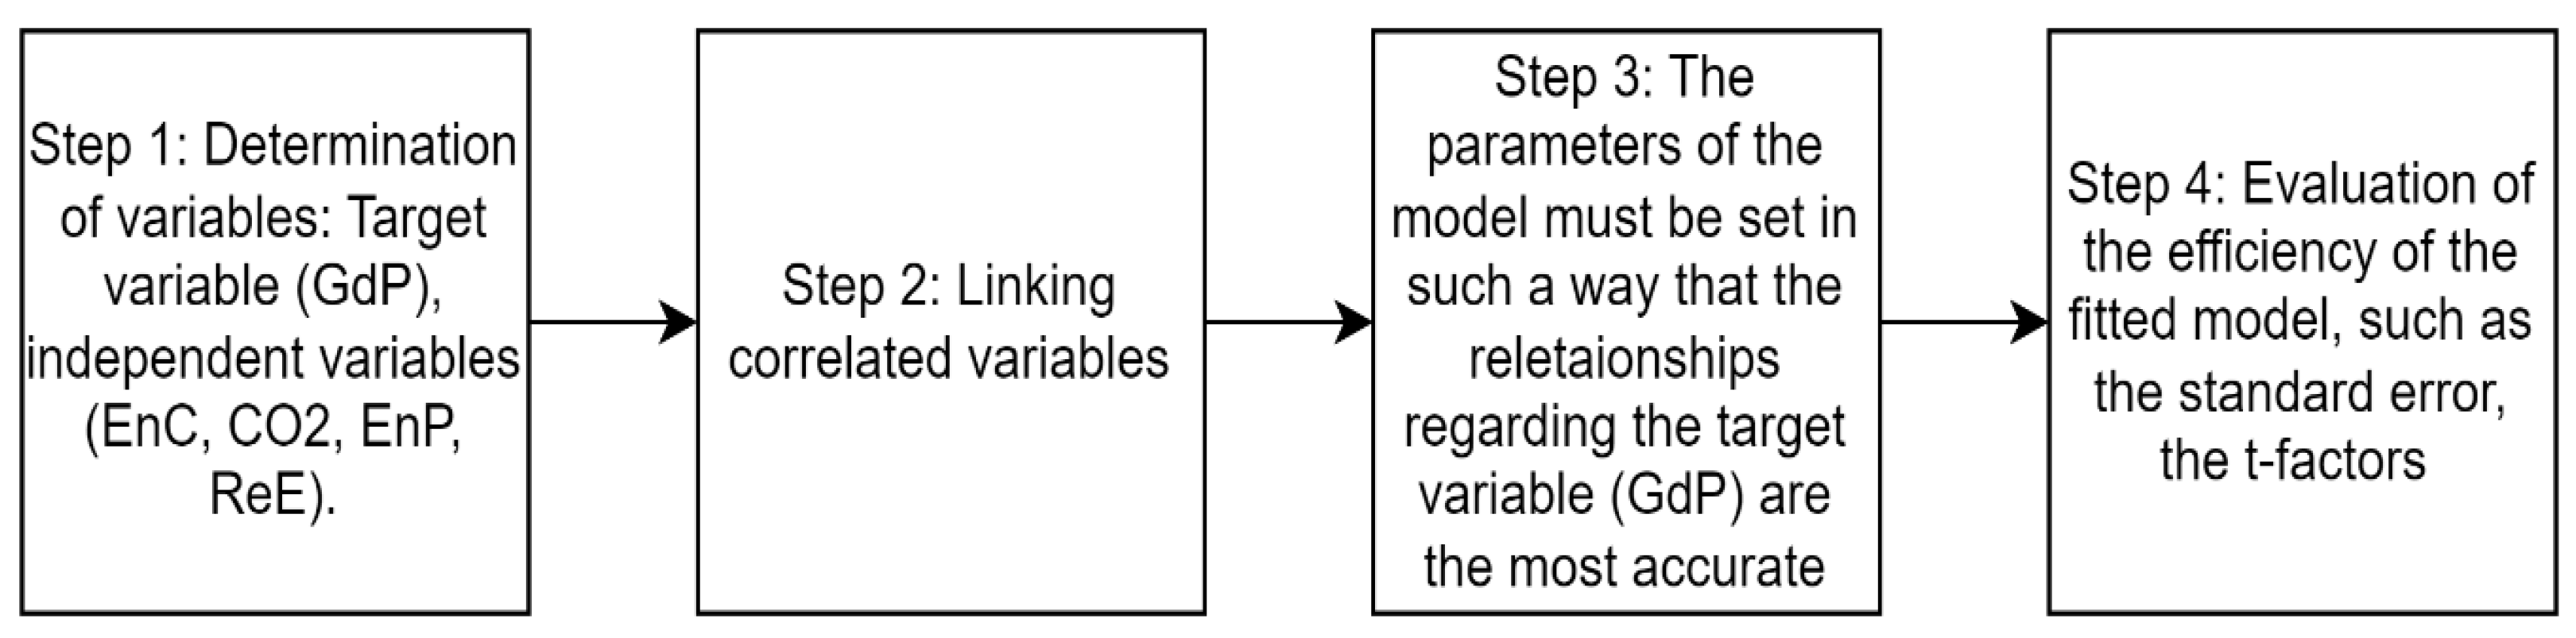
The steps of the PLS-PM analysis were as follows:
Model structure: For the PLS-PM analysis, the model variables had to be defined first, i.e., the dependent (G.D.P.) and independent variables (EnC, CO2, EnP, ReE).
Correlation of the model: The correlations between the four independent variables and the dependent variable had to be examined, and the variables with a strong correlation had to be connected to form a smaller number of higher-level factors.
Model fitting: The model created in the previous step had to be fitted to the data using the PLS-PM algorithm. During the fitting, the model parameters had to be adjusted to make the relationships regarding the dependent variable (G.D.P.) as accurate as possible.
Model evaluation: The effectiveness of the fitted model had to be evaluated with several statistical indicators, such as the R2 or Q2 value of the model fit, the standard error, t-factors, effects, etc. The evaluation helps us to understand the relationships between the dependent and independent variables and their impact on the dependent variable.
The main stages of the research presented in the study and the procedures performed in them are illustrated in
Figure 3. The sections follow a logical sequence of functions.
The following figure shows the individual technical steps:
After the standardization step was applied during the preprocessing, the algorithm used the following mathematical equations and formulas when performing the PLS-PM analysis.
Structural equation:
where G.D.P. is the G.D.P. of the European Union, E is energy consumption, CO
2 is CO
2 emissions, Á is the average energy price, M is renewable energy consumption, and β1-β4 are the weighting factors.
Regression equation:
where y is the dependent variable, x1-xk are the independent variables, b0-bk are the regression coefficients, and e is the error.
Multivariate regression:
where y is the vector of dependent variables, X is the matrix of independent variables, b is the vector of regression coefficients, and e is the error vector.
Weighted component analysis (WCPA) formula:
where F is the factor space, X is the original data matrix, W is the weighting matrix, and V is the covariance matrix.
The formula of component weights:
where w is the weights of the components, X is the original data matrix, P is the weighting matrix of the multivariate regression’s predictive variables, and F is the factor space.
Two-matrix structural equation (2M-SEM) model:
where X are the independent variables, Y are the dependent variables, and Λ and Γ are the weights of the independent and dependent factors. Ψ and Δ are the effects of the independent and dependent facets, F and U are the factors and error, and e and d are the error vectors.
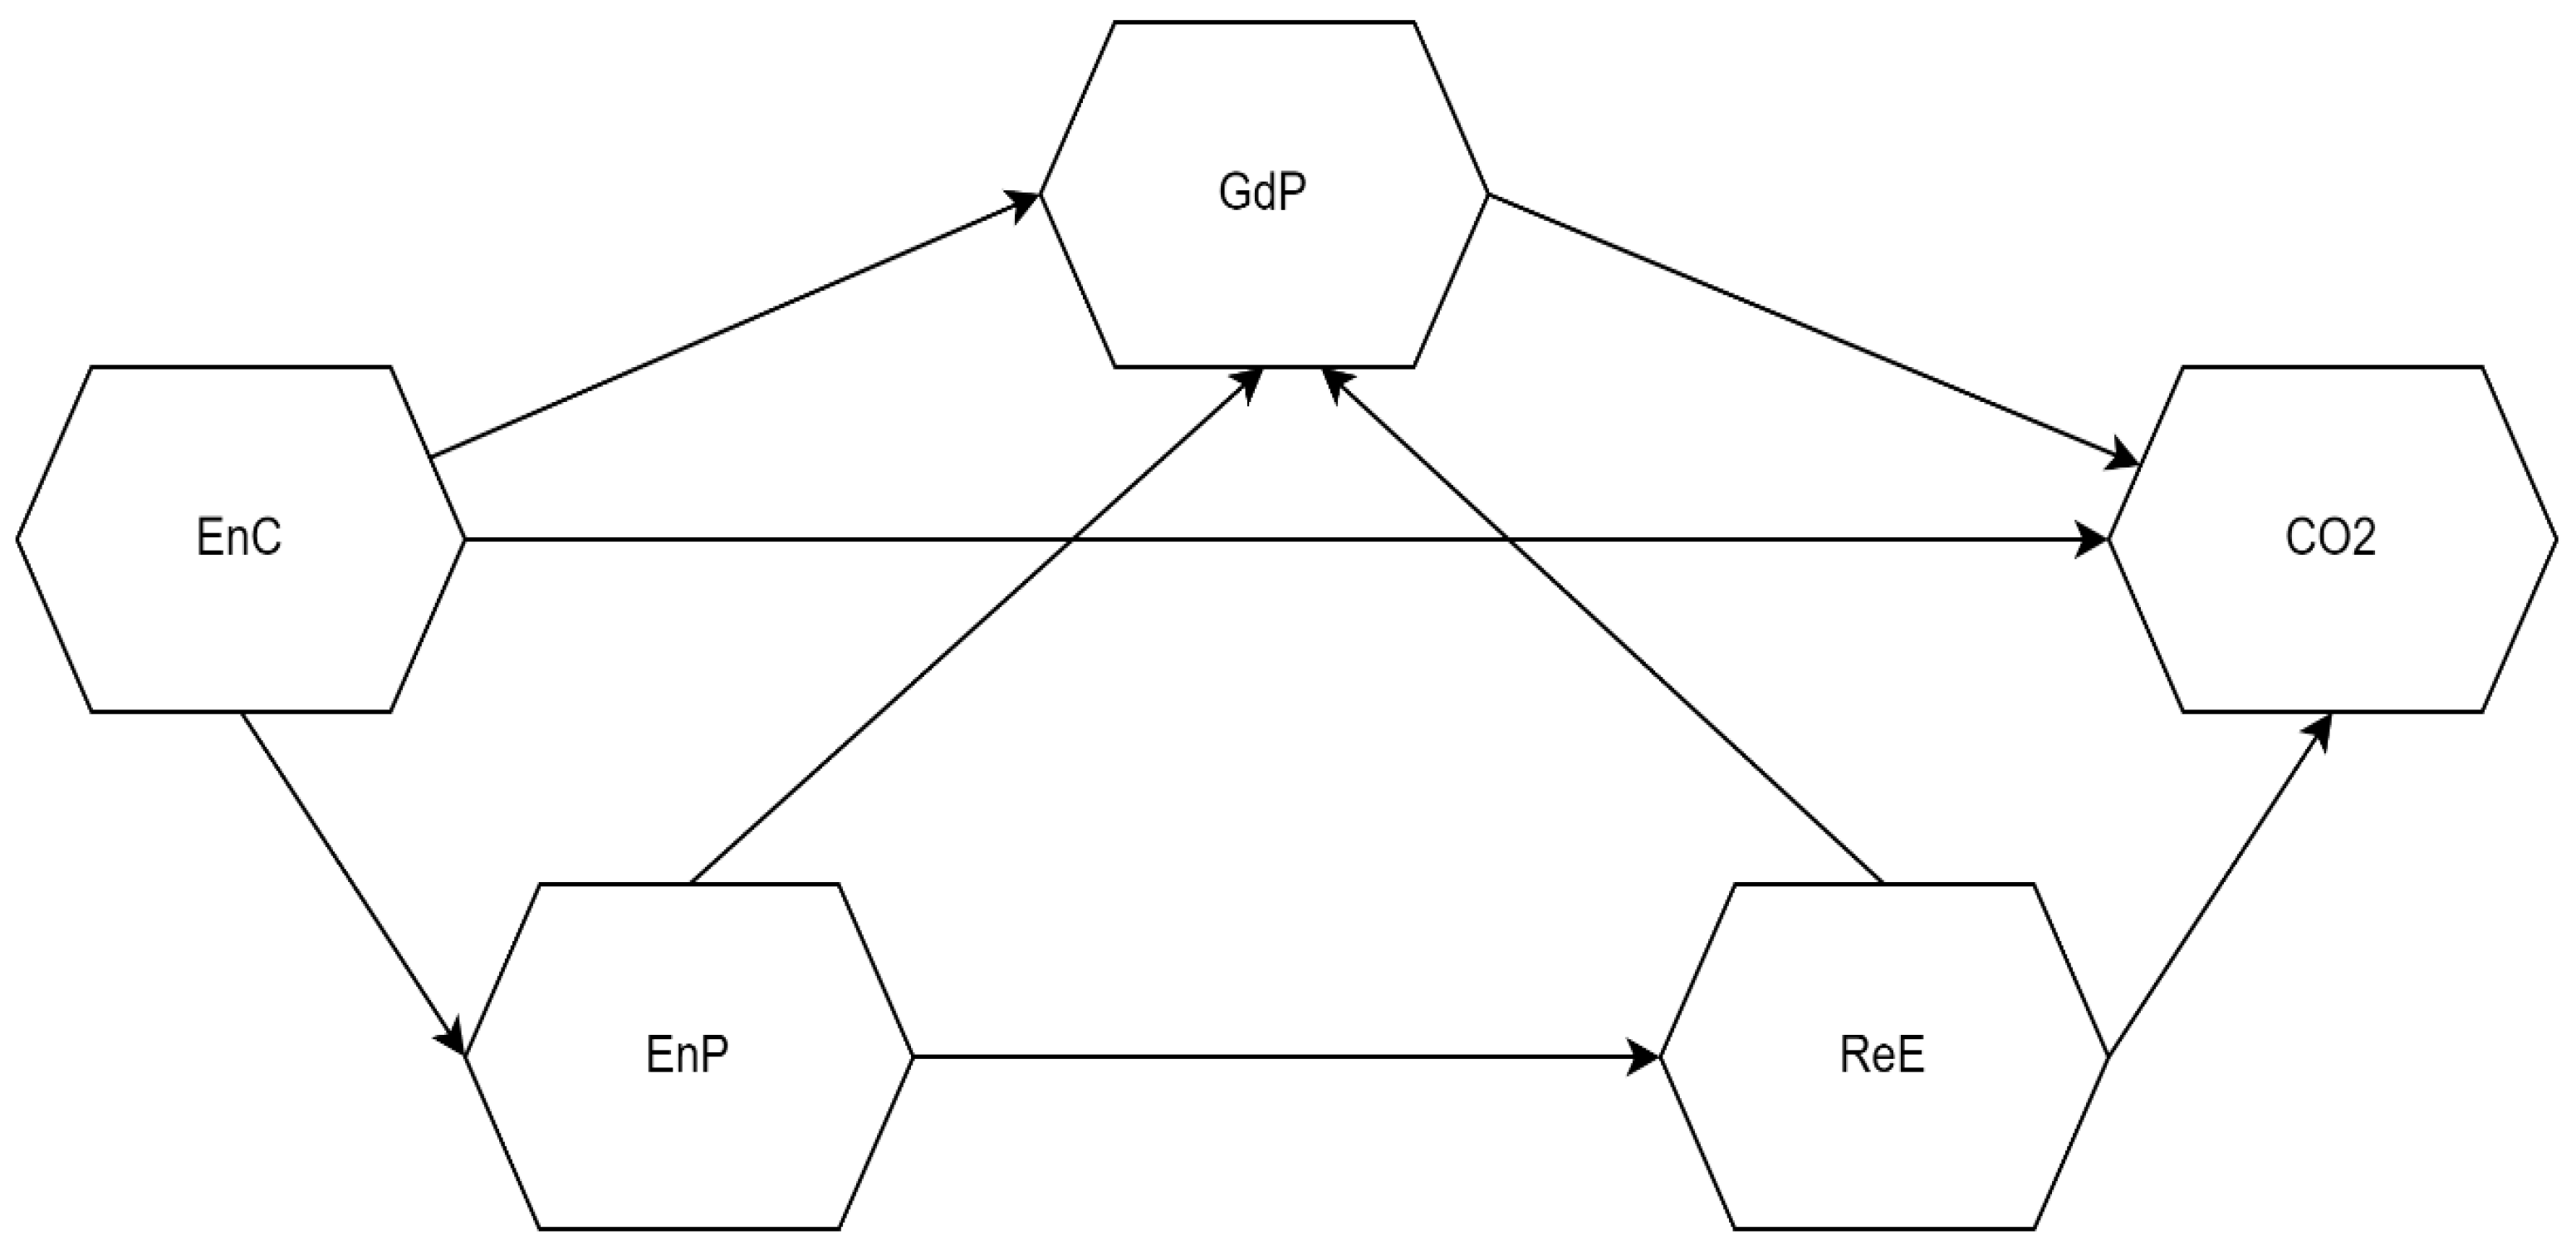
With the method described in the study, the dependent (target) variable, the European Union’s G.D.P., and the relationship between the four independent variables will be examined. Hence, the energy economic factors behind the development of the G.D.P. became better understood. An essential step in the PLS-PM analysis is the specification of the model and its relationship with the dependent variable. The model looked like this:
Dependent (target) variable: European Union’s G.D.P. value (G.D.P.), Independent variables: Energy consumption (EnC), CO2 greenhouse gas emissions (CO2), Average energy price (EnP), and Renewable energy consumption (ReE). The next step was to build the model, which included the structural relationships between the dependent and independent variables.
The relationships were defined as follows:
Energy consumption and CO2 greenhouse gas emissions positively affect G.D.P. The average energy price hurts G.D.P. Renewable energy use does not directly impact G.D.P.
The model consists of 4 factors, i.e., four independent variables.
The results are as follows:
The PLS-PM analysis aims to understand the effect of the independent variables (energy consumption, CO2 emissions, average energy price, and renewable energy consumption) on the dependent variable (the European Union’s G.D.P.) from 2010–2019. Through analyzing the correlation matrix, we determined which independent variables have a strong positive or negative relationship. The principal component analysis identified the factors that explain the most significant variance.
The relationship between the target variable (G.D.P.) used in the study and the independent variables is illustrated in
Figure 4.
4. Results
In the following, this study presents the results of the PLS-PM analysis to examine the energy management and economic growth of the European Union. During the analysis, the G.D.P. of the E.U. was the dependent variable, while energy consumption, greenhouse gas emissions, average energy price, and renewable energy use were the independent variables.
Table 4 shows that G.D.P. negatively correlates with energy consumption, CO
2 emissions, and the average energy price.
The data in
Table 5 show that the VIF value is below 5 for EnC, CO
2, and EnP and above 5 for ReE.
At the same time, it has a close and positive relationship with renewable energy. Energy consumption, CO2 emissions, and the average price of energy are in intense positive contact with each other, but there is a negative correlation between energy consumption and renewable energy. The average energy price has a close negative relationship with renewable energy but positively correlates with energy consumption and CO2 emissions. Renewable energy is in harmful contact with energy consumption, CO2 emissions, and the average energy price. According to the results, three of the four independent variables (energy consumption, CO2 emissions, and average energy price) effectively explain G.D.P. growth, and four factors can be created from these variables. The fourth variable (renewable energy consumption) has a more negligible effect on G.D.P. growth. The fifth factor created from these variables explains the variance more significantly.
When presenting the results, it is essential to give the values of the estimates (loadings) of the independent variables used in the multivariate regression model: energy consumption (EnC): −0.0012; CO2 emissions (CO2): −0.0013; average energy price (EnP): 207.6032; and renewable energy use (ReE): −0.1234. Estimates of individual independent variables show that energy consumption, CO2 emissions, and renewable energy consumption hurt G.D.P., while the average energy price positively affects it.
R2 (explained variance): 0.986. The value of the explained variance indicates that the proportion of the variance explained by the model is nearly 98.6% compared to the total conflict. This suggests that independent variables significantly contribute to explaining changes in G.D.P.
The study summarizes the results as follows:
Factor 1: Relationship between economic growth and energy consumption. The decreasing values of energy consumption, CO2 emissions, the average energy price, and energy balance in the examined period explain the G.D.P. growth in the E.U.
G.D.P. growth negatively correlates with CO2 emissions, showing that the E.U.’s economy is still highly dependent on fossil fuels. The continuous reduction of CO2 emissions had a positive effect on G.D.P. The average energy price is also negatively correlated with G.D.P. growth, which shows that price reduction effectively supports economic growth.
Factor 2: This shows the relevance of using renewable energy sources. The increase in the proportion of renewable energy use contributed to the growth of G.D.P. The positive correlation means that the G.D.P. also increased in parallel with the help of renewable energy. Using renewable energy sources can be an essential factor in increasing the sustainability of economic growth.
Factor 3: Connects CO2 emissions, energy use, and average energy price, which are all essential elements in energy use and environmental impact. This factor is more critical in countries with a lower G.D.P.
Factor 4: Combines renewable energy use and balance, which refer to sustainable energy production and use. This factor is essential in countries emphasizing the use of renewable energy sources and reducing energy dependence.
Factor 5: A strong positive correlation between G.D.P. and renewable energy use indicates that this energy use effectively supports economic growth. It follows from this finding that E.U. member states with higher G.D.P. are likely to make more significant investments in producing and using renewable energy.
According to the multivariate regression, energy consumption, CO2 emissions, and the average energy price statistically significantly explain G.D.P. growth (F(3, 6) = 10.92, p < 0.001). Energy consumption and CO2 emissions positively correlate with G.D.P. growth (b1 = 0.217, p < 0.05; b2 = 0.060, p < 0.05), which shows that the E.U.’s economy is still highly dependent on fossil fuels. The average energy price negatively correlates with G.D.P. growth (b3 = −499.36, p < 0.05), suggesting that increasing energy costs can restrain economic growth. According to the multivariate regression, the use of renewable energy significantly explains the increase in G.D.P. (F(1, 8) = 16.94, p < 0.01). This indicates that using renewable energy sources in the E.U. can be essential for economic growth.
5. Discussion
One of the most significant findings of this study’s results is that the presented and analyzed E.U. economic variables (economic growth, energy consumption, greenhouse gas emissions, average energy price, and renewable energy consumption), as well as the existing relationships between them, can contribute to the optimization of the E.U.’s currently critical energy management and economic growth. Past data between 2010–2019 and correlation relationships between variables can be used to forecast the future energy management and economic development of the European Union.
Another significant finding of this study is that introducing previously unused independent energy management variables into the investigation allowed us to better understand the relationships between energy economic processes and economic growth. Since other researchers did not use these variables, the new approach revealed different relationships that decision-makers should have considered.
In this way, new variables can contribute to developing energy management and economic research and help decision-makers find new solutions to increase the European Union’s energy efficiency and ensure sustainable economic growth.
The importance of the research results was presented at the end of the last part of this study. Comparison of the results with other research can contribute to expanding the theoretical framework. Summarizing and connecting individual research results enables a more comprehensive and profound understanding and recognition of new academic connections between economic growth and energy economy variables. Comparing the results with other research can help identify new research directions and questions. Understanding possible contradictions or conflicting results can inspire further investigation of sustainable energy management in the E.U. and exploration of new research areas. In this section, the study presents research that describes the relationship between economic growth in the E.U. regarding some energy economic variables. The authors of [
42] examined the relationship between energy consumption and economic development. The study aims to explore the cause-and-effect relationship between energy consumption and economic growth in the European Union based on data from 1960–2015. Using the Granger causality test, the empirical results clearly showed that energy consumption contributed to the economic growth of the European Union.
Another central question of the study was how energy consumption and economic growth were related and how they interacted over time and space in the European Union. The results showed no robust, strong correlation between G.D.P. and the energy consumption of the member countries. Another consequence of the research showed that the decrease in those member states where energy consumption dropped significantly did not affect economic growth [
43]. The aim of the study by [
44] was to examine the relationship between energy consumption and economic development in a comparative analysis of Spain, Romania, and the European Union based on data from 1990–2010. They found that only two correlations would support the growth hypothesis in the short run. Their study examined the combined effect of various economic development factors on energy consumption and CO
2 emissions in different economic environments. The study demonstrated evidence of dynamic interactions among variables. The results confirmed that there is at least a long-term equilibrium relationship between economic growth and energy consumption, CO
2 emissions, FDI, and net exports [
45].
A study by [
46] examined the impact of various macroeconomic variables on the economic growth of the 27 member states. The study’s preliminary results show that G.D.P. calculated at constant prices significantly impacted GHG emissions in the E.U.’s 27 countries.
Meanwhile, the lag between inflation and employment did not significantly impact economic growth. Regarding the study on the contribution of energy prices to inflation in the E.U. [
21], almost half of it is caused by energy price increases. This robust contribution reflects the past development of crude oil prices, which has had a common effect in all countries in the eurozone. However, the gift of energy to inflation depends on the share of power in consumption expenditure and on the extent to which the development of energy prices is transferred to the consumer prices of individual countries.
The effect of different energy prices on economic growth was investigated by [
47]. According to the researchers, there was a two-way causal relationship between electricity consumption and costs. There was no causal relationship between kerosene consumption, prices, and economic growth. The study did not support the hypothesis of a neutral relationship between energy and economic development. Many published studies describe the relationship between renewable energy and economic growth for different countries and periods.
A study found a long-term equilibrium relationship between economic growth and renewable energy consumption and found that renewable energy consumption positively affects economic growth. The results indicate that using renewable energy as a global commodity is extremely important in economic development [
48,
49] and researchers should aim to examine the relationship between renewable energy consumption and economic growth. To investigate this connection, they analyzed data on the G.D.P., the use of renewable energy sources, and non-renewable energy consumption of 25 European countries. The method used revealed the existence of clusters of two groups of countries. One group was a cluster of countries with high G.D.P. and high renewable energy consumption; the other was countries with low G.D.P. and low renewable energy consumption.
The study by [
50] examined the development of the energy balance of the E.U.’s countries. They found that only the energy demand and imports of the E.U.’s countries were closely related to the economic situation. On the other hand, exports and industrial production were moderately and weakly correlated with the state of the economy. A study revealed the specifics of sectoral transformations in European countries during the 2008–2009 crisis and the 2010–2019 period of stable economic growth. The results showed that, despite the efficient production structure, fluctuations in energy prices significantly influenced economic development [
51].
In a study, researchers determined, through empirical analysis, that the inverse correlation between energy intensity and economic growth exists even when the trend and inertia of energy intensity are controlled. However, the effects of rising energy, environmental and transport taxes, and increasing energy prices must be considered. During an investigation, researchers found that European countries could save energy consumption through economic growth and a steadily decreasing population [
52].
The fact that the European Strategic Energy Technology Plan (SET-Plan) will expire in 2020 was already known to researchers in 2016; therefore, the E.U. must review its energy technology policy for the period after 2020, and a policy framework should be created, which will facilitate the fulfillment of the E.U.’s commitment to decarbonization by 2050. They examined the options for the E.U.’s energy technology policy after 2020, considering uncertain technological developments, uncertain carbon prices, and a highly competitive global market for energy technologies. They proposed a revised S.E.T. plan allowing policymakers to promote innovation in promising technologies, regardless of the political context that will materialize in the future [
53].
The study contributes to the expansion of the theoretical framework of the topic by examining the relationship of independent variables with a target variable that other studies have not previously analyzed. The present analysis revealed new connections and connections in the relationship between independent variables and economic growth that have not been observed in other studies. In this way, it may be possible to develop new explanatory models that can contribute to the sustainable economic growth of the E.U.
6. Conclusions
Based on its own results, this study formulates public policy conclusions regarding the E.U.’s energy economy and economic growth.
This study intends the following conclusions as energy policy recommendations:
One of the most robust conclusions formulated at the end of the results chapter was that the decreasing values of energy consumption, CO2 emissions, and the average energy price in the examined period effectively explain the G.D.P. growth in the E.U. The close correlation of the decrease in energy consumption with the increase in G.D.P. highlights that the E.U. should further improve energy efficiency. (The E.U. interprets the concept of energy efficiency as follows: energy efficiency is the ratio of the result expressed in performance, service, product, or energy to the energy invested). To achieve this, it would be necessary for the E.U.’s decision-makers to adopt an agreement on the reform and strengthening of the E.U.’s Energy Efficiency Directive. To enforce the priority of energy efficiency, it would be necessary for member states to be legally obliged to consider energy efficiency in the energy sector.
An agreement is needed according to which the annual energy-saving obligation of the member countries doubles or triples compared to the previous value.
The average energy price is also negatively correlated with G.D.P. growth, which shows that price reduction effectively supports economic growth. It is in the interest of the E.U. to avoid excessively high energy (mainly gas and electricity) prices. It seems necessary to introduce a price-limiting mechanism. The member states should agree on a market correction mechanism limiting the systematic development of extremely high energy prices in the E.U.
A price ceiling should be introduced for energy transactions, activated when energy prices reach a predetermined level. With this method, the European Union would limit excessively high energy prices that do not reflect world market prices and support the energy supply’s security.
The decrease in CO2 emissions also showed a strong positive correlation with G.D.P. growth in the E.U. This suggests that reducing greenhouse gas emissions in the E.U. should be further intensified. It is necessary to tighten the E.U.’s CO2 emissions trading system regulations to reduce greenhouse gas emissions.
Even within the reduction, a drop in CO2 emissions from energy-intensive industries and power plants is desirable. In the E.U.’s joint commitment regulation, it is necessary to define national emission target values for the sectors with the highest CO2 emissions (e.g., energy industry, construction industry, transport, agriculture, and waste management).
The continuous increase in the proportion of renewable energy in the E.U.’s energy consumption shows the most robust positive correlation with G.D.P. growth. This connection confirms that, to be relevant, by 2030, all 27 E.U. member states would undertake the target of obtaining half of their energy from renewable sources, such as wind and solar power. (The current target is 42.5%, while in 2021, less than a quarter of the E.U.’s energy came from renewable sources). The goals related to renewable energy have become increasingly important; the E.U. has set itself the goal of ending its dependence on Russian fossil fuels by 2027. The European Union wants to achieve this independence mainly by producing locally produced energy with low carbon dioxide emissions. Achieving this goal will require considerable investments in wind and solar power plants, increasing the production of renewable gases, and strengthening European electricity grids [
54].
It will also be necessary to diversify the E.U.’s energy sources and guarantee energy security through cooperation among E.U. countries. It is also justified to ensure the operation of a fully integrated internal energy market, which enables the free energy flow within the E.U. through the appropriate infrastructure without technical or regulatory constraints. Research into low-carbon and clean energy technologies and the support of energy innovations must be given priority.
Finally, this study makes statements about the shortcomings of the research and future directions.
Like all studies, this one also has shortcomings; three main faults are worth highlighting: (1) Only four variable effects of energy management, which plays a decisive role in the production of G.D.P., were examined in this study.
However, additional energy management variables can also affect the development of economic growth in an examined economic region. Such an energy management variable could be, for example, the E.U.’s dependence on energy imports, the industrial structure of energy production, etc. (2) Many other factors influence CO2 emissions; in this study, only the effect of economic development, energy consumption, and greenhouse gas emissions from renewable energy was examined. However, CO2 emissions also have other influencing factors, for example, the structure of the E.U.’s industrial production, the technical level of the operation of energy systems, etc. (3) Regarding the E.U., the study examined only ten years of data, from 2010 to 2019. The selection of this period was deliberate because there was relatively steady G.D.P. growth in the E.U. and a continuous decrease in energy consumption. These aspects provided an excellent framework for conducting an exciting investigation. However, the time interval can be significantly extended. Thus, even more substantiated result data can be obtained.
In the future, research on the subject of this study can go in several directions, three of which should be highlighted:
(1) In addition to the four independent variables selected in the study, additional variables can be included in the investigation. Such a significant indicator can be, for example, the E.U.’s dependence on energy imports, etc. (2). The study period ended in 2019, followed by two years of epidemics and the outbreak of the Russian–Ukrainian conflict. The circumstances mentioned above forced significant changes in the energy policy. In the future, it will be possible to write an interesting and instructive study for public policy on the structural changes that the previous global traumas forced into the E.U.’s energy policy. (3) The 27 countries of the E.U. represent a relatively small proportion of the number of countries on Earth. In the future, an instructive and exciting study could be written so that the authors examine a different range of countries on this topic, for example, BRICS, G20, Europe, or OECD countries.


