Article

Development of Adaptive Model and Occupant Behavior Model in Four Office Buildings in Nagasaki, Japan

1
Graduate School of Engineering, Nagasaki University, 1-14 Bunkyo-machi, Nagasaki 852-8521, Japan
2
Department of Architecture, Faculty of Engineering, Osaka Institute of Technology, 5-16-1 Omiya, Asahi-ku, Osaka 535-8585, Japan
3
Department of Architecture, School of Architecture, Mukogawa Women’s University, 1-13 Tozaki-cho, Nishinomiya 663-8121, Japan
4
Graduate School of Environmental Studies, Nagoya University, Furo-cho, Chikusa-ku, Nagoya 464-8603, Japan
5
Faculty of Environmental Studies, Hiroshima Institute of Technology, 2-1-1 Miyake, Saeki-ku, Hiroshima 731-5193, Japan
6
Department of Architecture, Faculty of Environmental and Urban Engineering, Kansai University, 3-3-35 Yamate-cho, Osaka 564-8680, Japan
7
Department of Architecture, Faculty of Engineering, Shinshu University, 4-17-1 Wakasato, Nagano 380-8553, Japan
8
Graduate School of Advanced Science and Engineering, Hiroshima University, Hiroshima 739-8527, Japan
9
Department of Architecture and Environment Systems, Akita Prefectural University, 84-4 Tsuchiya, Akita 015-0055, Japan
10
Graduate School of Engineering, Hokkaido University, Kita 13 Nishi 8, Kita-ku, Sapporo 060-8628, Japan
11
Department of Restoration Ecology and Built Environment, Tokyo City University, 3-3-1 Ushikubo-nishi, Tsuzuki-ku, Yokohama 224-8551, Japan
*
Author to whom correspondence should be addressed.
Energies 2023, 16(16), 6060; https://doi.org/10.3390/en16166060
Submission received: 15 July 2023 / Revised: 15 August 2023 / Accepted: 15 August 2023 / Published: 18 August 2023
(This article belongs to the Special Issue Adaptive Thermal Comfort and Energy Use in Buildings)

Abstract

:
A field survey of indoor environmental measurements and questionnaires on thermal sensation, overall comfort, and behaviors was conducted in four office buildings in Japan by visiting each office every month over a duration of more than a year during the coronavirus disease 2019 (COVID-19) pandemic. The indoor environment was measured concurrently. We obtained 1047 votes from office workers in their 20s to 60s. The regression and Griffiths’ methods were used to calculate the indoor comfort temperature. A logistic regression analysis was used to develop the occupant behavior model. Over 70% of the occupants found the indoor environment comfortable at a mean comfort temperature of 23.2 to 25.9 °C. Gender differences were observed in thermal sensation and overall comfort, but a gender difference was observed only in the cooling mode for the indoor comfort temperature. An adaptive model was developed for the office buildings in Nagasaki city to predict the indoor comfort temperature from the outdoor air temperature. The proportions of heating, cooling, and fan usage can be predicted from the outdoor air temperature using a logistic regression analysis. The adaptive model and occupant behavior model are useful for the indoor temperature control of the existing buildings and thermal simulation of the new building design.

1. Introduction

Field studies on thermal comfort in buildings have been performed extensively worldwide in different climates [1]. However, their findings cannot be applied to all countries owing to climate variations. A literature review [2] suggested that existing comfort standards may not necessarily be applicable under various climatic conditions. The proportion of the world’s energy consumption taken up by the consumer sector is 30% [3]. Therefore, it is essential to demonstrate the occupants’ comfort temperature to reduce the amount of energy consumed for air conditioning, which accounts for nearly half of that used by office buildings. In Japan, thermal insulation is insufficient, especially in warm climatic regions compared with cold climatic regions; thus, it is important to suppress energy waste in office buildings by setting the appropriate air conditioning temperature to achieve the carbon-neutral target for 2050. Accordingly, thermal comfort standards suitable for different climates are necessary for efficient energy saving in buildings. The Japanese Government assumes that the recommended indoor temperature for energy saving is 28 °C for space cooling and 20 °C for space heating, but this assumption is not based on field data. Furthermore, observance of this indoor temperature recommendation, which emphasizes energy saving, may lead to deteriorations in the comfort, health, and productivity of occupants [4,5]. It was reported that the evaluation of thermal satisfaction in real offices has practical benefits for improving workplace productivity [6]. It was reported that sick building syndrome (SBS)-related symptoms are more strongly related to the thermal sensation votes rather than to the temperature itself [7]. Therefore, it is necessary to conduct a field survey of occupants in office buildings, examine the indoor temperature and environmental adjustment behaviors of occupants, and clarify appropriate air conditioning temperature settings. Furthermore, the relationship between the comfort temperature of occupants and outdoor air temperature must be elucidated, and an adaptive model according to the regional climate must be provided.
Comfort temperatures have been investigated in various countries. Table 1 [8,9,10,11,12,13,14,15,16,17,18,19,20] lists the outdoor, indoor, and comfort temperatures of office buildings obtained from different field surveys on offices in various countries (other than Japan). Table 1 shows that the comfort temperature (in various modes) in some countries worldwide varies considerably, reflecting the broad range of climates. Additionally, the variation in the comfort temperature (by region) yields a distribution in the range of 17.6 to 29.4 °C in South Asia [8,9,10,11,12,13,14], with a regional difference of 11.8 °C. Conversely, Southeast Asian countries have small differences in the order of 3.3 °C [15,16,17]. Comparing Changsha [18], in China, which has hot summers and cold winters, and Seville [19], a Mediterranean city in Spain, which has very hot summers, the comfort temperatures during the summer season in mixed-mode (MM) are 26.7 °C and 23.6 °C, respectively. Given the differences in climate, it is easy to imagine that the comfort temperature differs between Asia and Europe. Regional differences in the comfort temperature are small in specific areas, because most surveys target office buildings in MM. Herein, mixed-mode, changeover types indicate that building can be in either the free running (FR; heating and cooling are not used during the survey) mode or air-conditioned mode (AC).
Table 2 [8,15,21,22,23,24,25,26] lists the outdoor, indoor, and comfort temperatures of office buildings obtained from different field studies conducted in Japan. First, a study on offices in the Kanto region found that the comfort temperatures ranged from 24.3 to 25.4 °C in the following three modes: FR, cooling (CL), and heating (HT) modes [23]. Another study on offices around Tokyo found that the comfort temperature ranged from 22 to 26 °C and from 22 to 25 °C for the MM and FR modes, respectively [26]. As aforementioned, the comfort temperatures in offices have been surveyed only in limited areas in Japan. In the case of Japan, which spans approximately 3000 km from north to south, the comfort temperature may vary from region to region.
This paper describes the comfort temperatures and occupants’ behaviors by performing thermal environmental measurements and conducting thermal comfort surveys with participants who worked in four office buildings in Nagasaki city in Southwest Japan. The relationship between indoor comfort and outdoor temperatures was also examined to develop an adaptive model [27]. The application of an adaptive model that fits the regional weather conditions can improve the comfort of occupants and concurrently conserve energy. In addition, an important objective of this study was to elucidate the environmental adjustment behavior of the occupants to maximize their ability to adapt to the environment and save energy. This study is expected to provide practicable knowledge to reduce energy consumption in office buildings in warm climatic regions and maintain occupants’ comfort, health, and productivity.
This paper consists of four parts. First, we describe the survey, analysis, and calculation methods. Second, the results and discussion are presented. In the first half, thermal sensation votes and overall comfort votes (classified based on mode, gender, and constitution) are presented. In the middle, the comfort temperature (classified based on mode, gender, and constitution) is presented, and the relationship between indoor comfort and outdoor temperatures is also discussed. In the latter half, occupant behavior is analyzed in terms of the overall tendency and clothing insulation according to gender, and the proportions predicted by the outdoor air temperature are indicated for heating and cooling use, window opening behavior, and fan use using a logistic regression analysis. Third, an overall discussion is presented. Finally, the conclusions drawn from this study are described.

2. Methodology

2.1. Survey Method

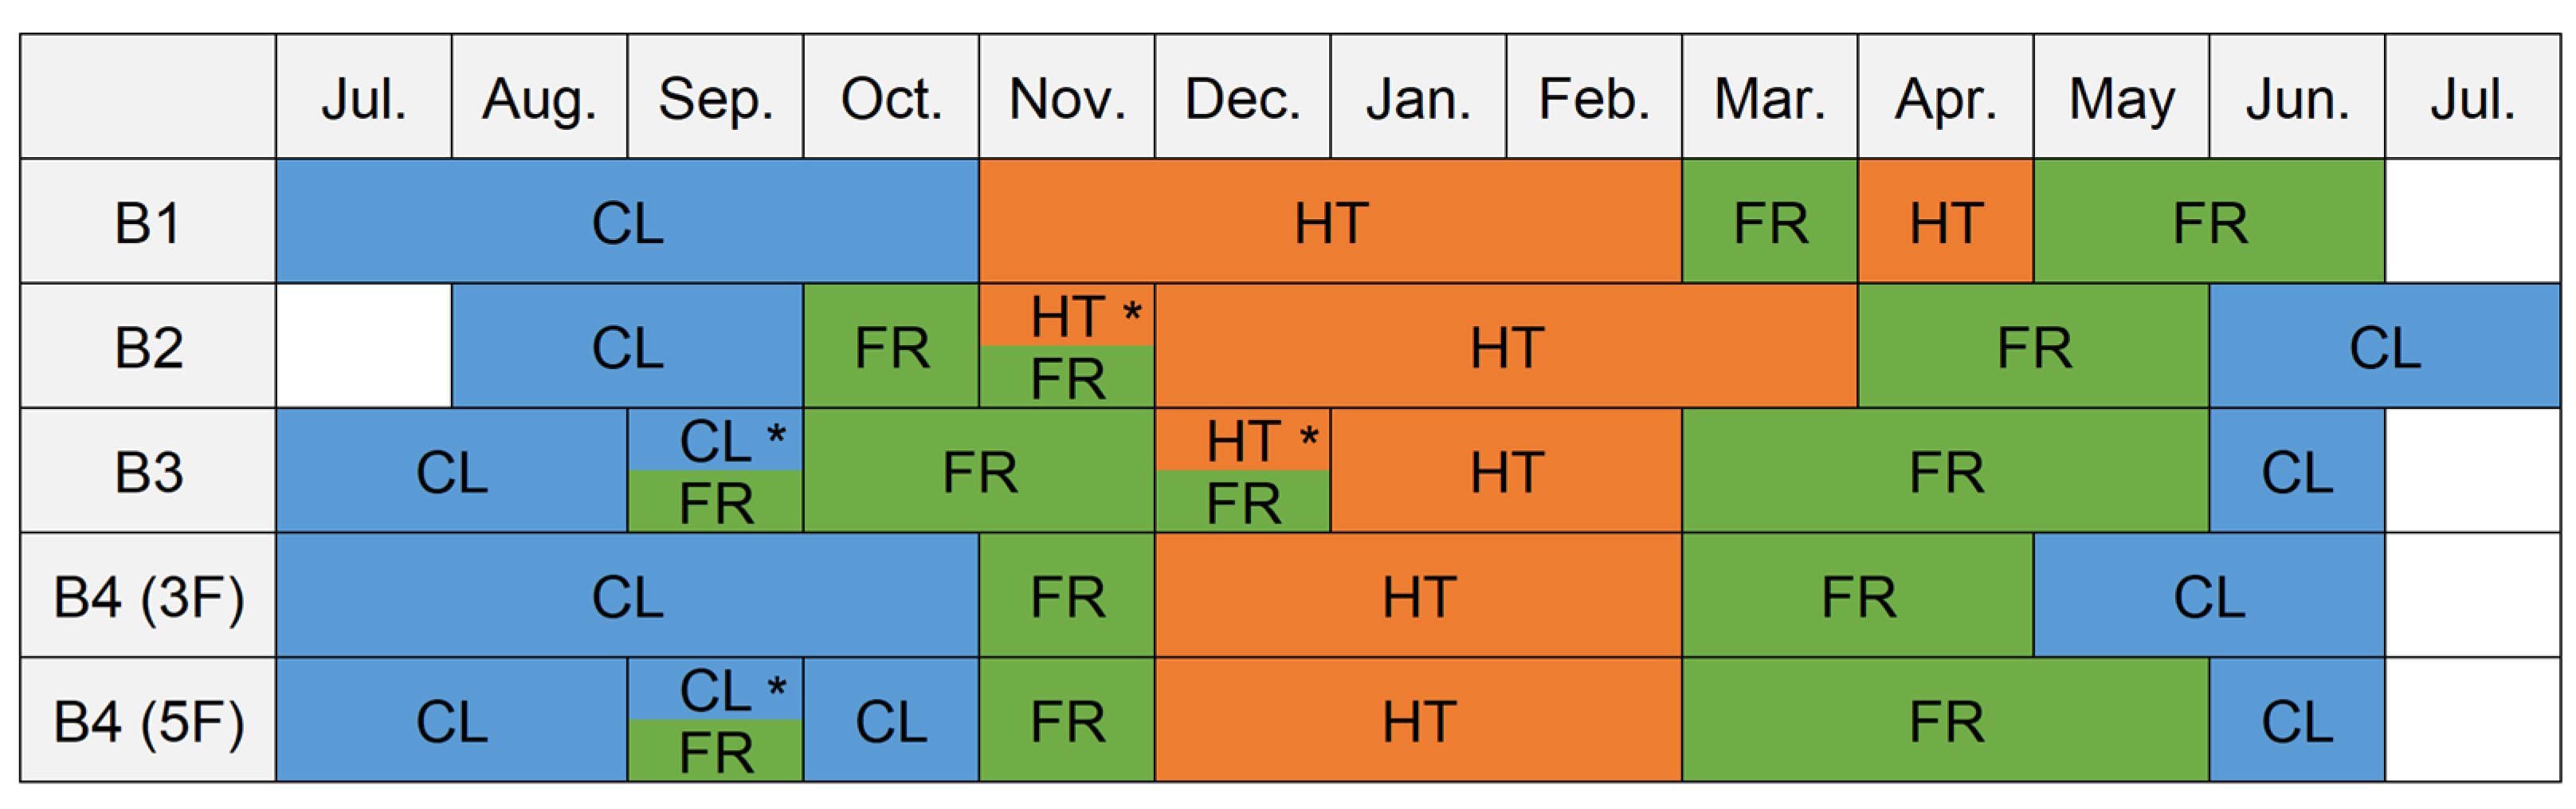
2.1.1. Survey Location, Climate, and Survey Period

Nagasaki is located on Kyushu Island in the southwestern part of Japan. The location of Nagasaki City is shown in Figure 1a. Nagasaki City is a port town with a mountainous topography, with the city center consisting of slopes and valleys. The surveyed buildings are located near the city center and are assumed to be more affected by the heat island effect compared to suburban cities. All buildings are situated on a plain. The oldest building is located between a main road near a mountain and a bay, but there is little greenery in the surrounding area. The other buildings are located on the university campus, and the area around the buildings is dotted with tall trees. Thus, the survey location is ecologically rich, although it is located in an urban setting. The climate is classified as Cfa by the Köppen–Geiger climate classification system [28]. It is mild all year round and typically humid in the summer. It rarely snows in the winter. Figure 1b shows the climate in Nagasaki during the survey period concerning the nearest meteorological observatory [29]. The studied buildings were located approximately 1.8 to 5.8 km away from the aforementioned meteorological observatory. The monthly mean outdoor temperature for each month fluctuates from 6.5 to 27.9 °C. The monthly mean temperature is maximal in July and minimal in February. The monthly mean outdoor relative humidity of each month fluctuates from 62 to 87%. The monthly mean horizontal global solar radiation is maximal in May and minimal in December. The survey period was one year, from July 2021 to June 2022, except for B2 building (the survey started one month late).

2.1.2. Characteristics of Target Buildings

We selected four mixed-mode office buildings for the investigation, as building windows can be opened in the season when air conditioning is not used. However, we could not increase the number of buildings for the field survey owing to the coronavirus disease 2019 (COVID-19) pandemic. Table 3 outlines the surveyed buildings and lists the number of thermal comfort votes. In addition, Figure 2 shows the external views of the four office buildings surveyed in this study. The use of the surveyed buildings, except for B4, which is used as a rental office, is for education. The investigated floors are shown in Table 3. As a result of selecting the target buildings, from the viewpoint that it is possible to adjust the environment by opening the windows, the target buildings are conventional (i.e., 50 years has passed since the completion of construction). Since the first energy conservation standard for the residential sector (not mandatory) was issued in 1980, the thermal performance of each studied building was not considered to be high. All surveyed buildings are not high-rise buildings but are mid-rise buildings constructed with reinforced concrete; these types of buildings are common in local areas in Japan. Among the target buildings, a 15-story condominium on the southwest side of B4 casts a shadow on part of the building. The influence of solar radiation was expected to be insignificant, because the blinds on the southwest are normally closed. No high-rise buildings are present around the other three buildings (B1, B2, and B3). However, some trees around B3 cast partial shadows. The surveyed buildings are not modern. As shown in Table 3, the ratio of the glazed area to the building envelope area ranges from 21.7 to 37.7%; therefore, the buildings are not fully glazed. All of the windows have blinds for shading. Air conditioning control is local, and the air conditioning system operates in MM mode for each building. From the viewpoint of the aforementioned building characteristics, the surveyed buildings can be said to be representative of this area. Among the target buildings, B4 is a private office building, and the others are university administration buildings. Compared with B4, the other buildings operate the air conditioning system by considering energy savings and ventilation.

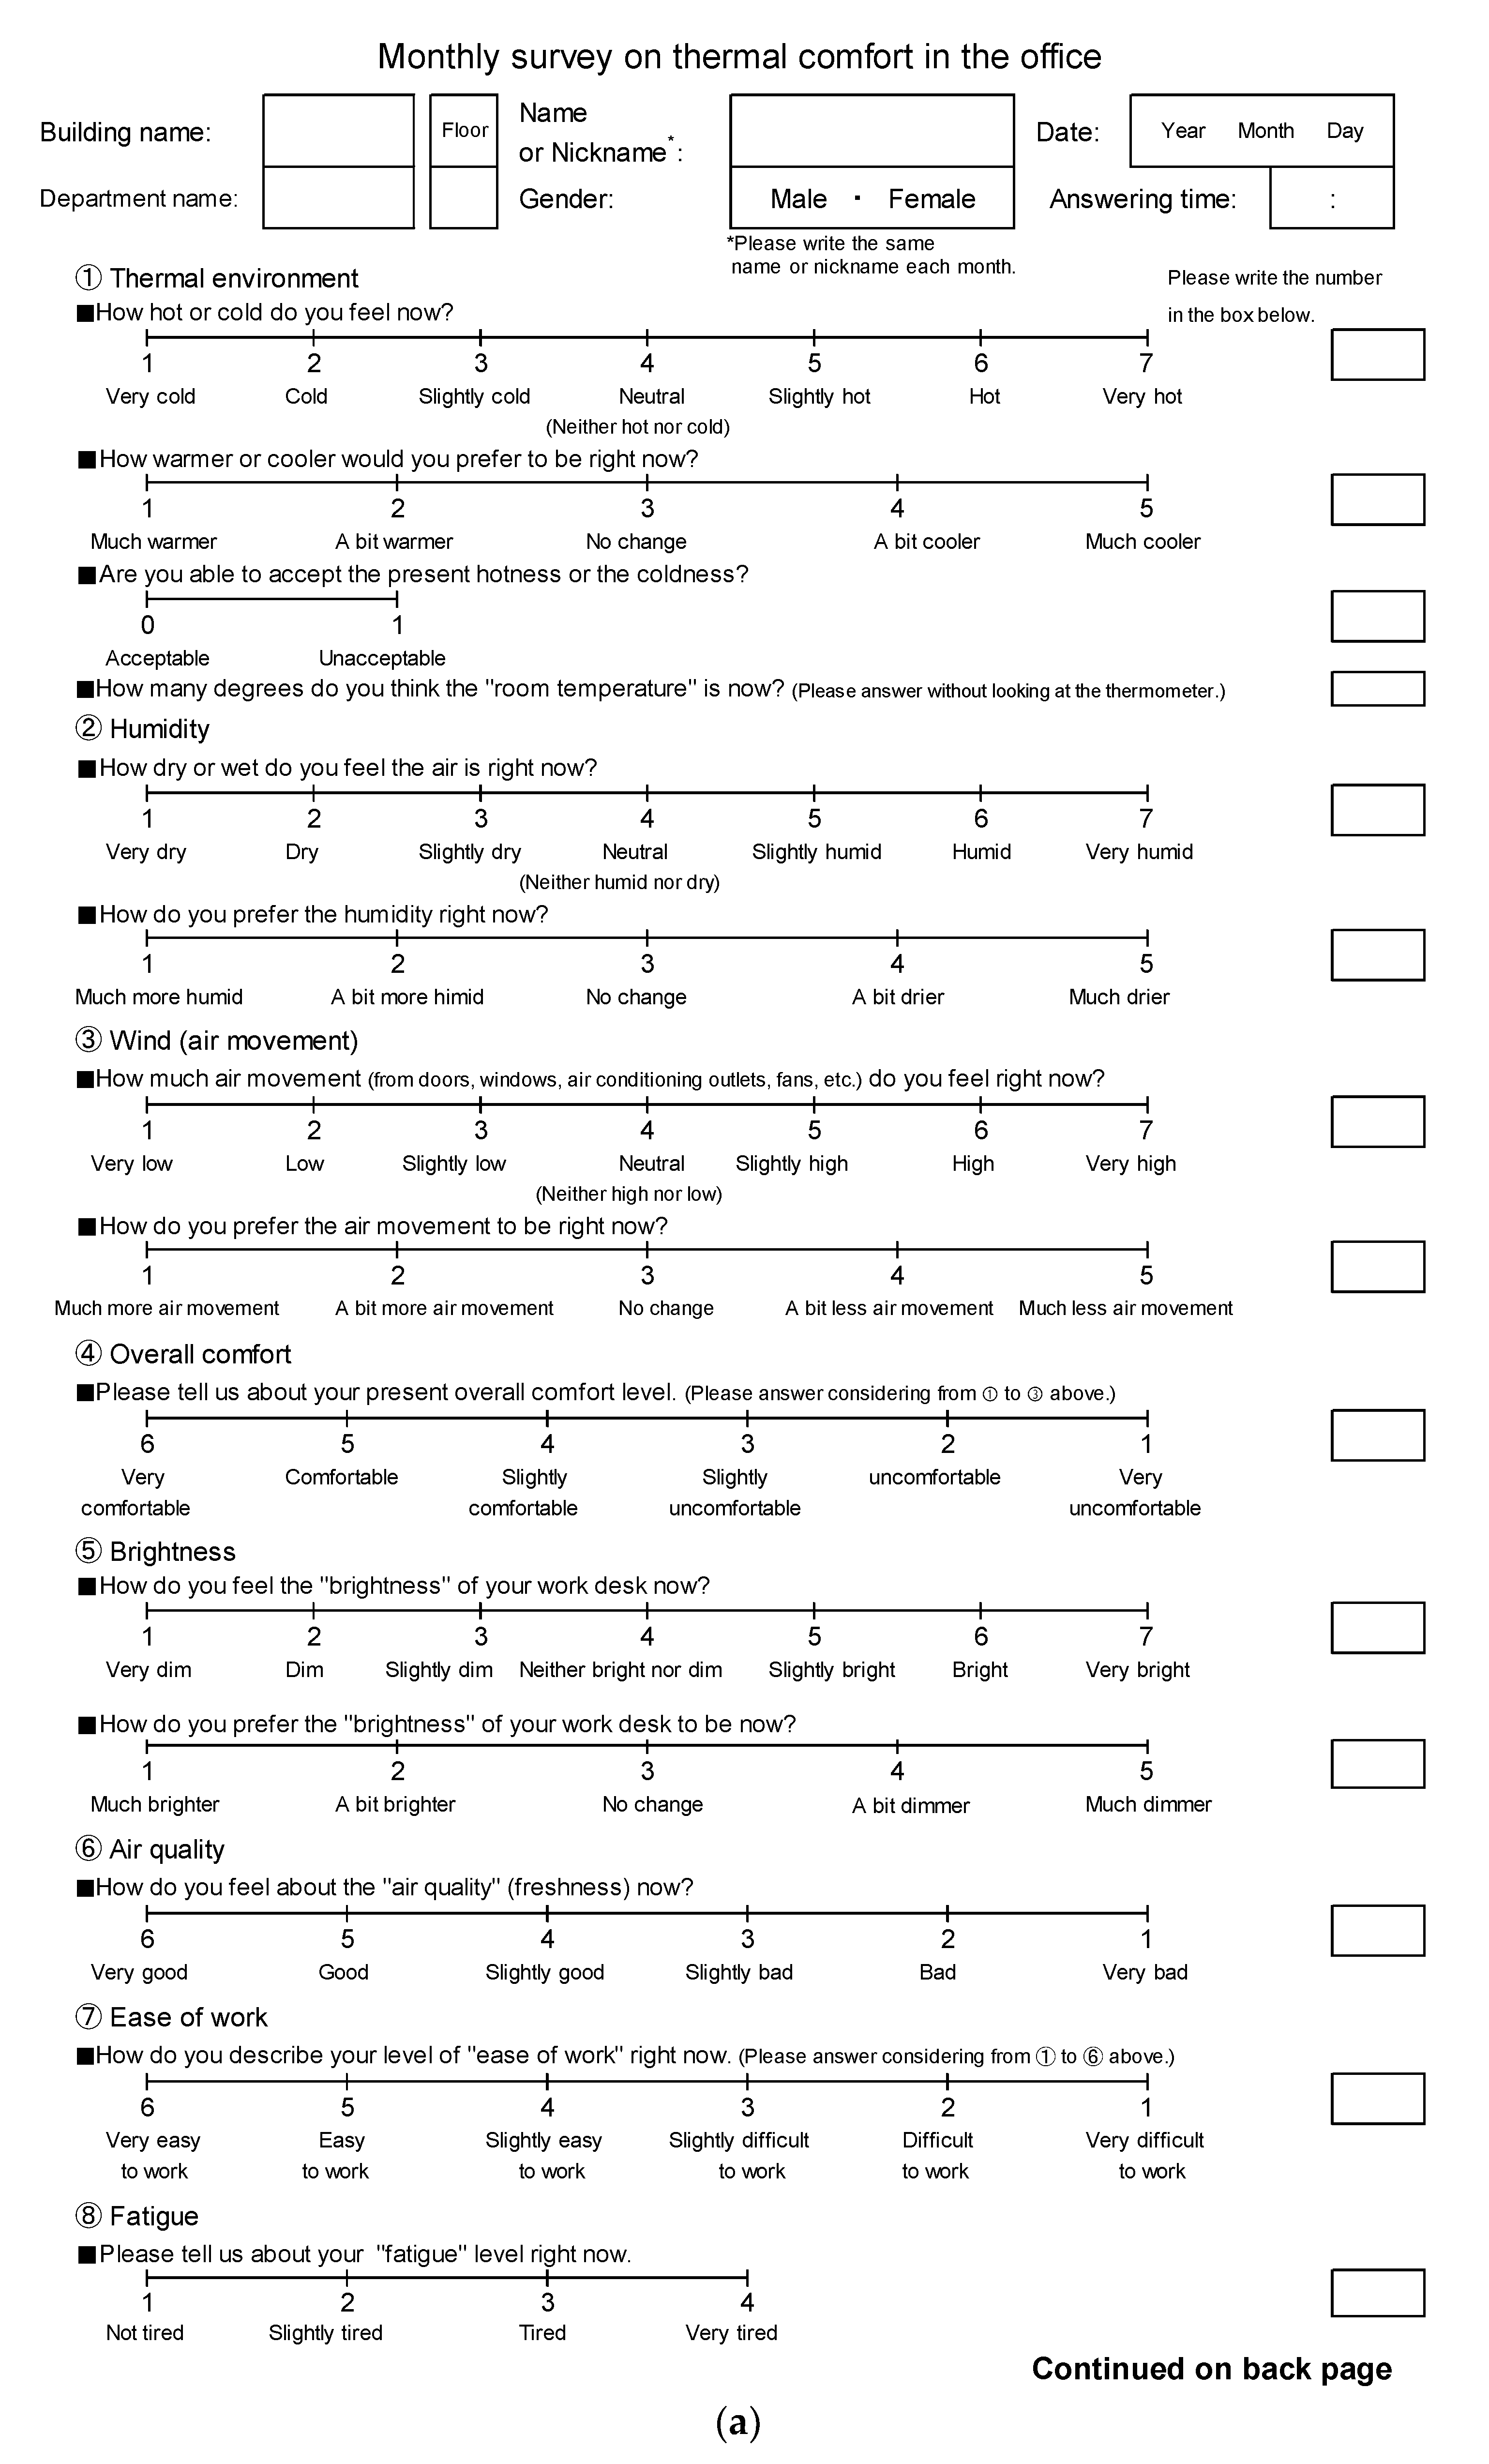
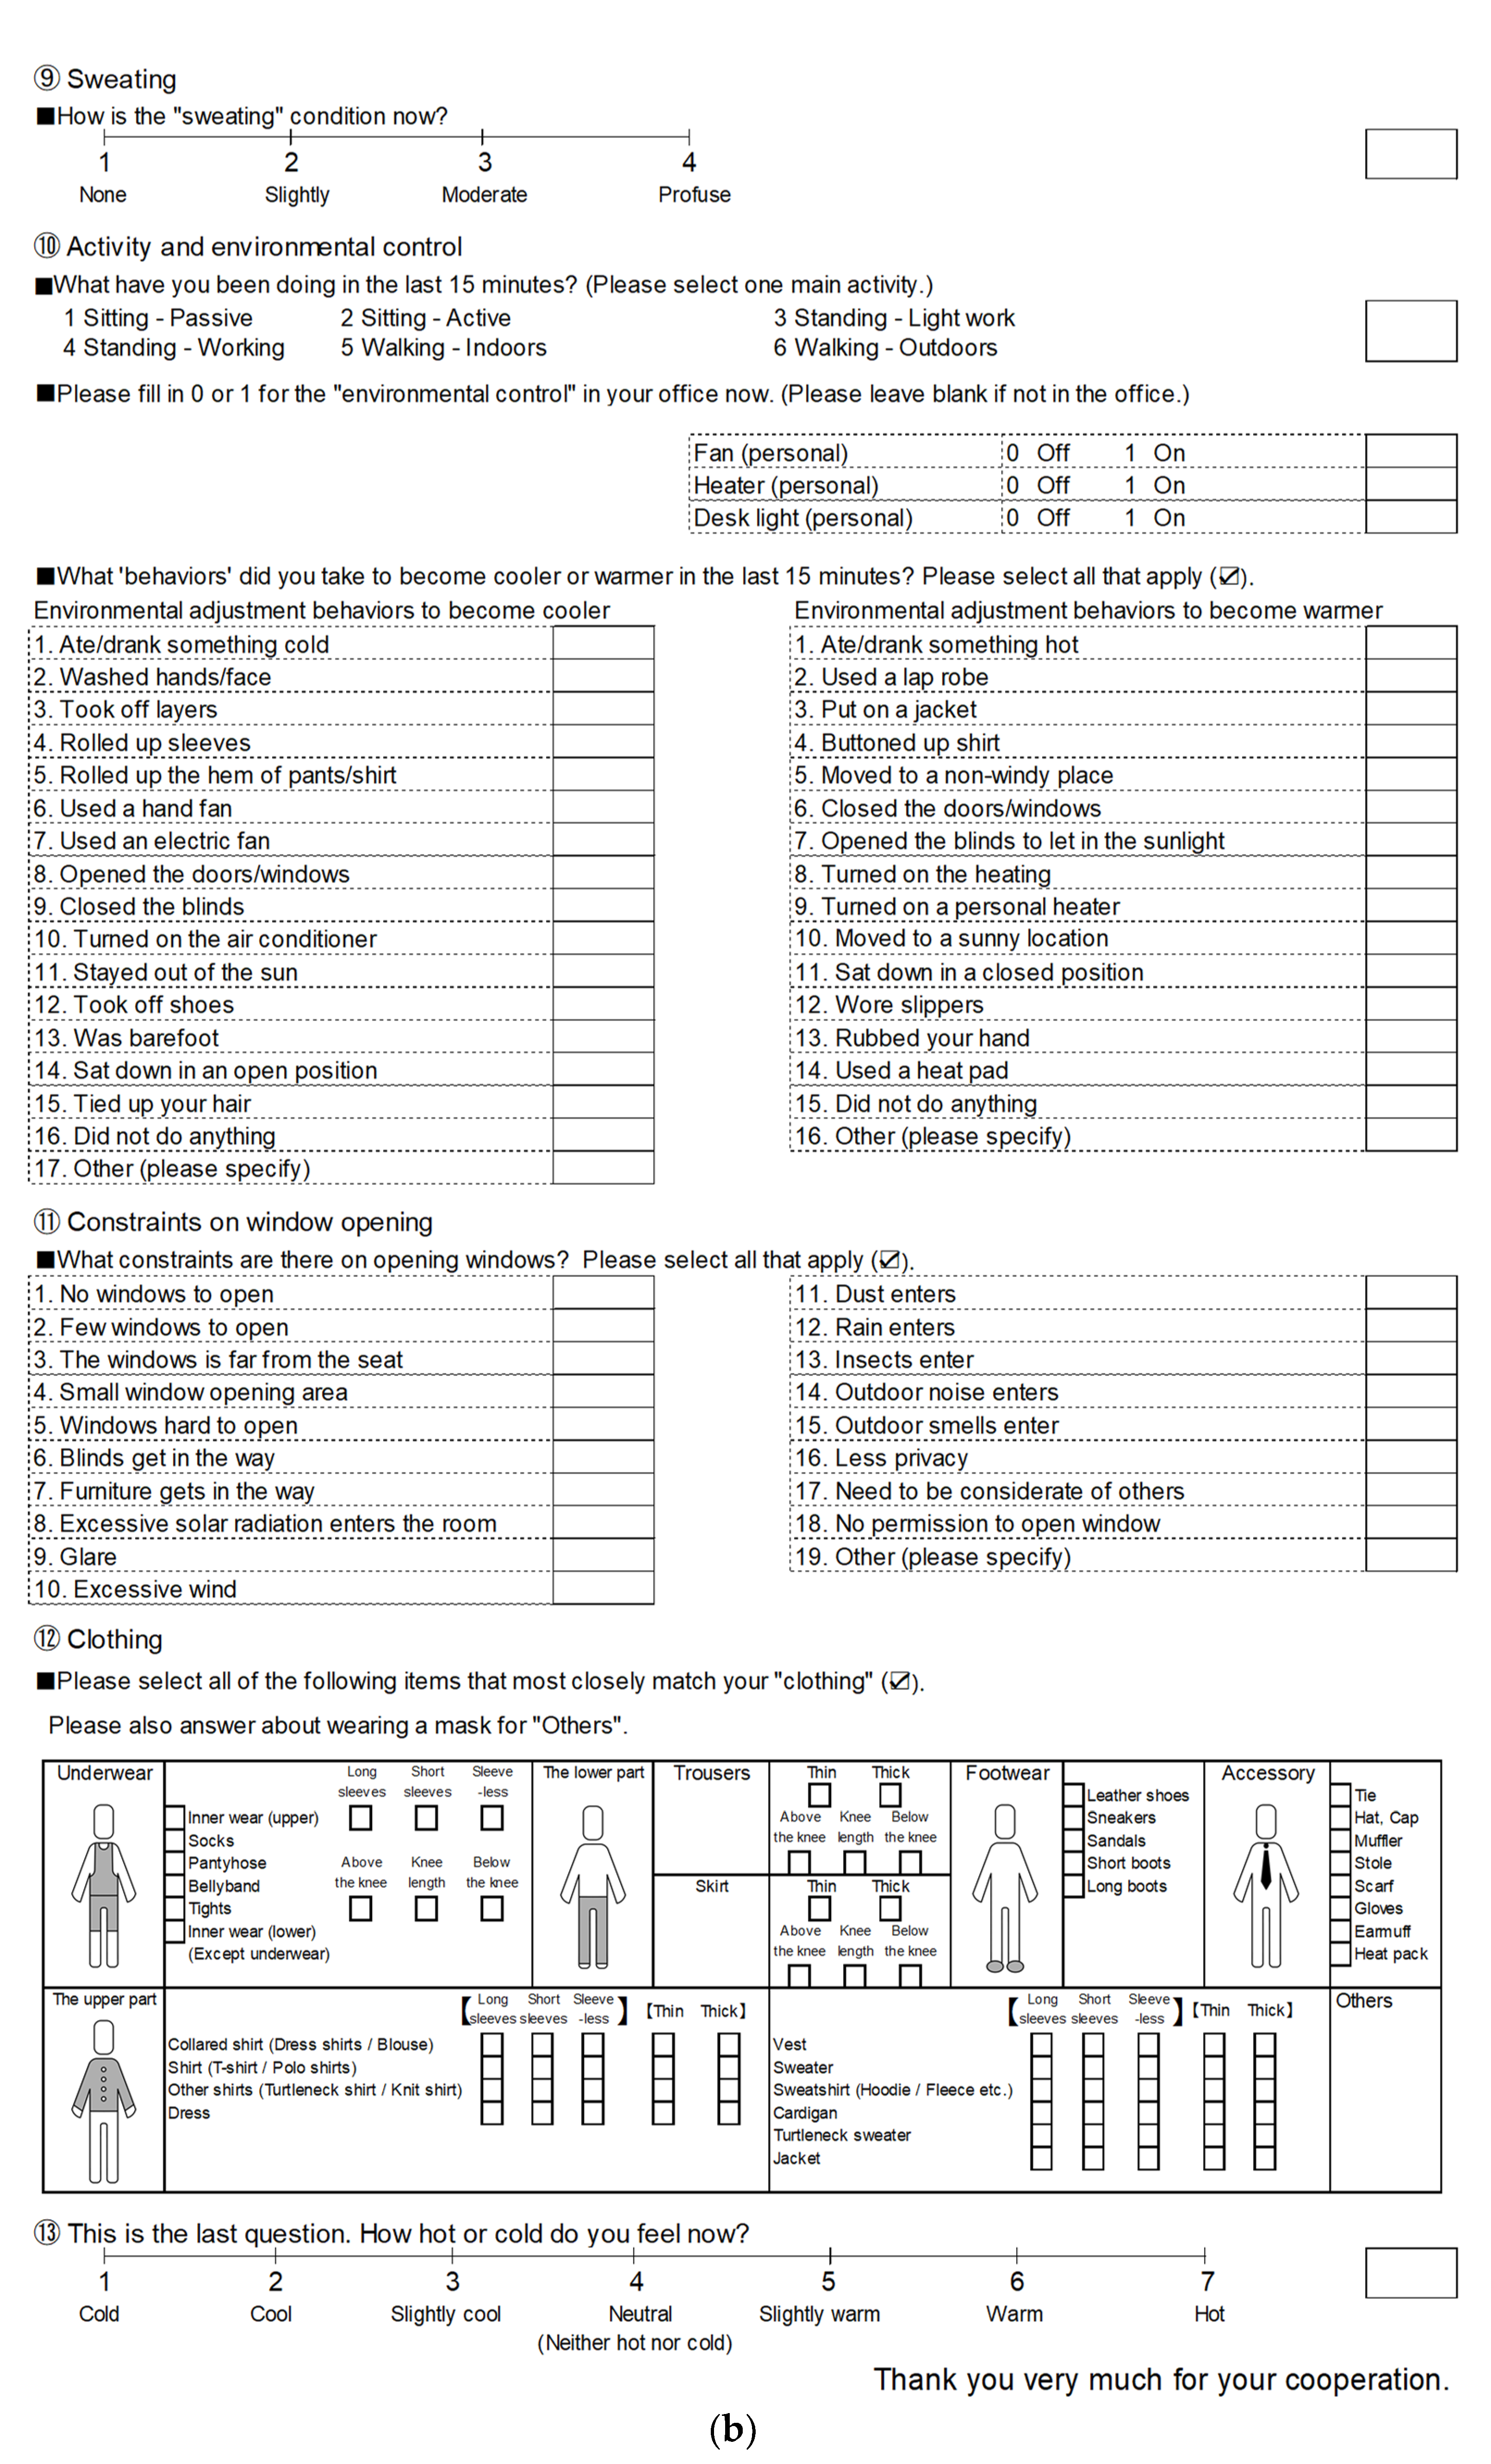
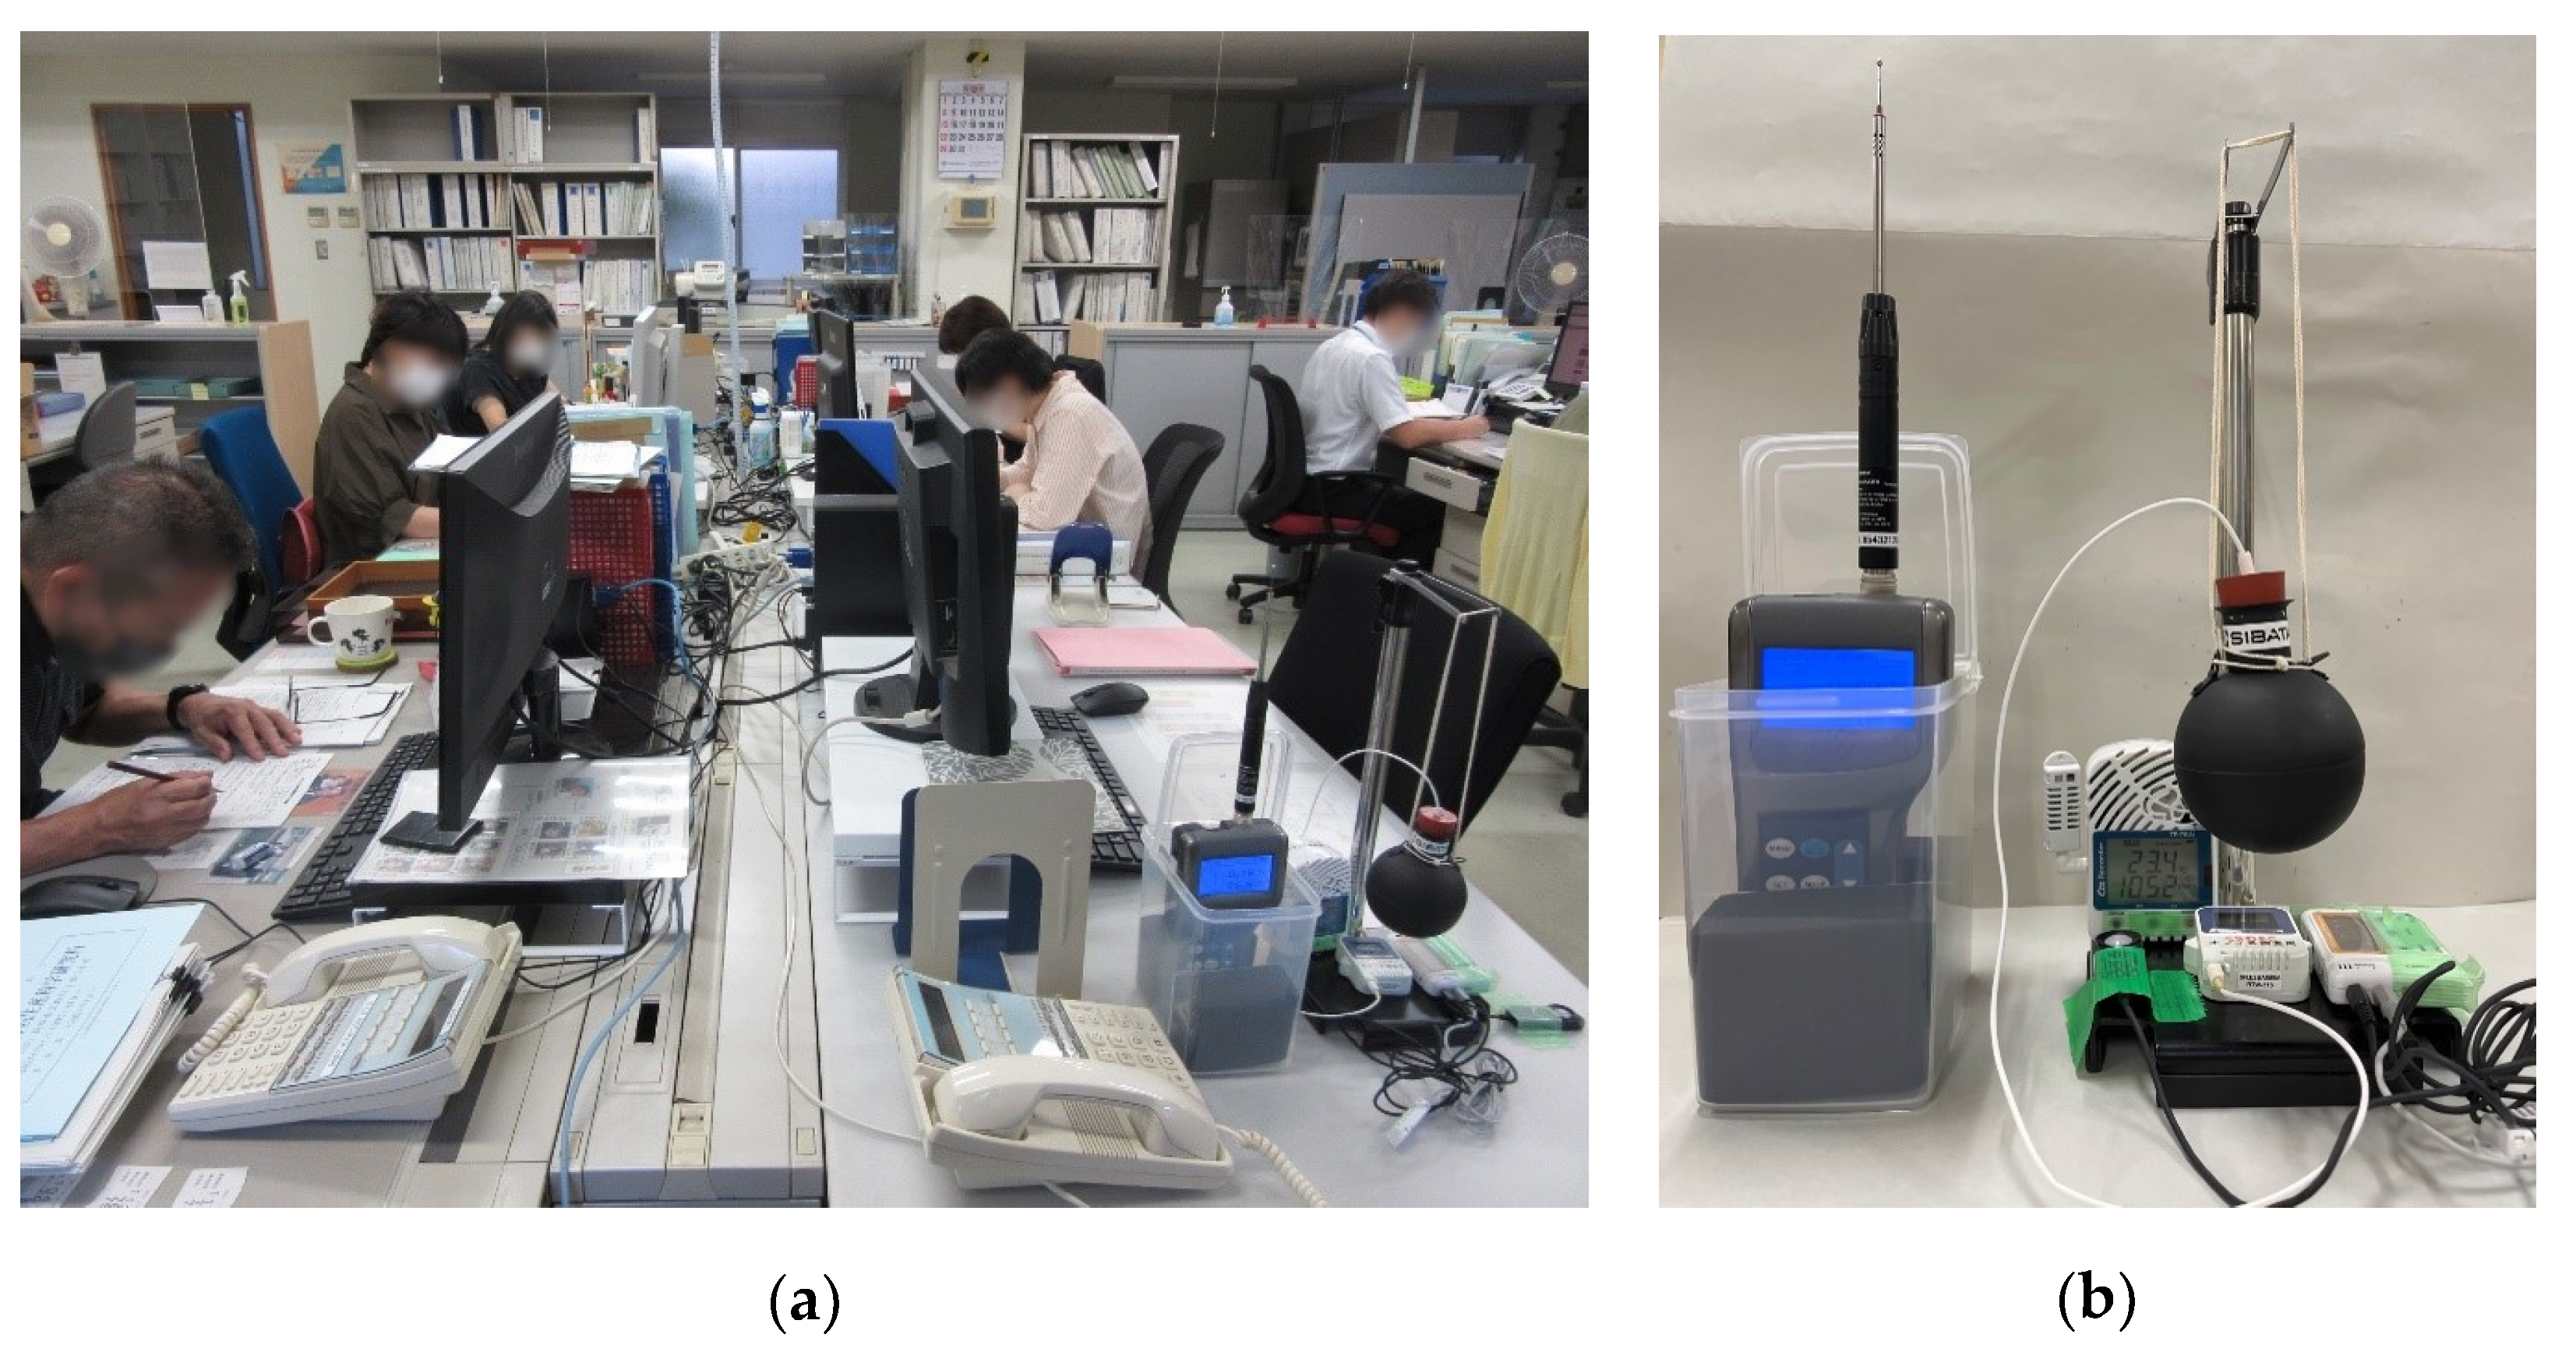
2.1.3. Method of Indoor Thermal Environment Measurement and Questionnaire Survey

The survey was conducted by distributing questionnaire sheets on thermal comfort to office occupants. Concurrently, the thermal environment in the office was measured, as shown in Figure 3. The survey was conducted based on monthly visits; therefore, each office was visited once every month. A series of surveys, consisting of indoor environmental measurements and questionnaires on comfort, was conducted for each group of people in each office. After the completion of measurements in one group, with a duration off approximately 15 min, the same surveys were conducted for the next group. During the initial survey phase, we surveyed the building and the subjects’ attributes. Basic information, such as the construction year, structure, air conditioning system, and number of windows, was obtained for the buildings. Additionally, the survey participants were inquired about their gender, age, height, weight, physical constitution, preferences for space cooling and heating, the environment in which they tend to spend most of their time, and current occupation. For the second and subsequent visits, questionnaires regarding comfort at the time of the visit were distributed among the survey subjects, and they were requested to answer the questionnaire. If a worker who was absent during the initial survey, after the second and ensuing visits, we requested them to answer the questionnaire survey on the basic attributes of the survey subjects and to cooperate with subsequent surveys. Table 4 shows the contents of the questionnaire used in the thermal comfort survey. The printed questionnaire was provided to each occupant (see Appendix A). The subjects were requested to rate their thermal comfort levels, assess their activities and environmental control, and select suitable environmental adjustment behaviors adopted by them 15 min before the survey to experience coolness and warmth from lists that comprised 17 and 16 options, respectively. Regarding environmental adjustment behaviors, the responses provided were converted to “1” was assigned if the corresponding behavior had been chosen, and to “0” was assigned if it had not been selected. Table 5 shows the scales used for the thermal comfort survey. We used a seven-point scale for the thermal sensation vote, and a six-point scale for the overall comfort vote.
The air temperature, relative humidity, globe temperature, air velocity, carbon dioxide concentration, and illumination were measured at 1.1 m above the floor level regarding the physical environmental parameters. Table 6 presents an outline of the measuring instrument. Although the recommended accuracy for the air temperature is 0.2 °C for class C instruments of thermal comfort according to the ISO 7726 [30] standard and ASHRAE 55 [31], measuring instruments with a temperature measurement accuracy of ±0.3 to ±0.5 °C are often used in many studies in Japan [8,23,24,26,32].
A globe thermometer with a diameter of 75 mm was used in the survey. A small globe with a diameter of 75 mm or a black painted table tennis ball has been widely used in field studies [7,8,9,12,15,20,23,24,26,32]. It was reported that small globes underestimate the mean radiant temperature at high radiative loads, especially in hot thermal environments, but they can be used with some restrictions in terms of features that reduce the high response time affecting the standard globe with a diameter of 150 mm [33,34]. The time constant for the globe thermometer with a 150 mm diameter is about 20 min [35], but it is less for the globe thermometer with a diameter of 75 mm, which would be sufficient to stabilize in the indoor space. Measurement of the mean radiant temperature was performed using a 75 mm globe that exhibits a good compromise between accuracy and response time [26].

2.2. Analysis Method

Except for the comparing the trend of the entire vote set, the voting results were analyzed by dividing them into three modes: FR, CL, and HT. Moreover, we examined the indoor comfort temperature of the occupants according to gender, constitution, clothing, and the adoption of environmental adjustment behaviors. Concerning clothing, the occupants were asked to choose the clothes closest to what they wore at the time they voted; the clo value for each selected item was summed to obtain the total clothing insulation. Regarding the environmental adjustment behaviors, the occupants were asked to select all applicable items from lists (composed of 17 and 16 options, respectively, for behaviors conducted 15 min before the survey to become cooler or warmer). SPSS (version 29, IBM, Armonk, NY, USA) was used for the analysis.

2.3. Calculation Method for the Comfort Temperature

2.3.1. Regression Method

The regression analysis is a common analysis method used to predict the variation in one specific variable owing to the variation in another variable. Using this method, the relationship between the thermal sensation vote (TSV) and indoor globe temperature is given by the following linear equation:
TSV = a Tg + b
where Tg indicates the indoor globe temperature (°C), a is the regression coefficient, and b is the vertical axis intercept.
When this method is used, the globe temperature when TSV is “4. Neutral” is defined as the comfort temperature.

2.3.2. Griffiths’ Method

The comfort temperature can also be derived from the following equation, based on Griffiths’ method [24,27,36]. This method has been used in most field studies.
Tc = Tg + (4 − TSV)/c,
where Tc exhibits the indoor comfort temperature (°C), and a indicates the Griffiths’ constant corresponding to the thermal sensation changing rate with the indoor globe temperature. In past studies, 0.50 was reported to be an appropriate value for c in Equation (2) [24,27,37]; therefore, we adopted c = 0.50.

2.4. Calculation Method for the Running Mean Outdoor Temperature

The comfort temperature can be predicted using the outdoor air temperature [36]. As an index of the outdoor air temperature, the running mean outdoor air temperature [27], which is the historical outdoor air temperature experienced by occupants, was adopted and derived from the following equation. As aforedescribed, the outdoor temperatures were obtained from the meteorological observatory nearest to the survey site [29].
Trm = αTrm1 + (1 − α)Tod−1
where Trm−1 indicates the running mean outdoor air temperature of the previous day (°C), and Tod−1 indicates the daily mean outdoor air temperature of the previous day (°C). α, which indicates the reaction rate to the outdoor air temperature, takes values from 0 to 1; in this case, α = 0.8 [38].

2.5. Estimation of the Occupant Behaviors

A logistic regression analysis was performed to predict occupant behaviors in naturally ventilated buildings [27,39,40]. The same analysis was applied to predict heating and cooling use, window opening, and fan use in this study. The relationship between the probability of an occupant behavior (p) and an outdoor air temperature (To) is expressed by Equations (4) and (5).
logit(p) = loge {p/(1 − p)} = dTo + e
p = exp(dTo + e)/{1 + exp(dTo + e)}
where exp indicates the exponential function with the natural logarithm base, d is the regression coefficient for To, and e is a constant in the regression equation.

3. Results and Discussion

In the field study, 1047 votes were obtained from 143 participants. We analyzed the obtained data following their classifications according to mode, gender, and constitution. Table 7 lists the votes for each mode categorized by gender and constitution. Thermal comfort votes were obtained from 84 males and 59 females. The constitution is divided into three categories: “sensitive to heat”, “sensitive to cold”, and “neither sensitive to heat nor cold (neither)”. Regarding constitution, “neither” was the most common answer (by 49 occupants, constituting 34% of the surveyed occupants). The responses “sensitive to heat” and “sensitive to cold” were obtained from 37 and 34 occupants, respectively. The average age of the occupants was 41.9 years, with ages ranging from the 20s to the 60s. Regarding the occupations of the occupants, clerical workers, and design workers accounted for 57.3% and 38.5% of all the occupants, respectively. Occupants had body mass index (BMI) values from 16.1 to 31.2 kg/m2 with an average BMI of 22.3 kg/m2. Eighty percent of the occupants were considered healthy due to having a BMI below 25 kg/m2.
The monthly mode classifications for all studied office buildings are illustrated in Figure 4. The asterisks in Figure 4 indicate that the mode varies depending on the department. The mode changes depending on the season. However, the mode used differs depending on the office, and the FR mode period during the transition from summer to mid-season is shorter than that during the transition from winter to mid-season. The average indoor globe and outdoor air temperatures during the survey period ranged from 22.2 to 26.0 °C and from 9.8 to 27.2 °C, respectively. Thus, the indoor globe temperature differences were found to be small compared with those of the outdoor air temperature.
The predicted mean vote (PMV) [41] was calculated using the results of the thermal environmental measurements (indoor air temperature, relative humidity, mean radiant temperature, and air velocity) and the questionnaire survey responses (clothing insulation and metabolic rate). Table 8 presents the results of the PMV classified by mode, gender, and constitution. The mean PMV for each mode, gender, and constitution was within the comfort range of −0.5 to +0.5. The comfort range of the PMV in the investigated offices accounted for 59.5% based on the indoor thermal measurements. In terms of the mode, the PMV in the FR and CL modes was evaluated to be slightly hotter, and that in the HT mode was evaluated to be slightly colder. Regarding gender, the variability in the PMV was greater in females than in males. The PMV based on the constitution did not differ as much as that based on the mode or gender. Thus, the indoor thermal environment of the office building studied was generally comfortable.

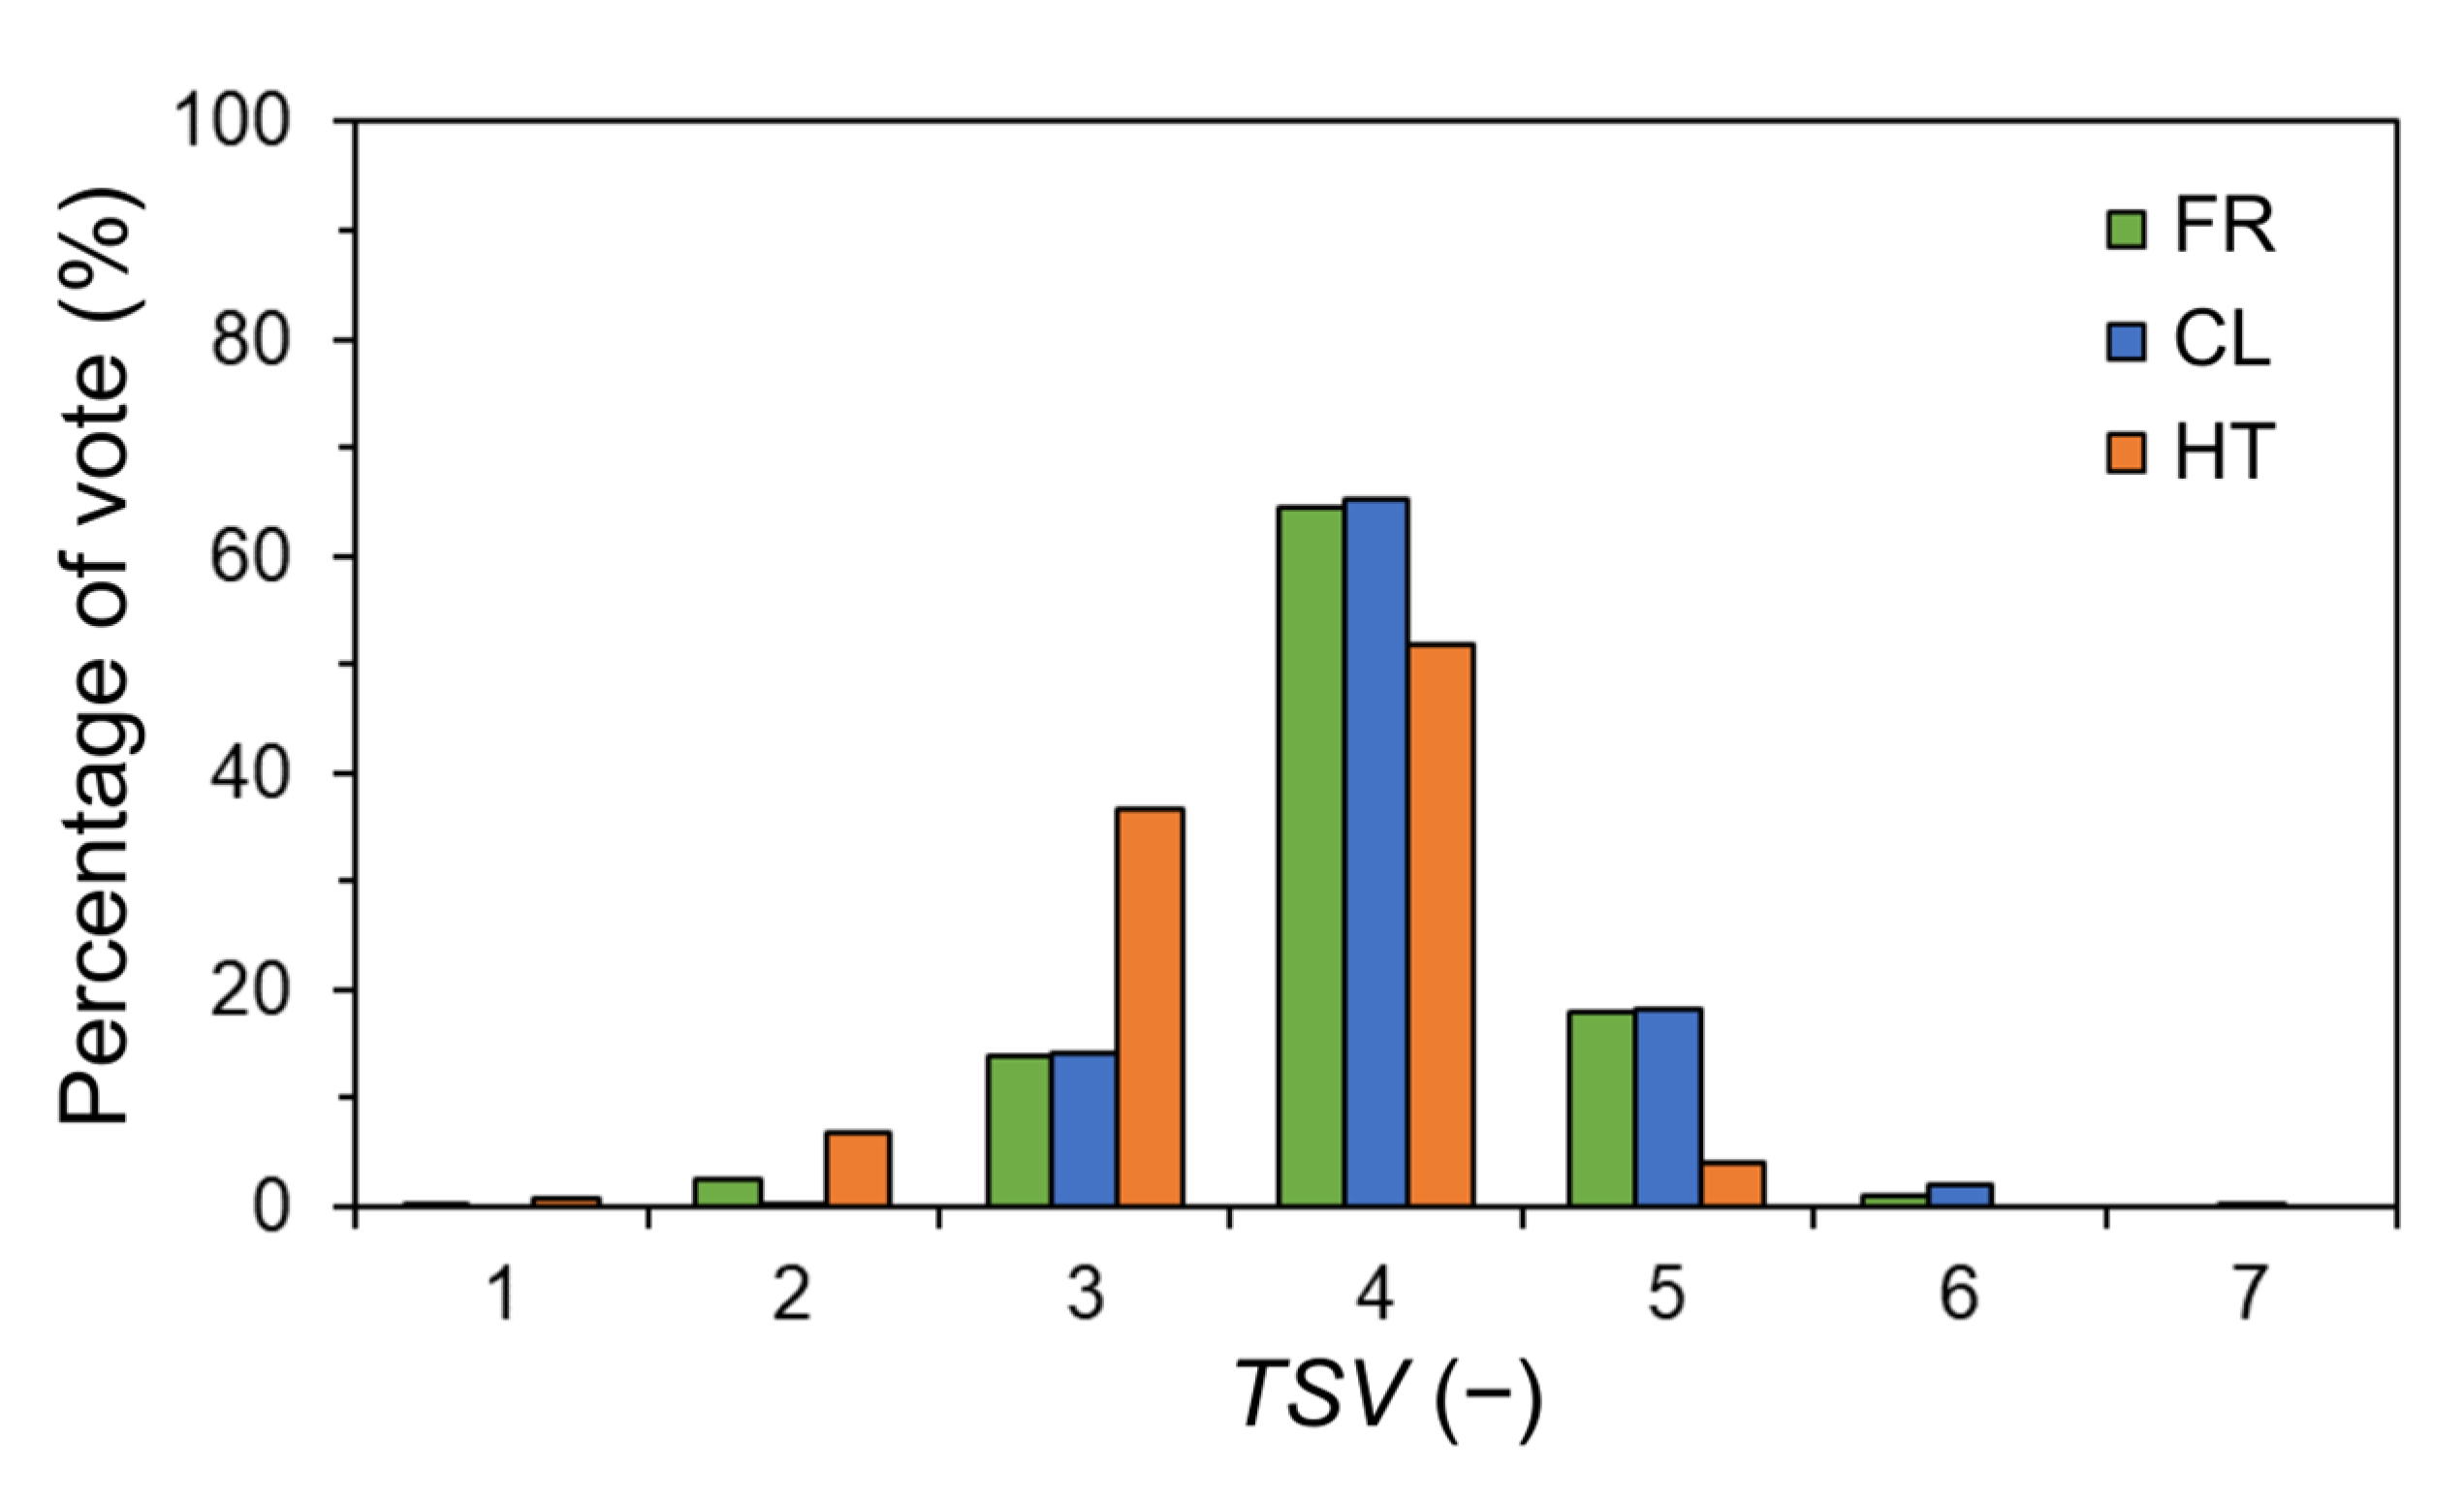
3.1. Thermal Sensation Vote

We analyzed the extent of the thermal sensation variation among occupants in an actual office environment. The following results show how the thermal sensation responses were distributed based on mode, gender, and constitution. Figure 5 illustrates the variation in the TSV categorized based on mode. The TSV varied extensively from “1. Very cold” to “7. Very hot”, and “4. Neutral” was the most frequent response in any mode. The sum of the proportions of “3. Slightly cold”, “4. Neutral”, and “5. Slightly hot” was represented as a thermal comfort zone that ranged from 93 to 97% for each mode. It is suggested that many occupants find the indoor environment in the workspace comfortable. In addition, the average TSV in the HT mode was lower than in the FR and CL modes (p < 0.001).
Figure 6 illustrates the variation in the TSV categorized by gender. The most frequent response from males and females was “4. Neutral”. The proportion of responses within the aforementioned comfort zone was generally high for both genders. Therefore, most occupants were comfortable in the workspace, regardless of their gender. Nevertheless, the average TSV of males was higher than that of females (p < 0.01). Thus, there are significant thermal sensation differences between males and females. This result is consistent with a previous study on student dormitory buildings in Pakistan [42]. Interestingly, this study and the previous study [42] yielded similar trends regarding the significant differences in thermal sensations between males and females, despite the differences in subjects and climates.
Figure 7 illustrates the results of the TSV categorized based on the constitution. The most frequent response was “4. Neither”, regardless of the constitution. Furthermore, occupants sensitive to heat tended to feel hotter than those sensitive to cold or neither. In contrast, occupants sensitive to cold tended to feel colder than those sensitive to heat or neither. Furthermore, there were significant differences in TSV categorized by the constitution. The average TSV in those who were sensitive to heat was significantly higher than that in those who were sensitive to cold (p < 0.001) or neither (p < 0.01). The average TSV associated with those who were sensitive to cold was significantly lower than that associated with those who were sensitive to cold (p < 0.05).
Furthermore, we examined whether the age of occupants affected the thermal sensation. Although the relevant figures are not presented, there was no significant difference in age, except in the CL mode. In the CL mode, the TSV results for participants in their twenties yielded outcomes that were significantly lower than those in other age groups (thirties: p < 0.01, forties: p < 0.05, fifties: p < 0.01, and sixties: p < 0.05).

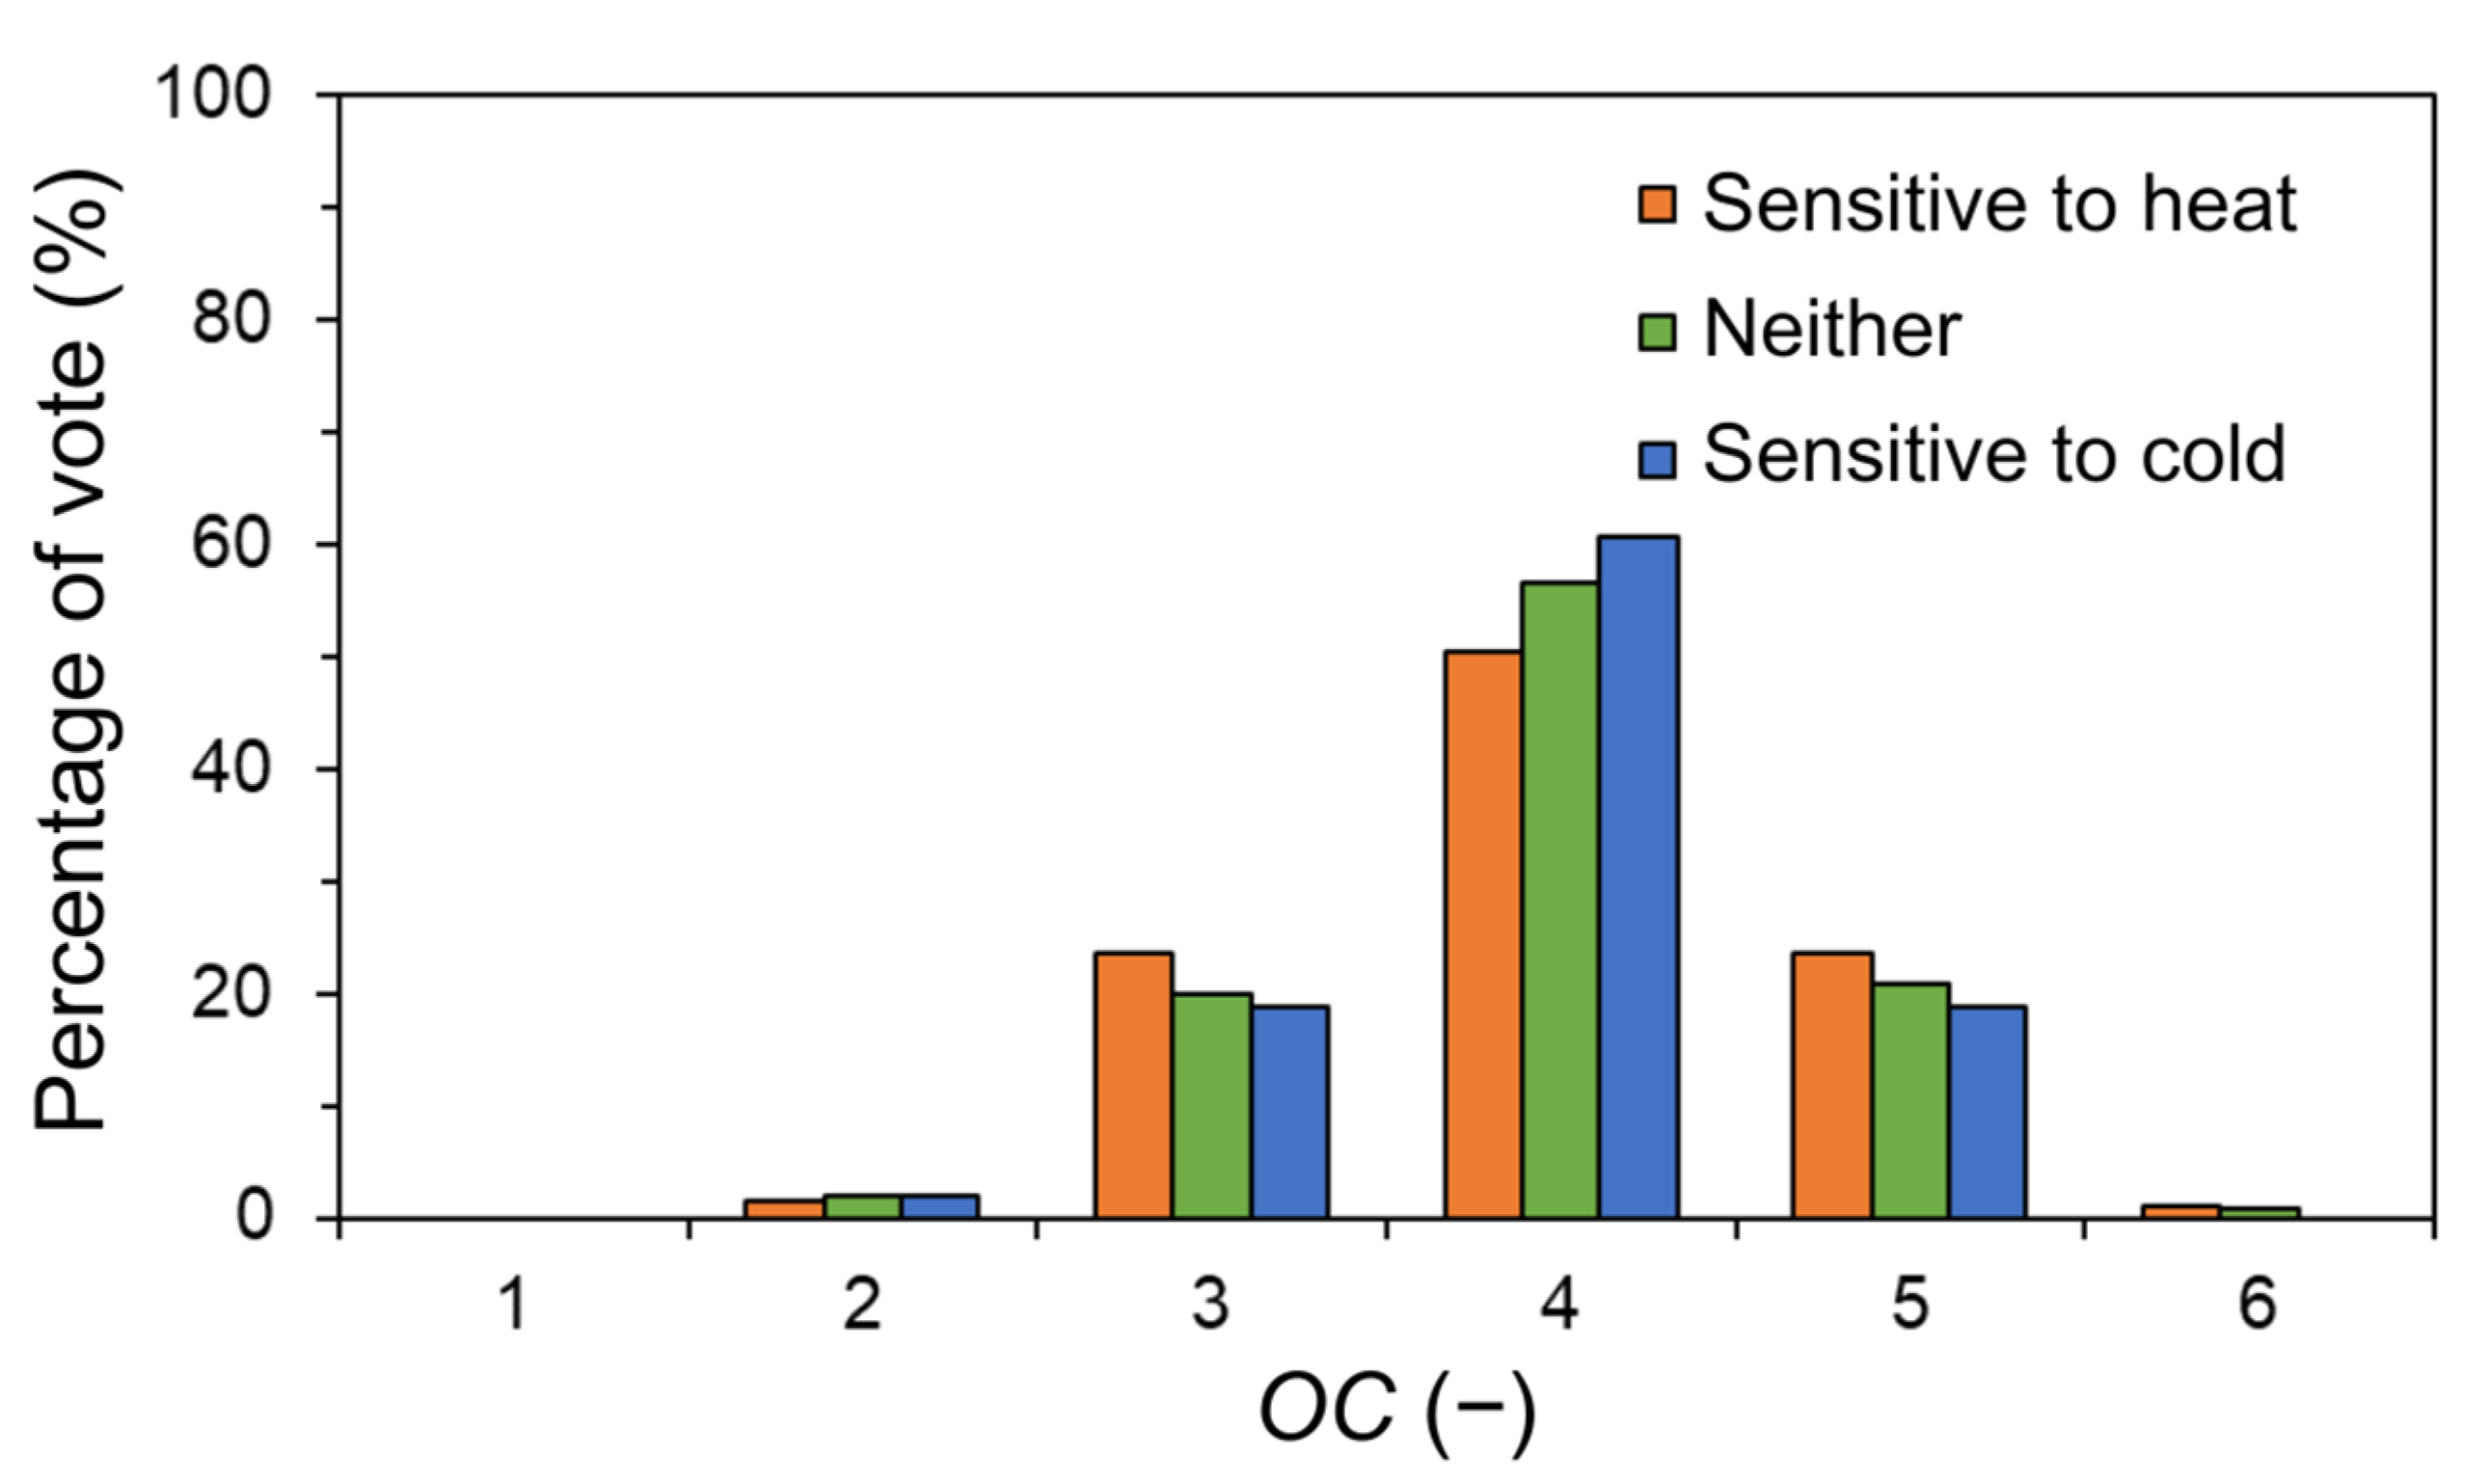
3.2. Overall Comfort Votes

Next, we analyzed how much the comfort sensation varied among occupants in an actual office environment. Figure 8 illustrates the variation in the overall comfort votes (OC) categorized based on the mode. The OC varied extensively from “2. Uncomfortable” to “6. Very comfortable”. “4. Slightly comfortable” was the most frequent response in any mode accounting for more than half of the OC, and yielded outcomes which ranged from 50.1 to 58.1%. All occupants who provided an answer of “6. Very comfortable” for the OC provided an answer of “4. Neutral” for the TSV. The proportions of occupants who provided answers of “4. Slightly comfortable” to “6. Very comfortable” for the OC for each mode ranged from 72.1 to 78.0%, thus indicating that most occupants felt comfortable in the office environment. Furthermore, the average OC in the HT mode was lower than in the CL mode (p < 0.001).
Figure 9 illustrates the variation in the OC categorized based on gender. The majority of both male and female occupants felt “4. Slightly comfortable”, thus indicating that most respondents felt rather comfortable. Furthermore, there was a significant difference in the comfort sensation between the two genders, and the average OC of males was higher than that of females (p < 0.01).
Figure 10 illustrates in the variation of OC categorized based on the constitution. The most frequent response was “4. Slightly comfortable” for any constitution, and the proportions were as follows: 50.4% of the occupants were sensitive to heat, 60.6% of the occupants were sensitive to cold, and 56.5% of the occupants were neither. The proportion of occupants who reported feeling comfortable was high for all constitutions. There were no significant differences in the comfort sensation votes categorized according to the constitution.
Furthermore, we also examined whether the age of the occupants affected the OC. Although the relevant figures are not presented, there were no significant differences based on age except in the CL mode. In the CL mode, the OC for individuals in their twenties was significantly lower than those for individuals in other age groups (thirties: p < 0.001 and forties: p < 0.05), and these individuals felt more uncomfortable compared with those in other age groups.

3.3. Comfort Temperature

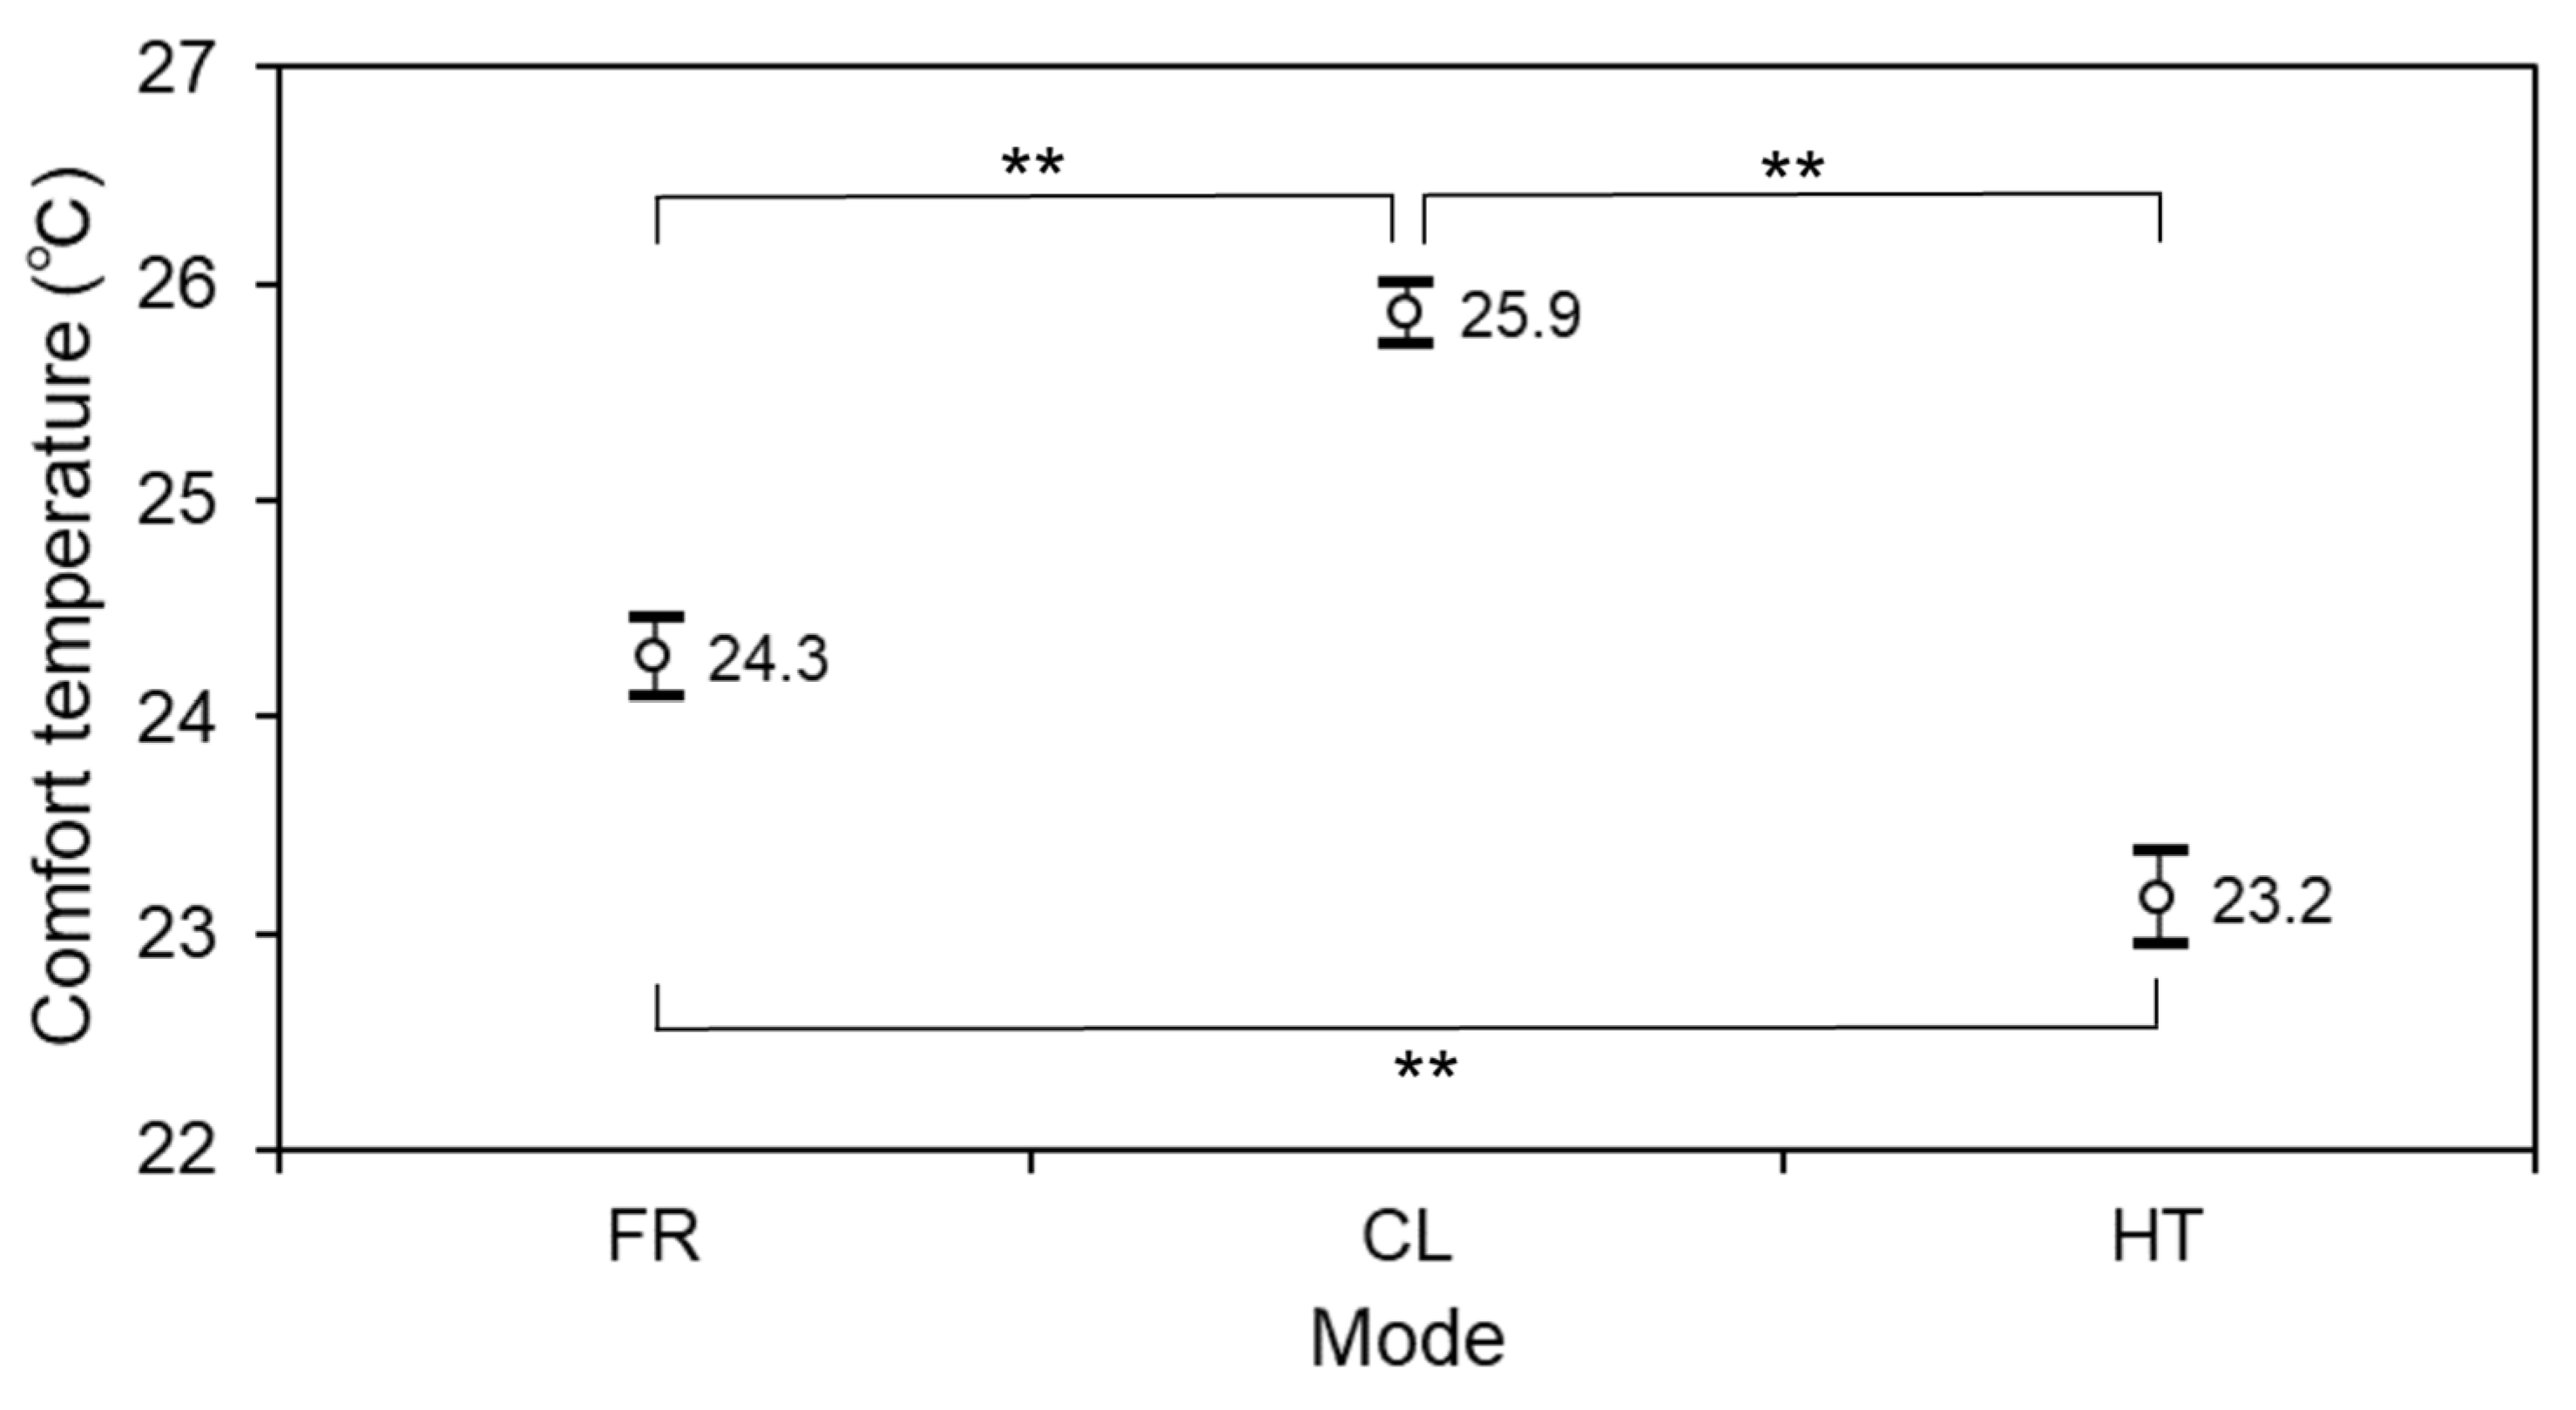
3.3.1. Comfort Temperature Based on Mode

It is important to clarify occupants’ comfort temperatures to ensure efficient energy saving in office buildings. The comfort temperature was obtained in each mode using the regression and Griffiths’ methods. First, as shown in Figure 11, comfort temperatures were calculated in all studied modes from the following regression equation between the TSV and the indoor globe temperature.
FR: TSV = 0.18Tg − 0.41 (N = 398, R2 = 0.33, S.E. = 0.013, p < 0.001)
CL: TSV = 0.10Tg + 1.46 (N = 384, R2 = 0.01, S.E. = 0.044, p = 0.023)
HT: TSV = 0.15Tg + 0.29 (N = 265, R2 = 0.12, S.E. = 0.024, p < 0.001)
where N is the number of responses, R2 is the coefficient of determination of the regression coefficient, S.E. is the standard error of the regression coefficient, and p is the significance level of the regression coefficient.
In Equations (6)–(8), the globe temperature was defined as the comfort temperature when the TSV was “4. Neutral”. The comfort temperature was predicted to be 24.5 °C in the FR mode, 25.4 °C in the CL mode, and 24.7 °C in the HT mode. The coefficients of regression and determination were the highest in the FR mode and the lowest in the CL mode. Thus, the comfort temperatures of all modes yielded narrow ranges (within 1 °C), and the small regression coefficient indicated a possible problem in estimating comfort temperatures [2,23]. Therefore, we applied another method for the comfort temperature prediction.
Figure 12 shows the average comfort temperature calculated using Griffiths’ method in each mode. The comfort temperature calculated based on the mode ranged from 23.2 to 25.9 °C. A larger temperature difference was found in the comfort temperature compared with that calculated using the regression method. Furthermore, the comfort temperature was lower by 0.6 and 1.1 °C in the FR and HT modes, respectively, and was higher by 0.3 °C in the CL mode compared with study previously conducted in office buildings in other areas of Japan [27]. This was probably because the windows were often opened for ventilation when air conditioning units were used.

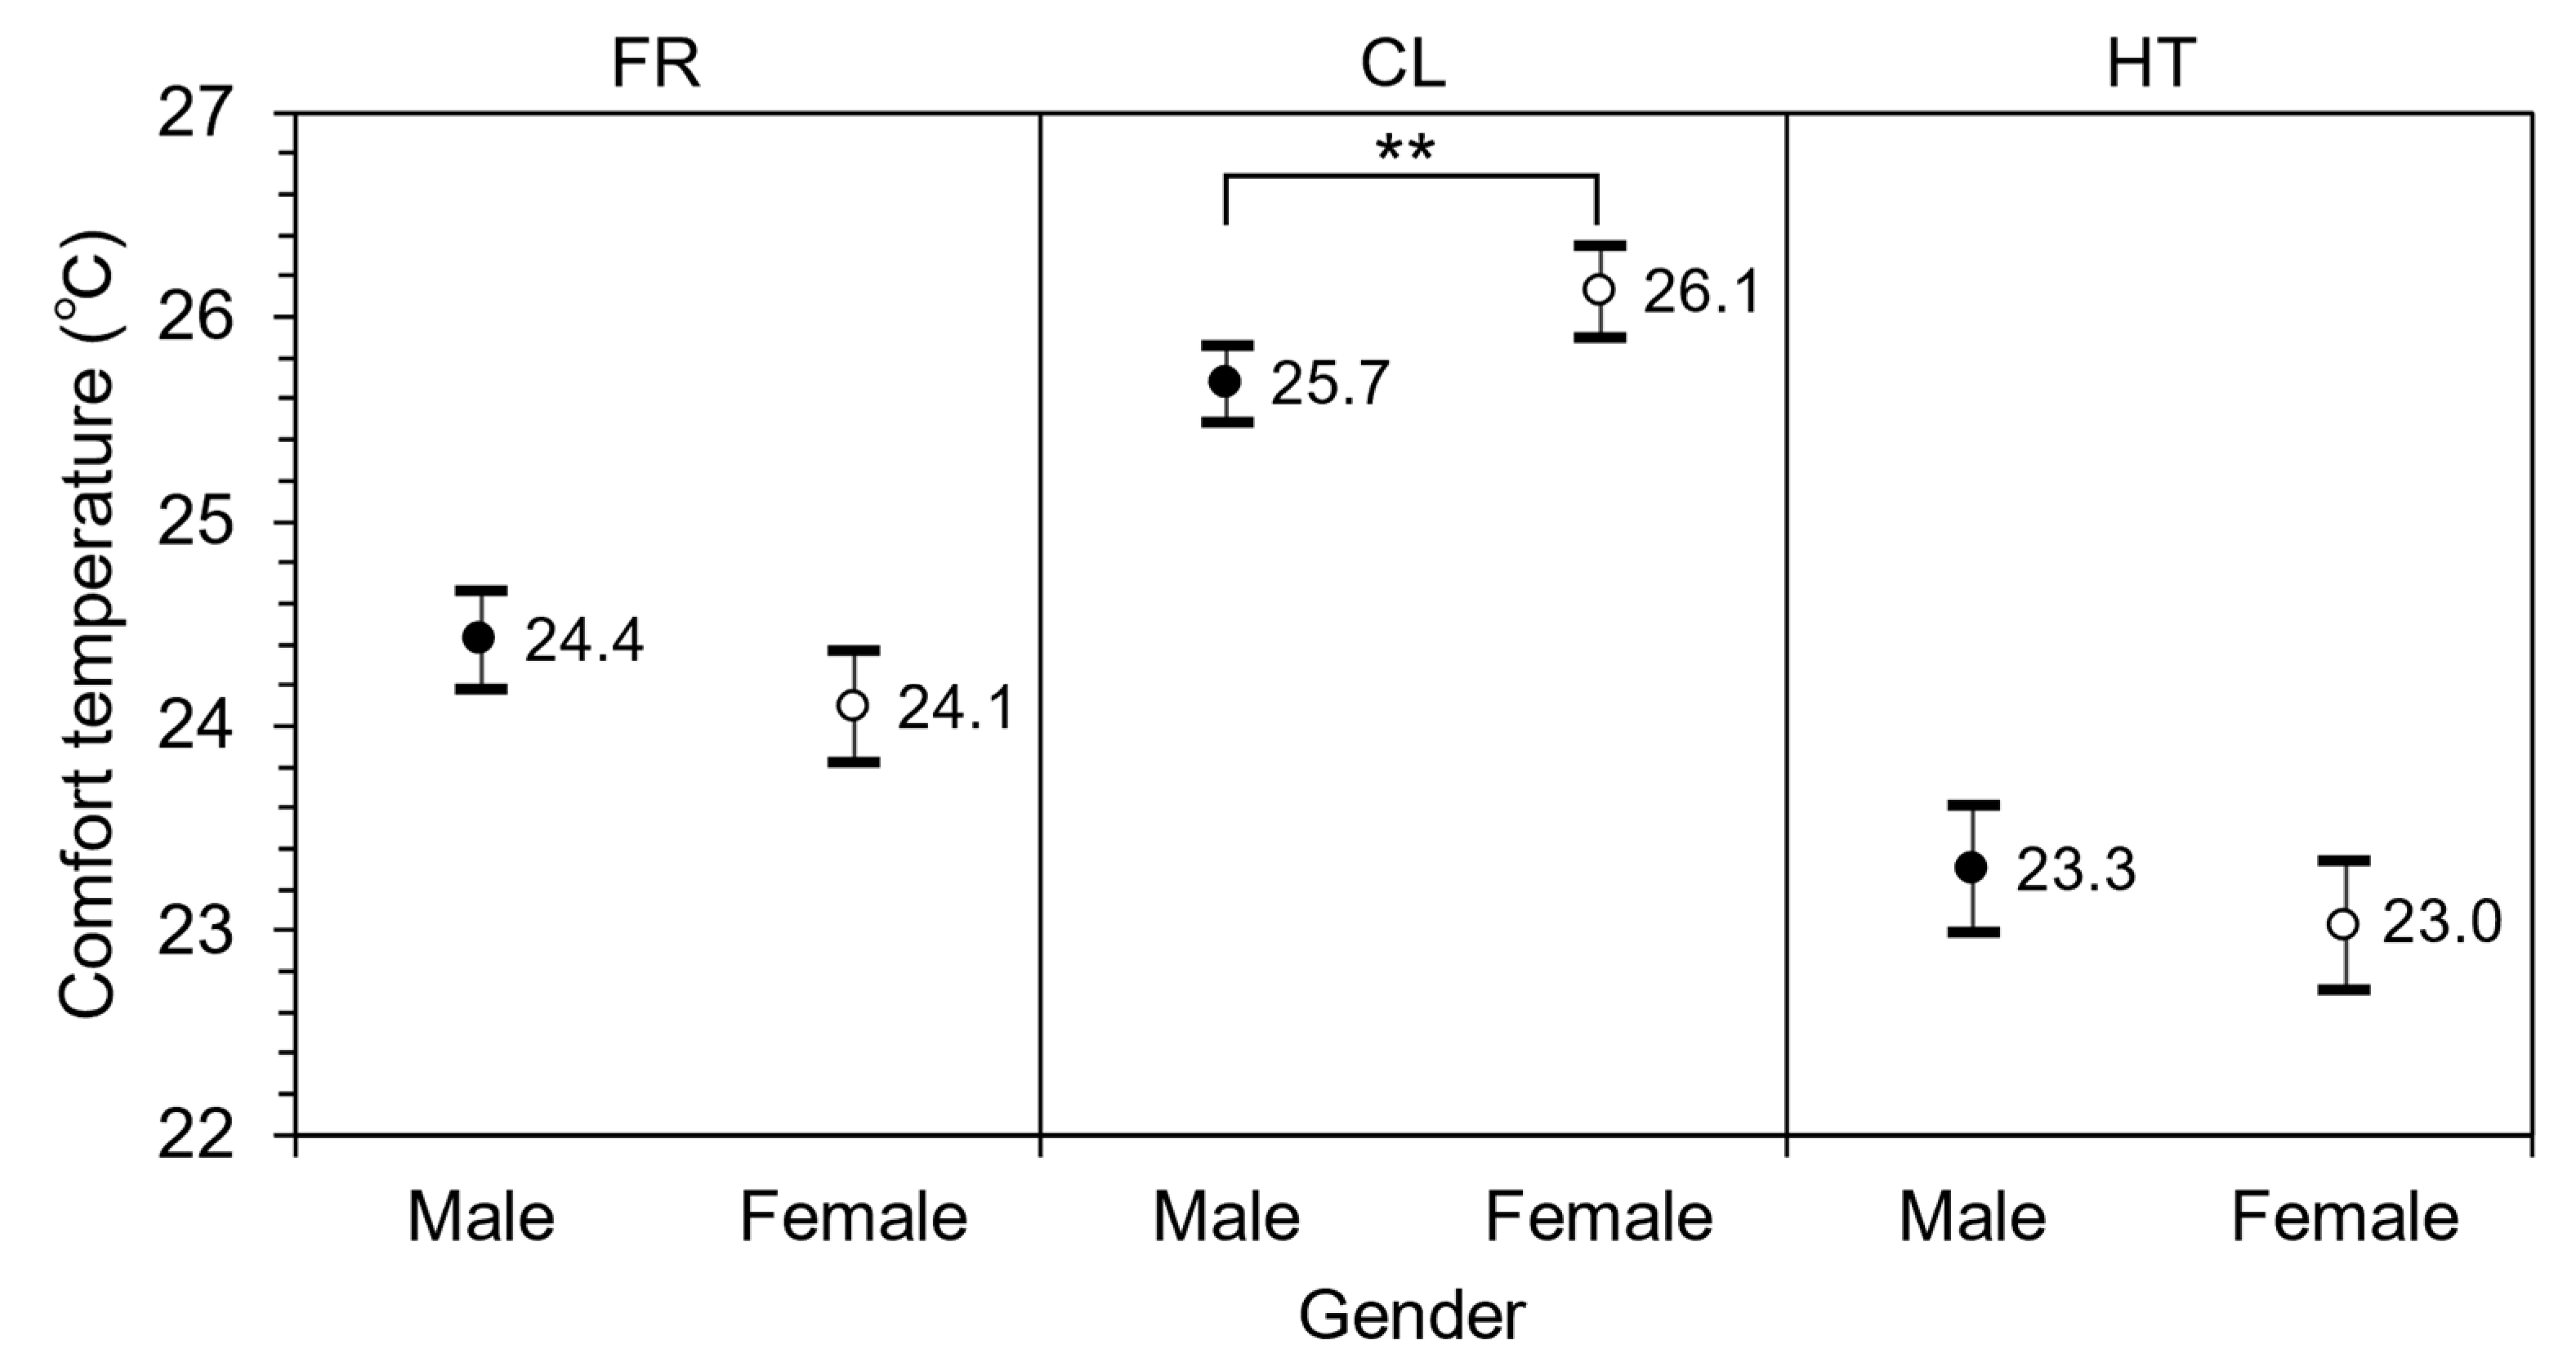
3.3.2. Comfort Temperature Based on Gender

The aforementioned field survey of dormitories in Pakistan [42] indicated that, although the mean comfort temperatures yielded no significant gender differences, there was a gender difference in thermal sensation. We examined whether the average comfort temperature differed between males and females. Figure 13 illustrates the mean comfort temperatures calculated in each mode according to the gender (with 95% confidence intervals: mean ± 2S.E.). We observed a significant gender difference in the comfort temperature only in the CL mode (p < 0.01), with the comfort temperature for males being lower by 0.4 °C compared with that for females. The tendency of males to prefer lower comfort temperatures than females in the CL mode is because males exhibit more environmental behavioral adjustments to experience coolness than females, as described below. According to a previous study performed in the Aichi prefecture of Japan in winter [25], the mean comfort temperature of males is 1.4 °C lower compared with that of females in heating, ventilation, and air conditioning (HVAC) building cases, although the comfort temperatures for the two genders were found to be almost the same (approximately equal to 25.0 °C) in MM building cases. Similarly to the aforementioned previous study [25], this study showed that the comfort temperatures for the two genders were almost the same in the FR and HT modes.

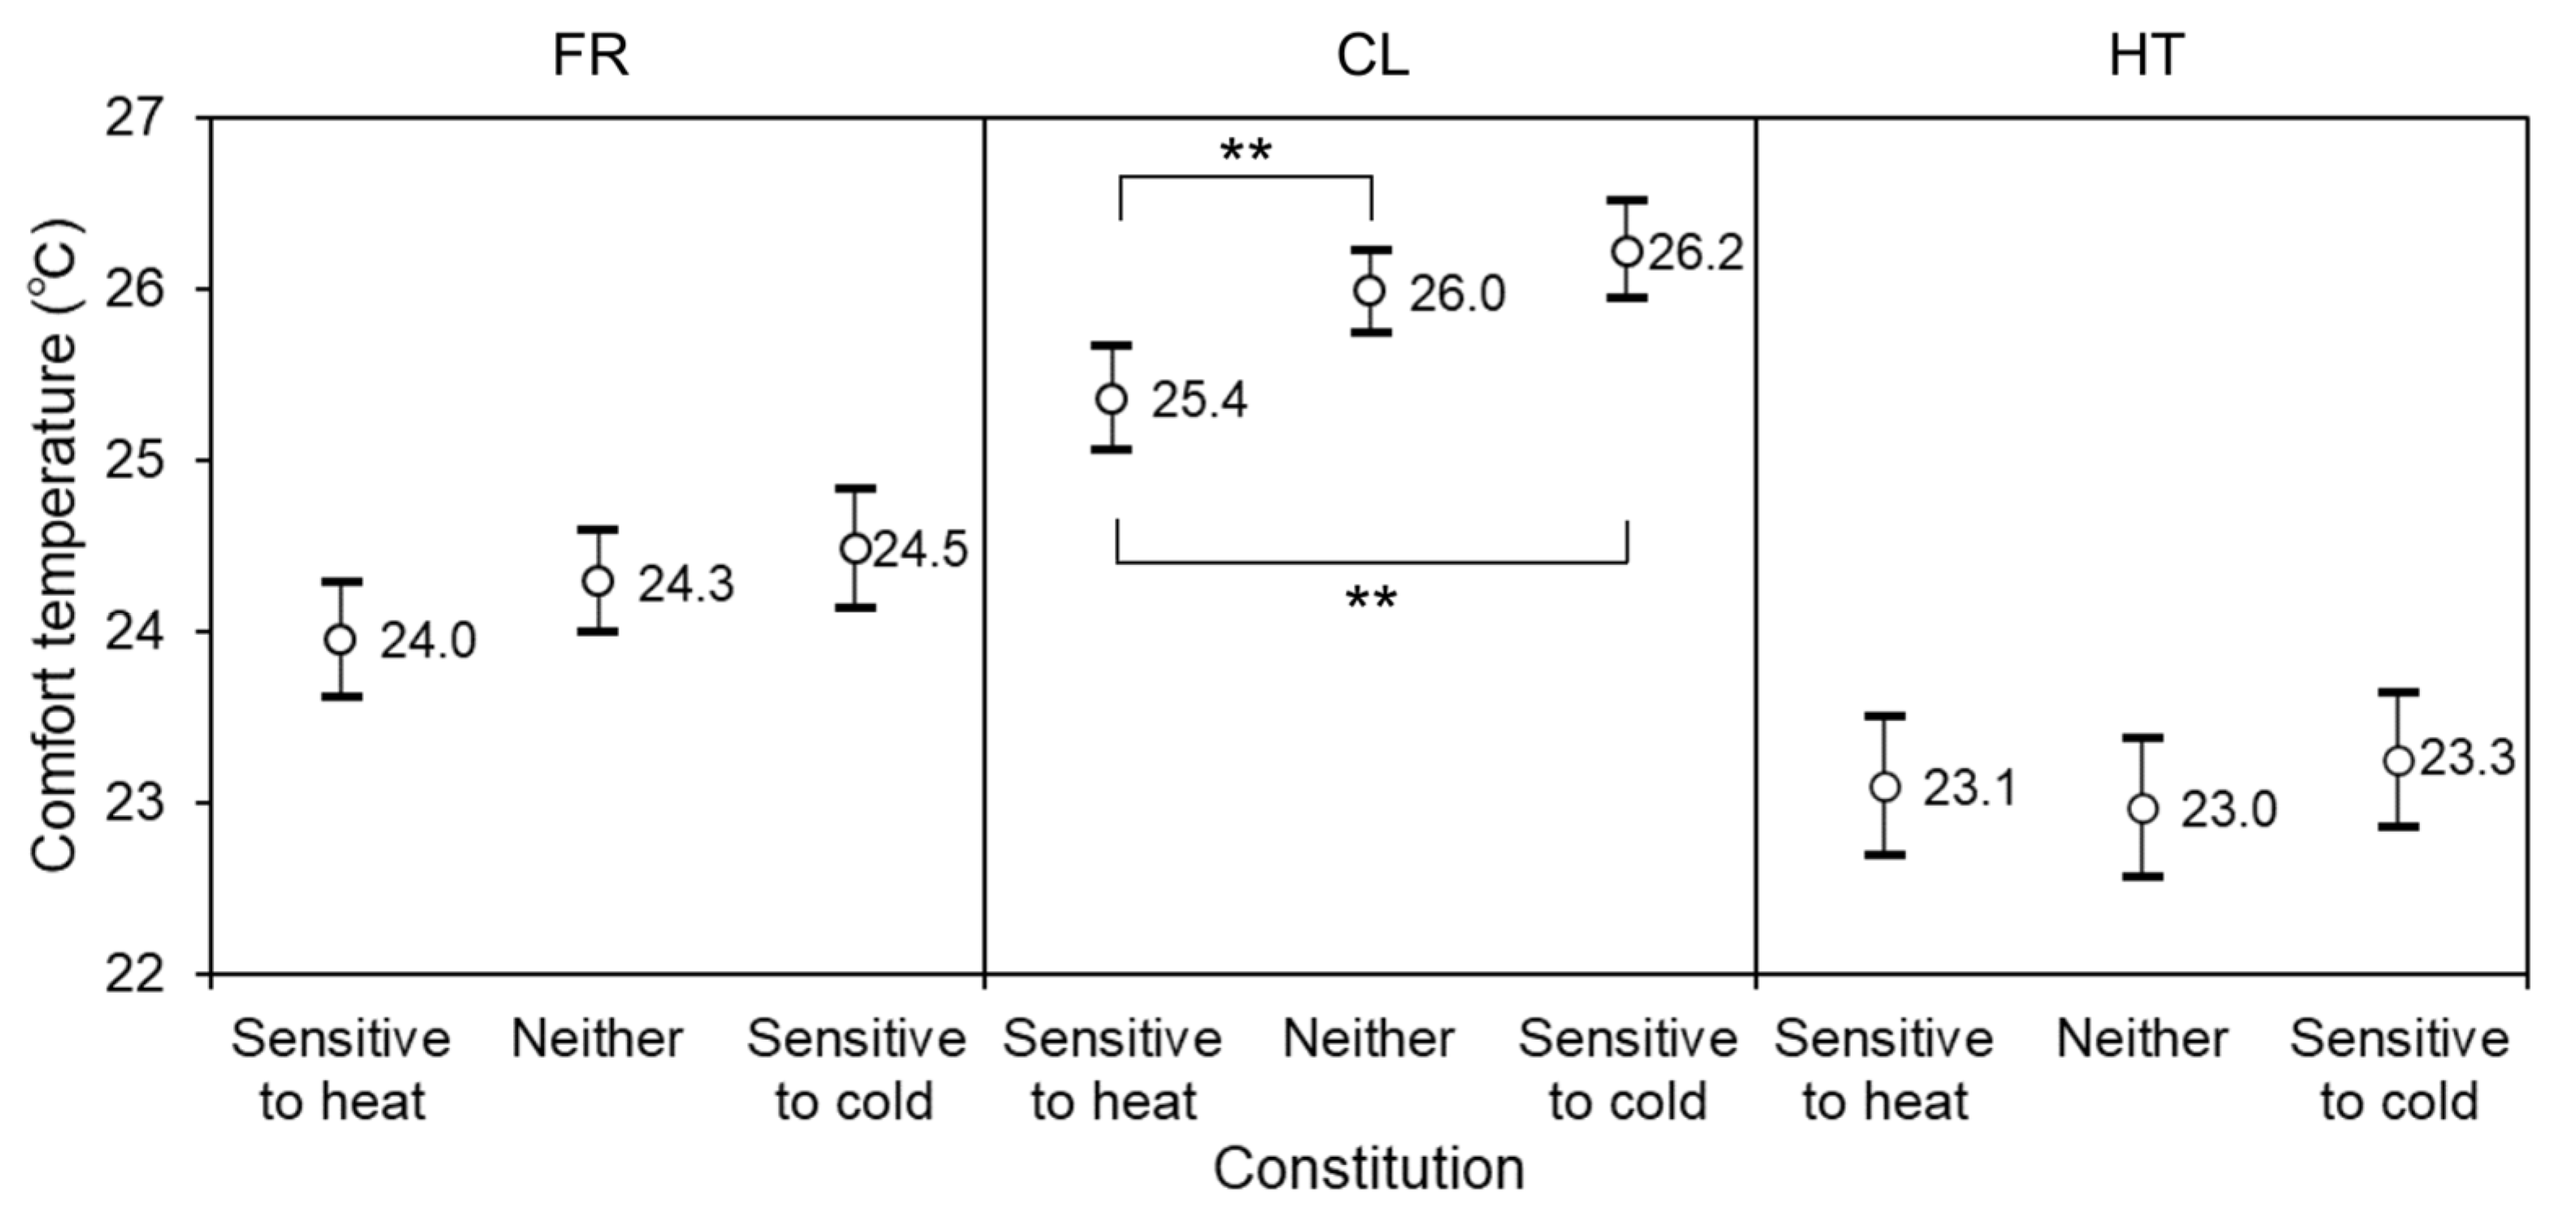
3.3.3. Comfort Temperature Based on Constitution

Next, we determined whether there was a difference in the average comfort temperature of occupants depending on the constitution. Figure 14 illustrates the mean comfort temperatures calculated in each mode according to the constitution (with 95% confidence intervals: mean ± 2S.E.). Interestingly, there was a significant temperature difference only in the CL mode case. The comfort temperature for the category “sensitive to heat” was significantly lower by 0.8 °C than that for “sensitive to cold” (p < 0.01). It is natural to assume that an occupant who is sensitive to heat feels more comfortable at a lower temperature than an occupant who is sensitive to cold in the CL mode.

3.3.4. Comfort Temperature Based on Age

We also examined whether the age of the occupants affected the comfort temperature. Although the relevant figures are not presented, there was a significant difference based on age, except in the CL mode. In the FR mode, the comfort temperature of the occupants in their twenties was significantly higher than those of the occupants in their forties (p < 0.001) and sixties (p < 0.05). In the HT mode, the comfort temperature of occupants in their twenties was significantly higher than that of occupants in their forties (p < 0.05).

3.3.5. Comfort Temperature Fluctuation in the FR Mode

Comfort temperature differs depending on the region and season [36]. Hence, we examined whether there are monthly and seasonal variations in comfort temperatures in office buildings in Nagasaki City. First, Figure 15 depicts the fluctuation in the comfort temperature in the FR mode observed for eight months during the survey period. It can be observed that the mean comfort temperature exhibited a monthly variation of 4.2 °C in the FR mode. In contrast, the average outdoor air temperature exhibited a larger monthly variation of 8.6 °C compared to the indoor comfort temperature (see Figure 1b).
Similarly, Figure 16 depicts the mean comfort temperature fluctuation for each season in the FR mode. It can be observed that the mean comfort temperature had a seasonal variation of 3.9 °C in the FR mode. In contrast, the seasonal mean outdoor air temperature in the FR mode was minimal in winter (approximately equal to 8.6 °C) and maximal in the summer (approximately equal to 25.2 °C); the outdoor air temperature difference was larger compared with that in the indoor comfort temperature. As described above, the occupants were observed to adapt to the environment in the office buildings (within a range of approximately 4 °C). In a previous study conducted in the Kanto region [23], the monthly and seasonal average comfort temperatures in the FR mode varied from 22.1 to 26.0 °C and from 24.2 to 25.7 °C, respectively. Thus, the mean comfort temperature variation in the FR mode in our survey was larger than that in the Kanto region; this was attributable to the absence of winter data in the FR mode from the Kanto region offices, compared to our survey conducted in Nagasaki. Thus, it was found that the seasonal fluctuation in the comfort temperature differs from region to region in the FR mode.

3.4. Relationship between Indoor Comfort and Outdoor Air Temperatures

Occupants adapt to become comfortable within the outdoor environment, which changes daily. We examined how the indoor comfort temperature relates to the outdoor air temperature according to the studied modes. Figure 17 illustrates this relationship classified into the following two modes and compares the obtained regression equations.
FR: Tc = 0.28Trm + 19.5 (N = 398, R2 = 0.41, S.E. = 0.017, p < 0.001)
CL and HT: Tc = 0.15Trm + 22.0 (N = 649, R2 = 0.40, S.E. = 0.007, p < 0.001)
In this study, a value calculated using Griffiths’ method was applied to the Tc. Regarding the CL and HT modes, the regression coefficients were larger compared with those of the CIBSE Guide (0.09) [43] and the Kanto region (0.10) [27]. This can be explained by taking into account that the windows were open, even when the occupants used air conditioners for ventilation in most of the studied office buildings; consequently, it was found that the outdoor air temperature significantly influenced the indoor comfort temperature as compared with other surveys [27,43]. It is suggested that the comfort temperature may have been affected by window opening practices in the CL and HT modes (owing to the COVID-19 pandemic).
Conversely, the FR mode exhibited a different trend from those of the two aforementioned modes, that is, the regression coefficient yielded different values in the two previously conducted studies; specifically, the European Committee for Standardization (0.33) [44] and the Kanto region values (0.15) [27] were obtained. Regarding the FR mode, it was found that the comfort temperatures in Nagasaki City were more significantly affected by the outdoor air temperature compared with other regions. This is presumably attributable to regional differences.

3.5. Occupant Behavior

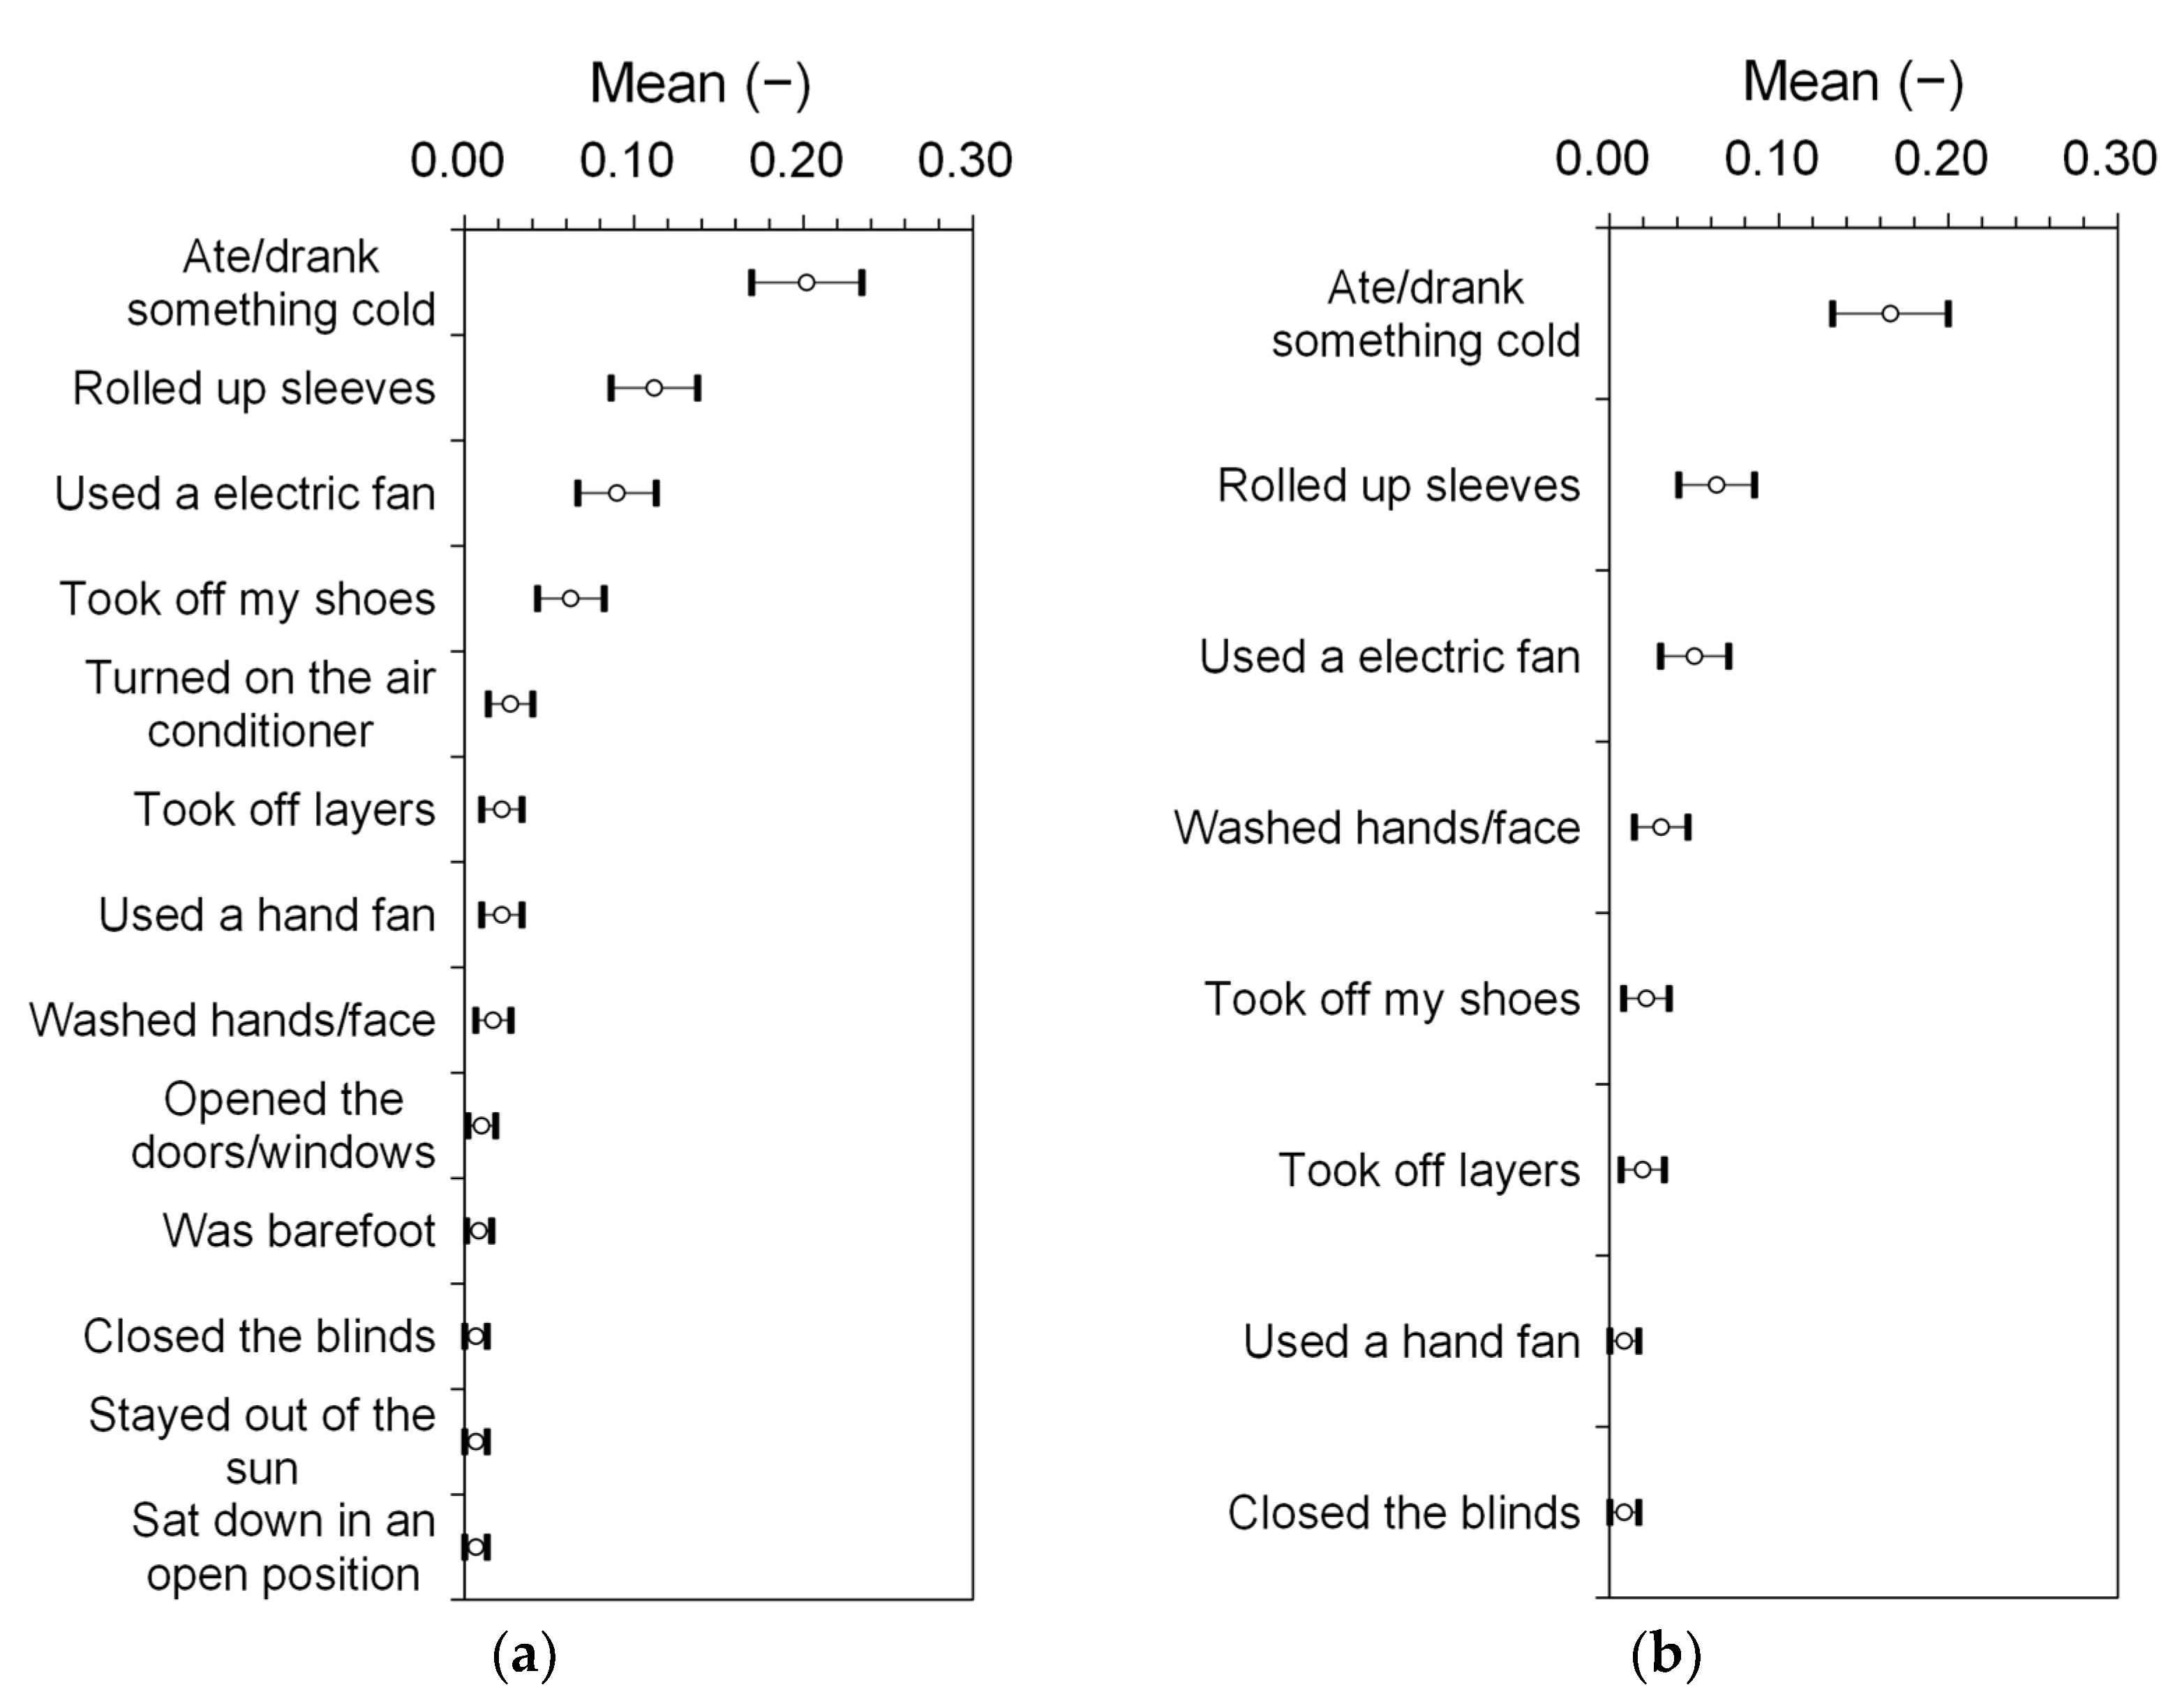
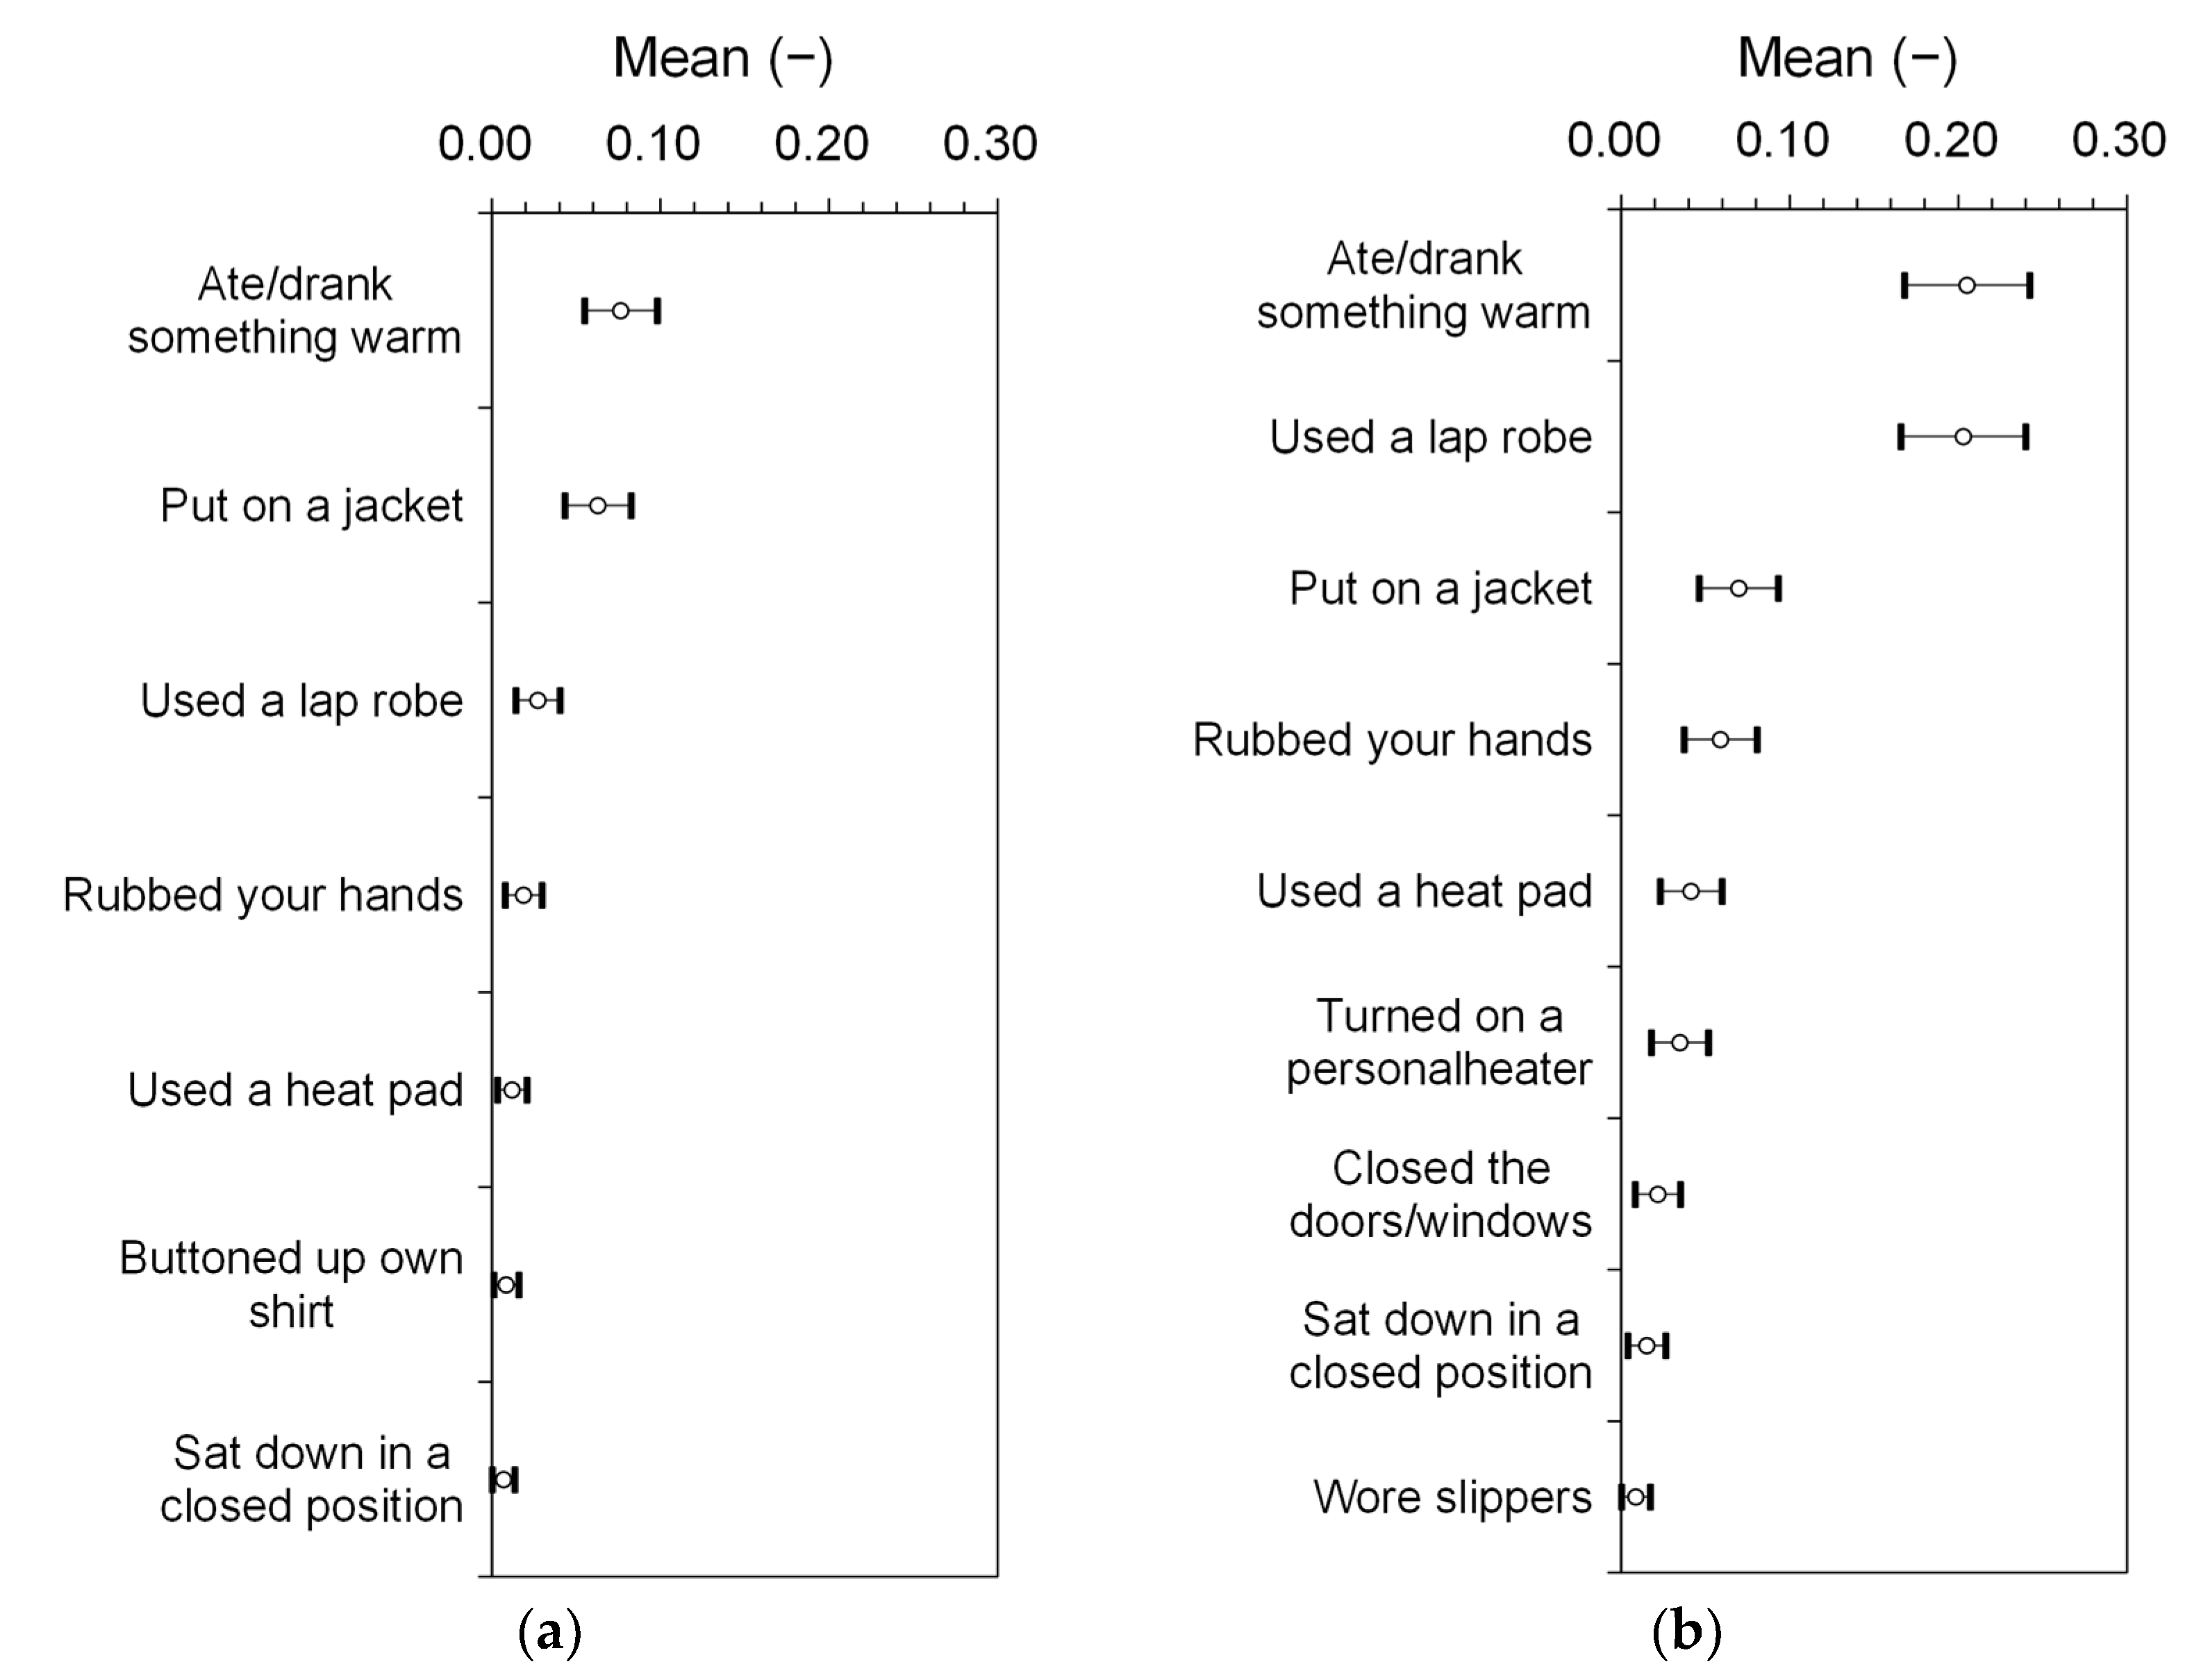
3.5.1. Occupant Behaviors Adopted to Experience Coolness and Warmth

Next, we analyzed how occupants adapted to the environment and the types of behaviors adopted in their offices. The mean value was calculated for each behavior. In the subsequent figures presented in this paper, only behaviors with positive mean values are shown in ascending order based on gender. Overall, more male occupants were observed to experience coolness (p < 0.001), and more female occupants attempted to experience warmth (p < 0.001); however, these results are not reported herein.
Figure 18 depicts the environmental adjustment behaviors exhibited by the building occupants to experience coolness (with 95% confidence intervals: mean ± 2S.E.). Males tended to attempt more behaviors to experience coolness than females. The most common behavior in both genders was “Ate/drank something cold”. These results are similar to those reported in the study obtained from the offices of the Kanto region [45].
Figure 19 depicts the environmental adjustment behaviors exhibited by the building occupants to experience warmth (with 95% confidence intervals: mean ± 2S.E.). Although females tended to attempt more behaviors to experience warmth than males, the most common behavior exhibited by males was “Ate/drank something warm”. This result is similar to the results reported in the study conducted in the offices of the Kanto region [45]. Conversely, the most common behavior exhibited by females was “Used a lap robe”, followed by “Ate/drank something warm”. Therefore, environmental adjustment behaviors adopted to experience warmth were observed in females but may have occurred less in males.

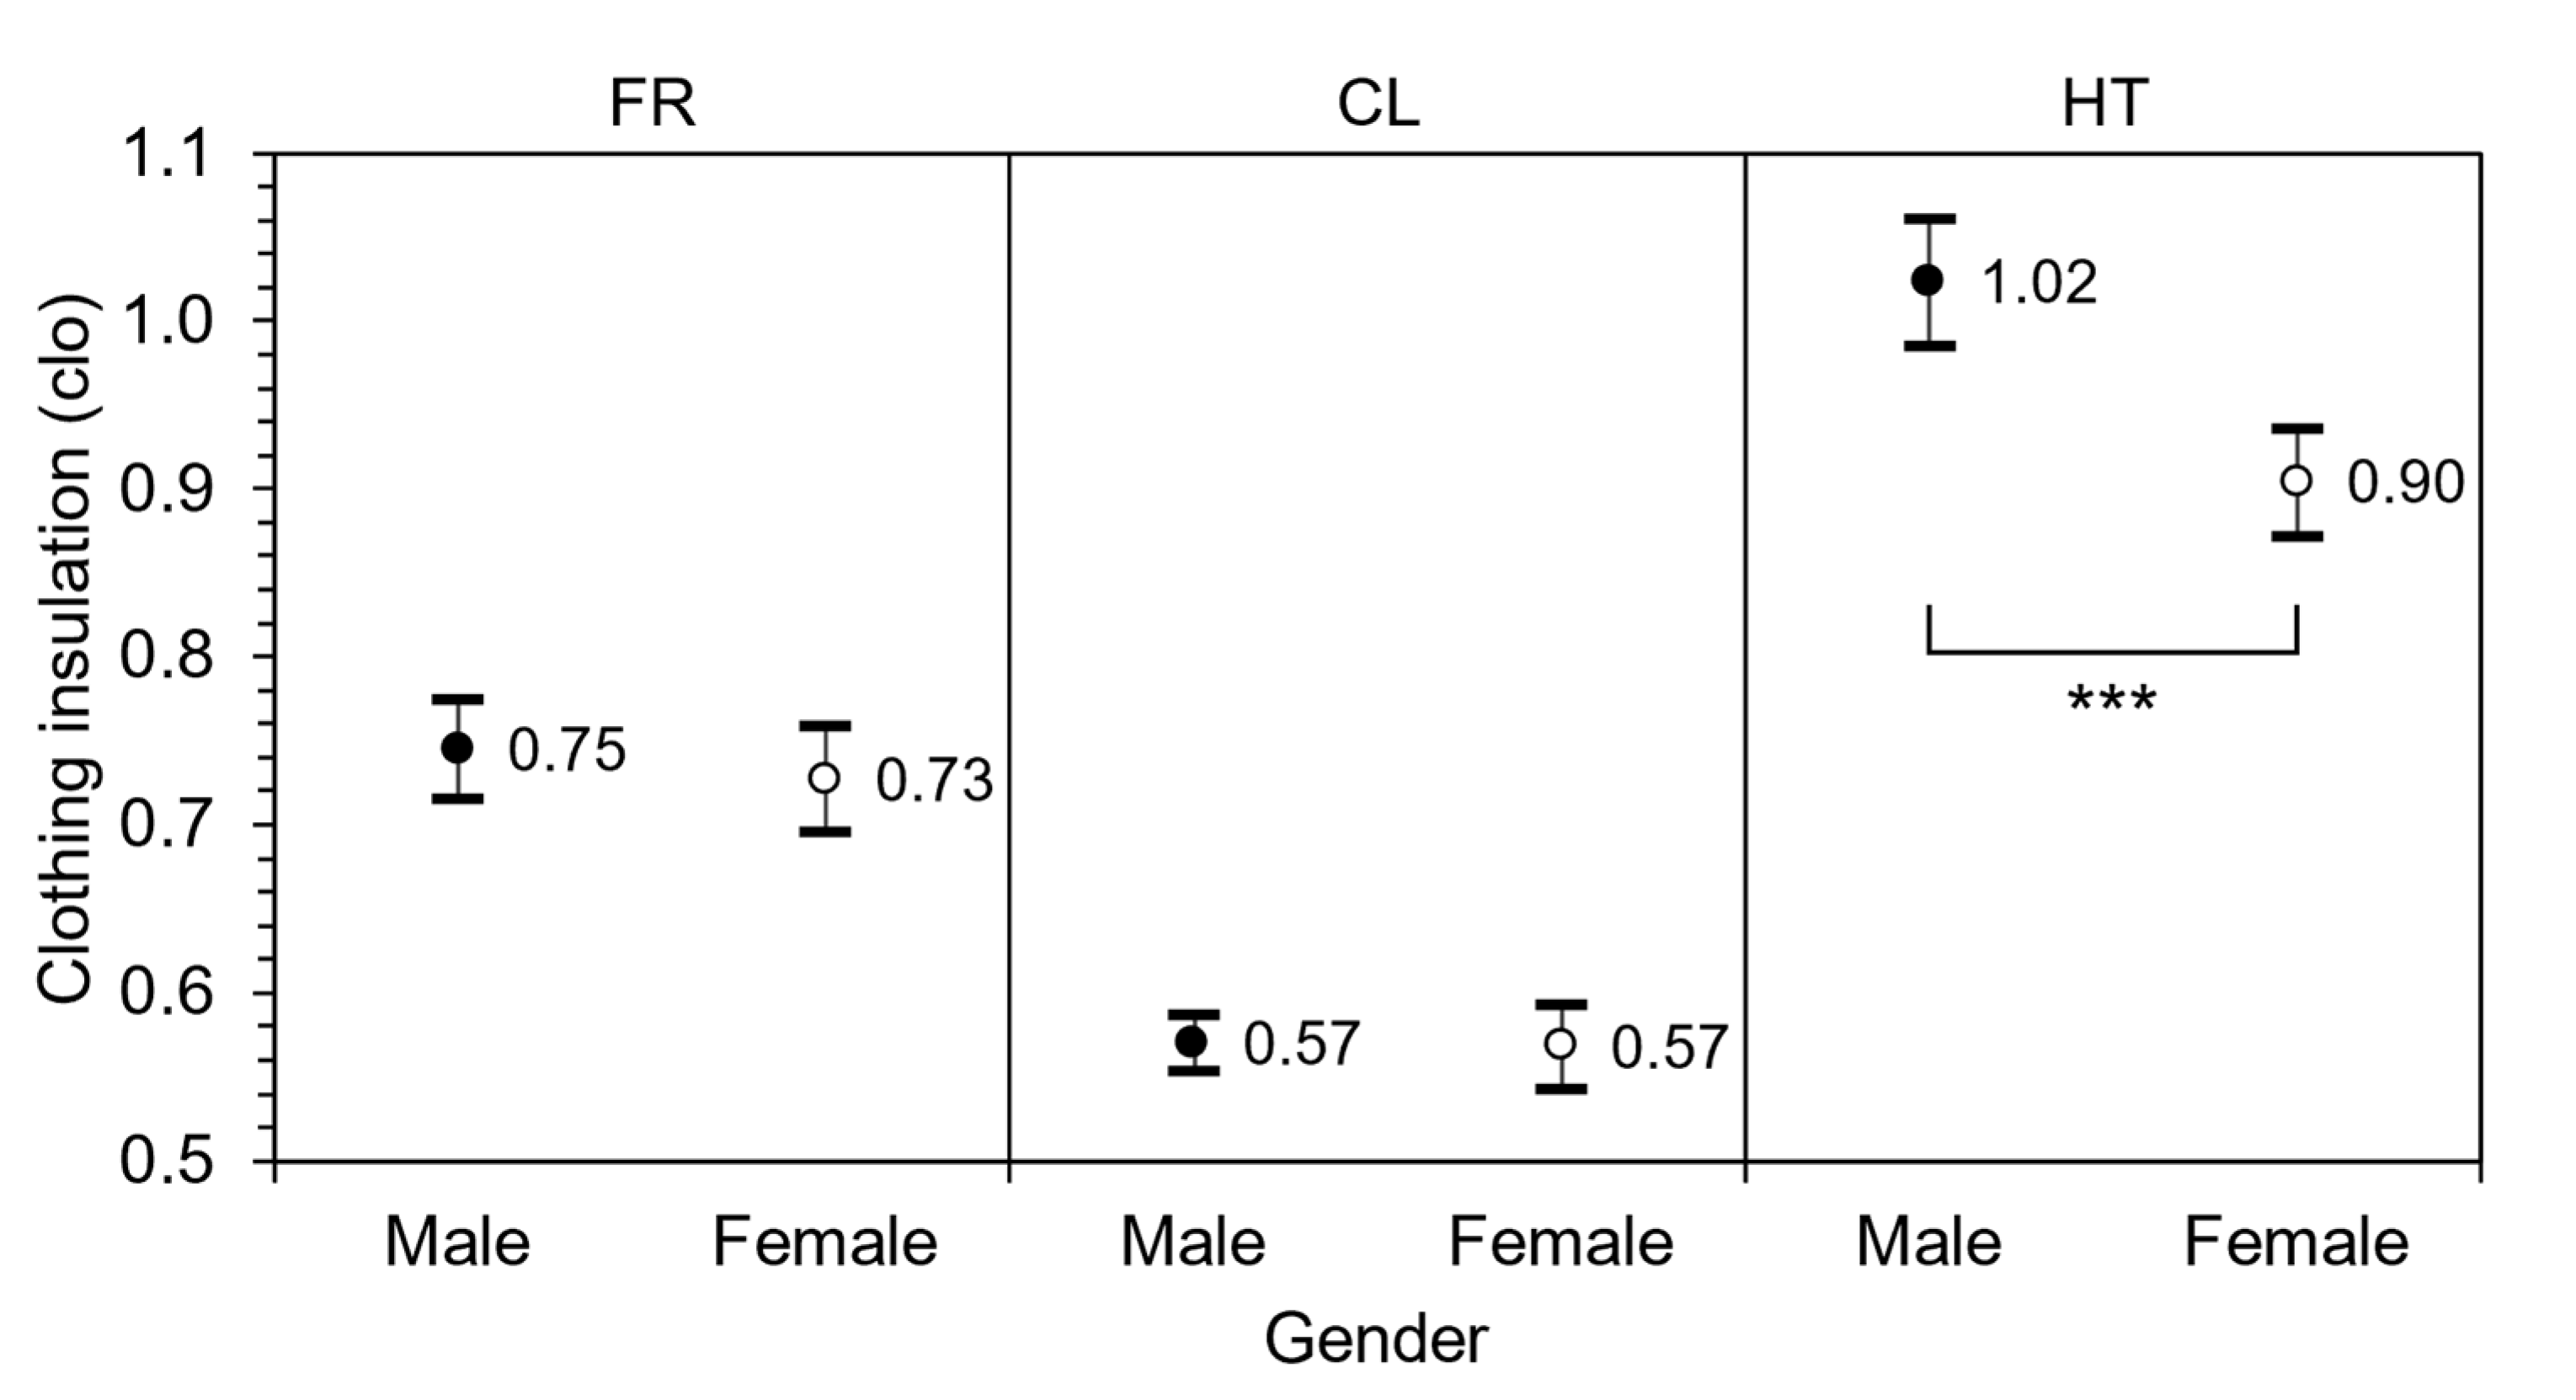
3.5.2. Clothing Insulation

As aforementioned, occupants adapted to the environment by adopting various environmental adjustment behaviors. Adjusting clothes is also one of the major environmental adjustment behaviors. The amount of clothing calculated from the votes of clothing was compared according to mode and gender. Figure 20 illustrates the mean clothing insulation calculated according to gender in each mode. The mean clothing insulation was significantly higher for males than that for females only in the HT mode (p < 0.001). Additionally, the average number of upper-body clothing items was significantly higher in the case of males (3.0) than that in females (2.6). Moreover, the percentages of corresponding to the wearing of jackets were 68% and 29% in males and females, respectively; herein, jackets refer to clothing items that were worn over vests, cardigans, and other jackets.
As explained in Section 3.5.1., females tended to adopt more environmental adjustments to experience warmth than males. This implies that male occupants adapted to their office environment by increasing the clothing worn by them, whereas female occupants adapted to the office environment by executing more environmental adjustments than males. Interestingly, the differences between the environmental adjustment behaviors of males and females resulted in similar comfort temperatures in the HT mode.

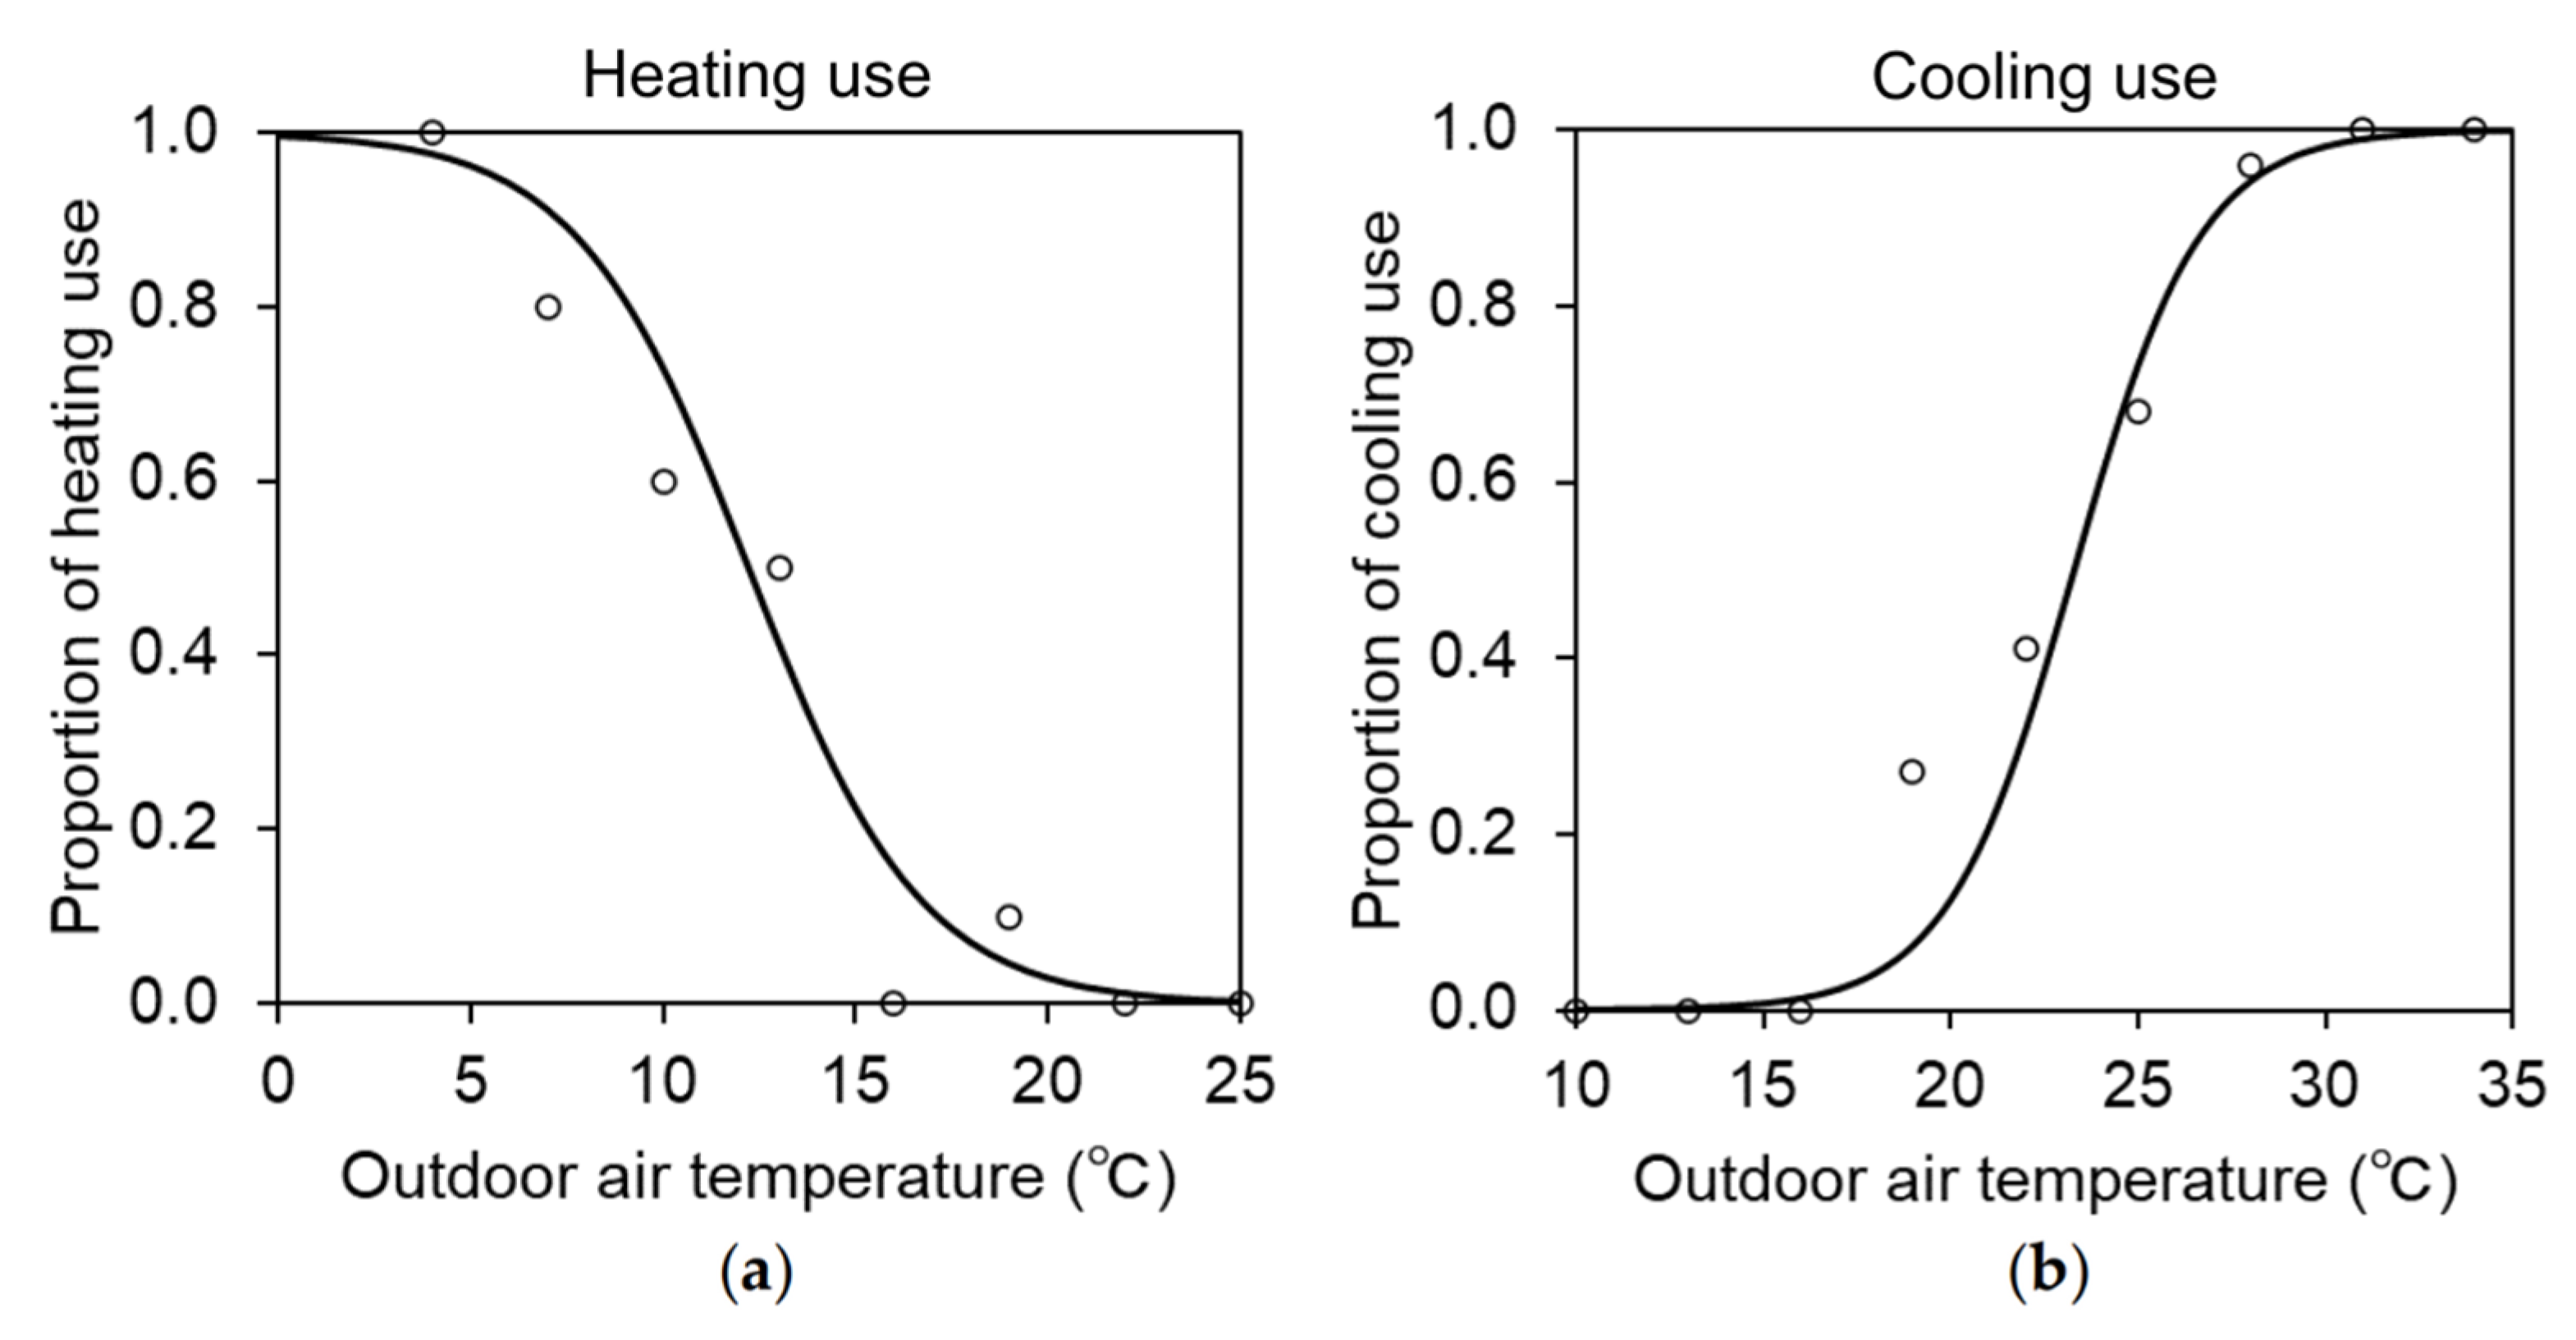
3.5.3. Heating and Cooling Use

Herein, we focus on the heating and cooling use among all the behaviors of the occupants and clarify how these behaviors relate to the outdoor air temperature. A logistic regression analysis was used to predict heating and cooling use. The following regression equations were obtained:
Heating use: logit (p) = − 0.446To + 5.5 (N = 1047, R2* = 0.48, S.E. = 0.031, p < 0.001)
Cooling use: logit (p) = 0.591To − 13.8 (N = 1047, R2* = 0.58, S.E. = 0.041, p < 0.001)
where R2* denotes the Cox and Snell R2 for the regression coefficient.
Figure 21 presents the relationship between heating or cooling usage and the outdoor air temperature. Actual measured data are also plotted on the graph. Most data matched the regression equations for both heating and cooling use (the exceptions were when an office did not use the heating system temporarily during visits, despite the low outdoor air temperatures). Generally, the percentage of heating use tends to increase as the outdoor air temperature falls; the percentage of cooling use tends to increase as the outdoor air temperature rises. The regression coefficients for heating and cooling use in the Kanto region [27] were found to be −0.839 and 0.359, respectively. Comparing these outcomes with a previous study in the Kanto region offices [27], outdoor air temperature did not significantly influence heating use in the Nagasaki offices. In contrast, the trend was the opposite for the cooling use. In this study, the regression coefficient for cooling use was larger compared with that for the Kanto region. This was attributed to the opening of windows for ventilation even in the case of cooling use owing to the COVID-19 pandemic. In contrast, the proportion of open to closed windows when heating was used was not as high as that when cooling was used; thus, the impact of the outdoor air temperature on heating use may be smaller compared with that on cooling. Furthermore, a high correlation was observed between heating/cooling use and the outdoor air temperature; accordingly, it was confirmed that it is possible to predict heating/cooling use by using the logistic regression equation in conjunction with the outdoor air temperature.

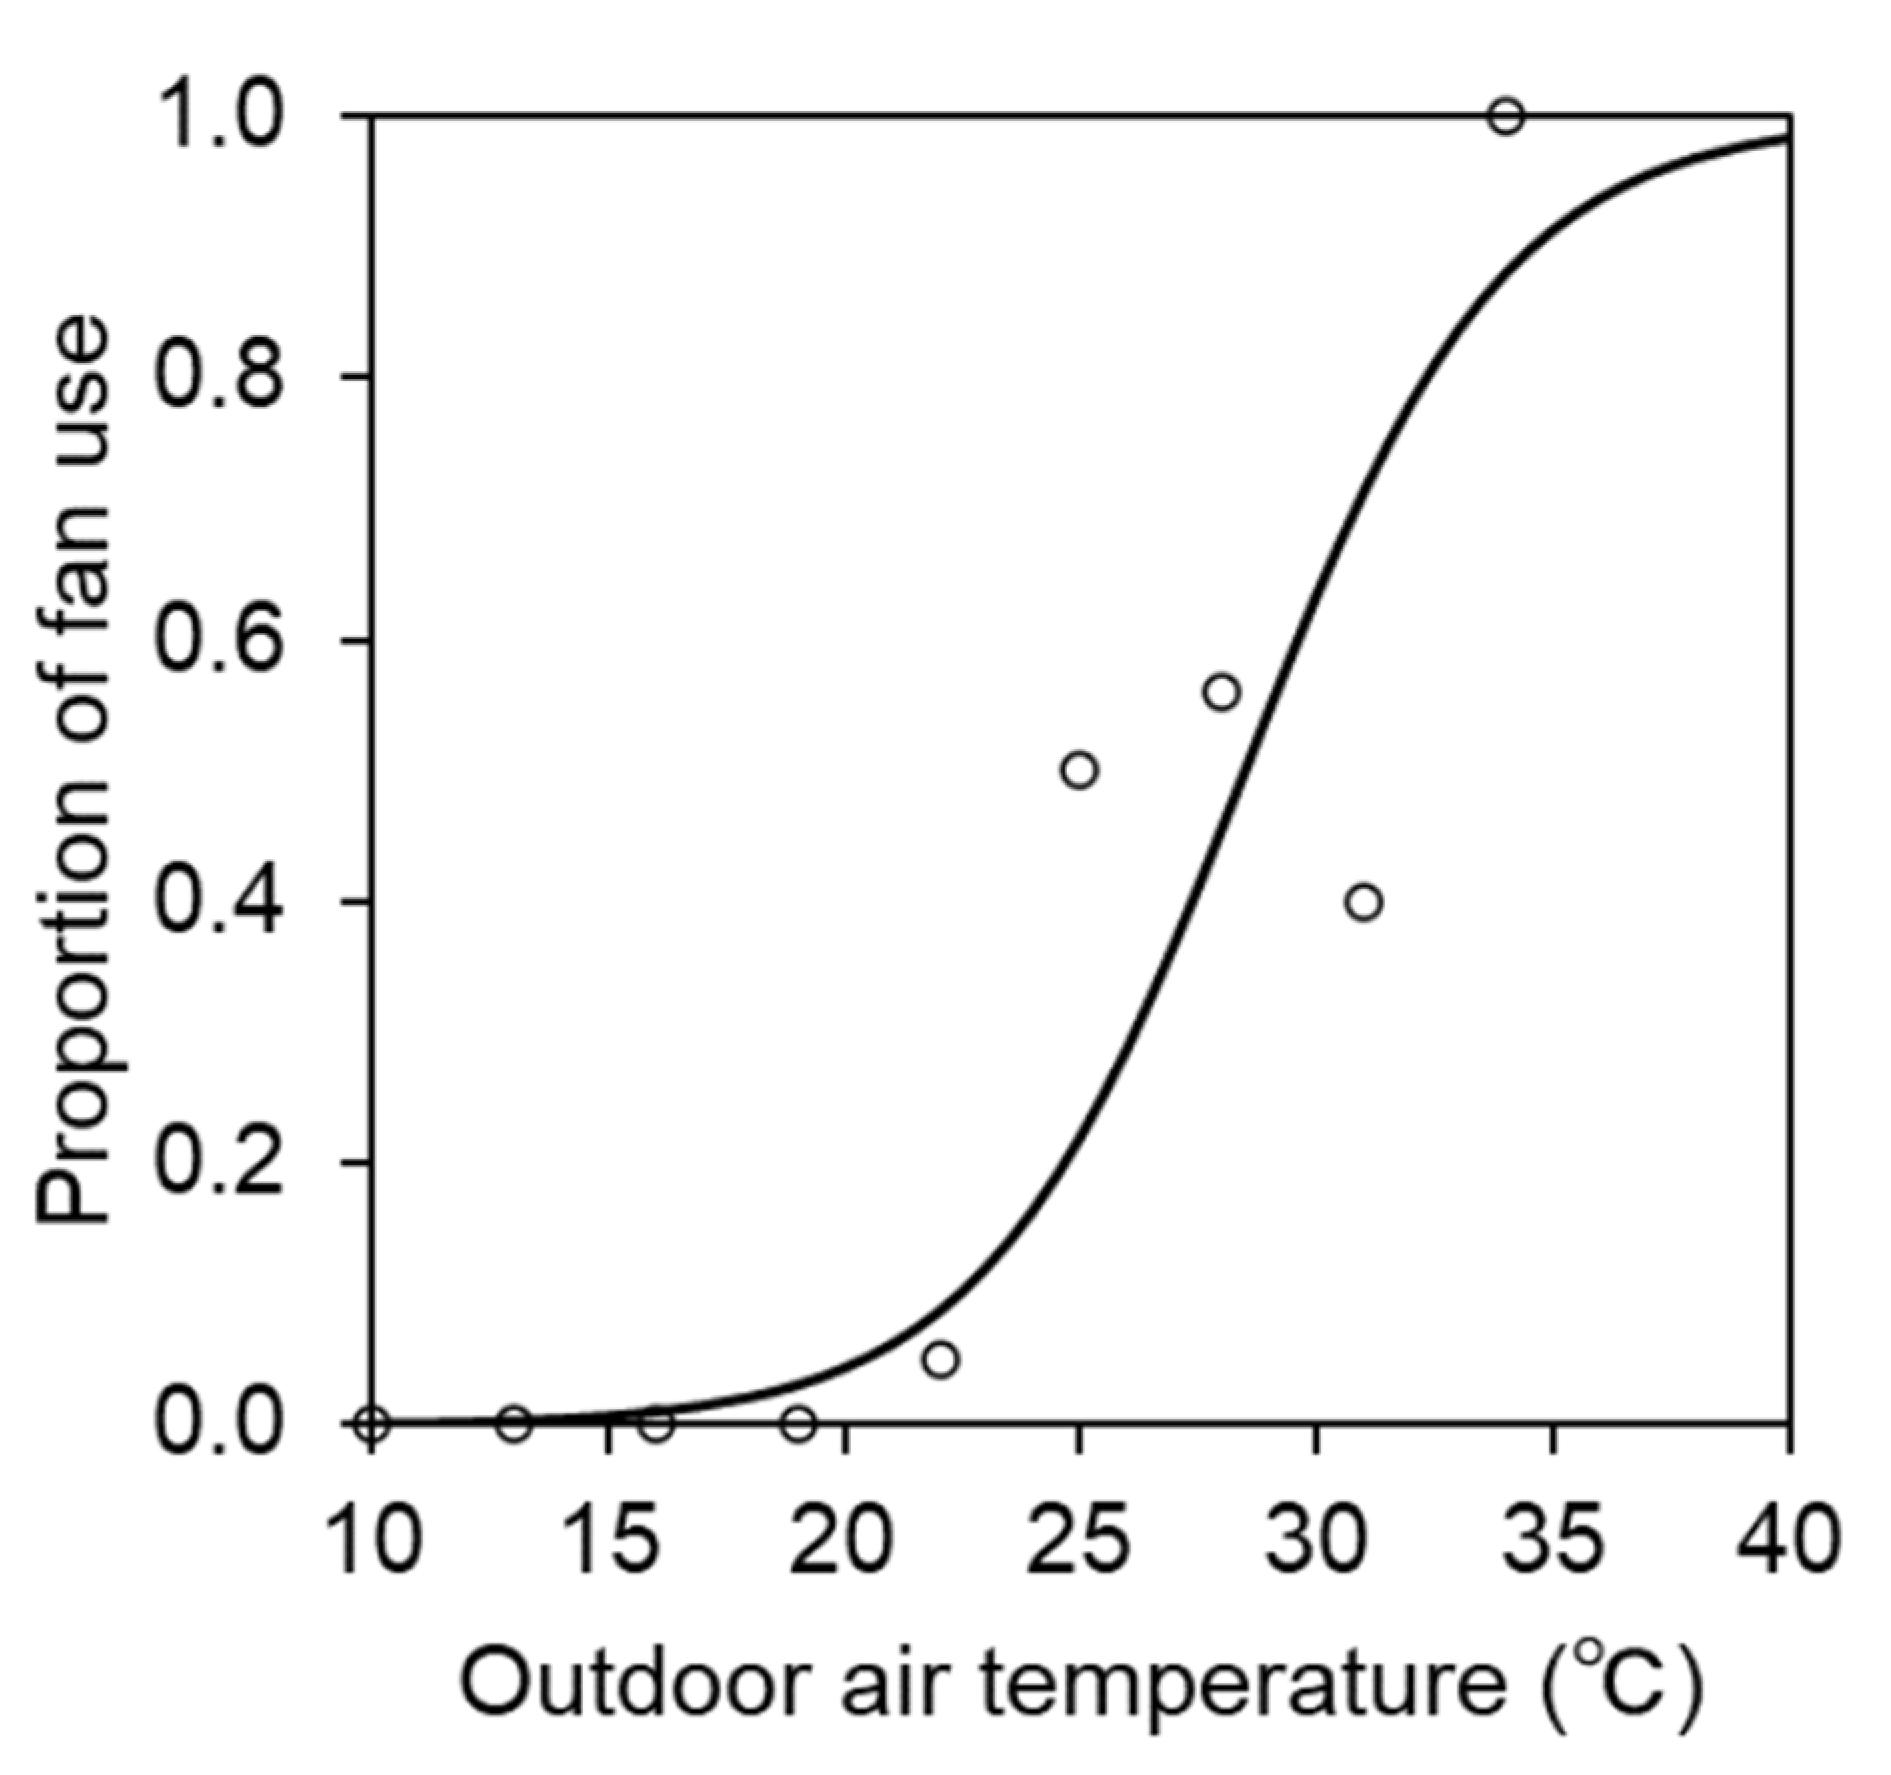
3.5.4. Window Opening Behavior and Fan Use

We focus herein on window opening behaviors and fan usage among all occupants and clarify how these behaviors are related to the outdoor air temperature using the same method as in the previous paragraph.
First, the following regression equation was derived based on the logistic regression analysis of window opening patterns, provided that the equation applies to the FR mode. The analysis was performed using only the FR mode data (among all the opened window data), because there were data cases in which the window was open for ventilation even in the CL and HT modes owing to the COVID-19 pandemic.
logit (p) = 0.205To − 3.2 (N = 398, R2* = 0.17, S.E. = 0.027, p < 0.001)
Secondly, as a result of the logistic regression analysis of fan use, the following regression equation was derived for all data.
logit (p) = 0.363To − 10.3 (N = 1047, R2* = 0.31, S.E. = 0.029, p < 0.001)
Figure 22 presents the relationship between window opening behavior and the outdoor air temperature in the FR mode. Actual data are also plotted on the graph. The percentage of opened windows increases as the outdoor air temperature rises. The regression coefficient for the cases in which windows were opened was 0.205. Conversely, the regression coefficient in the same regression was estimated to be 0.350 (0.507 in Survey 1 and 0.251 in Survey 2) in the Kanto region [27] (where five HVAC buildings and six MM buildings were surveyed) and 0.181 in the United Kingdom (UK) [46] (where seven naturally ventilated buildings and two air-conditioned buildings were surveyed). The regression coefficient of this study was close to that of the UK study [46] compared with that in the Kanto region [27]. Furthermore, the regression coefficient of this study was approximately the same as that obtained in Survey 2 in the Kanto region [27]. The mean window opening proportion in this study was 0.62, which is higher than that in the Kanto region (both Surveys 1 and 2) (0.42) [27]. All four offices surveyed in this study were MM buildings; accordingly, this may explain why the results of the UK study [46] were similar to our results. The correlation between the window opening behavior and outdoor air temperature is not as high as that between the heating/cooling usage and outdoor air temperature. However, the Gaussian regression analysis can be used for the window opening model in further studies [40].
Figure 23 presents the relationship between fan usage and the outdoor air temperature. Actual data are also plotted on the graph. Herein, the fan refers to the one installed in the workspace of the office. The proportion of fan use in offices increases as the outdoor air temperature rises. This trend is the same as that found in the previous study on Japanese dwellings [32]. Herein, the frequency of fan use was higher in the CL mode (36.7%) compared with that in the FR mode (10.2%), and three offices other than B4 used air conditioners in conjunction with fans to cool down the spaces effectively. The regression coefficient of 0.363 (in the case of the fan use) was larger compared to that derived between the window opening behavior and outdoor air temperature for the FR mode case. Although the correlation between fan usage and the outdoor air temperature was not as high as that derived between heating/cooling usage and the outdoor air temperature described in the previous subsection, the fan use proportion may be predicted to some extent by using the logistic regression equation in conjunction with the outdoor air temperature.
Further analysis is needed to improve the window opening and fan use models by collecting more data.

4. Overall Discussion

First, it was observed that both TSV and OC were lower in the HT mode than in other modes. Therefore, thermal sensation was rated to be on the colder side, and overall comfort was rated to be on the slightly uncomfortable side. The comfort temperature in the HT mode was significantly lower than those of other modes. Improving the thermal sensation and overall comfort in the HT mode is required in the surveyed office. Owing to the COVID-19 pandemic, opening the windows in the HT mode may have reduced the thermal sensation and overall comfort. Gender differences were found in both the TSV and OC cases, but constitutional differences were found only in the TSV case. Age differences were observed in both the TSV and OC cases, and the occupants in their twenties yielded lower outcomes than the other age groups. In the office buildings studied in this research, it was shown that the comfort temperature can be estimated from the running mean outdoor air temperature. The regression coefficient was slightly larger compared with that in the Kanto region in the CL and HT modes and larger compared to that in the Kanto region in the FR mode. The fact that ventilation was generated by opening the windows even when the air conditioning was on (owing to the COVID-19 pandemic) may have affected the aforedescribed results. It is suggested that there may be regional differences in the regression equations for predicting indoor comfort temperatures from outdoor air temperatures, even in Japan. Regarding the occupant behaviors, even though there was a tendency for differences between male and female behaviors adopted to experience coolness and warmth, it is interesting that there were no significant differences in the comfort temperatures between genders. Furthermore, using the logistic regression analysis, the proportions of heating/cooling use, window opening, and fan use could be estimated from the outdoor air temperature.
The objects of this study were four buildings in Nagasaki City in the Kyushu region located in the southwestern part of Japan. Nagasaki City belongs to the seventh region of current Japanese energy conservation standards (Revised Energy Conservation Standards enacted in 2016), and the same region includes Fukuoka City, Kumamoto City, and Kagoshima City, which are also representative cities of the Kyushu region and the Shizuoka Prefecture (in the Chubu region) and Kochi Prefecture (in the Shikoku region), which are located in warm climatic areas. The climates of these regions are similar, and office buildings in temperate regions are not only in the same seventh region. Other regions in Honshu Island in Japan would have similar performances, except for modern office buildings in metropolitan areas. Therefore, it is considered that the results of this survey could be applied to existing office buildings in other regional cities in temperate regions in Japan. It is thought that the knowledge obtained from this study could be applied to some extent to the modern cities of East Asian countries with climates similar to temperate regions in Japan.
The comfort temperature obtained from this study could contribute to the minimization of discomfort experienced by some workers, considering the thermal environment of the office, thereby improving productivity. However, it became clear that comfort temperature differences exist according to gender as well as differences in the constitution, such as sensitivity to heat and sensitivity to cold. Among the three modes examined, it was confirmed that there were gender and constitutional differences only in the CL mode case. Therefore, in addition to considering the diversity of workers in office buildings, it is necessary to employ nonuniform air conditioning methods (e.g., personal air conditioning systems and task/ambient air conditioning systems), combine conventional air conditioners and radiant cooling systems, and enforce various measures to improve comfort, health, and the productivity of workers, such as the mitigation of the temperature settings for air conditioning through the active use of air movements and dehumidification and by introducing activity-based workplaces. It is also important to promote the renewal of buildings with highly efficient thermal insulation performance and the renewal of air conditioning equipment with high efficiency in conventional buildings. Furthermore, predicting the occupants’ environmental adjustment behaviors based on the outdoor air temperature and encouraging them to use passive methods (instead of active methods) is useful for reducing energy consumption for space heating and cooling. The findings of this study represent one of the most important issues today—the increased seriousness of global warming and the need to reduce energy in office buildings consumed by space heating and cooling using all conceivable means while maintaining occupant comfort, health, and productivity. The adaptive model and occupant behavior model are useful for the indoor temperature control of the existing buildings and thermal simulation of the new building design.

5. Conclusions

A study on the indoor climate and thermal comfort was performed in four office buildings in the southwestern part of Japan for more than a year. The following conclusions were drawn:
  • Most occupants tended to find indoor environments comfortable. Analysis of different modes revealed that the mean comfort temperatures calculated using Griffiths’ method ranged from 23.2 to 25.9 °C. Furthermore, there were regional differences in the seasonal comfort temperature fluctuations in offices between the Kanto region and Nagasaki City in the FR mode.
  • There were significant differences in the comfort temperature among modes, but a significant difference was found only in the CL mode when comparisons were conducted based on gender and constitution. Although there were significant gender differences in thermal and comfort sensations, the mean comfort temperatures calculated for females were significantly higher than those for males by 0.4 °C only in the CL mode.
  • The results of the environmental adjustment behaviors indicated that females tend to execute more behaviors to experience warmth compared with males. The mean level of clothing insulation for males was significantly higher compared with that of females in the HT mode, although the mean clothing insulation showed no significant gender differences in the FR and CL modes.
  • It was verified that the comfort temperature in any mode varied in conjunction with the outdoor air temperature in office buildings. However, the results indicate that there may be regional differences in the regression coefficients within Japan.
  • An adaptive model was developed for the office buildings in Nagasaki City to predict the indoor comfort temperature from the outdoor air temperature. This model contributes to the predicting the comfort temperature in other cities located in areas with warm climates. A model corresponding to the local climate could be constructed for the adaptive building design.
  • Using a logistic regression analysis, we clarified how the heating/cooling use, window opening behavior, and fan use relate to the outdoor air temperature. The values of the logistic coefficients were in the order of heating/cooling usage, fan usage, and window opening behavior. It was confirmed that the heating/cooling usages were highly related to the outdoor air temperature; correspondingly, the logistic regression equation could be applied to predict the heating and cooling usage proportions based on the outdoor air temperature. It was confirmed that fan use is moderately related to the outdoor air temperature and that the window opening behavior in the FR mode is only weakly related to the outdoor air temperature; correspondingly, further analysis is needed to improve the window opening and fan use models by collecting more data.
Occupants adapt to the office environment by adopting various behaviors. A comfort temperature was attained following the execution of these environmental adjustment behaviors. In this study, no significant gender differences in comfort temperature were observed in the HT mode, although there was a significant gender difference associated with clothing insulation. Conversely, in the CL mode, a significant gender difference in comfort temperature was observed, although no significant gender differences in clothing insulation were found. These results could constitute a good example to allow occupants to adapt to their office environments. Identifying the specific comfort temperature is useful for proper air conditioning temperature settings and for productivity improvements achieved by minimizing the thermal discomfort. It is necessary to prepare various environmental adjustment methods that occupants can freely choose to achieve energy saving while satisfying thermal sensation variations. It is important to strengthen the insulation of conventional buildings and upgrade inefficient equipment. It is considered that the range of adaptation can be expanded by promoting the use of lighter clothing, thus allowing occupants to open and close windows freely and to use individual fans. In addition, adaptive models that consider the local climates can provide useful information for environmental designs that enhance human adaptation to office environments. Given the set carbon neutrality goals, it is becoming increasingly important to design spaces that maximize the adaptation of occupants to the environment and the design of facilities that use the minimum required capacity.

6. Research Limitations

This study is associated with the following limitations:
  • This field study was conducted based on monthly visits. Therefore, it will be necessary to devise a new survey method, such as combinating the existing one with a daily survey.
  • In this study, we selected four office buildings as the surveyed offices (with a high frequency of opening windows), all of which were MM. It is necessary to investigate the HVAC-mode office buildings and compare them with the MM office buildings employed in this study.
  • As the survey was conducted during the COVID-19 pandemic, it was relatively common to observe offices with windows open for ventilation during periods when air conditioning was on, even though mechanical ventilation equipment was installed. This phenomenon did not occur before the COVID-19 pandemic, and it is unclear whether the use of air conditioning practices will be restored to those used during the pre-pandemic period.
  • To predict the window opening proportion based on the outdoor air temperature, it is necessary to improve the prediction accuracy by collecting more data from the office buildings.

Author Contributions

Funding acquisition, project administration, investigation, formal analysis, writing—original draft, writing—review & editing K.G.; investigation, formal analysis, writing—original draft, H.N. and M.O.; funding acquisition, methodology, project administration, validation, writing—review & editing H.I.; funding acquisition, project administration, validation, writing—review & editing T.U., T.S., H.T. and T.N.; funding acquisition, project administration, writing—review & editing K.T., D.N., K.H. and T.M.; conceptualization, funding acquisition, methodology, project administration, supervision, writing—review & editing, H.B.R. All authors have read and agreed to the published version of the manuscript.

Funding

This research was supported by the Grant-in-Aid for Scientific Research (B) (21H01496) from the Japan Society for the Promotion of Science (JSPS).

Data Availability Statement

The data presented in this study are available on request from the corresponding author.

Acknowledgments

The authors thank all survey participants, PAL Co., Ltd., and Nagasaki University.

Conflicts of Interest

The authors declare no conflict of interest.

Appendix A

Figure A1. Questionnaire sheet used for the monthly thermal comfort survey in the offices: (a) front and (b) back.
Energies 16 06060 g0a1aEnergies 16 06060 g0a1b

References

  1. de Dear, R.J.; Brager, G.S. Thermal comfort in naturally ventilated buildings: Revisions to ASHRAE Standard 55. Energy Build. 2002, 34, 549–561. [Google Scholar] [CrossRef]
  2. Lamsal, P.; Bajracharya, S.B.; Rijal, H.B. A review on adaptive thermal comfort of office building for energy-saving building design. Energies 2023, 16, 1524. [Google Scholar] [CrossRef]
  3. The Institute of Energy Economics. Handbook of Japan’s & World Energy & Economic Statistics; The Energy Conservation Center: Tokyo, Japan, 2017; ISBN 9784879734648. [Google Scholar]
  4. Tanabe, S.; Iwahashi, Y.; Tsushima, S.; Nishihara, N. Thermal comfort and productivity in offices under mandatory electricity savings after the Great East Japan earthquake. Arch. Sci. Rev. 2013, 56, 4–13. [Google Scholar] [CrossRef]
  5. Seppanen, O.; Fisk, W.J.; Faulkner, D. Control of Temperature for Health and Productivity in Offices; Lawrence Berkeley National Laboratory: Berkley, CA, USA, 2004; LBNL-55448. [Google Scholar]
  6. Tanabe, S.; Haneda, M.; Nishihara, N. Workplace productivity and individual thermal satisfaction. Build. Environ. 2015, 91, 42–50. [Google Scholar] [CrossRef]
  7. Nakano, J.; Tanabe, S.; Kimura, K. Differences in perception of indoor environment between Japanese and non-Japanese workers. Energy Build. 2002, 34, 615–621. [Google Scholar] [CrossRef]
  8. Indraganti, M.; Ooka, R.; Rijal, H.B. Thermal comfort in offices in summer: Findings from a field study under the ‘setsuden’ conditions in Tokyo, Japan. Build. Environ. 2013, 61, 114–132. [Google Scholar] [CrossRef]
  9. Indraganti, M.; Ooka, R.; Rijal, H.B.; Brager, G.S. Adaptive model of thermal comfort for offices in hot and humid climates of India. Build. Environ. 2014, 74, 39–53. [Google Scholar] [CrossRef]
  10. Dhaka, S.; Mathur, J.; Brager, G. Assessment of thermal environmental conditions and quantification of thermal adaptation in naturally ventilated buildings in composite climate of India. Build. Environ. 2015, 86, 17–28. [Google Scholar] [CrossRef]
  11. Dhaka, S.; Mathur, J. Quantification of thermal adaptation in air-conditioned buildings of composite climate, India. Build. Environ. 2017, 112, 296–307. [Google Scholar] [CrossRef]
  12. Singh, M.K.; Ooka, R.; Rijal, H.B.; Takasu, M. Adaptive thermal comfort in the offices of North-East India in autumn season. Build. Environ. 2017, 124, 14–30. [Google Scholar] [CrossRef]
  13. Thapa, S.; Bansal, A.K.; Panda, G.K. Thermal comfort in naturally ventilated office buildings in cold and cloudy climate of Darjeeling, India—An adaptive approach. Energy Build. 2018, 160, 44–60. [Google Scholar] [CrossRef]
  14. Manu, S.; Shukla, Y.; Rawal, R.; Thomas, L.E.; de Dear, R. Field studies of thermal comfort across multiple climate zones for the subcontinent: India Model for Adaptive Comfort (IMAC). Build. Environ. 2016, 98, 55–70. [Google Scholar] [CrossRef]
  15. Damiati, S.A.; Zaki, S.A.; Rijal, H.B.; Wonorahardjo, S. Field study on adaptive thermal comfort in office buildings in Malaysia, Indonesia, Singapore, and Japan during hot and humid season. Build. Environ. 2016, 109, 208–223. [Google Scholar] [CrossRef]
  16. Karyono, T.H. Report on thermal comfort and building energy studies in Jakarta—Indonesia. Build. Environ. 2000, 35, 77–90. [Google Scholar] [CrossRef]
  17. de Dear, R.J.; Leow, K.G.; Foo, S.C. Thermal comfort in the humid tropics: Field experiments in air conditioned and naturally ventilated buildings in Singapore. Int. J. Biometeorol. 1991, 34, 259–265. [Google Scholar] [CrossRef]
  18. Wu, Z.; Li, N.; Wargocki, P.; Peng, J.; Li, J.; Cui, H. Field study on thermal comfort and energy saving potential in 11 split air-conditioned office buildings in Changsha, China. Energy 2019, 182, 471–482. [Google Scholar] [CrossRef]
  19. Barbadilla-Martín, E.; Lissén, J.M.S.; Martín, J.G.; Aparicio-Ruiz, P.; Brotas, L. Field study on adaptive thermal comfort in mixed mode office buildings in southwestern area of Spain. Build. Environ. 2017, 123, 163–175. [Google Scholar] [CrossRef]
  20. Rupp, R.F.; de Dear, R.; Ghisi, E. Field study of mixed-mode office buildings in Southern Brazil using an adaptive thermal comfort framework. Energy Build. 2018, 158, 1475–1486. [Google Scholar] [CrossRef]
  21. Goto, T.; Mitamura, T.; Yoshino, H.; Tamura, A.; Inomata, E. Long-term field survey on thermal adaptation in office buildings in Japan. Build. Environ. 2007, 42, 3944–3954. [Google Scholar] [CrossRef]
  22. Mustapa, M.S.; Zaki, S.A.; Rijal, H.B.; Hagishima, A.; Ali, M.S. Thermal comfort and occupant adaptive behaviour in Japanese university buildings with free running and cooling mode offices during summer. Build. Environ. 2016, 105, 332–342. [Google Scholar] [CrossRef]
  23. Rijal, H.B.; Humphreys, M.A.; Nicol, J.F. Towards an adaptive model for thermal comfort in Japanese offices. Build. Res. Inf. 2017, 45, 717–729. [Google Scholar] [CrossRef]
  24. Takasu, M.; Ooka, R.; Rijal, H.B.; Indraganti, M.; Singh, M.K. Study on adaptive thermal comfort in Japanese offices under various operation modes. Build. Environ. 2017, 118, 273–288. [Google Scholar] [CrossRef]
  25. Khadka, S.; Rijal, H.B.; Amano, K.; Saito, T.; Imagawa, H.; Uno, T.; Genjo, K.; Takata, H.; Tsuzuki, K.; Nakaya, T.; et al. Study on winter comfort temperature in mixed mode and HVAC office buildings in Japan. Energies 2022, 15, 7331. [Google Scholar] [CrossRef]
  26. Khadka, S.; Shrestha, M.; Rijal, H.B. Investigation of the thermal comfort and productivity in Japanese mixed-mode office buildings. J. Eng. Res. 2022, 19, 63–72. [Google Scholar] [CrossRef]
  27. Rijal, H.B.; Humphreys, M.A.; Nicol, J.F. Adaptive approaches to enhancing resilient thermal comfort in Japanese offices. In The Routledge Handbook of Resilient Thermal Comfort; Nicol, J.F., Rijal, H.B., Roaf, S., Eds.; Routledge: London, UK, 2022; Chapter 17; pp. 279–299. ISBN 9781032155975. [Google Scholar]
  28. Peel, M.C.; Finlayson, B.L.; McMahon, T.A. Updated world map of the Köppen-Geiger climate classification. Hydrol. Earth Syst. Sci. 2007, 11, 1633–1644. [Google Scholar] [CrossRef]
  29. Japan Meteorological Agency: Historical Weather Data Search. Available online: https://www.data.jma.go.jp/obd/stats/etrn/index.php (accessed on 3 June 2023).
  30. ISO 7726:1998; Ergonomics of the Thermal Environment—Instruments for Measuring Physical Quantities. International Standardization Organization: Geneva, Switzerland, 1998.
  31. ANSI/ASHRAE Standard 55-2020; Thermal Environmental Conditions for Human Occupancy. American Society of Heating, Refrigerating and Air-Conditioning Engineers: Atlanta, GA, USA, 2020.
  32. Imagawa, H.; Rijal, H.B.; Shukuya, M. Development of integrated occupant-behavioural stochastic model including the fan use in Japanese dwellings. Energy Build. 2020, 226, 110326. [Google Scholar] [CrossRef]
  33. D’Ambrosio Alfano, F.R.; Dell’Isola, M.; Ficco, G.; Palella, B.I.; Riccio, G. Small globes and pocket heat stress meters for WBGT and PHS evaluations. A critical analysis under controlled conditions. Build. Environ. 2022, 226, 109781. [Google Scholar] [CrossRef]
  34. D’Ambrosio Alfano, F.R.; Dell’Isola, M.; Ficco, G.; Palella, B.I.; Riccio, G. On the measurement of the mean radiant temperature by means of globes: An experimental investigation under black enclosure conditions. Build. Environ. 2021, 193, 107655. [Google Scholar] [CrossRef]
  35. Spagnolo, J.; de Dear, R. A field study of thermal comfort in outdoor and semi-outdoor environments in subtropical Sydney Australia. Build. Environ. 2021, 38, 721–738. [Google Scholar] [CrossRef]
  36. Humphreys, M.A. Outdoor temperatures and comfort indoors. Build. Res. Pract. 1978, 6, 92–105. [Google Scholar] [CrossRef]
  37. Humphreys, M.A.; Rijal, H.B.; Nicol, J.F. Updating the adaptive relation between climate and comfort indoors; New insights and an extended database. Build. Environ. 2013, 63, 40–55. [Google Scholar] [CrossRef]
  38. McCartney, K.J.; Nicol, J.F. Developing an adaptive control algorithm for Europe. Energy Build. 2002, 34, 623–635. [Google Scholar] [CrossRef]
  39. Nicol, J.F.; Humphreys, M.A. A stochastic approach to thermal comfort occupant behavior and energy use in buildings. ASHRAE Trans. 2004, 110, 554–568. [Google Scholar]
  40. Rijal, H.B.; Humphreys, M.A.; Nicol, J.F. Behavioural adaptation for the thermal comfort and energy saving in Japanese offices. J. Inst. Eng. 2019, 15, 14–25. [Google Scholar] [CrossRef]
  41. Fanger, P.O. ; Thermal Comfort, Analysis and Applications in Environmental Engineering; Danish Technical Press: Copenhagen, Denmark, 1970. [Google Scholar]
  42. Ayesha, A.; Muhammad, Z.; Khan, S.R.; Sohail, N.F. Investigating the gender differences in indoor thermal comfort perception for summer and winter seasons and comparison of comfort temperature prediction methods. J. Therm. Biol. 2022, 110, 103357. [Google Scholar] [CrossRef]
  43. CIBSE Guide A: Environmental Design; Chartered Institution of Building Services Engineers: London, UK, 2006.
  44. CEN-EN16798-1; Energy Performance of Buildings—Ventilation for Buildings—Part 1: Indoor Environmental Input Parameters for Design and Assessment of Energy Performance of Buildings Addressing Indoor Air Quality, Thermal Environment, Lighting and Acoustics—Module M1-6. European Committee for Standardization: Brussels, Belgium, 2019.
  45. Shahzad, S.; Rijal, H.B. Chapter 20: Mixed mode is better than air-conditioned offices for resilient comfort: Adaptive behaviour and visual thermal landscaping. In Routledge Handbook of Resilient Thermal Comfort; Nicol, F., Rijal, H.B., Roaf, S., Eds.; Routledge: London, UK, 2022; pp. 329–346. ISBN 9781032155975. [Google Scholar]
  46. Rijal, H.B.; Tuohy, P.; Humphreys, M.A.; Nicol, J.F.; Samuel, A.; Clarke, J. Using results from field surveys to predict the effect of open windows on thermal comfort and energy use in buildings. Energy Build. 2007, 39, 823–836. [Google Scholar] [CrossRef]
Figure 1. Nagasaki, Japan: (a) location and (b) monthly mean outdoor air temperature, relative humidity, and horizontal global solar radiation in Nagasaki during the survey period (July 2021–July 2022) [29].
Energies 16 06060 g001
Figure 2. External views of the four office buildings surveyed in this study: (a) B1, (b) B2, (c) B3, and (d) B4.
Energies 16 06060 g002
Figure 3. Measuring instrument and thermal comfort survey: (a) instruments and respondents and (b) instruments.
Energies 16 06060 g003
Figure 4. Monthly mode classifications for the studied office buildings. Note: * indicates that the mode varies depending on the department.
Energies 16 06060 g004
Figure 5. Variation in the thermal sensation votes categorized based on the mode.
Energies 16 06060 g005
Figure 6. Variation of thermal sensation votes categorized by gender.
Energies 16 06060 g006
Figure 7. Variation in the thermal sensation votes categorized based on the constitution.
Energies 16 06060 g007
Figure 8. Variation in the overall comfort votes categorized based on the mode.
Energies 16 06060 g008
Figure 9. Variation in the overall comfort votes categorized by gender.
Energies 16 06060 g009
Figure 10. Variation in the overall comfort votes categorized based on the constitution.
Energies 16 06060 g010
Figure 11. Relation between the thermal sensation vote and indoor globe temperature in each studied mode.
Energies 16 06060 g011
Figure 12. Mean comfort temperature with 95% confidence intervals (mean ± 2S.E.) calculated based on the mode (** p < 0.001).
Energies 16 06060 g012
Figure 13. Mean comfort temperatures calculated according to gender for all studied modes (** p < 0.01).
Energies 16 06060 g013
Figure 14. Mean comfort temperatures calculated according to the constitution for all studied modes (** p < 0.01).
Energies 16 06060 g014
Figure 15. Fluctuation in the mean comfort temperature with 95% confidence intervals (mean ± 2S.E.) for each calendar month in the FR mode.
Energies 16 06060 g015
Figure 16. Fluctuation in the average comfort temperature with 95% confidence intervals (mean ± 2S.E.) for each season in the FR mode.
Energies 16 06060 g016
Figure 17. Relationships between the indoor comfort temperature and the running mean outdoor air temperature: (a) the FR mode and (b) the CL and HT modes.
Energies 16 06060 g017
Figure 18. Mean values of environmental adjustment behaviors adopted to experience coolness and calculated according to gender: (a) males and (b) females.
Energies 16 06060 g018
Figure 19. Mean values of environmental adjustment behaviors adopted to experience warmth and calculated according to gender: (a) males and (b) females.
Energies 16 06060 g019
Figure 20. Mean clothing insulation with 95% confidence intervals (mean ± 2S.E.) calculated according to gender for all studied modes (*** p < 0.001).
Energies 16 06060 g020
Figure 21. Relationship between heating (or cooling) use and the outdoor air temperature: (a) heating and (b) cooling use.
Energies 16 06060 g021
Figure 22. Relationship between the window opening behavior and outdoor air temperature in the FR mode.
Energies 16 06060 g022
Figure 23. Relationship between fan use and the outdoor air temperature.
Energies 16 06060 g023
Table 1. Outdoor, indoor, and comfort temperatures obtained from different field surveys on offices in various countries other than Japan.
CountryCity NameReferencesNumber of BuildingsModeSurvey
Period
Variables for TcTg, Ta (°C)Tc
(°C)
IndiaChennaiIndraganti et al. [8]13
13
NV
CL
Summer
Summer
Tg
Tg
30.1
26.9
27.6 ***
27.0 ***
Hyderabad12
12
NV
CL
Summer
Summer
Tg
Tg
29.4
26.0
28.1 ***
26.1 ***
Chennai, HyderabadIndraganti et al. [9]28
28
NV
CL
Summer
Summer
Tg
Tg
28.8
26.2
28.0 ***
26.4 ***
JaipurDhaka et al. [10]30NVWinter
Autumn
Summer
Tg
Tg
Tg
21.8
29.0
31.9
25.6
27.0
29.4
JaipurDhaka and Mathur [11]19CLSummerTa26.027.5
Tezpur, ShillongSingh et al. [12]24NVAutumnTg27.927.3 **
DarjeelingThapa et al. [13]3NVSummerTa21.721.8 ***
ModerateTa19.320.5 ***
WinterTa16.317.6 ***
IndiaManu et al. [14]16NVSummer
Winter
Top
Top
29.6
22.8
25.7
23.7
CL
HT
Summer
Winter
Top
Top
24.7
25.5
25.3
25.1
MM
FR
Summer
Winter
Top
Top
30.2
21.8
25.7
23.9
IndonesiaBandungDamiati et al. [15]3FR
MM
Summer
Summer
Top
Top
26.7
27.1
24.7 ***
27.5 ***
JakartaKaryono [16]7MMSummerTop27.226.7 **
SingaporeSingaporeDamiati et al. [15]2CLSummerTop23.226.4 ***
Singaporede Dear et al. [17]12CLSummerTop22.924.2
MalaysiaKuala LumpurDamiati et al. [15]4CLSummerTop24.425.6 ***
ChinaChangshaWu et al. [18]11MMSummerTop26.926.7 *
SpainSevilleBarbadilla-Martin et al. [19]3MMSummerTop23.523.6
BrazilFlorianopolisRupp et al. [20]3NV
HT
All
All
Top
Top
23.4
24.0
23.4 ***
24.3 ***
Note: * preferred SET, ** regression and Griffiths method, *** comfort temperature calculated using Griffiths’ method, FR: free running, NV: naturally ventilated, CL: cooling, HT: heating, MM: mixed-mode, Tg: globe temperature, Top: operative temperature, Ta: indoor air temperature.
Table 2. Outdoor, indoor, and comfort temperatures obtained from different field surveys on offices in Japan.
City NameReferencesNumber of BuildingsModeSurvey
Period
Variables
for Tc
Tg, Ta (°C)Tc (°C)
Sendai, Tsukuba, and YokohamaGoto et al. [21]6FR
CL
HT
AllSET24.726.0 *
TokyoIndraganti et al. [8]4NV
CL
Summer
Summer
Top
Top
29.4
27.9
25.8 ***
27.2 ***
Yokohama and TokyoDamiati et al. [15]4FR
CL
Autumn
Summer
Top
Top
26.5
25.9
25.8 ***
25.8 ***
FukuokaMustapa et al. [22]4FR
CL
Summer
Summer
Tg
Tg
28.1 26.426.7 ***
26.6 ***
Tokyo and YokohamaRijal et al. [23]11FRSpring
Summer
Autumn
Tg
Tg
Tg
24.5
25.8
24.8
24.2 ***
25.7 ***
24.9 ***
CLSpring
Summer
Autumn
Tg
Tg
Tg
25.5
26.0
25.9
25.1 ***
25.5 ***
25.4 ***
HTSpring
Autumn
Winter
Tg
Tg
Tg
24.3
24.0
23.6
24.5 ***
24.2 ***
24.3 ***
Tokyo and KanagawaTakasu et al. [24]5MM
FR
ALLSET
SET
27.8
27.3
25.0 ***
24.3 ***
AichiKhadka et al. [25]7MM
HVAC
WinterTi24.5
24.3
25.0 ***
24.8 ***
Tokyo, Yokohama,
and Odawara
Khadka et al. [26]17MMSpring
Summer
Autumn
Winter
Tg25.0
26.3
24.9
22.7
24 **
FRSpring
Summer
Autumn
Winter
Tg25.4
26.1
24.6
22.9
23 **
Note: * preferred SET, ** optimum temperature for productivity, *** comfort temperature calculated using Griffiths’ method.
Table 3. Outline of the surveyed buildings.
OfficeConstruction YearFaçadesOrientation of
Windows
Percentage of Glazing (%)Surveyed Floor
(Number of Stories)
Number
of Responses
B11966ConcreteNE, SE, SW, NW33.6Fifth (six stories)90
B21967ConcreteN, E, S, W27.3First (six stories)223
B31970ConcreteN, E, S, W37.7Third (third stories)290
B41965BrickNE, SE, SW, NW21.7Third and fifth
(five stories)
444
Note: NE: northeast, SE: southeast, SW: southwest, NW: northwest, N: north, E: east, S: south, W: west.
Table 4. Contents of the questionnaire used in the thermal comfort survey.
CategoryQuestioned Contents
Thermal comfortThermal sensation, thermal preference, thermal acceptability, humidity sensation, humidity preference, air movement sensation, overall comfort, and sweat sensation
ActivityActivity in the last 15 min
Environmental controlPersonal fan use, personal heater use
Occupant behaviorEnvironmental adjustment behavior performed by them 15 min before the survey to experience coolness and warmth
ClothingType, thickness, and length of the clothes (top and bottom) worn and types of underwear, footwear, and accessories worn
Table 5. Scales used for the thermal comfort survey.
ScaleThermal Sensation Vote Overall Comfort Vote
1Very coldVery uncomfortable
2ColdUncomfortable
3Slightly coldSlightly uncomfortable
4Neutral (Neither hot nor cold)Slightly comfortable
5Slightly hotComfortable
6HotVery comfortable
7Very hot
Table 6. Outline of the measuring instruments used.
Measurement ItemMeasuring
Instrument
Accuracy
Temperature
Relative humidity
Carbon dioxide concentration
TR-76Ui±0.5 °C
±5%
±50 ppm ± 5% of indicated value
Globe temperatureRTW-31S
Matte black painted 75 mm diameter copper ball
±0.3 °C
Air velocityModel 6501
Probe (6543-21)
0.01–0.09 m/s: ±0.02 m/s
1.00–5.00 m/s: ±2% of the indicated value or ±0.02 m/s, whichever is greater
Illumination
Air temperature
Relative humidity
TR-74UiIllumination: ±5%
Air temperature: ±0.3 °C
Relative humidity: ±5%
Table 7. The number of votes for each mode classified based on gender and constitution.
ModeTotalGenderConstitution
MaleFemaleSensitive to HeatNeitherSensitive to Cold
FR3982241749814386
CL38422615811112288
HT265139126638772
Table 8. Results of the PMV (mean ± standard deviation) classified by mode, gender, and constitution.
ModeGenderConstitution
FRCLHTMaleFemaleSensitive to HeatNeitherSensitive to Cold
0.25 ± 0.690.35 ± 0.58–0.04 ± 0.690.24 ± 0.600.17 ± 0.750.20 ± 0.660.19 ± 0.670.22 ± 0.71
Disclaimer/Publisher’s Note: The statements, opinions and data contained in all publications are solely those of the individual author(s) and contributor(s) and not of MDPI and/or the editor(s). MDPI and/or the editor(s) disclaim responsibility for any injury to people or property resulting from any ideas, methods, instructions or products referred to in the content.

