Article

Analyzing the Impact of Renewable Energy and Green Innovation on Carbon Emissions in the MENA Region

by
Abdullah Albaker
1,
Kashif Raza Abbasi
2,3,
Akram Masoud Haddad
4,
Magdalena Radulescu
5,6,*,
Catalin Manescu
7 and
Georgiana Tatiana Bondac
8
1
Department of Electrical Engineering, College of Engineering, University of Ha’il, Ha’il 81451, Saudi Arabia
2
Department of Business Administration, Faculty of Management Sciences, ILMA University, Karachi 75190, Pakistan
3
Faculty of Economics, Administrative and Social Sciences, Nisantasi University, Istanbul, Turkey
4
Economics Program, Humanities, Arts and Applied Sciences, Amity University Dubai (AUD), Dubai P.O. Box 345019, United Arab Emirates
5
Department of Finance, Accounting and Economics, University of Pitesti, 110040 Pitesti, Romania
6
Institute of Doctoral and Post-Doctoral Studies, University Lucian Blaga of Sibiu, Bd. Victoriei, No. 10, 550024 Sibiu, Romania
7
Academy of Economic Studies, Str. Mihail Moxa, No. 5-7, 010374 Bucharest, Romania
8
Departament of Management-Marketing, Valahia University of Târgoviște, Sinaia Street, No. 13, 130005 Târgoviște, Romania
*
Author to whom correspondence should be addressed.
Energies 2023, 16(16), 6053; https://doi.org/10.3390/en16166053
Submission received: 21 June 2023 / Revised: 10 August 2023 / Accepted: 14 August 2023 / Published: 18 August 2023

Abstract

:
The rising carbon dioxide emissions from the MENA region constitute a severe danger to the environment, public health, and the execution of the United Nations SDGs. Substantial steps are required to solve this problem and maintain the region’s sustainable future. Hence, the current study focused on distinct factors, including renewable energy, energy intensity, green innovation, GDP, and CO2 emissions from 1990 to 2021. The research determines the multifarious variables in various quantiles, including the novel Method of Moments Quantile Regression (MMQR) approach, Fully Modified Ordinary Least Square (FM-OLS), Dynamic Ordinary Least Square (D-OLS) and Driscoll-Kraay Standard Errors (DKS) applied. The findings reveal that renewable energy significantly reduces carbon emissions in all quantiles, while energy intensity, green innovation, and GDP lead to carbon emissions in lower, middle, and upper quantiles. For robust outcome confirmed by FM-OLS, D-OLS, and DKS methods. Also, Granger heterogeneous causality applied that confirmed the bidirectional causality among the variables. The study’s findings imply that authorities should emphasize the emergence of renewable energy and green innovation while adopting energy-efficient technologies to minimize carbon emissions and accomplish SDGs 7, 9, and 13 to secure the MENA region.

1. Introduction

The MENA region has long been recognized for its massive oil and gas deposits, which have historically supported economic evolution and development. However, their reliance on fossil fuels has resulted in substantial carbon emissions, which contribute to global climate change [1]. In recent years, MENA nations have started to grasp the critical need to transition to greener and low-carbon economies, both for environmental grounds and to diversify their energy mix and lessen their reliance on unpredictable oil and gas souks.
The problem of carbon pollution in the MENA region is crucial to attaining the region’s sustainable development goals (SDGs). MENA nations’ substantial amounts of atmospheric carbon are leading to planetary global warming, which has serious ramifications for the environment, economy, and humanity [2]. Escalating sea levels, severe storms, and water shortages are all potential repercussions of climate change for the region’s environments, biodiversity, and populace. In addition, the MENA region’s reliance on petroleum and gasoline renders it subject to swings in global energy markets, which may destabilize regional economies and neighborhoods. MENA nations must transition to environmentally friendly and carbon-free economies to solve these difficulties and attain the SDGs in this region. This will need a mix of legislative and technological solutions that encourage renewable energy, energy efficiency, and environmentally sound land use policies. MENA nations may assist in lessening the effects of climate change and develop healthier and affluent communities by taking measures to cut carbon releases and shift to a more ecologically friendly future [3].
To cope with this, lately, COP27 conferences have strived to build global agreements and frameworks to combat climate change and cut carbon emissions. MENA nations may help achieve these objectives by taking meaningful steps to cut carbon emissions and transition to more sustainable, low-carbon economies. MENA nations may make great progress in reducing carbon emissions and meeting the objectives of COP 27 by taking these and other steps.
To determine the study’s gap, this study reviewed the available literature on carbon emissions in MENA nations. Various studies [4,5,6,7] have focused on the causes and consequences of carbon emissions in the area, while others [8,9,10,11] have explored the policy and technical solutions being sought to cut emissions. For example, ref. [12] probed the effect of ED, EC, and trade openness (TO) on carbon emanations in MENA states. The research found that economic development and energy consumption were the primary drivers of emissions in the area and that TO has an adverse effect on emissions. However, the research did not look at the precise policy or technology options being sought to cut emissions. Further, ref. [13] investigated renewable energy (RE) to decrease carbon emissions in Saudi Arabia. According to the report, boosting the percentage of RE in the country’s energy mix may dramatically cut emissions and improve air quality. However, the research did not investigate the larger consequences of cutting carbon emissions for the environment, economy, and society in Saudi Arabia. Ref. [14] stated the primary causes of pollution in the area are energy usage and economic expansion. Ref. [15] highlighted that to diminish the effects of climate change on the state of resource accessibility, particularly their limited water resources, the MENA area must modify its energy mix. Ref. [16] demonstrated unidirectional causation from EC to CO2 emissions with no feedback impacts, while the area overall had a bidirectional causal bond between GDP and the release of CO2. According to [3], the MENA nations’ FD and RE spheres are still underperforming in terms of contributing to both environmental and economic development. Ref. [17] revealed that investment from abroad and electricity use have aggravated pollution in most MENA nations. These and other research give important insights into the motivations, consequences, and possible solutions for lowering carbon emissions in MENA nations. However, much remains to be discovered about the unique problems and possibilities that individual nations in the area face, as well as the larger implications of decreasing emissions for sustainable development.
Given this fact, rapid economic expansion and carbon dioxide emissions have put the MENA area at a crossroads. This worrying trend threatens the region’s sensitive ecosystems and the SDGs. Climate change and sustainable development must be addressed in MENA. Climate change, air pollution, and environmental degradation are threatened by rising MENA carbon emissions. The region’s SDGs, a worldwide call to action to end poverty, protect the planet, and provide prosperity for all, are also hampered by these emissions [18]. Understanding carbon emissions, economic progress, and sustainability is complicated [19]. MENA’s unique difficulties and prospects make this research crucial. Its tremendous solar resources, wide desert territory, and expanding population need creative, context-specific solutions to balance economic growth and environmental protection [20]. The research examines renewable energy adoption, energy efficiency, and green innovation to help policymakers and stakeholders negotiate this transition. This research seeks to equip decision-makers with the knowledge needed to mitigate rising carbon emissions and propel the MENA region toward a sustainable, prosperous, and resilient future.
With the motivation of the above discussion this research can add to this body of knowledge by delving further into these topics and bringing new perspectives to authorities as follows: (1) Based on this examination of the literature, this research fills a vacuum by providing a more thorough analysis of the policy and technology options being explored to cut carbon emissions in MENA nations, as well as their larger implications for the region’s sustainable development. (2) Our research specifically evaluates the efficacy of various policy initiatives by analyzing distinct factors such as renewable energy, energy intensity, green innovation, GDP, and CO
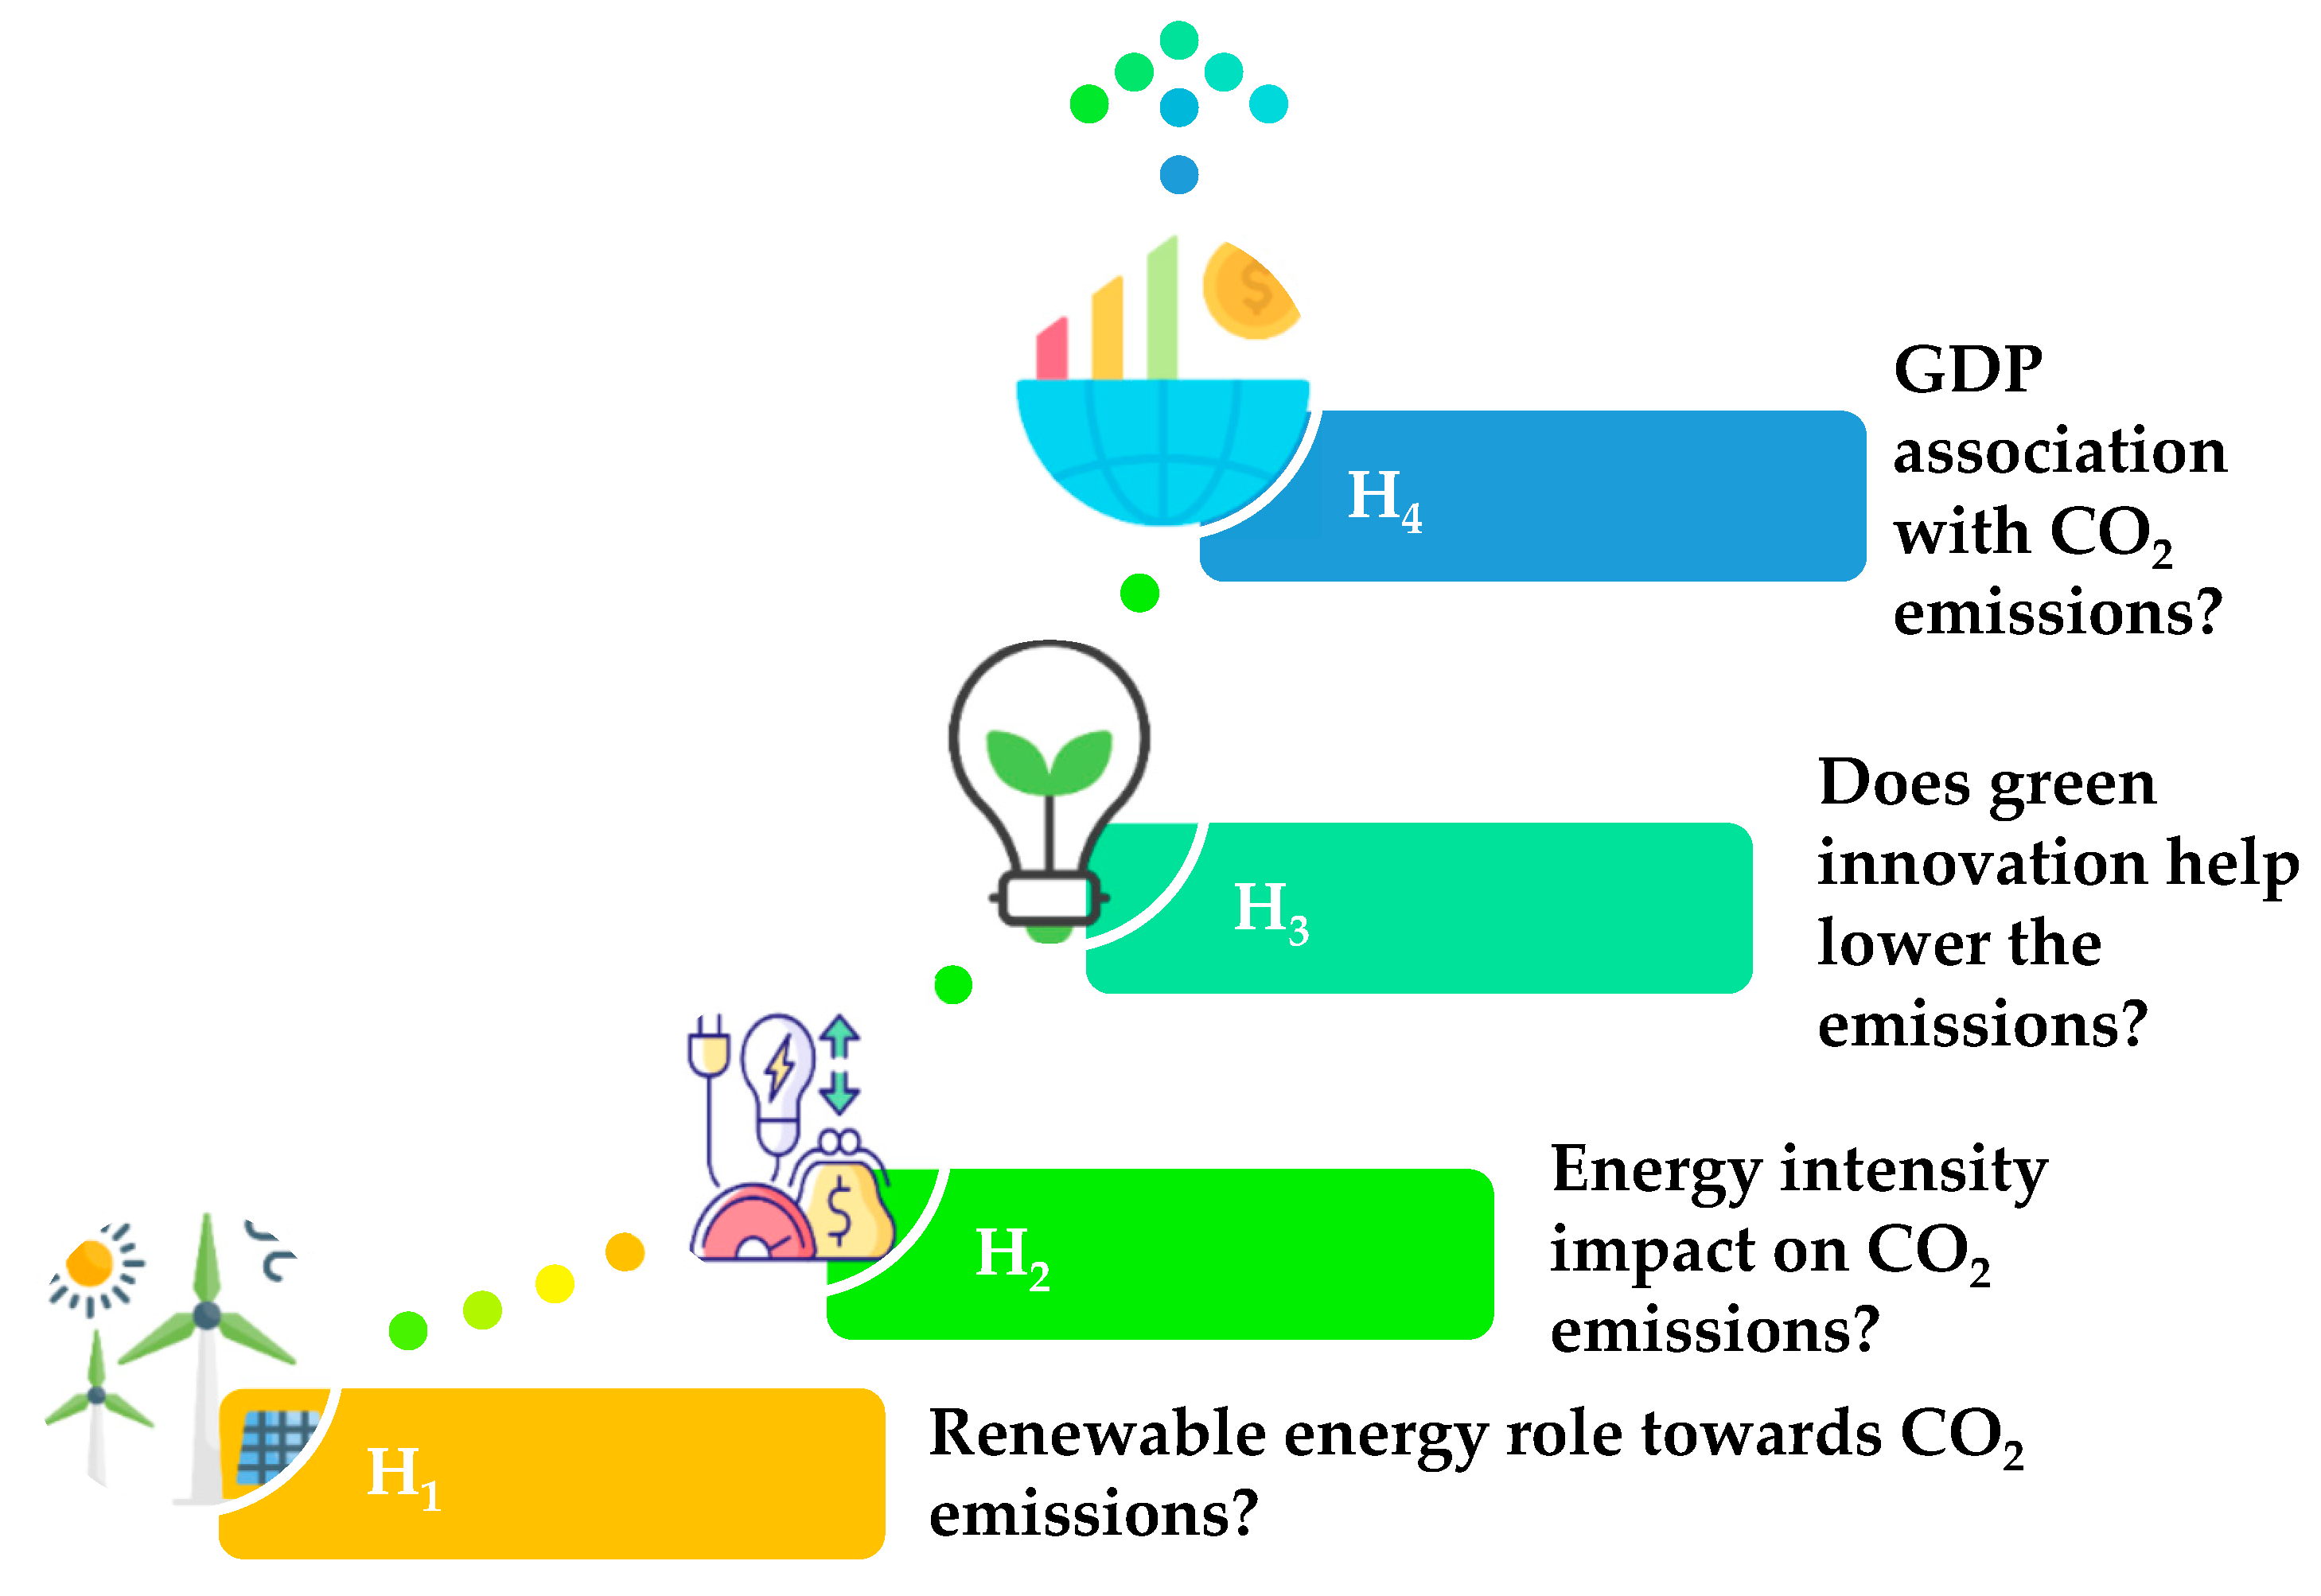
2 emissions from 1990 to 2021. (3) This study adds methodologically to the literature by using the MMQR technique, which is also employed by confined studies, and it is a novel way to investigate the link between factors. This strategy is thought to be useful for dealing with possible outliers that might disturb the general distribution of the data. Additionally, the MMQR permissible “conditional heterogeneity of variance consequences” to produce and influence outcomes by isolating dependent factors and allowing specific impacts on folks. (4) Furthermore, the motivation to scrutinize the effect of carbon emanations on MENA nations, including present emissions levels, causes of these emissions, and prospective ramifications for the region’s ecology, economy, and society. In addition, this study will look at the policy and technical options that MENA nations are using to reduce carbon emissions and transition to a future that is more environmentally friendly. (5) By filling this research vacuum, our study might give useful insights for policymakers and stakeholders working to mitigate climate change and achieve sustainable development in MENA nations. The research’s hypothetical scenario is shown in Figure 1.
The investigation is distributed into five stages. The first phase comprises the introduction section, where the reason for the research is extended by addressing the gaps. The second section is a detailed discussion of the literature review section, where the link between variables is examined in light of previous studies. The third section discusses methodology, which includes statistical approaches and models. The data is analyzed in the fourth part, and the findings are compared to the earlier literature. The last portion summarizes the entire study and includes ramifications and suggestions for future investigators and policymakers.

2. Literature Review

Over the course of the last several years, no other environmental issue has generated as much discussion anywhere in the globe as the issue of global warming. According to [21,22], discharges of greenhouse gases and carbon dioxide are the principal drivers of global warming. Recently, a significant number of academics and officials have brought attention to a variety of environmental variables. We focused our attention on research that was closely connected and organized them into the following three classifications:

2.1. Renewable Energy and Emissions

Renewable energy sources are kinds of energy that are perpetuated by nature and could be created by solar or alternative resources such as wind, solar, biomass, hydroelectricity, and thermal, and can lower carbon emissions. Ref. [23] investigated the impact that both RE and NRE on the environment in MENA states. The researchers concluded that RE does not meaningfully contribute to the improvement of environmental performance, but NRE makes the environment worse.
According to [24], RE contributes to reducing environmental pollution in Turkey. Ref. [25], RE has a substantial long-term effect on the environment. According to the instance of Germany [26], there is a feedback effect between RE and ED. Ref. [27] studied the link between CO2 in China, GDP, NRE, RE, and international trade. They concluded that NRE and GDP surge emissions in the long run. Ref. [28] verified ED, and using NRE increases CO2e, while using RE decreases CO2e. According to [29], financial expansion increases EC while lessening pollution. While ref. [30], renewable power expands environmental quality in South Africa. Ref. [31] discovered a link between RE prices and CO2e. According to [32], EG, CO2e, and RE might be significant to policymakers and Saudi Arabia’s sustainable development objectives. The results of [33] indicated that NRE causes environmental deterioration in Thailand. Using the panel DDCE approach, ref. [34] revealed RE declines in CO2e in Sub–Saharan Africa (SSA) from 1995 to 2017. The findings revealed that RE had a minor effect on CO2e. In the same area, ref. [17] examined the factors of ecological deterioration between 1980 and 2013 in the MENA. It was discovered that NRE contributes to environmental damage. From 1990 to 2014, ref. [35] analyzed the factors of CO2e in 30 nations. The research revealed that, unlike RE, NE contributes to CO2e. As a result, advancing the production of RE is critical to preventing warming temperatures.
Analyzing the relationships between split EC and CO2e in 102 nations while arranging the nations according to socioeconomic groups. [36] showed that utilizing RE slows down environmental degradation using static and dynamic panel approaches. However, the practice of NRE has adverse effects on the environment. A more recent study using a quantile methodology, [37] examined the link between RE and CO2e in G7 nations under the influence of GINO, trade openness, income, and NRE. They found that the use of RE had a stronger impact on environmental quality in the lower and upper quantiles. Parallel to this, the result of GINO and income raises the standard of the environment. The use of NRE sources and TO, however, had a negative impact on the environment. Additionally, the research found that using and investing in RE improves environmental quality.

2.2. Green Innovation and Emissions

Green innovation (GINO) has recently received more attention in climate change literature. Pioneering initiatives launched by [38] further defined GINO n as a subset of the innovation that attempts to reduce the environmental effect of products and industrial operations [39]. Previous research has established a consensus on the crucial importance of GINO in decreasing pollution. According to [40], GINO helps economies cut the cost of renewable energy and expedite the transition away from fossil fuels. Furthermore, the authors asserted that environmental innovation improves carbon capture and storage. Ref. [41] immediately emphasized the crucial significance of carbon capture and storage in reducing global warming. Furthermore, ref. [42] said that GINO facilitates the replacement of old technology with more modern and ecologically friendly ones, hence reducing harmful emissions. Using data from 1980 to 2018, ref. [43] investigated the effects of eco-innovation, GDP, and globalization on CO2e in the United States. The quantile ARDL highlights the critical importance of eco-innovation in lowering long-term emissions. These findings apply exclusively to the lower and upper quantiles, suggesting that the effects of GINO are verified in low and high CO2e settings, respectively. They found that environmental technology can be used to address climate change in the United States. Finally, ref. [44] investigated the environmental effect of EI in G7 countries. The findings are consistent with previous research, suggesting that environmental contamination may be reduced in both the short and long term. The majority of the preceding study concentrated only on the impacts of EC on CO2e manifestations, largely ignoring the results of environmental development. As a result, the purpose of this study is to add to the small body of literature by investigating the effects of technological innovation shared on MENA nations to CO2e.
Multi-country studies have also looked at the relationship between GINO and the environment, although agreement on their conclusions has yet to be reached. For instance, ref. [45] investigated the relationship between GINO and GDP in BRICS member nations using the STIRPAT paradigm. Using a static panel technique, the researchers discovered that GINO impacts environmental quality. However, the study’s findings demonstrated that GDP had an adverse effect on ecological quality. Ref. [46] employed a panel quantile regression in another study of 35 OECD countries to investigate the direct and regulating effects of GINO on CO2e, as well as uncover the negative heterogeneous effect of GINO on CO2e, in addition to supporting the EKC hypothesis.

3. Materials and Techniques

3.1. Data and Sources

The models selected for this study were carefully chosen for their effectiveness in analyzing the impact of REC, EINT, GINO, and GDP on CO2 emissions. The thorough analysis of data collected between 1990 and 2021 using these models has resulted in highly reliable and accurate findings, making them an ideal choice for this study. By gaining a comprehensive understanding of the relationship between these variables, this study provides compelling evidence for prioritizing renewable energy and green innovation in the pursuit of a sustainable future. The reason for selecting these factors is that they have a considerable influence on the environment, data availability, and the economy. The time range of 1990 to 2021 is preferred because it encompasses substantial changes in technology, policy, and financial stability, all of which have a ripple effect on the variables of interest. These factors may also help us comprehend how they are interrelated and how we could reach sustainable development goals. We selected a diverse panel of 16 MENA region nations (Algeria, Egypt, Iran, Iraq, Israel, Jordan, Lebanon, Libya, Morocco, Norway, Qatar, Saudi Arabia, Syria, Tunisia, and Yemen are among the nations represented by the United Arab Emirates). The MENA region was chosen for a variety of reasons, including data availability, geographic proximity, and special environmental issues encountered by the region. We utilize CO2 emissions in (metric tons per capita), renewable energy in (% of total final energy consumption), energy intensity (MJ/$2017 PPP GDP), green innovation as a proxy of cumulative patents of residential and nonresidential and the GDP is (current US$), while the source of data is world development bank indicators [47]. Figure 2 illustrates the carbon emissions of each MENA country and reveals that UAE and Qatar are the highest polluted countries in the MENA region from 1990 to 2021.

3.2. Analytical Foundation

This research examines the slope coefficient heterogeneity (SCH) and Cross-Section Dependency (CSD) before testing variables that account for the order of integration. Ignoring these factors might be an upshot in erroneous and biased estimates [42]. As a consequence, the [48] test is used for SCH, with the assumption that a homogenous coefficient is measured, which may or may not be accurate. The precise criteria for SCH are as follows:
Δ ˜ SCH = N 1 2 2 k 1 2 1 S S ˜ k  
Δ ˜ ASCH = N 1 2 2 k T k 1 T + 1 1 2 1 2 S ˜ 2 k
where Δ ˜ SCH, Δ ˜ ASCH denotes the homogeneity of the delta slope coefficient, and SCH is modified accordingly. Given the high degree of socioeconomic integration across MENA economies, cross-sectional reliance among variables is to be anticipated. Consequently, the research begins by examining CSD under the H0 that errors are weakly CSD, the Pesaran (2015) test for CSD is used. The simplified procedure for the Pesaran CSDtest is as explained below:
CD test = 2 T N N 1 i = 1 N 1 k = i + 1 N τ ^ i k
The H0 symbolizes no reliance, on the other hand, the H1 indicates dependency.

3.3. Panel Unit Root

Given the considerable evidence of heterogeneity and CSD diagonally MENA nations for several variables, adopting a second-generation panel unit root test that takes into CSD is critical. According to [49] the efficiency of estimate findings may significantly drop if CSD and heterogeneity exist across nations, which is typically disregarded in estimation by many researchers. Hence, the second-generation panel unit root CIPS and CADF tests are used in this research. The following is the CADF equation:
Δ Y i , t = γ i + γ i Y i , t 1 + γ i X ¯ t 1 + l = 0 p γ i l Δ Y ¯ t l + l = 1 p γ i l Δ Y i , t l + ε i t
where X ¯ t 1 and Δ Y ¯ t l are the lag and first difference mean scores, correspondingly. In addition, the measurements for CIPS are produced by averaging each CADF, as stated in Equation (4).
C I P S ^ = 1 N i = 1 n C A D F i
CADF in Equation (5) is used in conjunction with Equation (4). These unit root approaches are categorized as second-generation unit root tests. Unlike the first generation, these approaches produce trustworthy approximations in the event of cross-sectional dependency and heterogeneity.

3.4. Panel Cointegration Approach

After the parameters’ stationarity, the panel cointegration approach [50] is applied, which enables us to determine whether or not the parameters have long-run linkages, which means that they move in lockstep over time. For a more robust outcome, we use [51] a second-generation cointegration approach, which has an advantage over other first-generation tests in that it considers both SCH and CSD. The following example shows the governing equation for such a test:
G t = 1 N i = 1 N α i ´ S E α ´ i
G α = 1 N i = 1 N T α i ´ α ´ i 1
P t = i = 1 N α ´ S E α ´
P α = T α ´
Equations (6) and (7) provide group mean information that includes Gt, and Gα, while Equations (8) and (9) show panel statistics such as Pt, and Pα. The co-integration option would be compared to the null with no co-integration.

3.5. Panel Estimations Techniques

We use three panel estimating strategies for heterogeneous panels at the same time to provide robust and comparable estimators: FE-OLS, D-OLS, and FM-OLS. The FE-OLS is supplemented by DKS, which provides vigorous assessments in the manifestation of autocorrelation up to a given lag and generalized patterns of CSD. On the other hand, Ref. [50] pointed out that cross-sections are diverse concerning average variations and cointegrating equilibrium fine-tuning discrepancies. Pedroni developed the FM-OLS approach to solving these concerns, which includes discrete definite intercept and “heterogeneous serial-correlation of the error processes” diagonally for each cross-sectional entity. The D-OLS estimators developed by [52] are a further advancement in the panel estimating approach. The D-OLS approach yielded more robust estimates than both the FE-OLS and FM-OLS methods established on Monte Carlo simulations on a limited sample. The D-OLS technique additionally addresses endogeneity concerns by expanding lead and lagged variations to overcome the endogenous reaction.
The aforementioned linear estimating strategies only handle averages and do not constrain the data distribution. On the other side, panel quantile regression connects variables across quantiles [53]. This approach is used to evaluate quantile (location) irregularities or a variety of varied quantiles of the explained variables based on particular exogenous variable values. In particular, the quantile approach is much more sensitive to outliers in the estimate. Apart from that, it is the best strategy to use when the affiliation amid the conditional means of the variables is absent or weak. However, when estimators are computed for numerous percentiles, the basic quantile regression deficiencies the property of non-crossing guesstimates, resulting in an erroneous reaction distribution.

3.6. Method of Moments Quantile Regression (MMQR)

Ultimately, the study used innovative estimate approaches such as MMQR to investigate the relationship between variables. Machado and Silva (2019) invented this method [54]. This method incorporates the resilient to outlier characteristic. The rationale for selecting the MMQR approach is that it outperforms other techniques, such as conventional panel quantile regression. MMQR is useful since other linear estimating approaches cannot handle data dispersion; therefore, they only address averages. Second, conventional quantile regression is insufficient for non-crossing estimates when measuring estimators for numerous percentiles, resulting in an incorrect distribution. When Machado and Silva (2019) initially developed MMQR with fixed effects, the authors were well aware of the difficulties linked to panel quantile regression.
Though panel quantile regression is resistant to outliers, it cannot account for undetected variability diagonally panel cross-sections. By allowing individual effects, the MMQR enables “conditional heterogeneous covariance effects” of CO2 emission variables to impact the entire distribution, as opposed to panel quantile regression by [55,56], which only permits mean fluctuation. The MMQR is suitable when the prototypical contains endogenous independent factors, and the panel data includes distinct explicit properties. Furthermore, even if the model is nonlinear, the MMQR creates robust approximations in a variety of circumstances. The MMQR outperforms additional nonlinear approaches, including the “Nonlinear Autoregressive Distributed Lag (NARDL)”, in which nonlinearity is well-defined exogenously since the inception is not chosen using a data-driven process, but is instead set to zero. Also, since the parameters might be dependent on the point of the dependent factor, carbon emission, and conditional distribution, the method allows for location-based irregularity.
In light of these factors, the MMQR method is regarded as the most suitable strategy since it combines both asymmetric and nonlinear links while concurrently contending with heterogeneity and endogeneity. The MMQR is also intuitive as it generates non-crossing approximations across structural quantiles. The following describes the conditional quantile estimates Qy(X) of the locational-scale variant model:
Y i t   = α i + X i t β + δ i + Z i t γ U i t
where P δ i + Z i t γ > 0 = 1 , (α, β, δ, γ′)′ are the variables to be determined and the likelihood. Particular (I) fixed effects are denoted by (αi, δi), i = 1…, n and k vector of identified features of (X) is denoted by (Z), which are distinct transformations with element L described underneath:
Z L = Z L X   L = 1 , k
X i t is distributed distinctly but consistently for every given (I) and throughout time (t). U i t is also distributed autonomously and uniformly among people (i) across time (t), is diagonal to X i t , and is identical to accomplish the moment criteria. Equation (11) yields the following results:
Qy τ X = α i + δ i τ + X i t β + Z i t γ q ( τ
where X i t is a vector of explanatory factors that supplemented REC, EINT, GINO, and GDP. Qy τ X proposes that structural quantiles are distributed to the explained variable Y i t (CO2 emissions) based on the distribution (location) of exogenous components X i t . Particular (i) quantile (τ) fixed effects are signified by the scalar coefficient α i τ = α i + δ i q τ . Contrary to the normal fixed least-squares effects, intercept shift does not replicate the individual influence. These coefficients are time-invariant with heterogeneous properties that might deviate along the endogenous variable’s conditional distributional quantiles. Lastly, we may construct the MMQR version of our basic model’s expression in the format presented in Equation (13) below.
C E M I i t τ k α i , x i t = α i + ψ 1 τ R E C i t + ψ 2 τ E I N T i t + ψ 3 τ G I N O i t + ψ 4 τ G D P i t

3.7. Panel Causality Test

In the last stage of the econometric approach, we use the causality test to determine the direction of causation between CO2 emissions and the parameters that we have chosen. To accomplish this goal, we use the panel causality test [57]. This test is constructed on two distinct test statistics. The first is Wbar-statistics, which are calculated by averaging the test statistics, and the second is Zbar-statistics, which are calculated using the conventional normal distribution. The study also used the variance inflation factor (VIF), which revealed the multicollinearity hypothesis.

4. Results and Discussion

Table 1 encapsulates the descriptive measurement assessment for each series. CEMI, REC, EINT, GINO, and GDP mean values are 1.527, 7.396, 1.485, 6.308, and 24.952, accordingly. GDP average value is higher than other variables. All variables’ median, minimum, and maximum values are also included in the descriptive statistics.
The VIF was also used in the study, which revealed the multicollinearity assumptions. The findings in Table 2 show that VIF estimates are less than five, and the corresponding value of VIF is more than 0.20. The results revealed that no multicollinearity occurs. As a result, the aforementioned factors are genuinely independent of one another and may, therefore, be regarded as self-determining variables believed to influence CO2 emissions.
Before finding stationary qualities of REC, EINT, GINO, and GDP, the panel data physiognomies should be further expanded to utilize suitable panel unit root examinations. When a panel time-series data set is not homogeneous and cross-sectionally autonomous, traditional panel units’ root approaches like IPS, LL, HT, and Hadri yield unpredictable and incorrect findings. The approach of Pesaran and Yamagata is used to define whether slope coefficients are homogeneous. This method extends the Swamy method by estimating Δ ^ and Δ ^ A d j to test the H0 of slope homogeneity, H0: i = for all individuals, against the H1 of slope heterogeneity, H1: ij for a non-zero division of pair-wise slopes for ij. We have adequate evidence to reject the H0 of homogeneity in favor of the H1 of heterogeneity, and hence infer that the studied panel data are heterogeneous, as shown in Table 3. The CSD test reveals that the cross sections are reliant, as shown by statistical significance. Each factor discards the H0 of cross-sectional independence. As a result, there is a substantial reliance across the panel variables, implying that shocks in one of the MENA nations are likely to propagate to other countries.
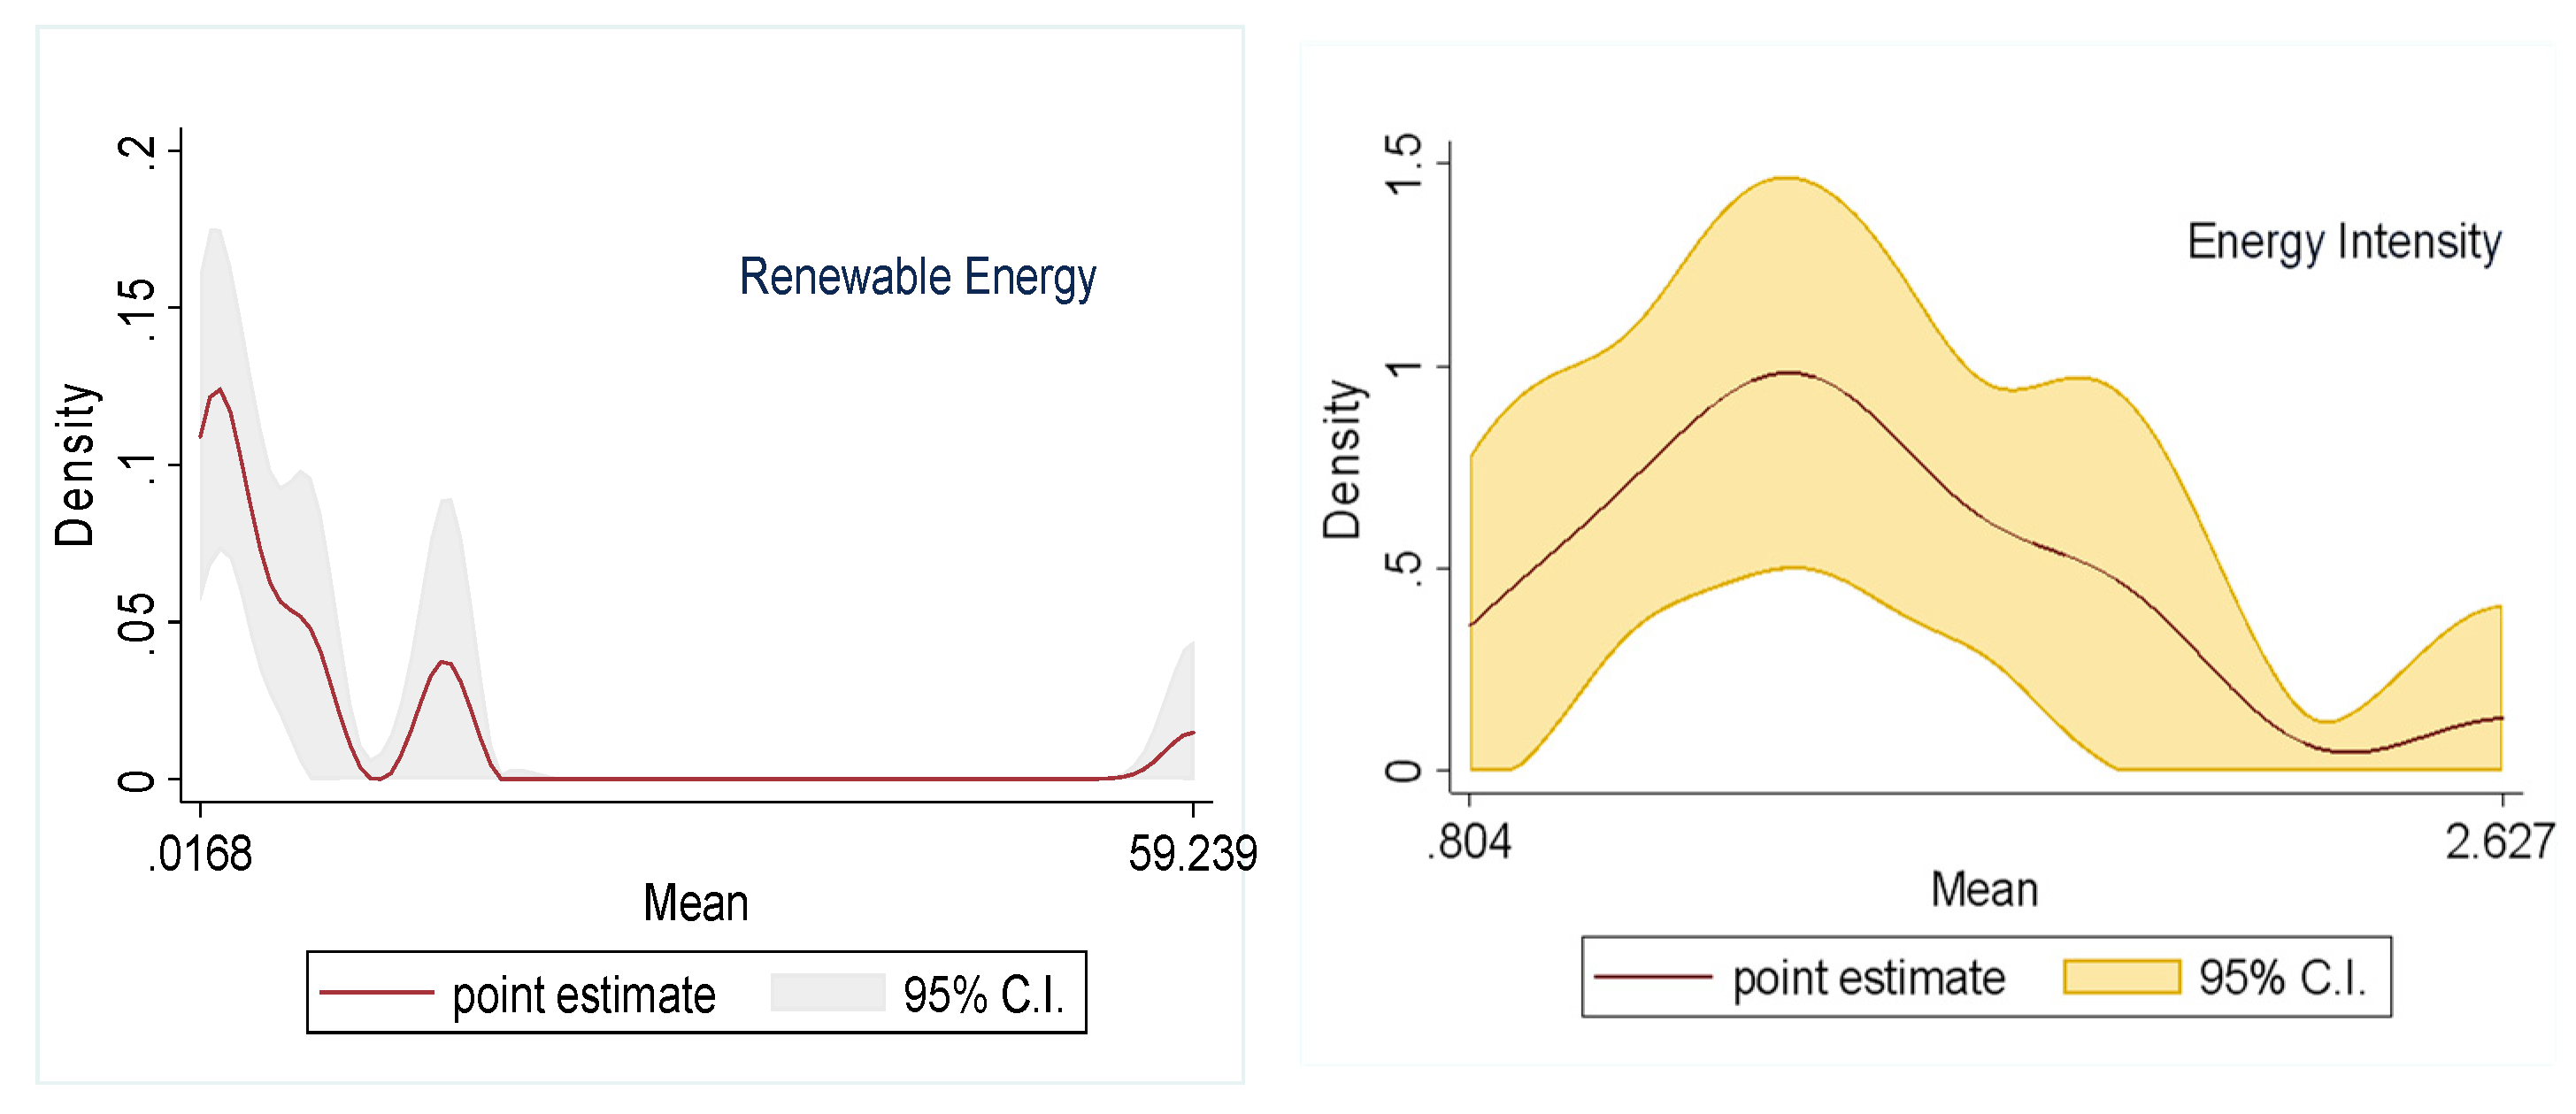
The authentication of heterogeneous properties shown in Figure 3 supports the variation in predicted REC, EINT, GINO, GDP, and emissions across the MENA region. We discover significant variability inside the collected data series, emphasizing the need to predict unexplained and important heterogeneous impacts.
We employ the CIPS and CADF unit root tests that are resistant to SCH and CSD difficulties. In the presence of both SCH and CSD, these tests yield consistent and accurate findings. REC, EINT, GINO, GDP, and CEMI all have unit roots at their levels and nonetheless become stationary at their 1st differences except GDP, which reflects significance at the level and 1st difference at the 1% level, according to Table 4. Generally, we can infer that the parameters under consideration are cohesive.
Table 5 summarizes the Pedroni panel cointegration test findings. These tests reject the H0 of no cointegration at the 1% and 5% significant levels because two tests of internal dimension (Panel PP and ADF stats) and two tests of between dimension (Group PP and ADF stats) support this denial. As a result, four of the seven tests show that the parameters interact mutually in the long-term equilibria in the carbon emissions paradigm.
We also used the Westerlund (2007) test to broaden our investigation. This approach is exceedingly dependable and widely utilized in recent literature; it outperforms several other cointegration techniques. Table 6 shows that the Gt and Pt stats are substantial since the stout p-values (0.005 and 0.015) are less than 0.10. As a result, the choice established on dynamic p-values derived via the bootstrap procedure reflects the long-term symmetry connection between CEMI and overall regressors.
The study follows [58,59,60] to investigate the interaction between the explained variable (CEMI) and its chosen determinants using the innovative MMQR approach. To compare the results, we employed many additional standard panel regression techniques (FM-OLS, D-OLS, and DKE). We initially examined the findings of traditional panel regression models before revealing the results of our principal MMQR model. Table 7 displays the outcomes of the FM-OLS, D-OLS, and DKE models. As per the findings, all three models indicate that REC reduces carbon emissions whereas EINT, GINO, and GDP increase environmental pollution in MENA nations. More precisely, according to the FM-OLS, D-OLS, and DKE techniques, a 1% upsurge in REC reduces carbon emissions by 0.062%, 0.035%, and 0.055% while a 1% escalation in EINT, GINO, and GDP increases carbon emissions. Our findings are similar and consistent with those [61,62,63], reported for MENA, OBOR, and OECD economies, respectively.
We now move to MMQR estimates after calculating the long-run coefficient using FMOLS, DOLS, and DKE approaches. Table 8 summarizes the estimated findings. The results of REC show a negative and substantial association with CO2 emissions at 5 and 1% levels in all quantiles. The MMQR model’s findings imply that a 1% rise in REC diminishes carbon emissions from 0.075% to 0.035% in Q10 to Q90, which is compatible with several of the United Nations’ SDGs. In particular, REC may help SDG 7, which objects to empowering universal entree to cheap, reliable, viable, and contemporary energy, as well as SDG 13, which intends to take an immediate feat to mitigate climate change and its consequences. The findings of the study stress the significance of addressing ecological sustainability (SDG 12) and supporting sustainable economic growth (SDG 8) in the MENA area. To achieve these SDGs, however, a coherent and unified strategy that considers the larger social, economic, and political settings in which renewable energy policies are implemented is required. This involves tackling challenges like energy availability, affordability, and equity, as well as encouraging innovation, capacity-building, and collaboration among many stakeholders. It is also critical to analyze possible trade-offs and synergies between different SDGs to guarantee that policies are long-term effective, egalitarian, and sustainable. The results are consistent [64,65,66,67] for ASEAN, top polluted nations, OECD, and BRIC countries.
Moreover, energy intensity (EINT) shows a positive and significant link to carbon emissions at the 1% level from Q10 to Q80. The outcomes infer a 1% rise in EINT rises emissions by 0.194% to 0.185%, respectively. It emphasizes the necessity of tackling energy efficiency (SDG 7) and decreasing energy intensity to condense the magnitudes of climate change (SDG 13) and achieve sustainable economic growth (SDG 8). A multifaceted strategy will be required to achieve these goals, which will involve regulations and interventions aiming at humanizing energy proficiency, advancing the practice of RE sources, and supporting sustainable consumption and production habits. It is also critical to evaluate the more social, fiscal, and administrative settings in which these guidelines are implemented, as well as potential trade-offs and synergies across different SDGs. Policymakers and organizations in the MENA area may assist in addressing some of the region’s most severe environmental and socioeconomic concerns by pursuing a comprehensive and integrated approach to sustainable development. The outcomes are comparable to [68,69,70,71] energy intensity intensified the pollution.
Green innovation (GINO) also reflects the significant and positive effect on carbon emissions at a 1% level throughout all the quantiles. It entails that a 1% escalation in GINO leads to carbon emissions of 0.038% to 0.032%, respectively. While the impact of green innovation in minimizing the effects of climate change is well acknowledged, this research implies that the adoption of new green technology may have unforeseen repercussions. Another phenomenon that could occur is the “rebound effect”, also known as the “Jevons paradox”, which describes a phenomenon in which the implementation of green innovations or energy-efficient technologies leads to increased industrial and economic growth, resulting in an unexpected increase in carbon dioxide (CO2) emissions. This surprising result arises when efficiency increases brought forth by technological breakthroughs lead to cost reductions, which drive increased consumption and utilization of resources. As a result, the beneficial environmental effect anticipated by the advances may be somewhat countered by an increase in total economic activity and energy consumption. This occurrence highlights the complicated interaction between technical advancement, economic dynamics, and environmental sustainability, emphasizing the necessity for a holistic strategy to address the issues of lowering carbon emissions. It will be critical to stimulate the progress and deployment of green technologies that are both ecologically sustainable and socially responsible to foster sustainable economic progression (SDG 8) and address climate change (SDG 13). This would necessitate policies and interventions targeted at encouraging innovation, capacity-building, and collaboration among many stakeholders, as well as addressing concerns of affordability, access, and equity. Policymakers and organizations in the MENA area may assist in guaranteeing that their efforts to encourage green innovation are successful, egalitarian, and long-term by embracing a holistic and integrated approach to sustainable development. The results are similar to [72,73,74,75] for different countries from a global perspective.
Finally, GDP outcomes are significant at 1% and 5% levels, revealing an increasing effect on CO2 emissions (CEMI) from Q10 to Q70. Implying that a 1% rise in GDP upsurge CEMI in the MENA region suggests that there is a positive correlation between GDP and CEMI. It is noteworthy that the link between GDP growth and heightened CEMI is prevalent in numerous developing regions. Nevertheless, this obstacle can be overcome through deliberate policy decisions. Countries can prioritize the separation of economic growth from carbon emissions by investing in renewable energy sources, enhancing energy efficiency, adopting cleaner technologies, and enforcing policies that support sustainable development. By doing so, economic growth can be sustained while simultaneously mitigating the environmental impact, facilitating the attainment of both economic and environmental objectives. Moreover, economic growth (SDG 8) is crucial for boosting development and eliminating poverty, this research emphasizes the need to address the possible environmental consequences of a GDP increase. It emphasizes the significance of ensuring socially and ecologically responsible economic growth.
To do this, MENA authorities and organizations will need to take a holistic and integrated approach to sustainable development that takes into account possible trade-offs and synergies between different SDGs. Addressing concerns such as energy efficiency, renewable energy, green innovation, and sustainable consumption and production patterns are all part of this. It will also be critical to advocate policies and initiatives that promote economic growth while limiting its environmental effect. This might include carbon pricing, green tax breaks, and laws targeted at lowering emissions and boosting sustainable behaviors. Policymakers and organizations in the MENA area may assist in guaranteeing that their efforts to promote economic growth are successful, egalitarian, and long-term by embracing a holistic and coordinated approach to sustainable development. The outcomes corroborate [76,77,78] reported that higher economic activities lead to carbon emissions.
The heterogeneous panel causality test examines the link between REC, EINT, GINO, GDP, and CO2 emissions (CEMI). Table 9 displays the outcome, which demonstrates a bidirectional causal link between the variables. This indicates that changes in one variable might affect another, and vice versa. The outcome reveals that changes in renewable energy, energy intensity, green innovation, and GDP all lead to changes in CEMI, and variations in CEMI can also lead to variations in these other variables. This indicates that adjustments made to one variable may have an effect on the others and that the reverse is also true. It suggests that, when establishing plans to minimize CEMI and promote sustainable development, policymakers and other stakeholders should take into consideration these linkages for the MENA region.

5. Conclusions

The MENA region has a tremendous challenge in tumbling carbon emissions because of its excessive dependence on petroleum and gas for energy production. Due to this dependency, there have been significant increases in CO2 emissions, which exacerbate climate change and harm the environment and human health. By lowering air pollution, addressing the problem of carbon emissions in the MENA area would enhance public health. Therefore, it is vital to explore the linkage between renewable energy, energy intensity, green innovation, and GDP on CO2 emissions for the MENA region. For the analysis, the study employed FMOLS, DOLS, and Driscoll-Kraay estimates to examine panel data from 1990 to 2021. The coefficient magnitude of heterogeneous linear estimate methods varies while maintaining close to the size set by the different requirements. To fulfill this, we utilize the MMQR approach in the conditional allocation of carbon emissions to analyze the various impacts of the explanatory variable throughout a large quantile assortment.
The research findings unveil a significant reduction in carbon emissions with the adoption of renewable energy sources. However, this impact is far from singular, exhibiting intricate dynamics across various econometric techniques—FMOLS, DOLS, DKE, and MMQR—each shedding light on different facets of the relationship. FMOLS highlights the joint influence of energy intensity, green innovation, and GDP, contributing to intensified CO2 emissions. DOLS underscores the role of energy intensity in this scenario. DKE introduces the complexity of green innovation’s influence on emissions, suggesting a more nuanced connection. Additionally, MMQR uncovers a connection between GDP growth and increased emissions alongside renewable energy adoption. Crucially, the outcomes of the heterogeneous panel causality test underscore a mutual interaction among renewable energy, energy intensity, green innovation, GDP, and CO2 emissions. This reciprocal relationship emphasizes the intricate interplay between these variables, warranting comprehensive and integrated strategies to address the multifaceted challenge of reducing carbon emissions effectively. In summary, the study showcases the multifaceted nature of renewable energy’s impact on carbon emissions, necessitating a holistic approach that considers the various contributing factors to achieve sustainable emission reduction goals. The outcomes of the research have the prospective to play a crucial role in the MENA countries prioritizing policies and investments that support green innovation, enhance energy efficiency, and promote GDP growth and renewable energy sources. This might play a role in lowering CO2 emissions and fostering a sustainable environment under the SDGs.

Recommendations

Some proposals for the MENA area to reduce CO2 emissions and promote ecological development based on the study’s findings include:
  • Increasing investment in RE sources like solar and wind power to condense dependency on fossil fuels and energy intensity. SDG 7: Ensure that everyone has access to modern, dependable, cheap energy. It is possible to reach this aim by expanding investment in RE sources like solar and wind power, which have enormous promise in the MENA area.
  • Encouraging green innovation and RE research and development to achieve long-term economic prosperity. Constructing robust infrastructure, proceeding with comprehensive and ecological industrialization, and backing innovation are the three pillars of SDG 9. To do this, it may be helpful to stimulate green innovation and clean energy and R&D. Putting rules in place that encourage firms to adopt sustainable practices and minimize their carbon impact. SDG 11: Create inclusive, secure, robust, and sustainable cities and human settlements. To do this, laws that encourage companies to adopt eco-friendly procedures and minimize their carbon impact may be put in place.
  • Increasing public awareness and education about the necessity of lowering CO2 emissions and living a more sustainable lifestyle. SDG 12: Promote sustainable patterns of consumption and production. Achieving this aim may be aided by raising public awareness and educating people about the value of cutting CO2 emissions and embracing sustainable lifestyles.
  • Working with other countries and international organizations to exchange best practices and resources for enhancing regional sustainability. SDG 17: Enhancement the international collaboration for sustainable growth and brace the mechanisms of execution. This objective may be attained by working together with other nations and international organizations to exchange best practices and resources for fostering sustainable development in the area.

Author Contributions

A.A.: Conceptualization, Methodology, Formal Analysis, Software, Writing—Original draft. K.R.A.: Review literature, Methodology, Validation Writing—Review & Editing. A.M.H.: Data curation, Writing—Review & Editing. M.R.: Supervision, Validation, Project administration, Writing—Review & Editing. C.M.: Investigation, Writing—Review & Editing. G.T.B.: Investigation; Writing—Review & Editing. All authors have read and agreed to the published version of the manuscript.

Funding

This research received no external funding.

Institutional Review Board Statement

Not applicable.

Informed Consent Statement

Not applicable.

Data Availability Statement

Not applicable.

Conflicts of Interest

The authors declare no conflict of interest. The funders had no role in the design of the study; in the collection, analyses, or interpretation of data; in the writing of the manuscript; or in the decision to publish the results.

Abbreviations

CO2eCO2 emissions
EGEconomic growth
MENAMiddle East and North Africa
NENuclear energy
NRENon-renewable energy
RERenewable Energy
CADFCross-sectional augmented Dickey-Fuller
CIPSCross-sectional augmented Im, Pesaran, and Shin
DKSDriscoll and Kraay standard errors
D-OLSDynamic Ordinary Least Squares
ECenergy consumption
EDEconomic Development
FE-OLSFixed Effects Ordinary Least Squares
FM-OLSFully Modified Ordinary Least Squares
SDGsSustainable Development Goals
TOtrade openness

References

  1. Zhu, G.; Liu, Y.; Wang, L.; Sang, L.; Zhao, K.; Zhang, Z.; Lin, X.; Qiu, D. The Isotopes of Precipitation Have Climate Change Signal in Arid Central Asia. Glob. Planet. Change 2023, 225, 104103. [Google Scholar] [CrossRef]
  2. Shang, Y.; Lian, Y.; Chen, H.; Qian, F. The Impacts of Energy Resource and Tourism on Green Growth: Evidence from Asian Economies. Resour. Policy 2023, 81, 103359. [Google Scholar] [CrossRef]
  3. Charfeddine, L.; Kahia, M. Impact of Renewable Energy Consumption and Financial Development on CO2 Emissions and Economic Growth in the MENA Region: A Panel Vector Autoregressive (PVAR) Analysis. Renew. Energy 2019, 139, 198–213. [Google Scholar] [CrossRef]
  4. Xing, Z.; Huang, J.; Wang, J. Unleashing the Potential: Exploring the Nexus between Low-Carbon Digital Economy and Regional Economic-Social Development in China. J. Clean. Prod. 2023, 413, 137552. [Google Scholar] [CrossRef]
  5. Guo, B.; Wang, Y.; Zhang, H.; Liang, C.; Feng, Y.; Hu, F. Impact of the Digital Economy on High-Quality Urban Economic Development: Evidence from Chinese Cities. Econ. Model. 2023, 120, 106194. [Google Scholar] [CrossRef]
  6. Guo, B.; Feng, Y.; Hu, F. Have Carbon Emission Trading Pilot Policy Improved Urban Innovation Capacity? Evidence from a Quasi-Natural Experiment in China. Environ. Sci. Pollut. Res. 2023. [Google Scholar] [CrossRef] [PubMed]
  7. Guo, B.; Wang, Y.; Zhou, H.; Hu, F. Can Environmental Tax Reform Promote Carbon Abatement of Resource-Based Cities? Evidence from a Quasi-Natural Experiment in China. Environ. Sci. Pollut. Res. 2022. [Google Scholar] [CrossRef]
  8. Bai, X.; Zhang, S.; Li, C.; Xiong, L.; Song, F.; Du, C.; Li, M.; Luo, Q.; Xue, Y.; Wang, S. A Carbon-Neutrality-Capactiy Index for Evaluating Carbon Sink Contributions. Environ. Sci. Ecotechnol. 2023, 15, 100237. [Google Scholar] [CrossRef]
  9. Wu, B.; Gu, Q.; Liu, Z.; Liu, J. Clustered Institutional Investors, Shared ESG Preferences and Low-Carbon Innovation in Family Firm. Technol. Forecast. Soc. Change 2023, 194, 122676. [Google Scholar] [CrossRef]
  10. Zhang, S.; Bai, X.; Zhao, C.; Tan, Q.; Luo, G.; Wang, J.; Li, Q.; Wu, L.; Chen, F.; Li, C.; et al. Global CO2 Consumption by Silicate Rock Chemical Weathering: Its Past and Future. Earth’s Future 2021, 9, e2020EF001938. [Google Scholar] [CrossRef]
  11. Wang, Y.; Cao, Q.; Liu, L.; Wu, Y.; Liu, H.; Gu, Z.; Zhu, C. A Review of Low and Zero Carbon Fuel Technologies: Achieving Ship Carbon Reduction Targets. Sustain. Energy Technol. Assess. 2022, 54, 102762. [Google Scholar] [CrossRef]
  12. Al-Mulali, U.; Ozturk, I.; Solarin, S.A. Investigating the Environmental Kuznets Curve Hypothesis in Seven Regions: The Role of Renewable Energy. Ecol. Indic. 2016, 67, 267–282. [Google Scholar] [CrossRef]
  13. Almulhim, A.I. Understanding Public Awareness and Attitudes toward Renewable Energy Resources in Saudi Arabia. Renew. Energy 2022, 192, 572–582. [Google Scholar] [CrossRef]
  14. Abdallh, A.A.; Abugamos, H. A Semi-Parametric Panel Data Analysis on the Urbanisation-Carbon Emissions Nexus for the MENA Countries. Renew. Sustain. Energy Rev. 2017, 78, 1350–1356. [Google Scholar] [CrossRef]
  15. Mahlooji, M.; Gaudard, L.; Ristic, B.; Madani, K. The Importance of Considering Resource Availability Restrictions in Energy Planning: What Is the Footprint of Electricity Generation in the Middle East and North Africa (MENA)? Sci. Total Environ. 2020, 717, 135035. [Google Scholar] [CrossRef] [PubMed]
  16. Omri, A. CO2 Emissions, Energy Consumption and Economic Growth Nexus in MENA Countries: Evidence from Simultaneous Equations Models. Energy Econ. 2013, 40, 657–664. [Google Scholar] [CrossRef]
  17. Gorus, M.S.; Aslan, M. Impacts of Economic Indicators on Environmental Degradation: Evidence from MENA Countries. Renew. Sustain. Energy Rev. 2019, 103, 259–268. [Google Scholar] [CrossRef]
  18. Zhang, Z.; Hao, L.; Linghu, Y.; Yi, H. Research on the Energy Poverty Reduction Effects of Green Finance in the Context of Economic Policy Uncertainty. J. Clean. Prod. 2023, 410, 137287. [Google Scholar] [CrossRef]
  19. Liu, L.; Tang, Y.; Liu, D. Investigation of Future Low-Carbon and Zero-Carbon Fuels for Marine Engines from the View of Thermal Efficiency. Energy Rep. 2022, 8, 6150–6160. [Google Scholar] [CrossRef]
  20. Zhao, S.; Shi, A.; An, H.; Zhou, H.; Hu, F. Does the Low-Carbon City Pilot Contribute to the Blue Sky Defense? Evidence from China. Environ. Sci. Pollut. Res. 2023, 30, 84595–84608. [Google Scholar] [CrossRef]
  21. Saeed, T.; Bouri, E.; Vo, X.V. Hedging Strategies of Green Assets against Dirty Energy Assets. Energies 2020, 13, 3141. [Google Scholar] [CrossRef]
  22. Syed, Q.R.; Bouri, E. Impact of Economic Policy Uncertainty on CO2 Emissions in the US: Evidence from Bootstrap ARDL Approach. J. Public Aff. 2022, 22, e2595. [Google Scholar] [CrossRef]
  23. Nathaniel, S.; Nathaniel, S. Renewable Energy, Urbanization, and Ecological Footprint in the Middle East and North Africa Region. Environ. Sci. Pollut. Res. 2020, 27, 14601–14613. [Google Scholar] [CrossRef] [PubMed]
  24. Qashou, Y.; Samour, A.; Abumunshar, M. Does the Real Estate Market and Renewable Energy Induce Carbon Dioxide Emissions? Novel Evidence from Turkey. Energies 2022, 15, 763. [Google Scholar] [CrossRef]
  25. Kirikkaleli, D.; Adebayo, T.S. Do Public-Private Partnerships in Energy and Renewable Energy Consumption Matter for Consumption-Based Carbon Dioxide Emissions in India? Environ. Sci. Pollut. Res. 2021, 28, 30139–30152. [Google Scholar] [CrossRef]
  26. Rafindadi, A.A.; Ozturk, I. Impacts of Renewable Energy Consumption on the German Economic Growth: Evidence from Combined Cointegration Test. Renew. Sustain. Energy Rev. 2017, 75, 1130–1141. [Google Scholar] [CrossRef]
  27. Chen, Y.; Wang, Z.; Zhong, Z. CO2 Emissions, Economic Growth, Renewable and Non-Renewable Energy Production and Foreign Trade in China. Renew. Energy 2019, 131, 208–216. [Google Scholar] [CrossRef]
  28. Ehigiamusoe, K.U.; Lean, H.H.; Smyth, R. The Moderating Role of Energy Consumption in the Carbon Emissions-Income Nexus in Middle-Income Countries. Appl. Energy 2020, 261, 114215. [Google Scholar] [CrossRef]
  29. Abdulrashid, A. Does the Need for Economic Growth in Fl Uence Energy Consumption and CO2 Emissions in Nigeria? Evidence from the Innovation Accounting Test. Renew. Sustain. Energy Rev. J. 2016, 62, 1209–1225. [Google Scholar]
  30. Ali, M.; Tursoy, T.; Samour, A.; Moyo, D.; Konneh, A. Testing the Impact of the Gold Price, Oil Price, and Renewable Energy on Carbon Emissions in South Africa: Novel Evidence from Bootstrap ARDL and NARDL Approaches. Resour. Policy 2022, 79, 102984. [Google Scholar] [CrossRef]
  31. Dutta, A.; Bouri, E.; Noor, M.H. Return and Volatility Linkages between CO2 Emission and Clean Energy Stock Prices. Energy 2018, 164, 803–810. [Google Scholar] [CrossRef]
  32. Toumi, S.; Toumi, H. Asymmetric Causality among Renewable Energy Consumption, CO2 Emissions, and Economic Growth in KSA: Evidence from a Non-Linear ARDL Model. Environ. Sci. Pollut. Res. 2019, 26, 16145–16156. [Google Scholar] [CrossRef] [PubMed]
  33. Boontome, P.; Therdyothin, A.; Chontanawat, J. Investigating the Causal Relationship between Non-Renewable and Renewable Energy Consumption, CO2 Emissions and Economic Growth in Thailand. Energy Procedia 2017, 138, 925–930. [Google Scholar] [CrossRef]
  34. Edziah, B.K.; Sun, H.; Adom, P.K.; Wang, F.; Agyemang, A.O. The Role of Exogenous Technological Factors and Renewable Energy in Carbon Dioxide Emission Reduction in Sub-Saharan Africa. Renew. Energy 2022, 196, 1418–1428. [Google Scholar] [CrossRef]
  35. Jin, T.; Kim, J. What Is Better for Mitigating Carbon Emissions—Renewable Energy or Nuclear Energy? A Panel Data Analysis. Renew. Sustain. Energy Rev. 2018, 91, 464–471. [Google Scholar] [CrossRef]
  36. Le, T.-H.; Chang, Y.; Park, D. Renewable and Nonrenewable Energy Consumption, Economic Growth, and Emissions: International Evidence. Energy J. 2020, 41. [Google Scholar] [CrossRef]
  37. Olanrewaju, V.O.; Irfan, M.; Altuntaş, M.; Agyekum, E.B.; Kamel, S.; El-Naggar, M.F. Towards Sustainable Environment in G7 Nations: The Role of Renewable Energy Consumption, Eco-Innovation and Trade Openness. Front. Environ. Sci. 2022, 10, 925822. [Google Scholar] [CrossRef]
  38. Fussler, C.; James, P. Driving Sustainability-Oriented Innovation: A Break Thorough Discipline for Innovation and Sustainability. 1996. Available online: https://books.google.com.sg/books/about/Driving_Eco_innovation.html?id=Ft4De24gY38C&redir_esc=y (accessed on 3 December 2019).
  39. Ozusaglam, S. Environmental Innovation: A Concise Review of the Literature. Vie Sci. l'Entreprise 2012, 2, 15–38. [Google Scholar] [CrossRef]
  40. Sun, Y.; Yesilada, F.; Andlib, Z.; Ajaz, T. The Role of Eco-Innovation and Globalization towards Carbon Neutrality in the USA. J. Environ. Manag. 2021, 299, 113568. [Google Scholar] [CrossRef]
  41. Nataly Echevarria Huaman, R.; Xiu Jun, T. Energy Related CO2 Emissions and the Progress on CCS Projects: A Review. Renew. Sustain. Energy Rev. 2014, 31, 368–385. [Google Scholar] [CrossRef]
  42. Iqbal, N.; Abbasi, K.R.; Shinwari, R.; Guangcai, W.; Ahmad, M.; Tang, K. Does Exports Diversification and Environmental Innovation Achieve Carbon Neutrality Target of OECD Economies? J. Environ. Manag. 2021, 291, 112648. [Google Scholar] [CrossRef] [PubMed]
  43. Sun, Y.Y.; Higham, J. Overcoming Information Asymmetry in Tourism Carbon Management: The Application of a New Reporting Architecture to Aotearoa New Zealand. Tour. Manag. 2021, 83, 104231. [Google Scholar] [CrossRef] [PubMed]
  44. Wang, H.; Wang, M. Effects of Technological Innovation on Energy Efficiency in China: Evidence from Dynamic Panel of 284 Cities. Sci. Total Environ. 2020, 709, 136172. [Google Scholar] [CrossRef] [PubMed]
  45. Zhang, H. Technology Innovation, Economic Growth and Carbon Emissions in the Context of Carbon Neutrality: Evidence from BRICS. Sustainability 2021, 13, 11138. [Google Scholar] [CrossRef]
  46. Cheng, C.; Ren, X.; Dong, K.; Dong, X.; Wang, Z. How Does Technological Innovation Mitigate CO2 Emissions in OECD Countries? Heterogeneous Analysis Using Panel Quantile Regression. J. Environ. Manag. 2021, 280, 111818. [Google Scholar] [CrossRef] [PubMed]
  47. WDI The World Bank Indicators. Available online: https://data.worldbank.org/ (accessed on 3 December 2019).
  48. Pesaran, M.H. An Autoregressive Distributed-Lag Modelling Approach to Cointegration Analysis. In Econometrics and Economic Theory in the 20th Century: The Ragnar Frisch Centennial Symposium; University of Cambridge: Cambridge, UK, 2008; pp. 371–413. [Google Scholar] [CrossRef]
  49. He, K.; Ramzan, M.; Ayobamiji Awosusi, A.; Ahmed, Z.; Ahmad, M.; Altuntaş, M. Does Globalization Moderate the Effect of Economic Complexity on CO2 Emissions? Evidence From the Top 10 Energy Transition Economies. Front. Environ. Sci. 2021, 9, 778088. [Google Scholar] [CrossRef]
  50. Pedroni, P. Panel Cointegration: Asymptotic and Finite Sample Properties of Pooled Time Series Tests with an Application to the PPP Hypothesis. Econom. Theory 2004, 20, 597–625. [Google Scholar] [CrossRef]
  51. Westerlund, J. Testing for Error Correction in Panel Data. Oxf. Bull. Econ. Stat. 2007, 69, 709–748. [Google Scholar] [CrossRef]
  52. Kao, C.D.; Chiang, M.-H.; Chen, B. International R&D Spillovers: An Application of Estimation and Inference in Panel Cointegration. SSRN Electron. J. 2012, 61, 691–709. [Google Scholar]
  53. An, H.; Razzaq, A.; Haseeb, M.; Mihardjo, L.W. The Role of Technology Innovation and People’s Connectivity in Testing Environmental Kuznets Curve and Pollution Heaven Hypotheses across the Belt and Road Host Countries: New Evidence from Method of Moments Quantile Regression. Environ. Sci. Pollut. Res. 2021, 28, 5254–5270. [Google Scholar] [CrossRef]
  54. Machado, J.A.F.; Santos Silva, J.M.C. Quantiles via Moments. J. Econom. 2019, 213, 145–173. [Google Scholar] [CrossRef]
  55. Canay, I.A. A Simple Approach to Quantile Regression for Panel Data. Econom. J. 2011, 14, 368–386. [Google Scholar] [CrossRef]
  56. Koenker, R. Quantile Regression for Longitudinal Data. J. Multivar. Anal. 2004, 91, 74–89. [Google Scholar] [CrossRef]
  57. Dumitrescu, E.I.; Hurlin, C. Testing for Granger Non-Causality in Heterogeneous Panels. Econ. Model. 2012, 29, 1450–1460. [Google Scholar] [CrossRef]
  58. Hieu, V.M.; Mai, N.H. Impact of Renewable Energy on Economic Growth? Novel Evidence from Developing Countries through MMQR Estimations. Environ. Sci. Pollut. Res. 2023, 30, 578–593. [Google Scholar] [CrossRef] [PubMed]
  59. Jahanger, A.; Zaman, U.; Hossain, M.R.; Awan, A. Articulating CO2 Emissions Limiting Roles of Nuclear Energy and ICT under the EKC Hypothesis: An Application of Non-Parametric MMQR Approach. Geosci. Front. 2023, 14, 101589. [Google Scholar] [CrossRef]
  60. Anwar, A.; Siddique, M.; Dogan, E.; Sharif, A. The Moderating Role of Renewable and Non-Renewable Energy in Environment-Income Nexus for ASEAN Countries: Evidence from Method of Moments Quantile Regression. Renew. Energy 2021, 164, 956–967. [Google Scholar] [CrossRef]
  61. Mensah, C.N.; Long, X.; Boamah, K.B.; Bediako, I.A.; Dauda, L.; Salman, M. The Effect of Innovation on CO2 Emissions of OCED Countries from 1990 to 2014. Environ. Sci. Pollut. Res. 2018, 25, 29678–29698. [Google Scholar] [CrossRef]
  62. Sinha, A.; Shah, M.I.; Sengupta, T.; Jiao, Z. Analyzing Technology-Emissions Association in Top-10 Polluted MENA Countries: How to Ascertain Sustainable Development by Quantile Modeling Approach. J. Environ. Manag. 2020, 267, 110602. [Google Scholar] [CrossRef]
  63. Bilal, A.; Li, X.; Zhu, N.; Sharma, R.; Jahanger, A. Green Technology Innovation, Globalization, and CO2 Emissions: Recent Insights from the OBOR Economies. Sustainability 2022, 14, 236. [Google Scholar] [CrossRef]
  64. Safitri, D.; Fahrurrozi; Marini, A.; Dewiyani, L.; Attas, S.G. The Role of Environmental Degradation and Green Investment on the Renewable Energy Production in ASEAN Countries: Evidence Using Novel MMQR Technique. Environ. Sci. Pollut. Res. 2022, 30, 33363–33374. [Google Scholar] [CrossRef] [PubMed]
  65. Sun, Y.; Anwar, A.; Razzaq, A.; Liang, X.; Siddique, M. Asymmetric Role of Renewable Energy, Green Innovation, and Globalization in Deriving Environmental Sustainability: Evidence from Top-10 Polluted Countries. Renew. Energy 2022, 185, 280–290. [Google Scholar] [CrossRef]
  66. Pata, U.K.; Samour, A. Assessing the Role of the Insurance Market and Renewable Energy in the Load Capacity Factor of OECD Countries. Environ. Sci. Pollut. Res. 2023, 30, 48604–48616. [Google Scholar] [CrossRef] [PubMed]
  67. Awosusi, A.A.; Adebayo, T.S.; Altuntaş, M.; Agyekum, E.B.; Zawbaa, H.M.; Kamel, S. The Dynamic Impact of Biomass and Natural Resources on Ecological Footprint in BRICS Economies: A Quantile Regression Evidence. Energy Rep. 2022, 8, 1979–1994. [Google Scholar] [CrossRef]
  68. Abbasi, K.; Jiao, Z.; Shahbaz, M.; Khan, A. Asymmetric Impact of Renewable and Non-Renewable Energy on Economic Growth in Pakistan: New Evidence from a Nonlinear Analysis. Energy Explor. Exploit. 2020, 38, 1946–1967. [Google Scholar] [CrossRef]
  69. Bandyopadhyay, A.; Rej, S.; Abbasi, K.R.; Awan, A. Nexus between Tourism, Hydropower, and CO2 Emissions in India: Fresh Insights from ARDL and Cumulative Fourier Frequency Domain Causality. Environ. Dev. Sustain. 2022. [Google Scholar] [CrossRef]
  70. Ning, L.; Raza, K.; Khadim, A.; Rafael, H.; Muhammad, A. Analyzing the Role of Green Innovation and Public-Private Partnerships in Achieving Sustainable Development Goals: A Novel Policy Framework. Environ. Sci. Pollut. Res. 2023. [Google Scholar] [CrossRef]
  71. Zhang, L.; Abbasi, K.R.; Hussain, K.; Abuhussain, M.A.; Aldersoni, A.; Alvarado, R. Importance of Institutional Quality and Technological Innovation to Achieve Sustainable Energy Goal: Fresh Policy Insights. J. Innov. Knowl. 2023, 8, 100325. [Google Scholar] [CrossRef]
  72. Awan, A.; Abbasi, K.R.; Rej, S.; Bandyopadhyay, A.; Lv, K. The Impact of Renewable Energy, Internet Use and Foreign Direct Investment on Carbon Dioxide Emissions: A Method of Moments Quantile Analysis. Renew. Energy 2022, 189, 454–466. [Google Scholar] [CrossRef]
  73. Ramzan, M.; Raza, K.; Salman, A.; Dagar, V.; Alvarado, R. Towards the Dream of Go Green: An Empirical Importance of Green Innovation and Financial Depth for Environmental Neutrality in World’s Top 10 Greenest Economies. Technol. Forecast. Soc. Change 2023, 189, 122370. [Google Scholar] [CrossRef]
  74. Abbasi, K.R.; Hussain, K.; Haddad, A.M.; Salman, A.; Ozturk, I. The Role of Financial Development and Technological Innovation towards Sustainable Development in Pakistan: Fresh Insights from Consumption and Territory-Based Emissions. Technol. Forecast. Soc. Change 2021, 176, 121444. [Google Scholar] [CrossRef]
  75. Zheng, L.; Raza, K.; Salem, S.; Irfan, M.; Alvarado, R. How Technological Innovation and Institutional Quality Affect Sectoral Energy Consumption in Pakistan? Fresh Policy Insights from Novel Econometric Approach. Technol. Forecast. Soc. Change 2022, 183, 121900. [Google Scholar] [CrossRef]
  76. Abbasi, K.R.; Hussain, K.; Redulescu, M.; Ozturk, I. Does Natural Resources Depletion and Economic Growth Achieve the Carbon Neutrality Target of the UK? A Way Forward towards Sustainable Development. Resour. Policy 2021, 74, 102–341. [Google Scholar] [CrossRef]
  77. Zhou, R.; Raza, K.; Salem, S.; Almulhim, A.I. Do Natural Resources, Economic Growth, Human Capital, and Urbanization Affect the Ecological Footprint? A Modified Dynamic ARDL and KRLS Approach. Resour. Policy 2022, 78, 102782. [Google Scholar] [CrossRef]
  78. Tamazian, A.; Chousa, J.P.; Vadlamannati, K.C. Does Higher Economic and Financial Development Lead to Environmental Degradation: Evidence from BRIC Countries. Energy Policy 2009, 37, 246–253. [Google Scholar] [CrossRef]
Figure 1. Pictorial view of hypothetical questions.
Energies 16 06053 g001
Figure 2. Carbon emissions country-wise.
Energies 16 06053 g002
Figure 3. Kernel Density Estimation for Mean.
Energies 16 06053 g003aEnergies 16 06053 g003b
Table 1. Descriptive statistics.
CEMIRECEINTGINOGDP
Mean1.5277.3961.4856.30824.952
Median1.3552.1851.4196.28825.006
Maximum3.86465.6102.8369.69627.449
Minimum−1.1530.009−2.6591.09919.826
Std. Dev.1.04614.1970.5991.5891.293
Skewness0.2323.031−1.442−0.108−0.475
Kurtosis2.72011.32012.8902.7773.234
Obs.512512512512512
Note: (CEMI, REC, EINT, GINO, and GDP) signifies CO2 emissions, renewable energy consumption, energy intensity, green innovation, and gross domestic product.
Table 2. Variance inflation factor.
VariableVIF1/VIF
REC1.130.886
EINT1.070.931
GINO1.580.632
GDP1.570.637
Mean VIF1.34
Note: (REC, EINT, GINO, and GDP) signifies CO2 emissions, renewable energy consumption, energy intensity, green innovation, and gross domestic product.
Table 3. Diagnostic assessments.
Slope Heterogeneity Δ ^ Δ ^ A d j
CEMI = f (REC + EINT + GINO + GDP)26.49 a29.39 a
Pesaran (2015) Cross-Sectional Dependence
CD testp-value
CEMI7.970.00 a
REC6.140.00 a
EINT3.540.00 a
GINO10.010.00 a
GDP45.870.00 a
Note: (CEMI, REC, EINT, GINO, and GDP) signifies CO2 emissions, renewable energy consumption, energy intensity, green innovation, and gross domestic products, while (a) reflects the significance at a 1% level.
Table 4. Unit root assessment.
DeterminantsCIPSCADF
Level Δ Level Δ
CEMI−1.26−4.95 a−1.33−2.62 a
REC−1.44−4.97 a−1.25−2.88 a
EINT−1.59−4.89 a−0.99−2.37 a
GINO−1.97−3.90 a−1.68−2.36 a
GDP−2.93 a−4.78 a−2.38−2.84 a
Note: (REC, EINT, GINO, and GDP) denote renewable energy consumption, energy intensity, green innovation, and gross domestic products, while (a) reflect the significance at 1%, 5%, and 10%.
Table 5. Pedroni test (Engle-Granger based).
Pedroni Statistic StatsH1: Common AR Coefs. (Within-Dimension)
Prob.StatsProb.
Panel v-Stats1.3720.085 c1.2270.110
Panel rho-Stats0.1030.5410.1460.558
Panel PP-Stats−2.1830.015 b−2.4350.007
Panel ADF-Stats−3.0410.001 a−2.0580.020
H1: individual AR coefs. (between-dimensions)
Group rho-Stats1.3300.908
Group PP-Stats−1.9790.024 b
Group ADF-Stats−1.5480.061 c
Note: (a–c) reflect the significance at 1%, 5%, and 10%.
Table 6. Westerlund Cointegration Approach.
StatsAssessmentZ-Statsp-Values
Gt−3.056−2.5580.005 a
Ga−10.281.3970.919
Pt−10.935−2.1610.015 b
Pa−8.3690.4940.69
Note: (a,b) reflect the significance at 1%, 5%, and 10%.
Table 7. Long-term elasticities.
DeterminantsFM-OLSD-OLSDriscoll-Kraay
Coeff.tProb.Coeff.tProb.Coeff.tProb.
REC−0.062−6.1540.000 a−0.035−3.4880.001 a−0.055−5.620.000 a
EINT0.1483.2920.001 a0.1452.5410.012 b0.1313.030.005 a
GINO0.0422.1930.029 b0.0442.0950.037 b0.0353.10.004 a
GDP0.0311.7350.083 c0.0683.0520.003 a0.0362.250.032 a
Note: (REC, EINT, GINO, and GDP) symbolize renewable energy consumption, energy intensity, green innovation, and gross domestic products, while (a–c) reflect the significance at 1%, 5%, and 10%.
Table 8. MMQR outcomes.
DeterminantsLocationScaleLower_QuantilesMiddle_QuantilesUpper_Quantiles
Q.10Q.20Q.30Q.40Q.50Q.60Q.70Q.80Q.90
REC−0.054 b0.013 a−0.075 a−0.069 a−0.064 a−0.059 a−0.053 a−0.048 a−0.045 a−0.040 a−0.035 a
EINT0.130 a−0.040 b0.194 a0.174 a0.158 a0.145 a0.127 a0.112 a0.099 a0.085 b0.069
GINO0.035 a−0.0020.038 b0.037 a0.036 a0.035 a0.034 a0.034 a0.033 a0.032 a0.032 b
GDP0.036 a−0.0110.054 a0.048 a0.044 a0.040 a0.035 a0.031 b0.038 b0.0240.019
Note: (REC, EINT, GINO, and GDP) indicate renewable energy consumption, energy intensity, green innovation, and gross domestic products, while (a,b) echo the significance at 1%, 5%, and 10%.
Table 9. Granger heterogeneous causality.
Null Hypothesis:DirectionW-Stat.Zbar-Stat.Prob.
REC → CEMI4.123.280.001 a
CEMI → REC5.084.900.00 a
EINT → CEMI5.365.370.00 a
CEMI → EINT4.934.640.00 a
GINO → CEMI4.714.280.00 a
CEMI → GINO3.341.960.05 a
GDP → CEMI6.276.900.00 a
CEMI → GDP6.797.780.00 a
Note: (CEMI, REC, EINT, GINO, and GDP) denotes CO2 emissions, renewable energy consumption, energy intensity, green innovation, and gross domestic products, while (a) mirrors the significance at 1%.
Disclaimer/Publisher’s Note: The statements, opinions and data contained in all publications are solely those of the individual author(s) and contributor(s) and not of MDPI and/or the editor(s). MDPI and/or the editor(s) disclaim responsibility for any injury to people or property resulting from any ideas, methods, instructions or products referred to in the content.

