Abstract
Acoustic inspection is a valuable technique that can detect early stage defects in equipment, thereby facilitating predictive maintenance. In recent times, ultrasonic sensors have made detecting partial discharges through acoustic sensing increasingly feasible. However, interpreting the acoustic signals can pose challenges, as it requires extensive expertise and knowledge of equipment configuration. To address this issue, a technique based on zero-crossing rate and fundamental frequency estimation has been proposed to standardize insulator diagnosis. In an experiment involving a database of 72 raw acoustic signals with frequencies ranging from 0 to 128 kHz, various types of pollution and defects were introduced to a chain of insulators. By employing the proposed technique, the occurrence of partial discharges can be detected and classified according to type, such as corona or surface discharges. This advanced approach to diagnosis simplifies the process while providing valuable insights into the severity of observed phenomena in the field.
1. Introduction
Partial discharges (PDs) are spatially limited and incomplete dielectric breakdowns, in which the voltage gradient is only strong enough to sustain the electric discharge in the vicinity of the point of inception []. According to [], there are four types of PDs: corona, internal, surface and electrical treeing discharges.
As shown in Figure 1A, corona discharges occur if the electric field is sufficiently non-uniform in the surrounding air. This type of PD is established, commonly, near sharp points or where conductors are curved on transmission lines. Corona discharges may be accompanied by a bluish luminescence and a hissing noise, containing ultrasound and audible acoustic signals. Moreover, corona discharges could have a transient or steady state behavior, and they may lead to insulation deterioration.
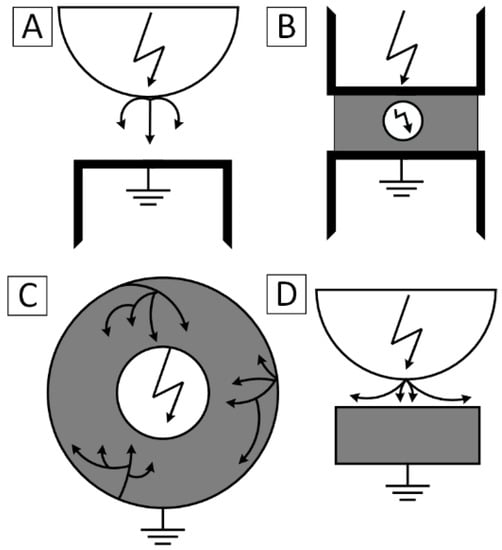
Figure 1.
Types of partial discharges: (A) corona; (B) internal; (C) treeing channel; (D) surface discharge.
Figure 1B illustrates an internal discharge that may occur in voids or cavities inside the insulator layer, where there is low dielectric strength. The continuous occurrence of internal discharges in a solid dielectric may lead to major defects in insulation and the formation of discharge channels, thus resulting in electrical trees, see Figure 1C. Furthermore, surface discharges, shown in Figure 1D, occur when there is a relatively high parallel component of the electric field to a dielectric surface [].
PDs are typically accompanied by the emission of sound, light, heat and chemical reactions []. Therefore, the most common techniques to measure PDs are based on acoustic, electrical, optical, thermal and chemical methods of detection. Electrical methods are premised on the coupling of a measuring instrument (MI) in the system that has equipment subjected to PDs. Through this MI, voltage and current signals are taken and PDs are evaluated. The measurement system for high-voltage (HV) tests is presented in [].
Visual or optical detection is based on the emission of light from PDs. It may require a dark room or, alternatively, a photographic record could be used throughout a long exposure time []. The detection of PDs made from chemical reactions is more commonly used in systems with oil or gas insulators. It consists of the analysis of decomposition products dissolved in the insulating media, e.g., humidity and gas [].
Acoustic methods are based on the measurement of the sound produced by electrical discharges. In this regard, audible sound is, typically, generated by severe PDs and electric arcs. By comparison, the satisfactory detection of incipient PDs depends on ultrasound-based techniques []. The use of ultrasound signals to evaluate the occurrence of PDs is a well-established technique and has been used in previous studies, such as [,]. In these articles, the authors discuss theoretical and practical foundations for the online (or otherwise stated, energized) PD evaluation in gas-insulated substations [] and power transformers [].
More accurate ultrasonic sensors have been introduced on the market, resulting in an emergence of sophisticated methods for evaluating PDs. A feature that turns acoustic detection into a powerful technique is the immunity to electromagnetic interference (EMI), making it a suitable method for evaluating PDs in energized equipment []. In this regard, ultrasound inspection is used in different types of equipment, including generators, transformers, cables and insulators. However, the acoustic measurement could be contaminated with noise, which makes the identification of PDs difficult and complex [].
To take account of the external noise in acoustic measurement, new approaches developed in [] combine the use of distinct sensors with signal processing to eliminate noise and generate diagnostics of the state of the equipment.
The wavelet transform (WT) is widely used in signal noise reduction, e.g., the techniques in [,,,]. In [], the authors reported the use of wavelet energy coefficient and principal component analysis (PCA) for glass and polymer insulators; wavelet packet transform (WPT) for glass insulators []; and WT, filtering and noise reduction for polymeric insulators [].
Figure 2 shows the main types of sensors, signal processing techniques and diagnostic methods applied to acoustic inspection.
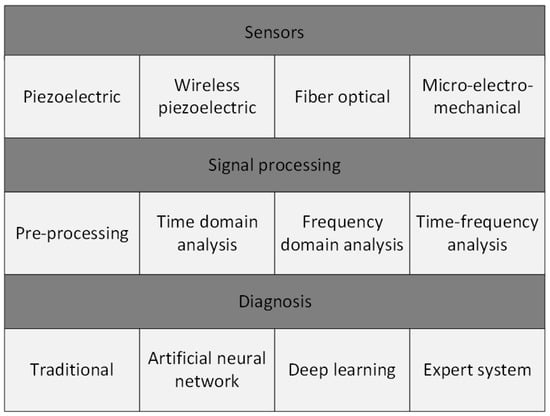
Figure 2.
An overview of acoustic inspection. Adapted from [].
In [], a method is proposed for the evaluation of surface discharges in HV glass insulators. This method is based on WT for signal processing and on radial basis function neural networks for identifying PDs. A similar technique is also proposed in []. In this approach, a hybrid model that combines particle swarm optimization (PSO), WT and neural networks is used to classify PDs in a gas-insulated switchgear (GIS).
An ultrasonic diagnostic method is proposed in [] for monitoring PDs in medium-voltage pin-type insulators. This work takes advantage of a normalized frequency, obtained from measurements in the insulators, to identify the magnitude of PDs. In [], the state echo network is used for the classification of insulators based on ultrasound signals. This study, [], demonstrates that the proposed neural network presented an 87.36% accuracy for multiclassification. The insulators are evaluated in the laboratory under controlled conditions at a voltage of 13.8 kV (phase-to-phase). Furthermore, this work has shown that the echo state network performed better than multilayer and support vector-machines.
This paper presents a novel methodology for detecting and categorizing PDs in HV glass insulators using raw (unprocessed) acoustic signals. The acoustic signals are captured within a frequency range of 0 to 128 kHz without undergoing any prior processing, such as heterodyning (a widely employed technique in acoustic inspection equipment). The conducted experiments involve insulators contaminated with various types of artificial pollutants to simulate real-world conditions that can give rise to PDs. For the diagnosis of the raw acoustic signals, two techniques are employed: zero-crossing rate and fundamental frequency estimation. These techniques contribute to the identification of anomalies and the categorization of PD severity. The proposed method standardizes the diagnosis of insulators and categorizes PDs into corona and superficial types. This, in turn, helps to predict failures and reduce unwarranted shutdowns by facilitating scheduled maintenance.
The paper’s primary contributions are as follows:
- Firstly, it introduces a method that does not rely on extensive training datasets for neural networks or artificial intelligence models. This departure from traditional machine learning approaches eliminates the need for large-scale data collection and time-consuming training processes.
- Furthermore, the proposed technique offers distinct advantages for acoustic inspections, particularly in the context of energized substations. By enabling online diagnosis directly in the field, it enhances the efficiency and effectiveness of HV glass insulator assessments. This capacity empowers maintenance teams to make real-time decisions and take proactive measures to ensure the reliable operation of equipment.
- Categorizing PDs according to type (using the proposed methodology) and understanding the spatial distribution of acquired acoustic emissions (via the measuring device) enables the assessment of the severity of these phenomena and the associated risks to electrical equipment. The potential offered by the proposed technique can be further enhanced when integrated with regular acoustic inspections and the historical monitoring of the equipment.
- Finally, the technique greatly mitigates challenges associated with interpreting acoustic data in the electrical sector. Presently, acoustic signal interpretation heavily relies on the experience of inspectors and, often, the subjective act of listening to signals using headphones or auscultation devices. This reliance on human expertise inherently introduces limitations and inconsistencies. The proposed method offers a standardized approach, reducing reliance on individual experience and establishing a more reliable and objective framework for acoustic signal analysis.
The structure of this paper is outlined as follows. Section 2 presents the mathematical foundation underlying the proposed method. The experiments and the characteristics of the insulators tested in a laboratory are described in Section 3. Subsequently, Section 4 reports the evaluation and analysis of the measurements with the proposed technique. Section 5 substantiates the validation of the diagnostic approach, while Section 6 presents the concluding remarks and findings derived from this study.
2. Mathematical Basis of the Proposed Method
Two techniques underlie the evaluation of PDs in this paper: zero-crossing rate (ZCR) and fundamental frequency estimation. As will be discussed in the following sections, ZCR is a technique used to detect anomalies in audio frames. In this sense, anomalies are defined in this paper as the presence of recurrent and accentuated peaks in the ultrasound signal, which lead to changes in the ZCR result. When changes occur, the fundamental frequency is calculated and utilized to classify ultrasound signals as normal or abnormal. In the event of identifying anomalies, they can be categorized as corona or surface PDs, or may indicate the presence of an inconclusive phenomenon. The theoretical aspects of ZCR and fundamental frequency estimation are discussed below.
2.1. Zero-Crossing Rate (ZCR)
The zero-crossing rate (ZCR) of an audio measurement represents the rate of changes of the signal during a frame. In other words, it is equal to the number of times the signal modifies from a positive to a negative value, divided by the length of the frame [], in the following manner:
where is the function (2), is the frame length, is the instantaneous value and is the number of the sample. In this case, the ZCR result is dimensionless.
Moreover, ZCR may also reflect, in a coarse manner, the spectral characteristics of a signal [].
2.2. Fundamental Frequency Estimation
Frequency estimation is performed through the power spectral density (PSD). The PSD technique describes how the power content of a signal distributes as a function of the frequency. The power spectrum is obtained from the Fourier transform of the autocorrelation function of the acoustic signal. The autocorrelation function is a powerful mathematical tool to evidence repeating patterns, such as an unknown periodic signal hidden by noise. Additionally, it can identify the fundamental frequency of a signal with harmonics through the linear relationship between delayed values in a time-series data [,].
For random signals, the periodogram power spectral density () is given by (3);
where is the evaluation, that is, the mathematical expectation.
Considering a finite amount of data with lengths equal to , (3) can be rewritten as (4):
where is the discrete-time Fourier transform (DTFT) of the windowed signal, which in turn is given by (5). The rectangular window has the same length as the input signal and the frequency sample is equivalent to 256 kHz.
Through PSD, the fundamental frequency and harmonics characteristics can be calculated, as performed in Section 4.
3. Laboratory Experiments
The purpose of laboratory tests is to produce different types and intensities of PDs in a chain of HV glass insulators. PDs are generated during an increase in the applied voltage. Artificial pollution was applied to the insulators to replicate real operational conditions that may influence the occurrence of PDs. For each voltage step, ultrasound measurements were made at a fixed distance.
The measurement methodology, the description of the artificial pollution and the ultrasound measurement process are described below.
3.1. Measurement Methodology
The methodology of the laboratory experiments is shown in Figure 3.
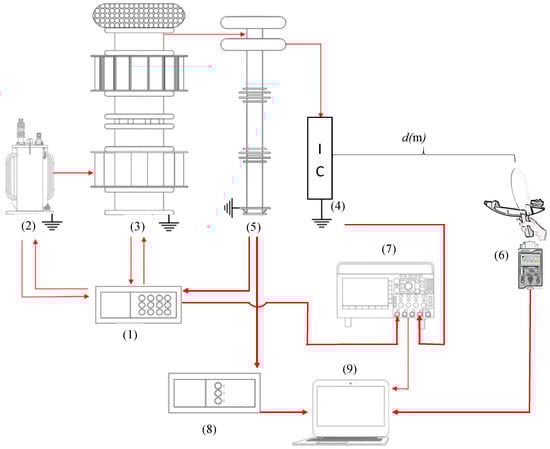
Figure 3.
Experimental method organization.
The equipment illustrated in Figure 3 consists of:
- Resonant controller;
- Power transformer;
- Resonant source;
- Device under test—insulator chain (IC);
- Capacitive divider;
- Digital Digital ultrasound testing device, positioned at a distance of 12.5 m from the device under test;
- Oscilloscope;
- Acquisition system of the capacitive divider;
- Computer.
In the tests, a chain of HV glass insulators with three elements was used, in which different types of artificial pollution were applied. The technical sheet of the insulator is presented in [].
3.2. Description of Artificial Pollution
The tests are intended to reproduce real conditions, to which an insulator chain, as presented in Figure 4a, may be subjected. For example, the formation of a conductive microfilm deposited by rain, wind, or other environmental conditions; the presence of mud, which can be formed by dust and/or bird droppings; and partial damage and degradation.
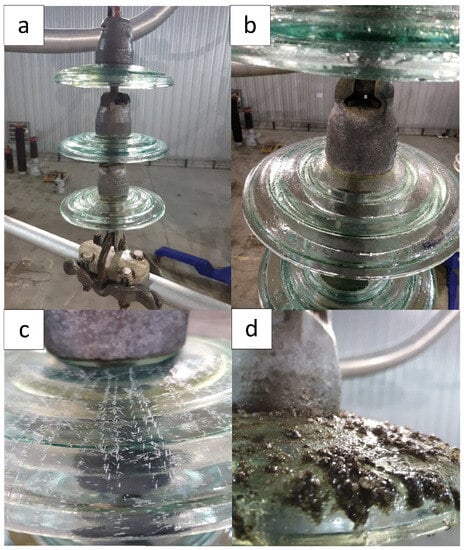
Figure 4.
(a) Clean and undamaged insulator chain; (b) total pollution with saline solution; (c) partial and surface damages; (d) partial pollution with mud.
The first case is illustrated in Figure 4b and it is characterized by a conductive microfilm produced with saline pollution, distributed partially or totally along the superficies of the insulators. For the second case, mud pollution (a mixture of soil and water) was applied as shown in Figure 4c. Finally, partial damage was performed on the surface of the insulator. In Figure 4d, small cracks are perceptible in the insulator.
Table 1 shows the condition of the insulators and the voltage range used in the laboratory experiments. The insulator chain was subjected to voltage levels ranging from 10 kV to the highest level supported by the laboratory’s resonant source, until the overcurrent protection system intervened.

Table 1.
Test cases.
Importantly, the maximum voltage levels depend on the conditions of the insulator (pollution levels) and on environmental conditions, since humidity and temperature influence the occurrence of PDs, owing to either favorable or unfavorable ionization conditions in the air. Therefore, laboratory tests carried out on days with distinct environmental conditions with the same chain of insulators may lead to different maximum voltage levels required for partial dielectric breakdown.
3.3. Ultrasound Measurement Process
Ultrasound measurements were made at a fixed distance of 12.5 m with a sampling rate of 256 kHz during a period of 10 s. The measurements are composed of raw audio signal sized in microvolts and frequency spectrum, both time-varying. Figure 5, Figure 6, Figure 7, Figure 8, Figure 9, Figure 10 and Figure 11 show the amplitude and frequency spectrogram for each test case under different voltage intensities.
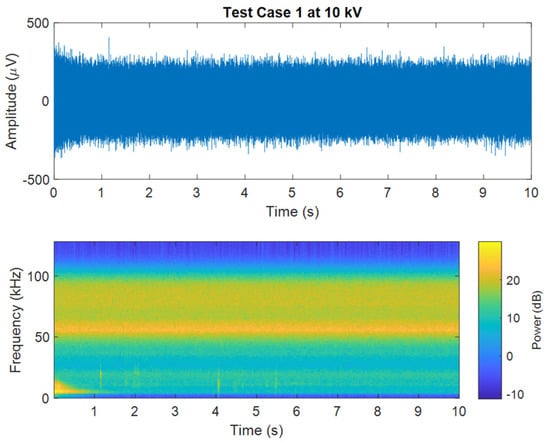
Figure 5.
Amplitude and frequency spectrogram of the ultrasound signal for Test Case 1 at 10 kV.
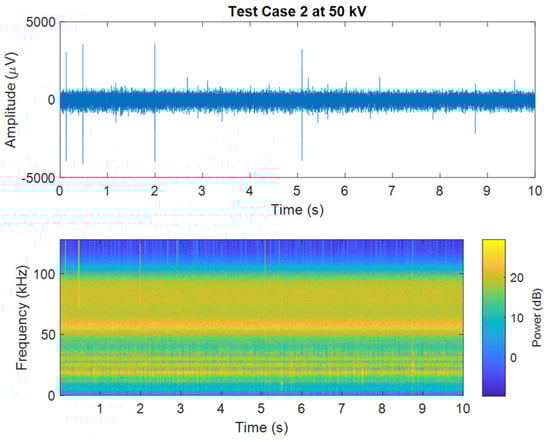
Figure 6.
Amplitude and frequency spectrogram of the ultrasound signal for Test Case 2 at 50 kV.
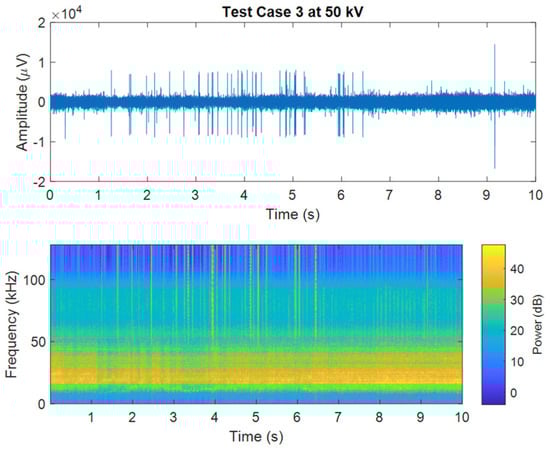
Figure 7.
Amplitude and frequency spectrogram of the ultrasound signal for Test Case 3 at 50 kV.
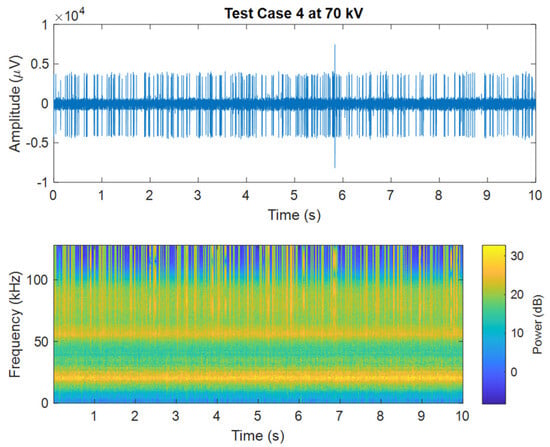
Figure 8.
Amplitude and frequency spectrogram of the ultrasound signal for Test Case 4 at 70 kV.
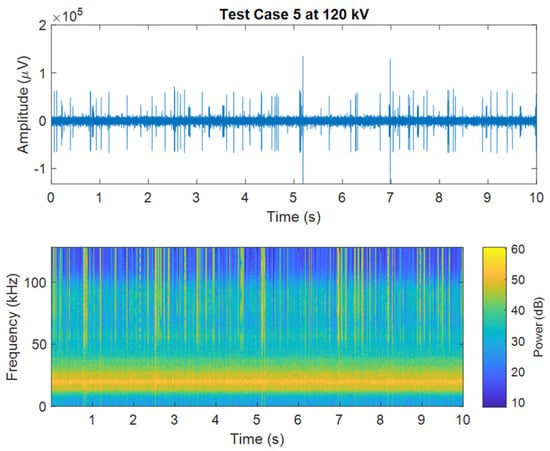
Figure 9.
Amplitude and frequency spectrogram of the ultrasound signal for Test Case 5 at 120 kV.
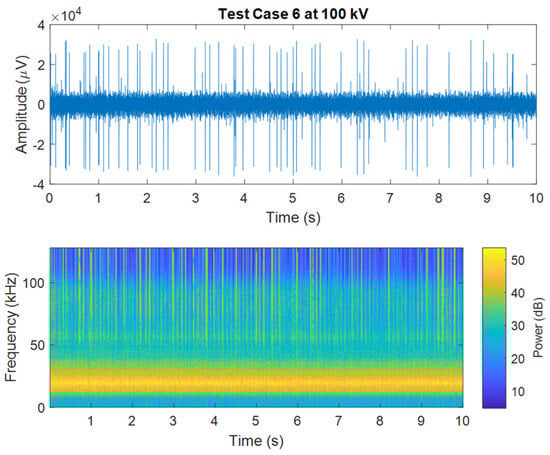
Figure 10.
Amplitude and frequency spectrogram of the ultrasound signal for Test Case 6 at 100 kV.
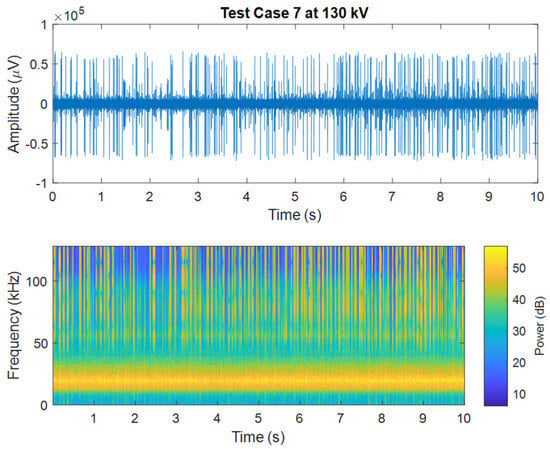
Figure 11.
Amplitude and frequency spectrogram of the ultrasound signal for Test Case 7 at 130 kV.
The 10 s measurement time has been demonstrated to be adequate for capturing the occurrence of PDs. This duration also allows the operator to maneuver the digital ultrasound tester along the insulator chain without experiencing fatigue or shaking, thereby facilitating field measurements.
It can be seen that the development in the degradation of the insulation capacity of the HV glass insulators has a behavioral trend. This tendency is marked by a gradual increase in the amplitude of the ultrasound signal, ranging from values close to 500 V at 10 kV (see Figure 5) and reaching values approximately equal to 50,000 V for a voltage of 120 kV (see Figure 10). This represents an increase of 100 times in the amplitude of the ultrasound signal. The occurrence of high-frequency components can also be seen in the spectrogram, marked by the presence of frequencies in the order of 20 kHz for HV and relative insulation degradation.
4. Application of the Proposed Method
Based on the ultrasound measurements performed, as well as on the mathematical foundation provided in Section 2, a method is proposed for identifying and classifying PDs in HV glass insulators. This approach is based on the ZCR evaluation to identify anomalies in the ultrasound signal. If there is an anomaly, a fundamental frequency estimation technique is used to classify the type of the PD, as described in Section 2.
4.1. ZCR Evaluation for the Test Cases
Figure 12 shows the ZCR evaluation for the test cases.
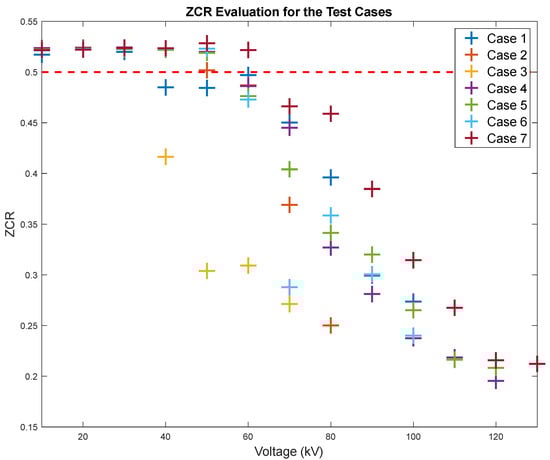
Figure 12.
ZCR evaluation for the test cases.
The pattern depicted in Figure 12 clearly demonstrates the ability to detect PDs using the ZCR technique. It is essential to note that this pattern has undergone validation in a HV laboratory setting, and Section 5 provides further explanation for the reader’s comprehension.
In Figure 12, a distinct behavior pattern emerges, wherein the ZCR remains relatively constant for low voltages. However, as the voltage increases within the range of 40 to 60 kV (depending on the specific case), the ZCR experiences a notable decrease. These decreases, with values below 0.5, are accompanied by discernible peaks in the acoustic raw signal, which are strongly correlated with PDs occurrences. This characteristic serves as a clear indication of anomalies present within the ultrasound signal, thus confirming the presence of PDs.
This observation confirms the effectiveness and reliability of the proposed methodology in identifying and characterizing PDs. The ability to discern such abnormalities through the analysis of the ZCR and associated acoustic raw signals further reinforces the diagnostic capabilities of the technique.
4.2. Fundamental Frequency Estimation for the Test Cases
The fundamental frequency via the periodogram method for each test case is shown in Table 2. The “-” notation represents the lack of measurements, that is, the source overcurrent relay was triggered by a short-circuit.
Table 2.
Fundamental frequency estimation.
The relationship between PD types and the estimated frequencies has been established through numerous HV laboratory tests, comparing the results of the proposed methodology with measurements of apparent electrical charges. This comparison has provided validation for the diagnostic approach, with further details discussed in Section 5.
As outlined in Table 2, the estimated frequencies around 60 Hz (indicated in yellow) signify the presence of corona discharges. Essentially, electric charges accumulate during the crest of the voltage waveform, leading to intermittent sparking that occurs at the same frequency as the voltage, i.e., 60 Hz. In this context, Figure 13 illustrates the comparison between the ultrasound signal from Test Case 1, where a voltage of 90 kV was applied, and a sine wave at 60 Hz.
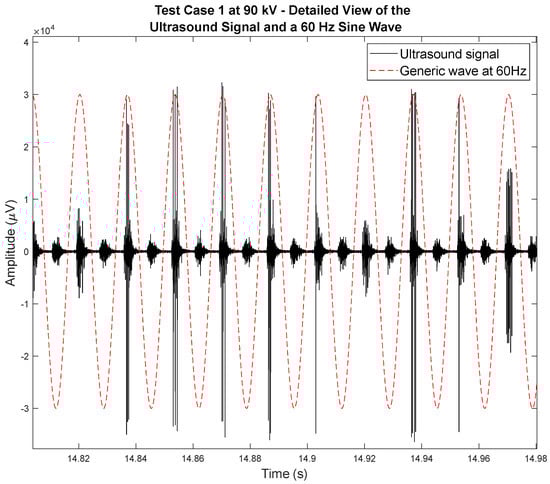
Figure 13.
Ultrasound signal with the presence of corona discharges for Test Case 1 at 90 kV.
During the laboratory experiments, as the applied voltage increases, a fundamental frequency with values close to 20 kHz (indicated in red) emerges in the spectrogram. This frequency indicates the likelihood of superficial PDs occurrences, which are, usually, more damaging to equipment than corona discharges and have a frequency near the audible range (below 20 kHz). Superficial discharges are generally more detrimental to electrical equipment as they generate heat, emit ultraviolet radiation and form chemical compounds such as ozone and nitric acid. Additionally, surface-type PDs can lead to the phenomenon of “treeing channels” in more advanced stages. It is worth noting, however, that corona discharges also pose a significant threat to the integrity and performance of the insulation system as they indirectly contribute to the deterioration of dielectrics by generating ozone.
Finally, it is crucial to emphasize that, in this paper, the concept of superficial PDs incorporates both dry surface discharges, also known as dry band arcing (DBA), and wet surface discharges, when detecting faulty insulators.
4.3. Algorithm for Classification of PDs
The proposed approach calculates ZCR and, if it is greater than 0.5, the equipment is considered to be operating in normal conditions. However, an anomaly is detected for a ZCR lower than 0.5. If there is an anomaly, the fundamental frequency is estimated. If the frequency presents intensities approximately equal to 60 Hz—between 59 Hz and 61 Hz—the PD is characterized as a corona discharge. If the estimated frequency presents values close to 20 kHz—between 18 kHz and 22 kHz—the PD is identified as a superficial type. If none of these conditions are met, an inconclusive result is obtained and a new measure is required.
Figure 14 shows the method flowchart for identifying and classifying PDs based on ultrasound measurements.
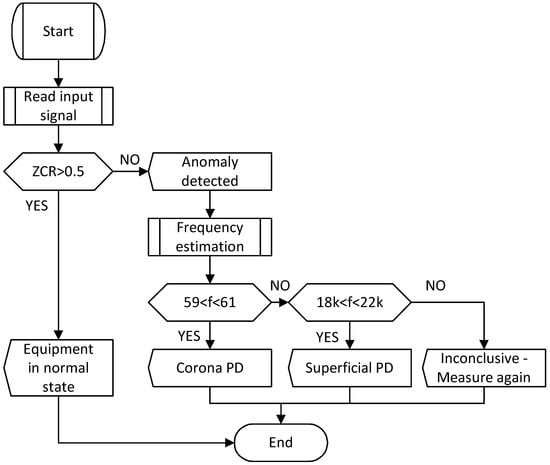
Figure 14.
Methodology flowchart for identifying and classifying PDs based on ultrasound measurements.
The proposed method output for the cases is shown in Table 3.
Table 3.
Results of the proposed method for classification of PDs.
In general, PDs undergo a transition from a normal behavior (N) to the presence of an anomaly (AI, AC, or AS) in the acquired ultrasonic signals as the voltage is increased. At lower voltage levels (between 60 and 90 kV), the anomaly is represented by corona discharges (AC), which then progress to surface discharges (AS) at higher voltages. The presence of surface discharges, characterized by the emission of acoustic signals with frequency components within the audible range, can indicate a stage of the phenomenon that is close to the formation of an electrical arc [].
The identification of surface PDs for cases 3 and 6, subjected to voltages equal to 60 kV and 70 kV, respectively, can be attributed to the presence of pollution from saline solution or mud on all elements of the insulator chain, affecting the electrical conductivity of the medium. This may lead to DBA, which ceases if the generated heat completely dries out the pollution layer.
Identifying a surface PD for Case 7 at a voltage level of 80 kV may indicate the formation of a dry and localized flashover (a transient breakdown event where the insulation momentarily fails due to the combined effects of contamination and high electric field) that regressed to a corona discharge. It is important to note that the process of PD formation may exhibit instabilities, whereby it can abruptly cease, persist or progress in severity in an uncertain manner depending on changes in the electrical characteristics of the surrounding medium. An example of this is when the phenomenon progresses in severity when the wetting rate exceeds the drying rate of the pollution layers deposited on the dielectric surfaces.
Uncertainties and inconclusive cases (AI) arise from various factors that impact the occurrence and measurement of PDs. These factors encompass a range of influences, such as environmental conditions and external noise, which can affect the accuracy and reliability of PD assessments. Notably, environmental conditions play a significant role, with humidity emerging as a factor influencing the absorption of ultrasound waves by the air []. However, despite the inherent complexities and potential sources of uncertainty, the proposed method demonstrates the capability to identify abnormal conditions in electrical equipment, as evidenced by the results presented in Table 3. In such situations, it is highly recommended to establish a routine monitoring program for the equipment and conduct further measurement campaigns to gain a more accurate understanding of the underlying factors at play.
5. Validation of the Proposed Method
To validate the proposed methodology, a comparative analysis was conducted using apparent charge signals and phase-resolved partial discharge (PRPD) patterns. The comparison was made for a heavily contaminated insulator chain scenario where all three elements were affected, and the results are presented in Table 4. The attributes of interest in these kinds of measurements include the phase angle and polarity of PDs, the frequency and regularity of impulses, changes in magnitude relative to the test voltage and the ratio between the ignition and extinction voltages of the PDs, as stated in [].
Figure 15 shows the spectrogram for a voltage of 60 kV applied in the insulator chain. The ZCR value is 0.5209, and the estimated fundamental frequency is 54.316 kHz, indicating a normal condition according to the proposed methodology. Similarly, the PRPD analysis and interpretation on apparent charge signals, as illustrated in Figure 16, reveal a situation of normality.
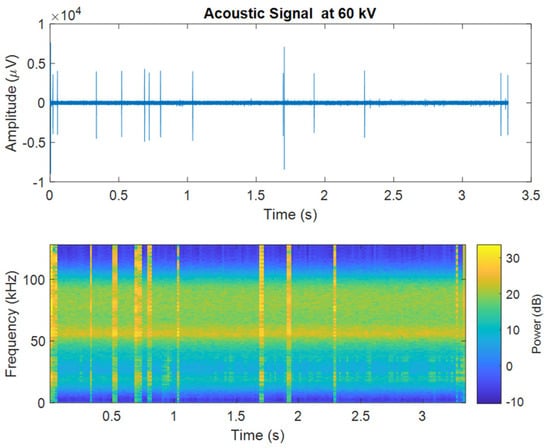
Figure 15.
Amplitude and frequency spectrogram of the ultrasound signal for validation of the proposed method at 60 kV.
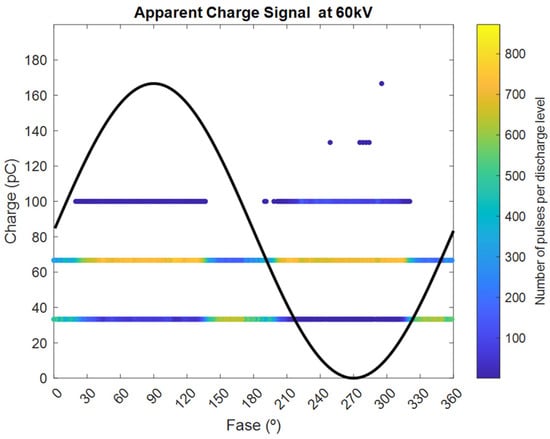
Figure 16.
Apparent charge signal at 60 kV.
Conversely, an irregularity is observed, following the analysis of the acoustic signal depicted in Figure 17, with a ZCR and fundamental frequency amounting to 0.3856 and 59.9959, respectively. These attributes align with the corona discharge concept proposed in this study. Reinforcing this, Figure 18 displays apparent charge measurements for corona discharge []. Regular magnitude impulses can be seen, occurring near the voltage waveform peaks.
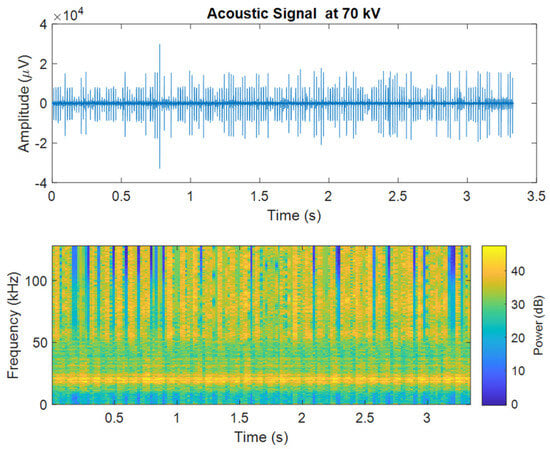
Figure 17.
Amplitude and frequency spectrogram of the ultrasound signal for validation of the proposed method at 70 kV.
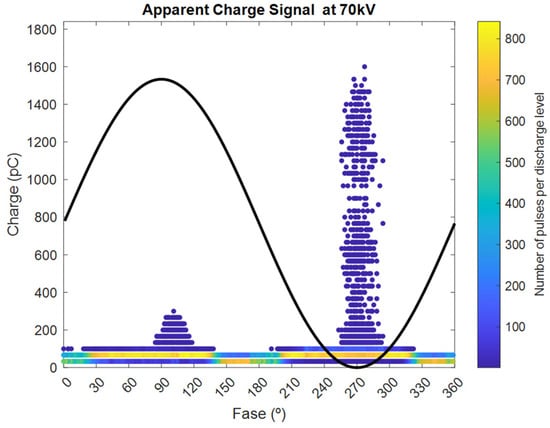
Figure 18.
Apparent charge signal at 70 kV.
Another irregularity is discerned in the spectrogram presented in Figure 19 when the voltage level attains 80 kV. Under these circumstances, the ZCR and fundamental frequency yield values of 0.2713 and 18.316 kHz, respectively. Based on the methodology, these values imply a surface discharge. In this context, Figure 20 demonstrates impulses with increasing intensities from the zero-crossing point to the voltage signal peak (occasionally surpassing this value). This pattern is generally representative of superficial PDs [].
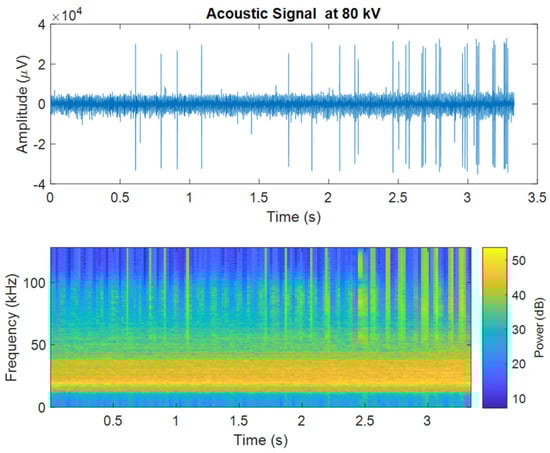
Figure 19.
Amplitude and frequency spectrogram of the ultrasound signal for validation of the proposed method at 80 kV.
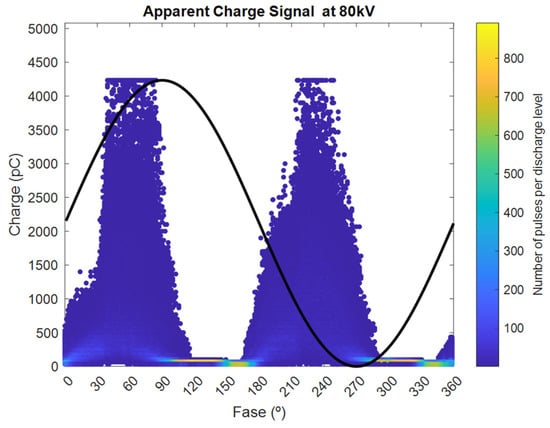
Figure 20.
Apparent charge signal at 90 kV.
Table 4.
Validation of the proposed method.
Table 4.
Validation of the proposed method.
| Voltage (kV) | 60 | 70 | 80 |
|---|---|---|---|
| ZCR | 0.5209 | 0.3856 | 0.2713 |
| Fundamental Frequency Estimation (Hz) | 54.316 k | 59.9959 | 18.316 k |
| Result of the Proposal | Normal | Anomaly Corona | Anomaly Superficial |
| Amplitude and Frequency Spectrogram | Figure 15 | Figure 17 | Figure 19 |
| PRPD and interpretation | Normal | Corona | Superficial |
| PRPD Apparent Charge Signals | Figure 16 | Figure 18 | Figure 20 |
6. Measurements in Field
In order to assess the effectiveness of the technique in actual field conditions, ultrasound measurements were conducted at a 230 kV substation. It was discovered that there were two insulation chains with PDs, both located at the entrance of the substation. A visual inspection of Figure 21 and Figure 22 reveals that the vertical insulation chains are noticeably dirtier compared to the horizontal ones. Therefore, it can be inferred that this condition is responsible for the occurrence of corona and superficial discharge phenomena, which were identified in the measurements and confirmed by the proposed technique. The results obtained from the method are presented in Table 5.
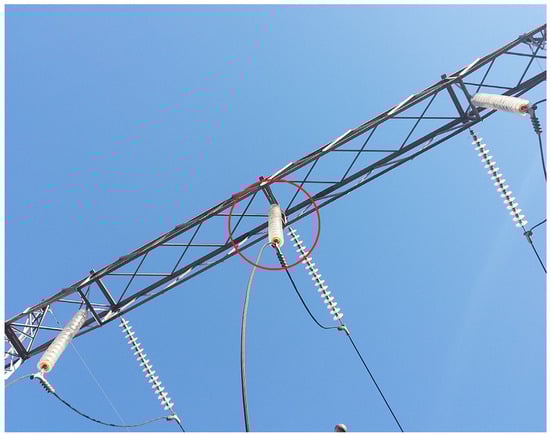
Figure 21.
In this insulation chain of 230 kV, corona-type partial discharge was found to be present specifically in phase B.
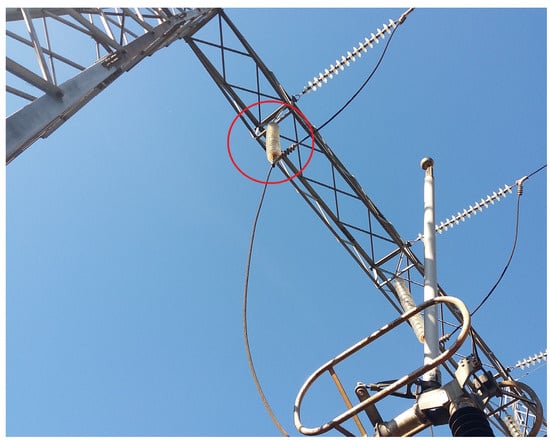
Figure 22.
In this insulation chain of 230 kV, superficial-type partial discharge was found to be present specifically in phase A.
Table 5.
The outcomes achieved from the suggested approach in practical situations.
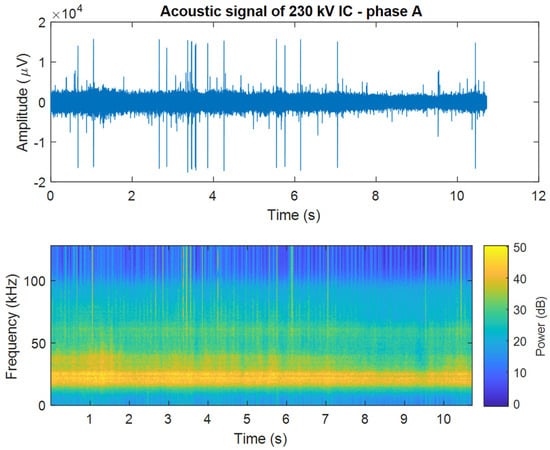
Figure 24.
Amplitude and frequency spectrogram of the ultrasound signal captured from the insulation chain of Figure 22.
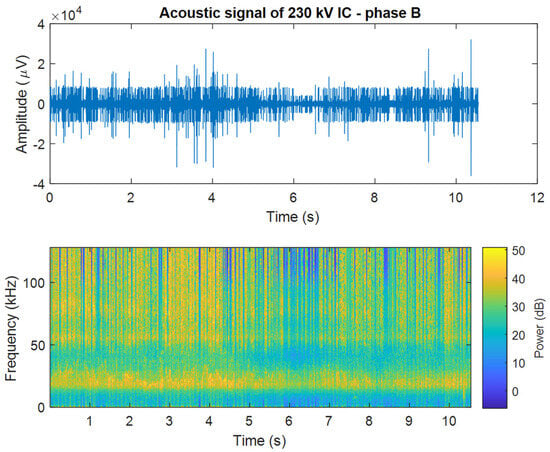
Figure 23.
Amplitude and frequency spectrogram of the ultrasound signal captured from the insulation chain of Figure 21.
7. Conclusions
Identification and classification of PDs through acoustic inspection can be a powerful predictive maintenance tool. Raw acoustic signals, without any pre-processing and covering a wide frequency range (from 0 to 128 kHz), contain a large amount of information, both in the audible spectrum (<20 kHz) and in the ultrasound spectrum (>20 kHz). When appropriate techniques are applied, they can provide a more accurate diagnosis of PDs.
Seven test cases of artificial pollution on HV glass insulators were performed, producing a total of seven cases with different physical conditions and different voltage levels, such as mud build-up, conductive microfilm formation and damage. Thus, some conditions may be more favorable to the formation of PDs than others, as can be seen considering the different voltages achieved.
By using the zero-crossing rate, a trigger is created for detecting abnormal operating conditions, and the fundamental frequency estimate provides a diagnosis of the type of PD; thus, PDs can be classified in terms of severity and maintenance can be planned in advance, contributing to a higher level of power system safety and reliability at lower costs.
Although this study is based on experimental data from laboratory-tested insulator chains, the proposed method can be extended to other scenarios and equipment that require the diagnosis of partial discharges (provided they are external phenomena) through acoustic inspection.
It is noteworthy that environmental conditions influence the appearance of partial discharges, that is, measurements on different days can lead to different diagnoses. In this way, monitoring evolution regarding the type of PD can be a viable alternative to avoid making wrong decisions. By executing regular monitoring procedures and follow-up measurement campaigns, a more comprehensive comprehension of the underlying conditions can be attained, thereby enabling informed decision-making and proactive maintenance strategies.
Author Contributions
Conceptualization, K.M. and G.C.J.; methodology, K.M.; validation, K.M. and G.C.J.; formal analysis, K.M.; investigation, K.M.; resources, A.L.O.; data curation, A.M.M. and A.S.B.; writing—original draft preparation, K.M. and L.F.F.-G.; writing—review and editing, L.F.F.-G. and J.S.D.; supervision, A.L.O.; project administration, E.F.M.; funding acquisition, C.H.C. All authors have read and agreed to the published version of the manuscript.
Funding
This research was funded by CPFL Transmission through the project PD-05785-2107/2021—DE2107: “Methodology for aging assessment of insulation in instrument transformers and surge arresters through ultrasonic measurements of partial discharges,” conducted under the Electric Sector Research and Development (R&D) Program, regulated by the Agência Nacional de Energia Elétrica (ANEEL) of Brazil. Partial support was also provided by the Coordenação de Aperfeiçoamento de Pessoal de Nível Superior—Brazil (CAPES/PROEX)—Finance Code 001.
Data Availability Statement
Not applicable.
Acknowledgments
The authors would like to acknowledge the R&D Program of ANEEL, for enabling the execution of this scientific research. The investigations and experiments described in this paper are associated with the project PD-05785-2107/2021—DE2107: “Methodology for aging assessment of insulation in instrument transformers and surge arresters through ultrasonic measurements of partial discharges”, carried out by CPFL Transmission and UFSM, the Federal University of Santa Maria.
Conflicts of Interest
The authors declare no conflict of interest.
References
- IEC Standard 60060-1:2010; High Voltage Test Techniques, Part 1: General Definitions and Test Requirements. International Electrotechnical Commission: Geneva, Switzerland, 2010.
- Küchler, K. High Voltage Engineering: Fundamentals, Technology, Applications; Springer: Berlin/Heidelberg, Germany, 2018. [Google Scholar]
- IEC Standard 60060-2:2010; High Voltage Test Techniques, Part 2: Measuring Systems. International Electrotechnical Commission: Geneva, Switzerland, 2010.
- Lundgaard, L.; Runde, M.; Skyberg, B. Acoustic diagnosis of gas insulated substations: A theoretical and experimental basis. IEEE Trans. Power Deliv. 1990, 5, 1751–1760. [Google Scholar] [CrossRef]
- Howells, E.; Norton, E.T. Detection of Partial Discharges in Transformers Using Acoustic Emission Techniques. IEEE Trans. Power Appar. Syst. 1978, PAS-97, 1538–1549. [Google Scholar] [CrossRef]
- He, Y. An overview of acoustic emission inspection and monitoring technology in the key components of renewable energy systems. Mech. Syst. Signal Process. 2021, 148, 107146. [Google Scholar] [CrossRef]
- Maraaba, L.; Al-Soufi, K.; Ssennoga, T.; Memon, A.M.; Worku, M.Y.; Alhems, L.M. Contamination Level Monitoring Techniques for High-Voltage Insulators: A Review. Energies 2022, 15, 7656. [Google Scholar] [CrossRef]
- Corso, M.P.; Perez, F.L.; Stefenon, S.F.; Yow, K.-C.; Ovejero, R.G.; Leithardt, V.R.Q. Classification of Contaminated Insulators Using k-Nearest Neighbors Based on Computer Vision. Computers 2021, 10, 112. [Google Scholar] [CrossRef]
- Stefenon, S.F.; Zanetti Freire, R.; dos Santos Coelho, L.; Meyer, L.H.; Bartnik Grebogi, R.; Gouvêa Buratto, W.; Nied, A. Electrical Insulator Fault Forecasting Based on a Wavelet Neuro-Fuzzy System. Energies 2020, 13, 484. [Google Scholar] [CrossRef]
- Stefenon, S.F.; Ribeiro, M.H.; Nied, A.; Mariani, V.C.; Coelho, L.D.; Leithardt, V.R.; Silva, L.A.; Seman, L.O. Hybrid Wavelet Stacking Ensemble Model for Insulators Contamination Forecasting. IEEE Access 2021, 9, 66387–66397. [Google Scholar] [CrossRef]
- Nasir, A.; Al-geelani, M.; Piah, A.M.; Shaddad, R.Q. Characterization of acoustic signals due to surface discharges on H.V. Glass insulators using wavelet radial basis function neural networks. Appl. Soft Comput. 2012, 12, 1239–1246. [Google Scholar] [CrossRef][Green Version]
- Nasir, A.; Al-geelani, M.; Piah, A.M.; Bashir, N. A review on hybrid wavelet regrouping particle swarm optimization neural networks for characterization of partial discharge acoustic signals. Renew. Sustain. Energy Rev. 2015, 45, 20–35. [Google Scholar] [CrossRef]
- Mahmoudi, J.; Moussavi, S.Z.; Naderi, P. Partial discharge diagnosis of ceramic pin insulators considering cost-worth analysis: Case study in a medium voltage feeder. IEEE Trans. Dielectr. Electr. Insul. 2017, 24, 2493–2502. [Google Scholar] [CrossRef]
- Stefenon, S.F.; Seman, L.O.; Neto, N.F.; Meyer, L.H.; Nied, A.; Yow, K.C. Echo State network applied for classification of medium voltage insulators. Int. J. Electr. Power Energy Syst. 2022, 134, 107336. [Google Scholar] [CrossRef]
- Giannakopoulos, T.; Pikrakis, A. Introduction to Audio Analysis: A MATLAB Approach; Elsevier: Amsterdam, The Netherlands; Academic Press: Cambridge, MA, USA, 2014. [Google Scholar]
- Erman, L.D. An Environment and System for Machine Understanding of Connected Speech. Ph.D. Thesis, Stanford University, Stanford, CA, USA, 1974. [Google Scholar]
- Guimarães, D.A. Digital Transmission: A Simulation-Aided Introduction with VisSim/Comm; Springer Science & Business Media: Berlin/Heidelberg, Germany, 2010. [Google Scholar]
- Poularikas, A.D. Understanding Digital Signal Processing with MATLAB and Solutions; CRC Press: Boca Raton, FL, USA, 2017. [Google Scholar]
- Electrovidro/Seves. Isoladores de Suspensão de Vidro Temperado SEDIVER; Electrovidro: Rio de Janeiro, Brasil, 2019; Available online: https://bit.ly/3vJSQWs (accessed on 1 May 2023).
- Dehlinger, N.; Stone, G. Surface partial discharge in hydrogenerator stator windings: Causes, symptoms, and remedies. IEEE Electr. Insul. Mag. 2020, 36, 7–18. [Google Scholar] [CrossRef]
- Lundgaard, L.E. Partial discharge. XIII. Acoustic partial discharge detection-fundamental considerations. IEEE Electr. Insul. Mag. 1992, 8, 25–31. [Google Scholar] [CrossRef]
Disclaimer/Publisher’s Note: The statements, opinions and data contained in all publications are solely those of the individual author(s) and contributor(s) and not of MDPI and/or the editor(s). MDPI and/or the editor(s) disclaim responsibility for any injury to people or property resulting from any ideas, methods, instructions or products referred to in the content. |
© 2023 by the authors. Licensee MDPI, Basel, Switzerland. This article is an open access article distributed under the terms and conditions of the Creative Commons Attribution (CC BY) license (https://creativecommons.org/licenses/by/4.0/).