Article

Nonlinear Loads in Lighting Installations—Problems and Threats

Department of Electrical Engineering, Czestochowa University of Technology, 42-200 Czestochowa, Poland
*
Author to whom correspondence should be addressed.
Energies 2023, 16(16), 6024; https://doi.org/10.3390/en16166024
Submission received: 22 May 2023 / Revised: 28 July 2023 / Accepted: 15 August 2023 / Published: 17 August 2023
(This article belongs to the Special Issue Improvements of the Electricity Power System II)

Abstract

:
Distorted currents drawn by nonlinear loads used in power installations (including lighting) can cause many problems. With the constantly progressing increase in the number of these loads, these phenomena can accumulate, constituting significant causes of serious failures in both electrical and electronic devices, as well as installation components. The effects of disturbances introduced to the network by nonlinear loads may include, for example, line overloads, overheating of transformers and motors, capacitor failures, accelerated degradation of insulation, etc. The article presents examples of measurement results for luminaires with discharge and LED sources. Measurements of the electrical parameters of a three-phase outdoor lighting installation consisting of luminaires with low-power LED sources and luminaires with discharge sources are also discussed. Based on the recorded waveforms, the measurement results were determined. High harmonic values for the phase currents and the current in the neutral conductor were recorded. The results of measurements of the parameters of LED luminaires with control systems, the operation of which causes excessive heat generation, are presented. The methodology for cable selection in circuits with current harmonics is described.

1. Introduction

According to the European Commission [1], the annual consumption of electricity in the EU by lighting products in 2015 reached an estimated value of 336 TWh. This represents 12.4% of the total electricity consumption of the 28 Member States and is equivalent to the greenhouse gas emissions represented by 132 million tonnes of carbon dioxide. In the case of Poland, street lighting alone, according to various estimates [2,3], consumes from 1500 to 2500 GWh of electricity and is responsible for a significant part of greenhouse gas emissions. Based on estimates, it is estimated that approximately 3.3 million street and road luminaires are used in Poland. Sodium and mercury sources dominate in lighting installations, accounting for up to 60% of emitters used. These sources are characterized by relatively low efficiency (about 40%), and the average age of such lighting installations is 15–30 years. It is estimated that, by 2030, LED technology will be used to illuminate all buildings and roads managed by the local government in the group of so-called "Progressive Cities" [3]. This is to improve the energy efficiency of municipalities, reduce CO 2 emissions, and reduce costs related to the fees for electricity consumption [4]. LED technology is far more energy-efficient than any previous light-emitting technology. Many innovative technologies are being developed around the world; e.g., PLEDs [5,6], which are intended to improve the efficiency of LED sources themselves or other elements of lighting installations [7]. The dynamically developing market of new LED technologies also generates many new threats related to the correct maintenance of the quality parameters of electricity in power supply networks. One of the reasons for the deterioration in the quality of electricity in networks containing LED sources is the use of rectifiers: switched-mode power supplies or electronic converter systems directly related to the operation of these sources. These are nonlinear loads, and this type of load causes distortion of the current and voltage waveforms in relation to the optimal sine wave and the appearance of higher harmonic current and voltage components in the power supply networks [8,9,10]. Figure 1 shows the current and voltage waveforms measured for the tested discharge source. As can be seen, the current waveform clearly deviates from the sinusoidal shape. European standards [11,12] precisely define these parameters for cases of clear exceedances.
The standard [11] defines the permissible levels of harmonic current emissions for the phase current of a load with a current value not greater than 16 A. It provides a division of devices into four classes, for which the limits of the content of individual harmonics are defined: class A—symmetrical three-phase loads, equipment for home use other that than belonging to class D, tools other than portable tools, light bulb dimmers, acoustic equipment, and all others types of equipment except those classified in one of the following classes; class B—portable tools (i.e., electric tools that, during normal operation, are held in the hands and used only for a short time (several minutes)) and non-professional welding equipment; class C—lighting equipment; class D—equipment with a power of 600 W or less of the following types: personal computers and monitors for them and television loads. Lighting loads, depending on the input active power, are divided into three groups: greater than 25 W (point 7.4.2 of the standard [11]), less than or equal to 25 W and greater than 5 W (point 7.4.3 of the standard [11]), and, thirdly, active input power less than or equal to 5 W (point 7.1 of the standard [11]). For lighting equipment with active input power greater than 25 W, current harmonics should not exceed the relative levels given in Table 2 of the standard [11]. For lighting equipment with active input power in the range from 5 W to 25 W, current harmonics should meet one of the three sets of requirements (point 7.4.3 of [11]). For commonly used analyses, the following requirement, quoted in detail from the standard, applies: “The value of the harmonic distortion factor in the THD I current must not exceed 70%. The value of the third harmonic current component, expressed as a percentage of the current value of the first component, must not exceed 35%, the value of the fifth harmonic current component must not exceed 25%, the value of the seventh current harmonic component must not exceed 30%, the value of the ninth and eleventh harmonic current components may not exceed 20% and the value of the second harmonic current component may not exceed 5%”.
Similarly, the standard [12] specifies (point 5.2) acceptable levels of harmonic content for R S C E = 33 (R S C E —the ratio of the short-circuit power of the power network to the rated power of the load). The value of the 3rd harmonic of the current, expressed as a percentage of the current of the 1st component, must not exceed 21.6%; the value of the 5th harmonic of the current must not exceed 10.7%; the value of the 7th harmonic of the current must not exceed 7.2%; the value of the 9th current harmonic must not exceed 3.8%; the 11th current harmonic must not exceed 3.1%; and the 13th current harmonic must not exceed 2%. This is presented in detail in Table 1.
In addition, in [14,15], the following interpretation for determining the occurrence of higher harmonic effects was adopted:
  • Between 10% and 50% indicates significant waveform distortion (group two). Some devices may not work properly. In this case, there may also be an increase in the temperature of the devices (lines and transformers). As a consequence, the parameters of power supply systems must be overestimated when designing;
  • Above 50% indicates a very large waveform distortion (group three). Device malfunction is highly probable. A detailed analysis of the problem and the installation of a system limiting the share of higher harmonics are necessary.
In cases of clear exceedances in many scientific works [16,17,18,19], authors recommend protecting the network against such situations by using LCL filters. In their opinion, this is a more advantageous solution than the use of LC filters due to the suppression of higher harmonics while maintaining the same inductance. Unfortunately, not everyone takes into account other aspects of the functioning of modern lighting installations in terms of dynamically developing control systems. Even minor disturbances can negatively affect the tasks assigned [20].
Unfortunately, in many operational situations, the use of passive or active filters alone may not fulfill this role [21,22,23,24]. In newly designed lighting installations, the already commonly used LED sources are selected for operation. Unfortunately, in many cases, lighting installations operate as mixed installations containing both LED sources and older metal halide, sodium, and incandescent lamps.
In this article, the authors want to articulate the problem of the correct selection of a lighting installation in which disturbances in the form of higher harmonics of current occur during operation.
Many authors draw attention in their publications [25,26,27] to the negative consequences of ignoring this phenomenon. Additional losses in active power are generated in transformers and power cables, the operating temperature of power devices increases, and the level of active power that can be transmitted through them decreases. In most installations, the selection of cross-sections of supply wires is undertaken for the determined values of maximum phase currents.
Designers do not take into account the control and ignore the harmonic components of lighting fixtures’ supply current, which may result in incorrect operation of such installations and even their damage. Current distortions may not only be higher than the current standards allow but, in extreme cases, may be so large that they cause various types of failures [28,29]. In the further parts of the article, the authors describe such cases and the results of measurements in the tested lighting installations.

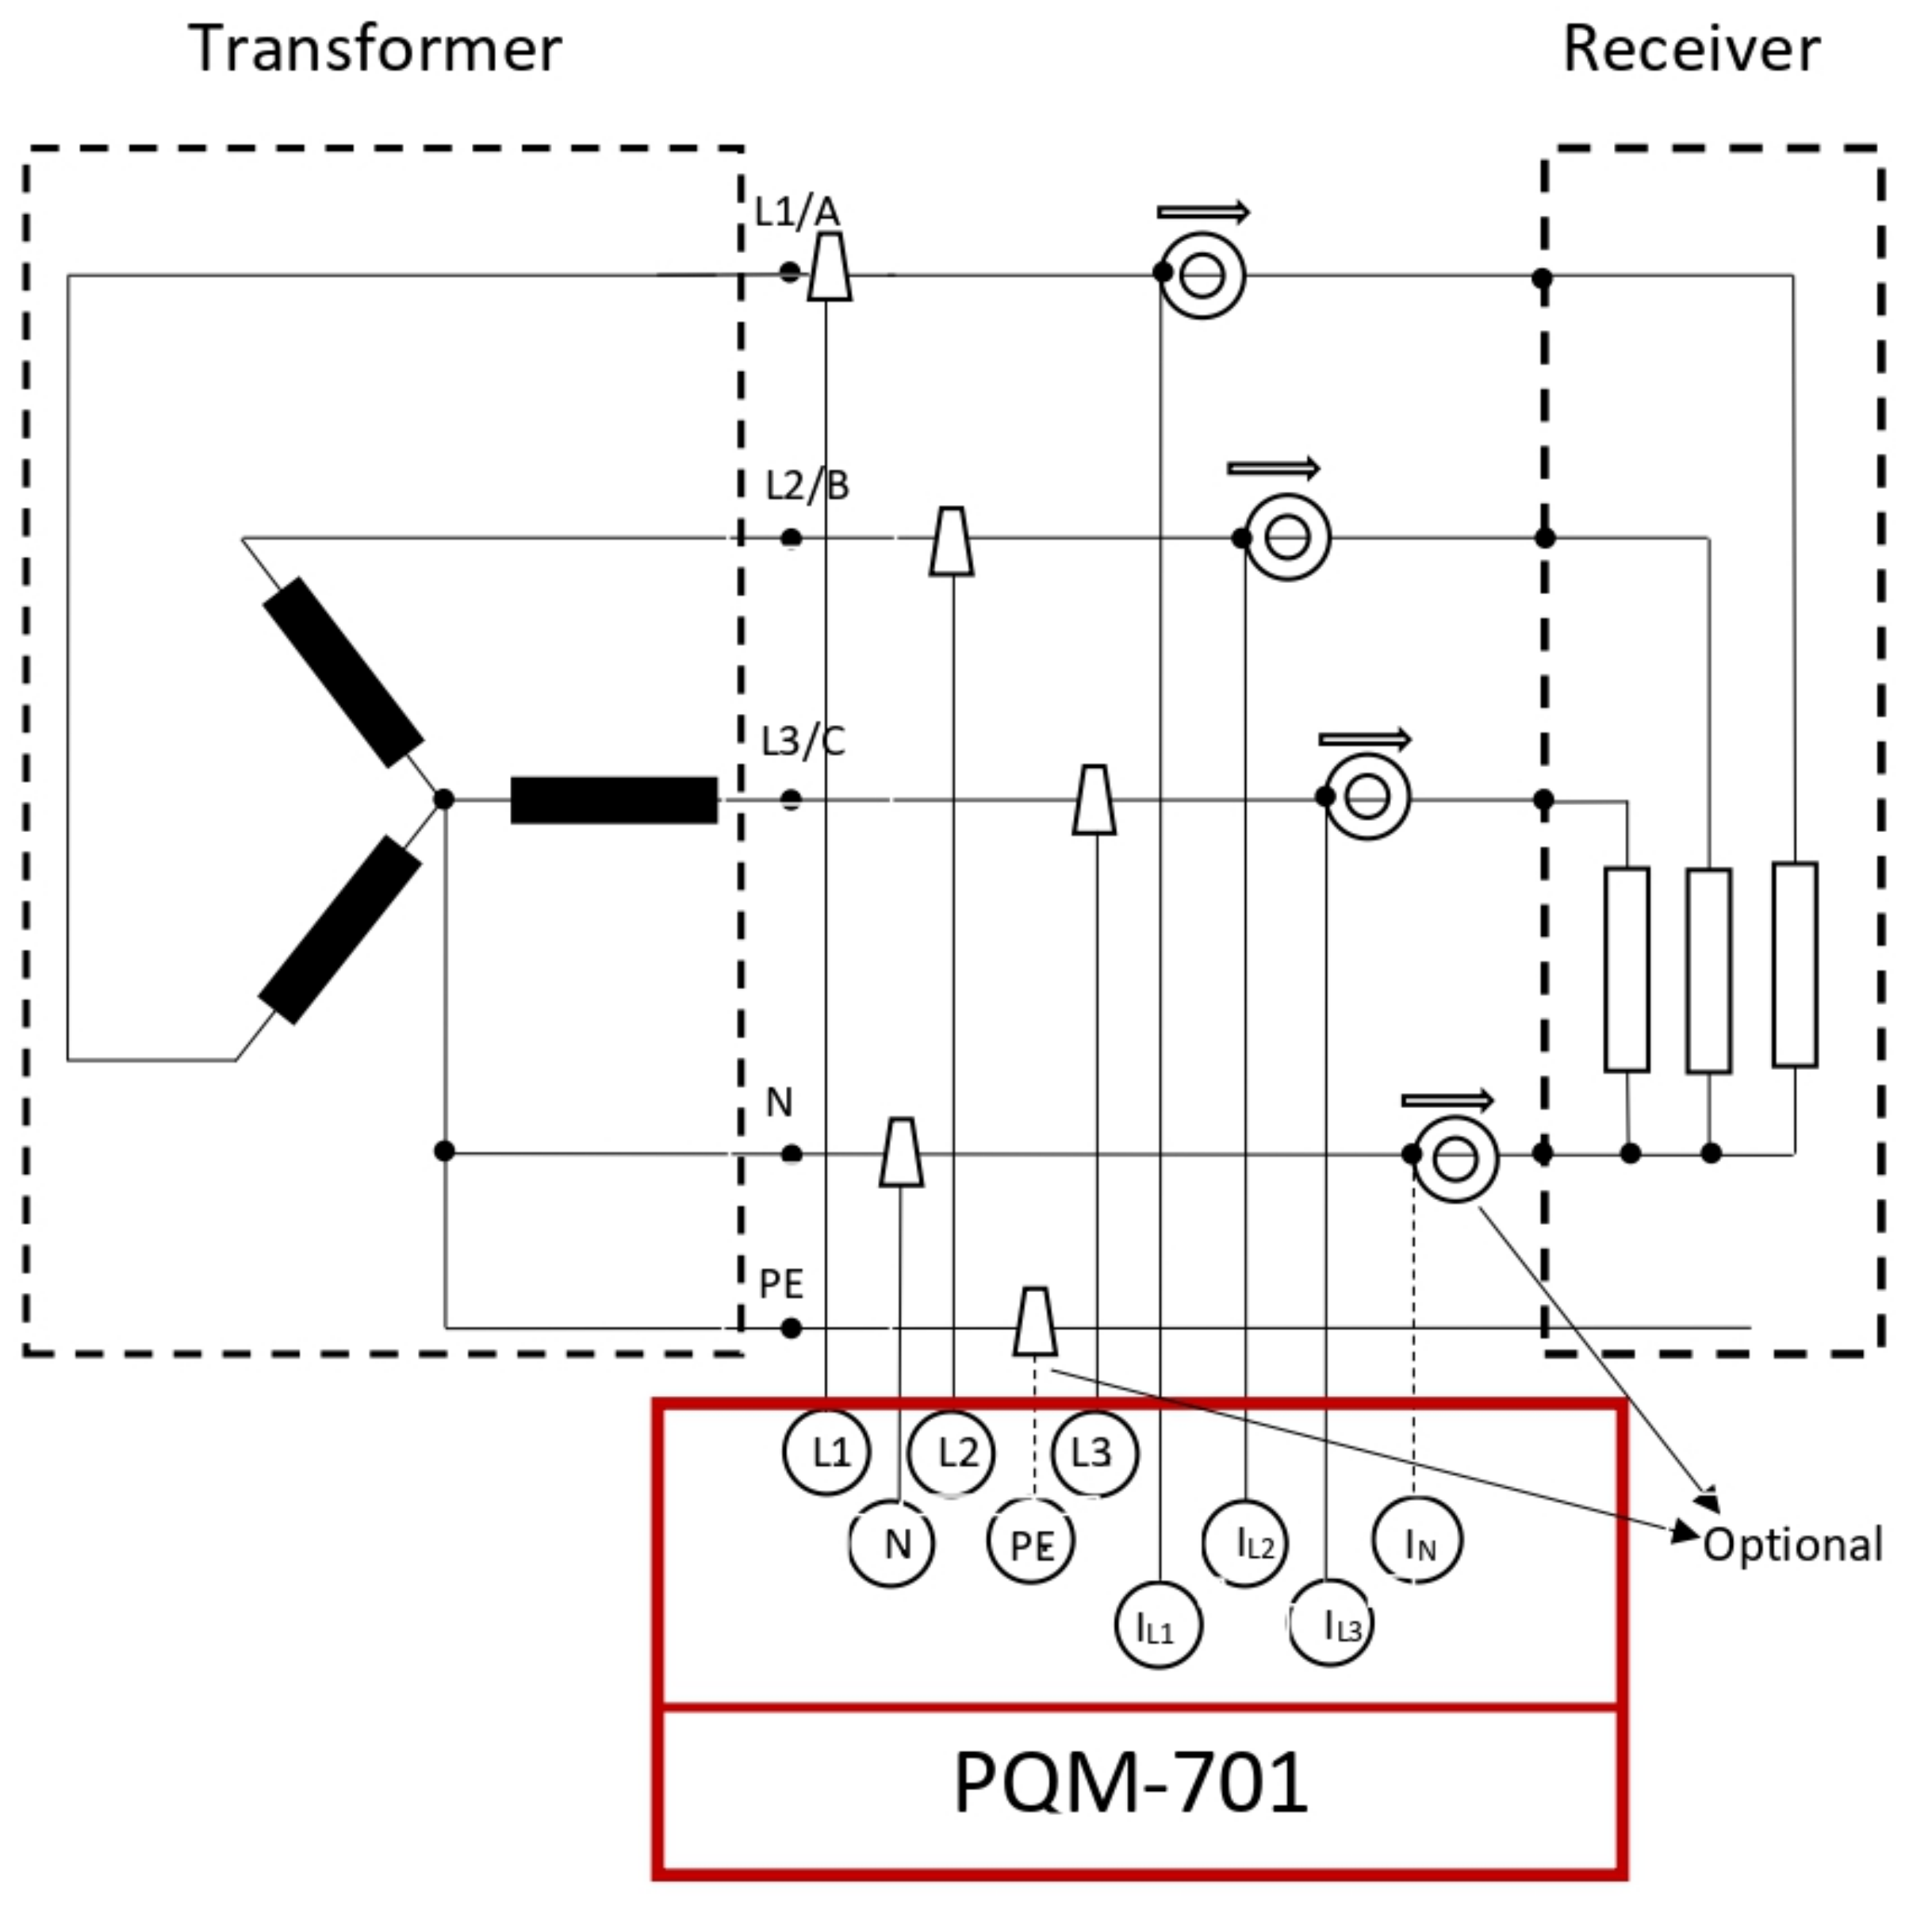
2. Methods of Measurement and Tests Carried Out

The issues raised in the article concern the analysis of various operating parameters of luminaires in various systems and their impact on the quality of electricity. With the growing use of new technologies in power supply systems for lighting installations, the problem of maintaining the parameters required by the standards defining the quality of electricity in power grids is intensifying. Figure 2 shows a diagram of the measuring system with which the measurements analyzed in the article were made.
From the many measurements made as part of the acceptance measurements and expert investigations carried out in the years 2010–2023, several characteristic ones that best illustrate the research problem were selected for testing. The presented results and further analyses concern both laboratory and industrial tests. Luminaires and sets of luminaires with discharge and LED sources were tested. All measurements of electrical parameters were obtained using certified power quality analyzers manufactured by Sonel (PQM-701 and PQM-707) together with accessories, which included current clamps and current transformers. The analysis of the results was supported by Sonel Analysis 4.6.5 SONEL’s proprietary software dedicated to these measuring devices, which is called Analysis. During the laboratory tests, the reference voltage source ITECH 7600 was used. In Figure 3, a single measurement and research cycle as carried out during the research is presented.

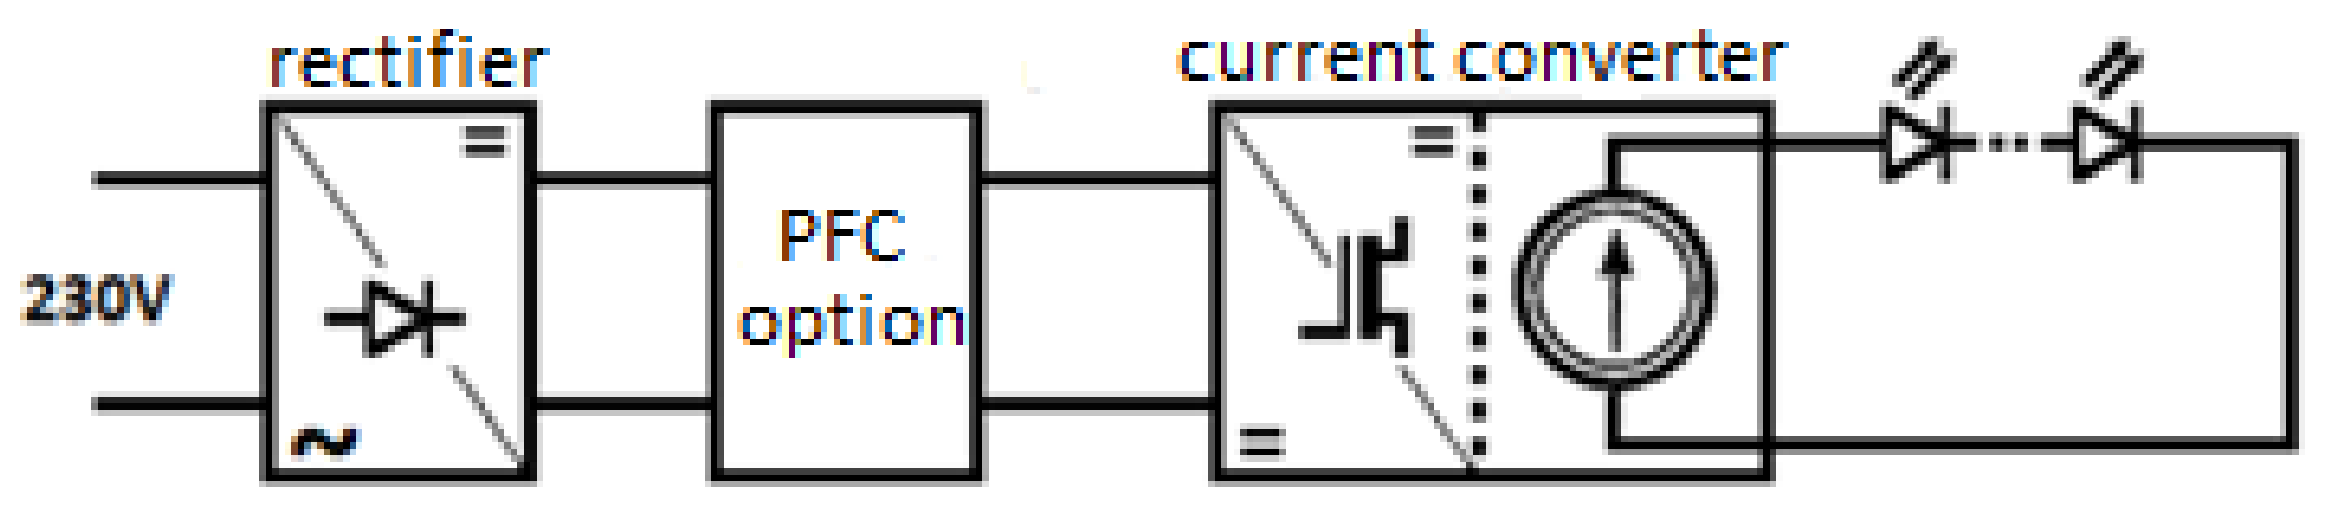
3. Analysis of Work Systems of Lighting Fixtures

According to the definition in [30], a luminaire is a device used to distribute, filter, and transform light emitted by at least one lamp (light source) that contains all the elements necessary to support, fix, and protect the lamps (sources), including, if necessary, auxiliary circuits, together with the elements needed to connect them to the mains, but not the lamps themselves (light sources).
The development of technology has resulted in the creation of luminaires with integrally mounted lamps (sources), which slightly modifies the definition given in the standard [30]. Also, traditionally used light sources—tungsten bulbs, fluorescent lamps, and sources for road luminaires—are today supported by solutions that often function as a luminaire, a lamp (source), and an electronic system at the same time. LED modules are one example. Lamps (sources) containing electronic circuits enabling their operation are also used. Examples are compact fluorescent lamps and LED sources [31,32]. All these solutions should meet the relevant provisions of the standards regarding their parameters and working conditions [33]. Quoting from [34], the course of the power supply of LED luminaires and modules is shaped by a switched-mode power supply. An example of such waveforms without harmonic filter systems is shown in Figure 4.
Optionally, luminaires with LED diodes may be equipped with a power factor correction (PFC) system or only with a set of current harmonic filters. A block diagram of a lighting device with LED sources is shown in Figure 5. The negative impact on the value of the power factor is primarily the operation of the converter.
Converters used in luminaires with LED sources are capacitive, which results in high costs for capacitive reactive energy. The situation can be improved by adding an inductive load in the form of a choke, as shown in Figure 6.
As we can see in Figure 7, this situation has clearly improved. The current waveform shown in Figure 4, which was strongly deformed in this case, is almost sinusoidal, and the large phase shift, which caused the load to be capacitive, was almost eliminated. Further laboratory tests were carried out with a series of luminaires with different wattages [13]. Examples of the measurement results for the LED luminaire parameters are presented in Table 2.
Based on the example results of the measurements of the electrical parameters of luminaires with LED sources presented in Table 2, it can be concluded that both luminaires were characterized by values for the DF coefficient close to unity. The determined values for the current harmonic content coefficients THD I were evaluated on the basis of many measurements and studies performed by the authors [14,15]. As a result, these luminaires were included in group one due to the effects of harmonics. However, in order to meet the requirements of the standard [11], a detailed analysis of the values of individual current harmonics was carried out, as described in the following sections of the article.

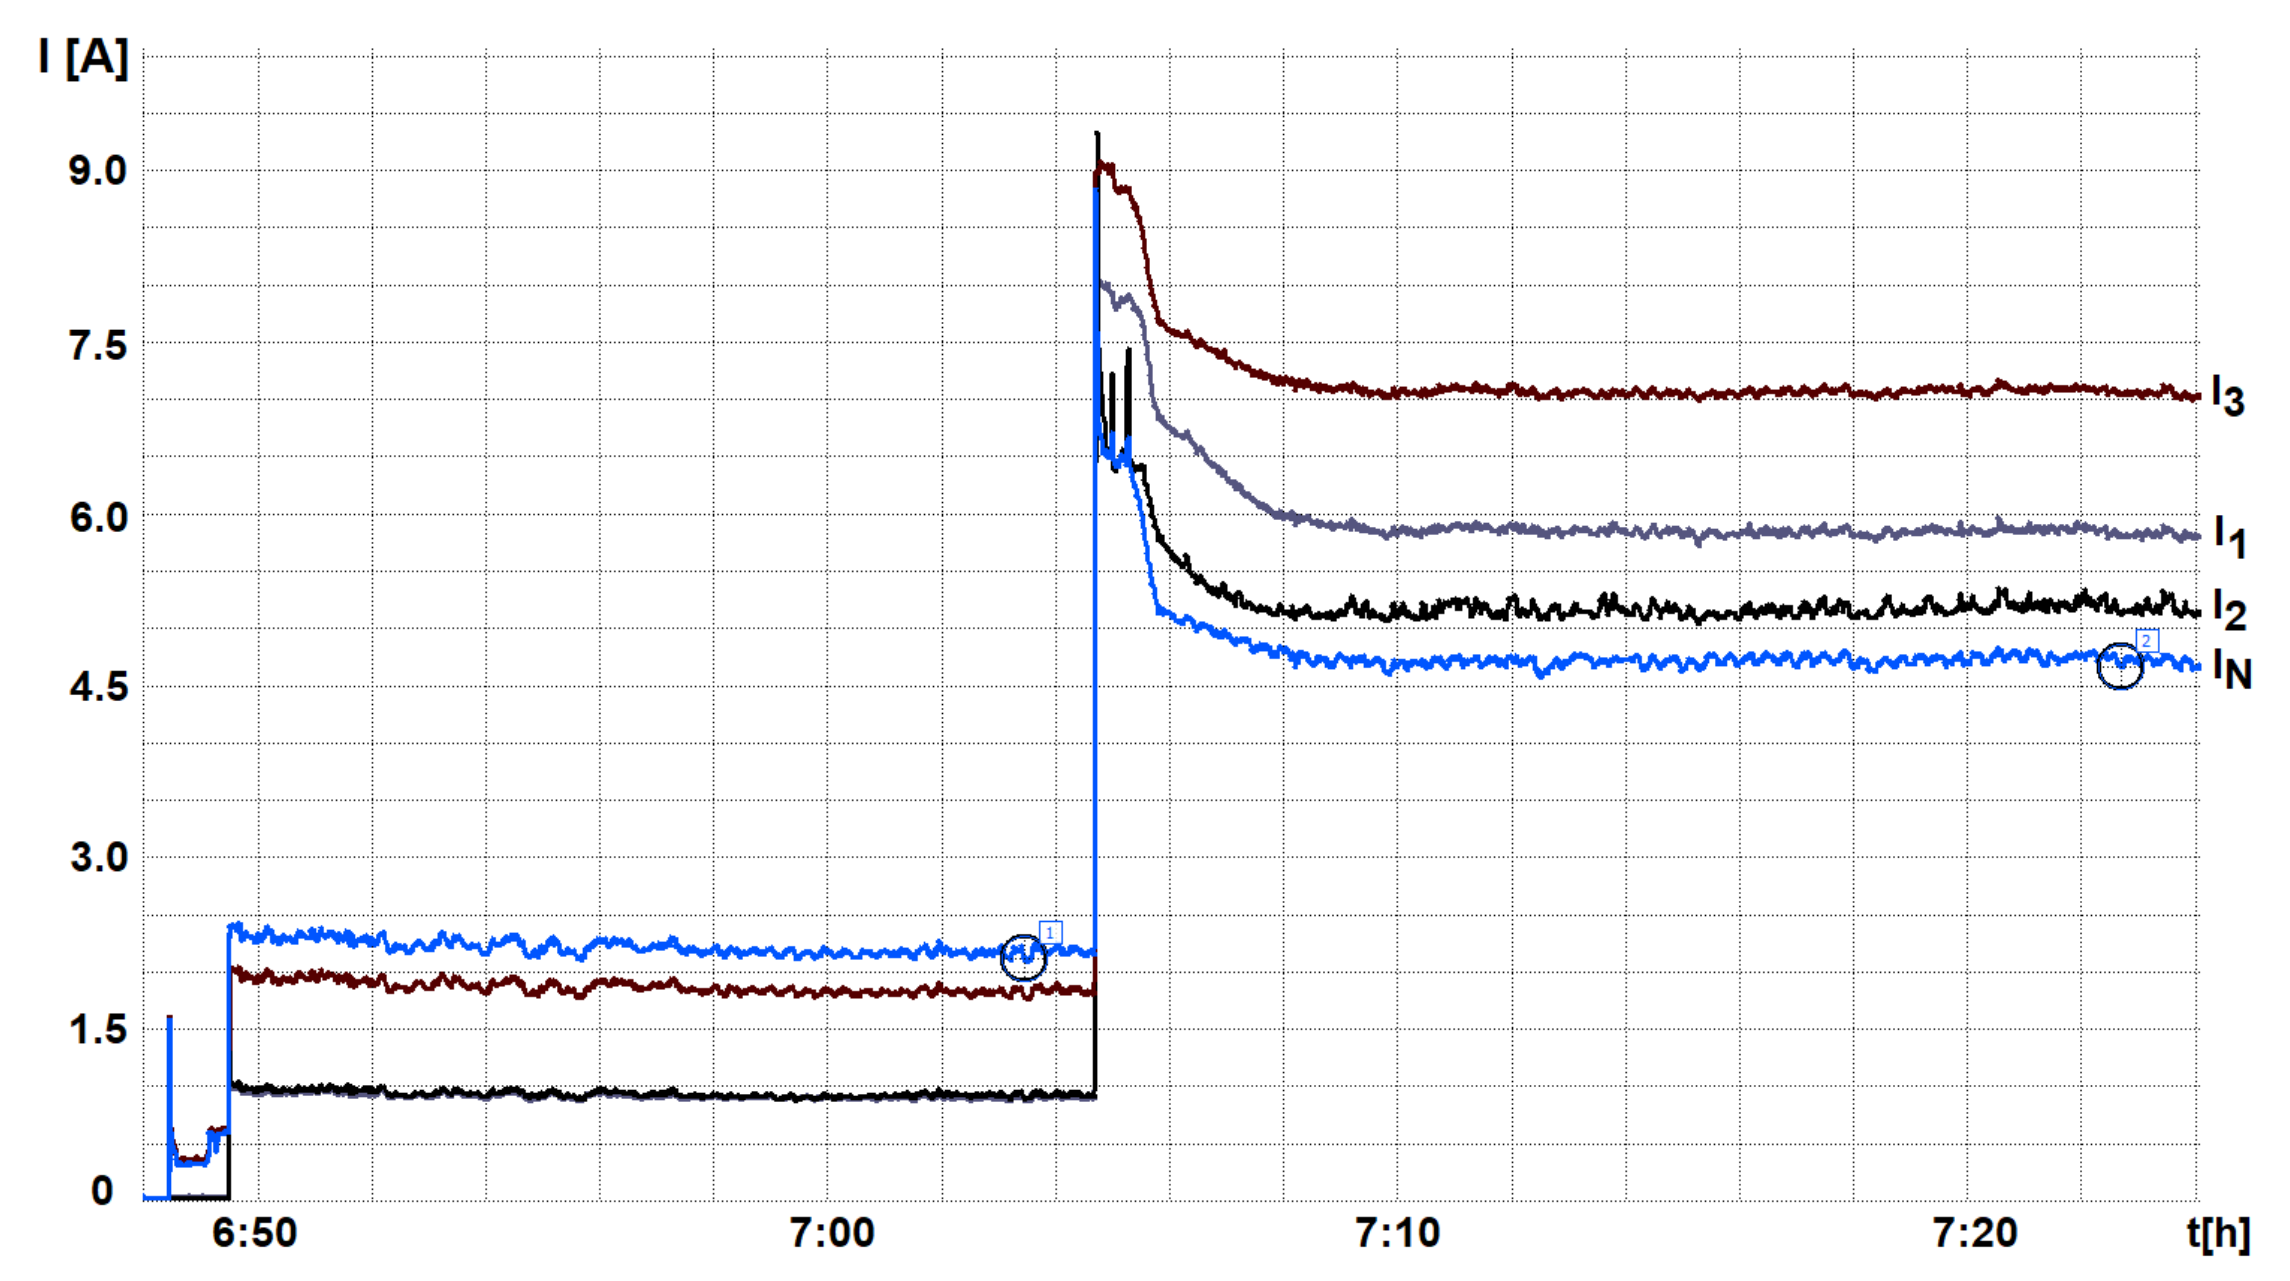
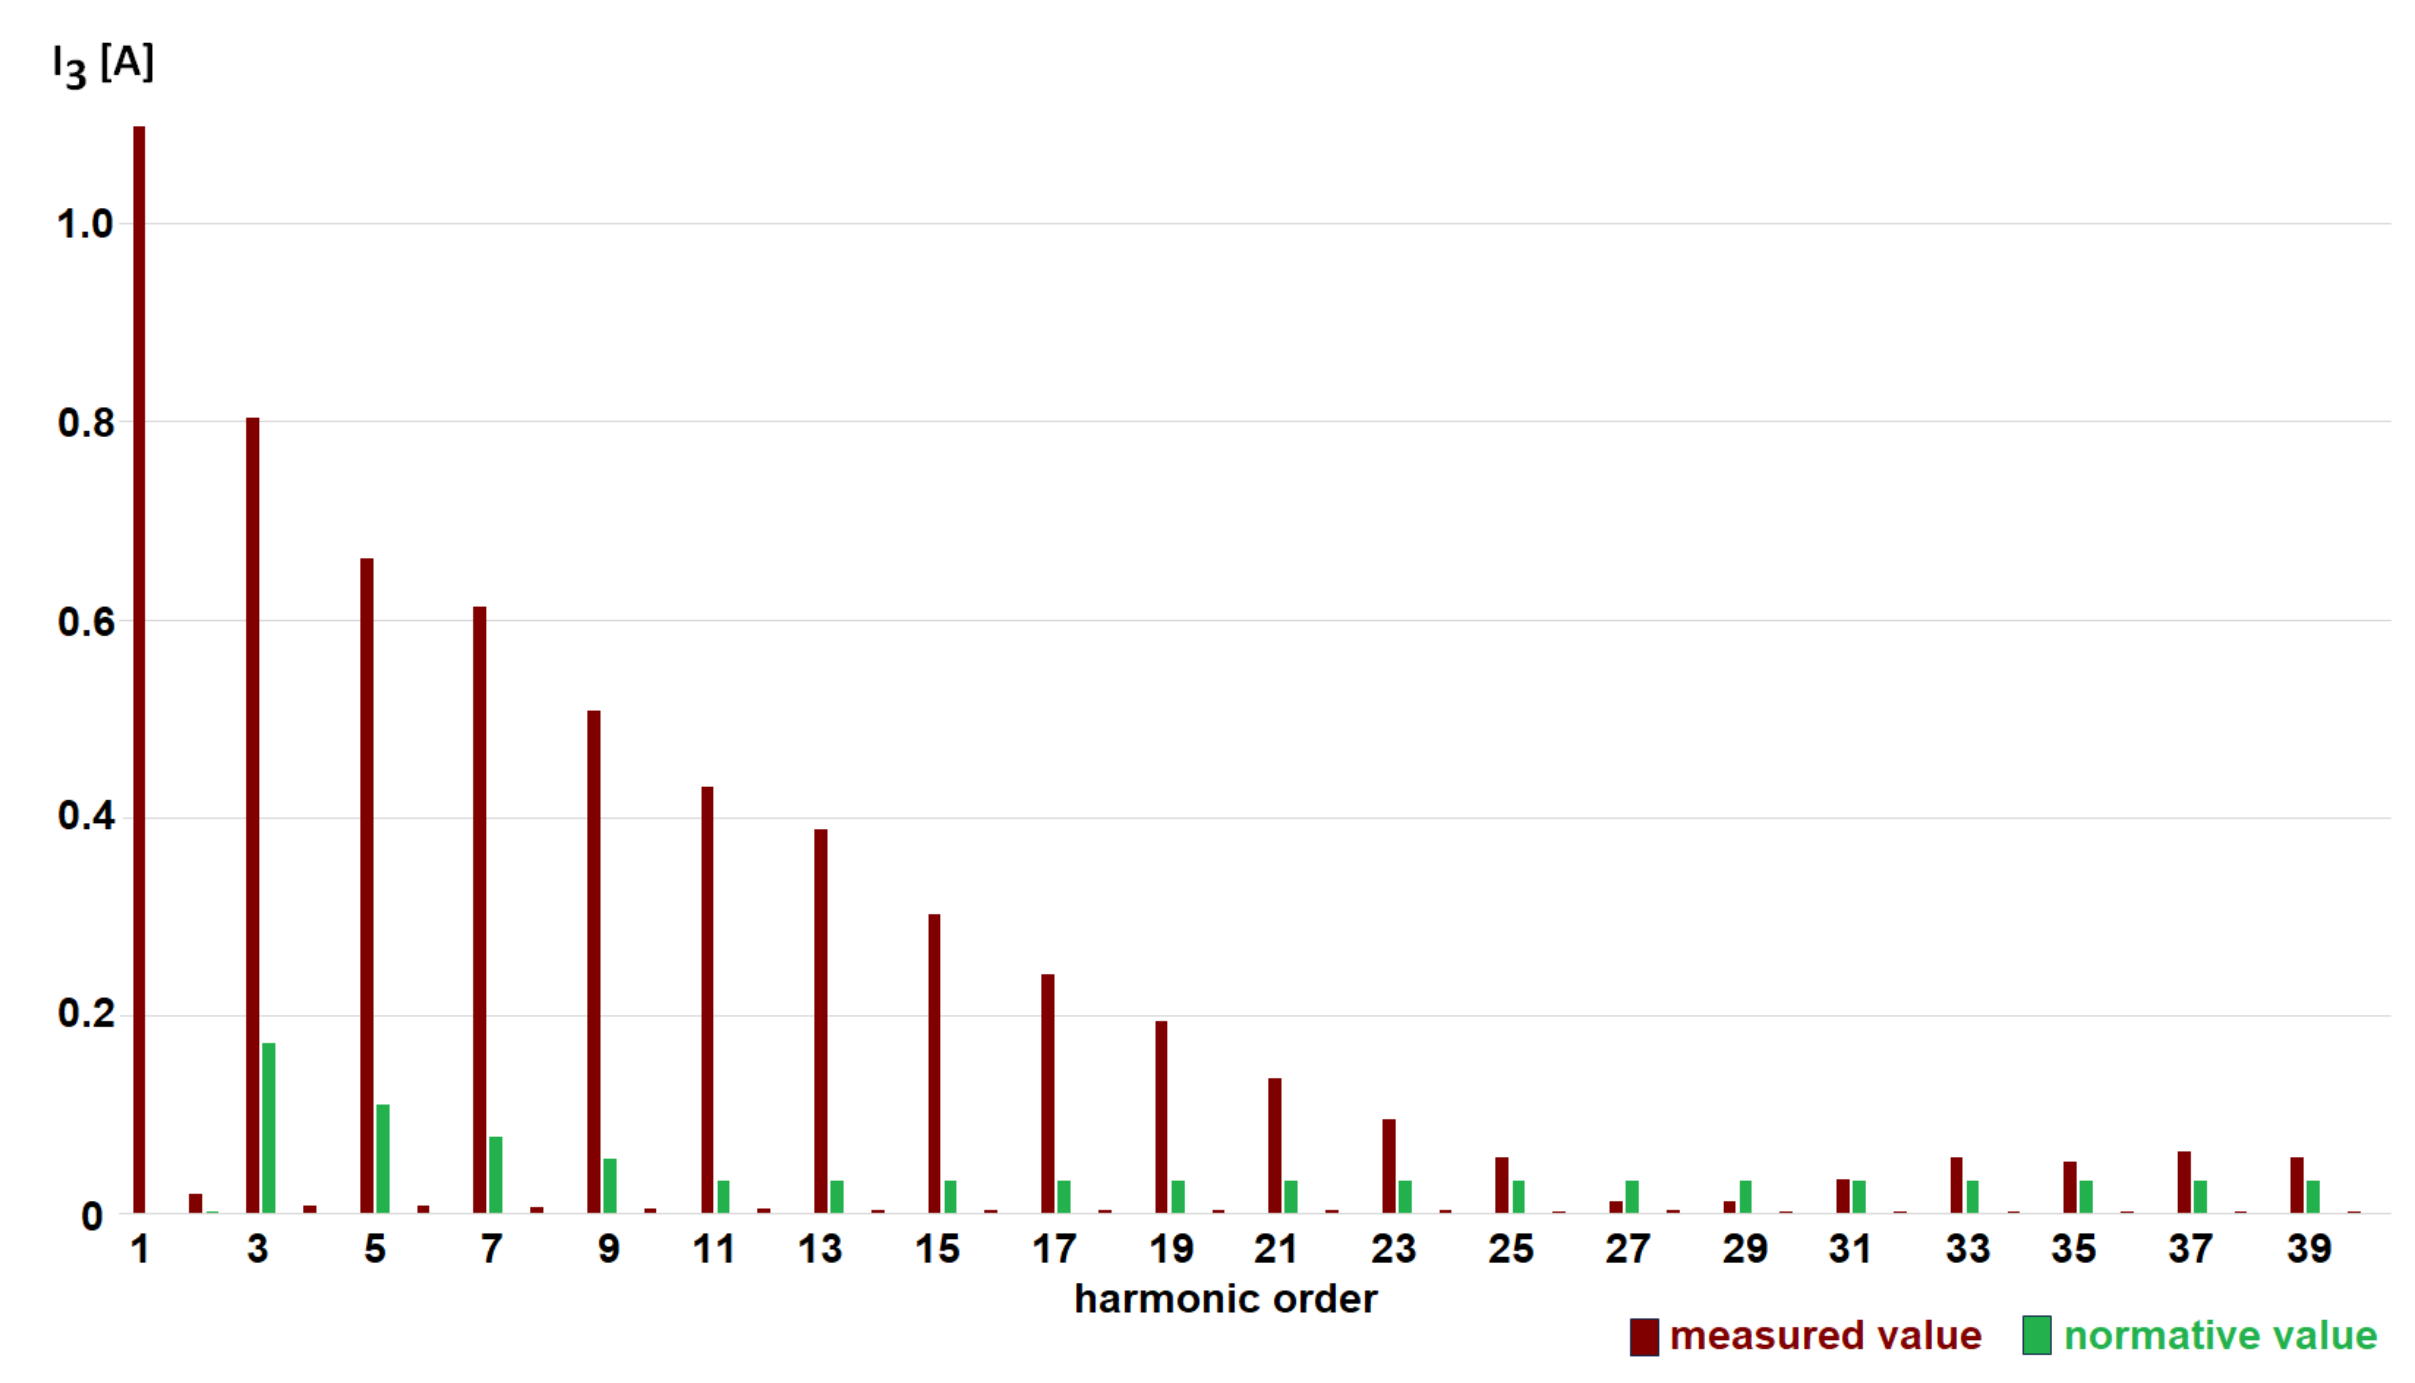
4. Analysis of the Measurement Results for the Mixed Outdoor Lighting Installation

The measurements were carried out for a mixed outside lighting installation containing metal halide and sodium discharge luminaires with a rated power of 150 W and LED luminaires with a rated power of 3 W (the parameters are described in rows one and four of Table 2). The measurements were carried out with many variants of switching on the luminaires; therefore, only a selection of the measurement results are presented below. In order to determine the electrical parameters and evaluate the harmonic content, the parameters of the lighting installation divided into three star-connected circuits were measured. The tested installation included discharge and LED luminaires. The luminaires were switched on gradually: first the LED luminaires, then the discharge luminaires. The list of installed luminaire powers is presented in Table 3.
As can be seen from the measurement data presented in Table 3, individual circuits were loaded asymmetrically. On the basis of the measurements presented in Figure 8, it can also be concluded that, in the analyzed installation, the tested harmonic content factors, both in the phase and neutral conductors, had very high values.
Point 1 on the graph shows the current in the neutral wire for LED receivers, while the marked point 2 on the diagram shows the current in the neutral wire for LED and discharge type receivers.
During the measurements, the RMS values of the harmonic currents were recorded for many electrical parameters (brown bars in Figure 9). The measurement results are summarized in Table 4.
In the tested lighting installation, it was found that:
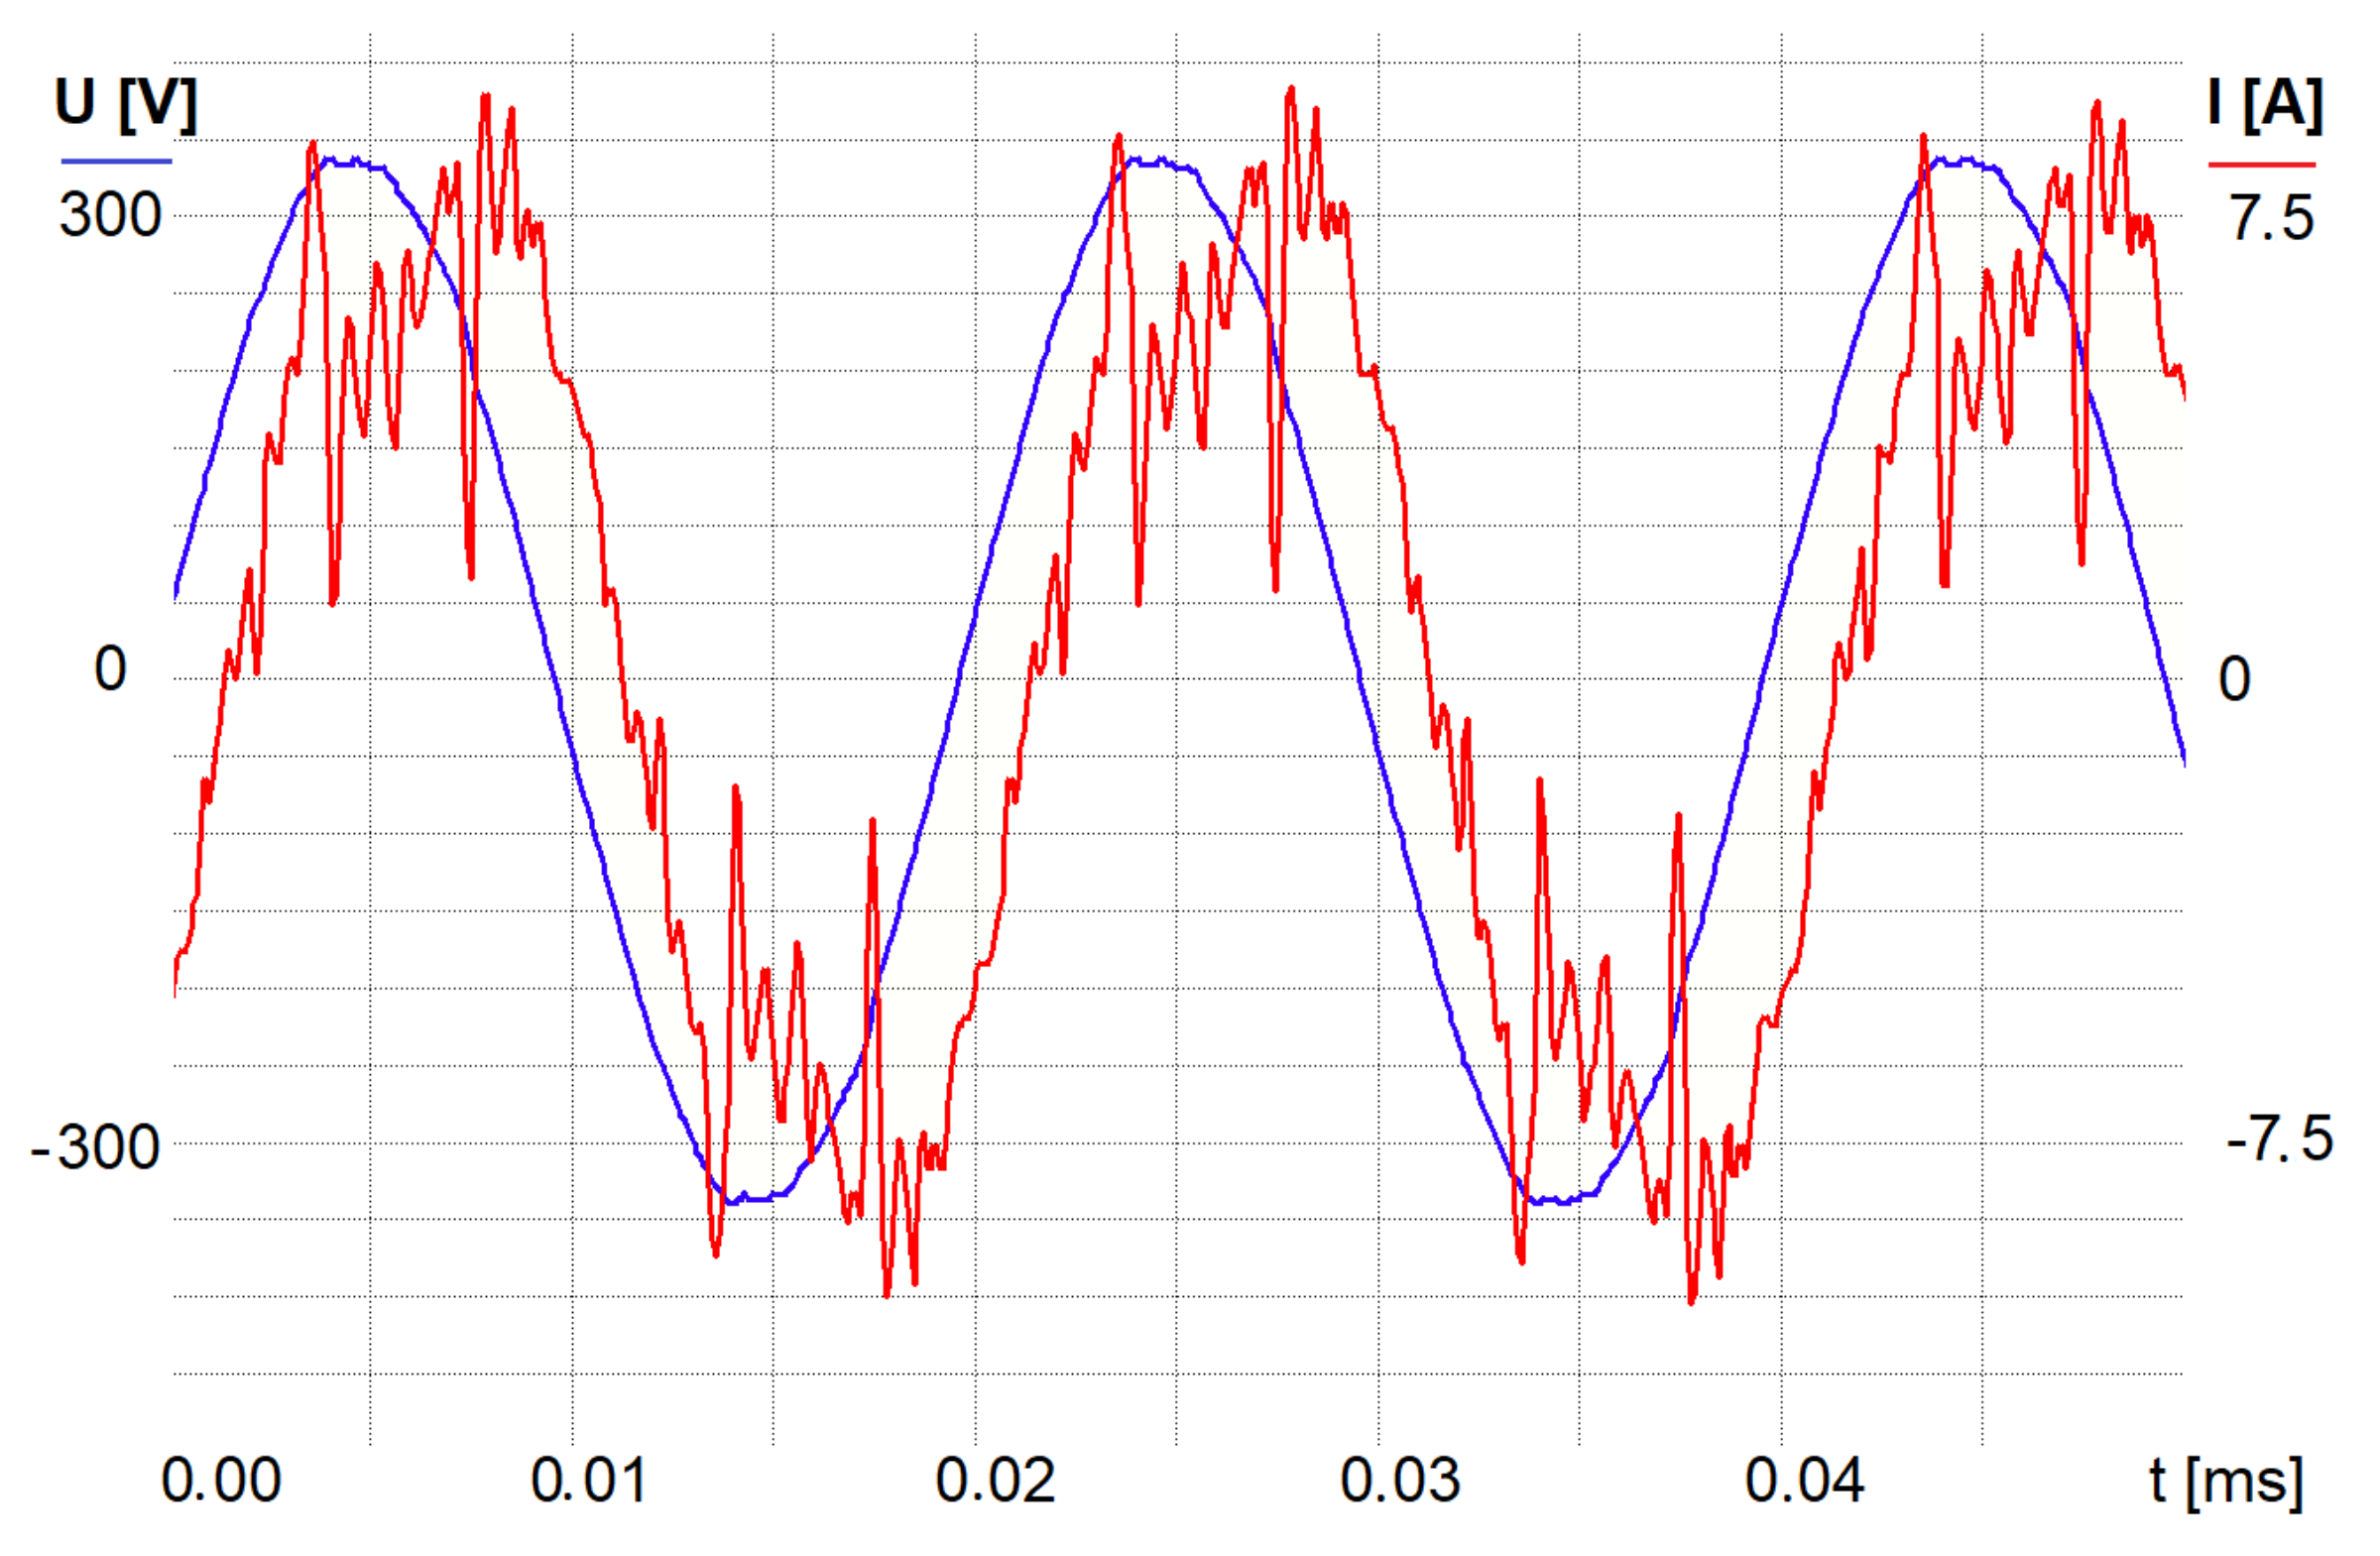
  • The lighting installation had a current that was unsymmetrically loaded;
  • The current harmonic content in the supply current of the LED luminaire was many times higher than the permissible values [11].

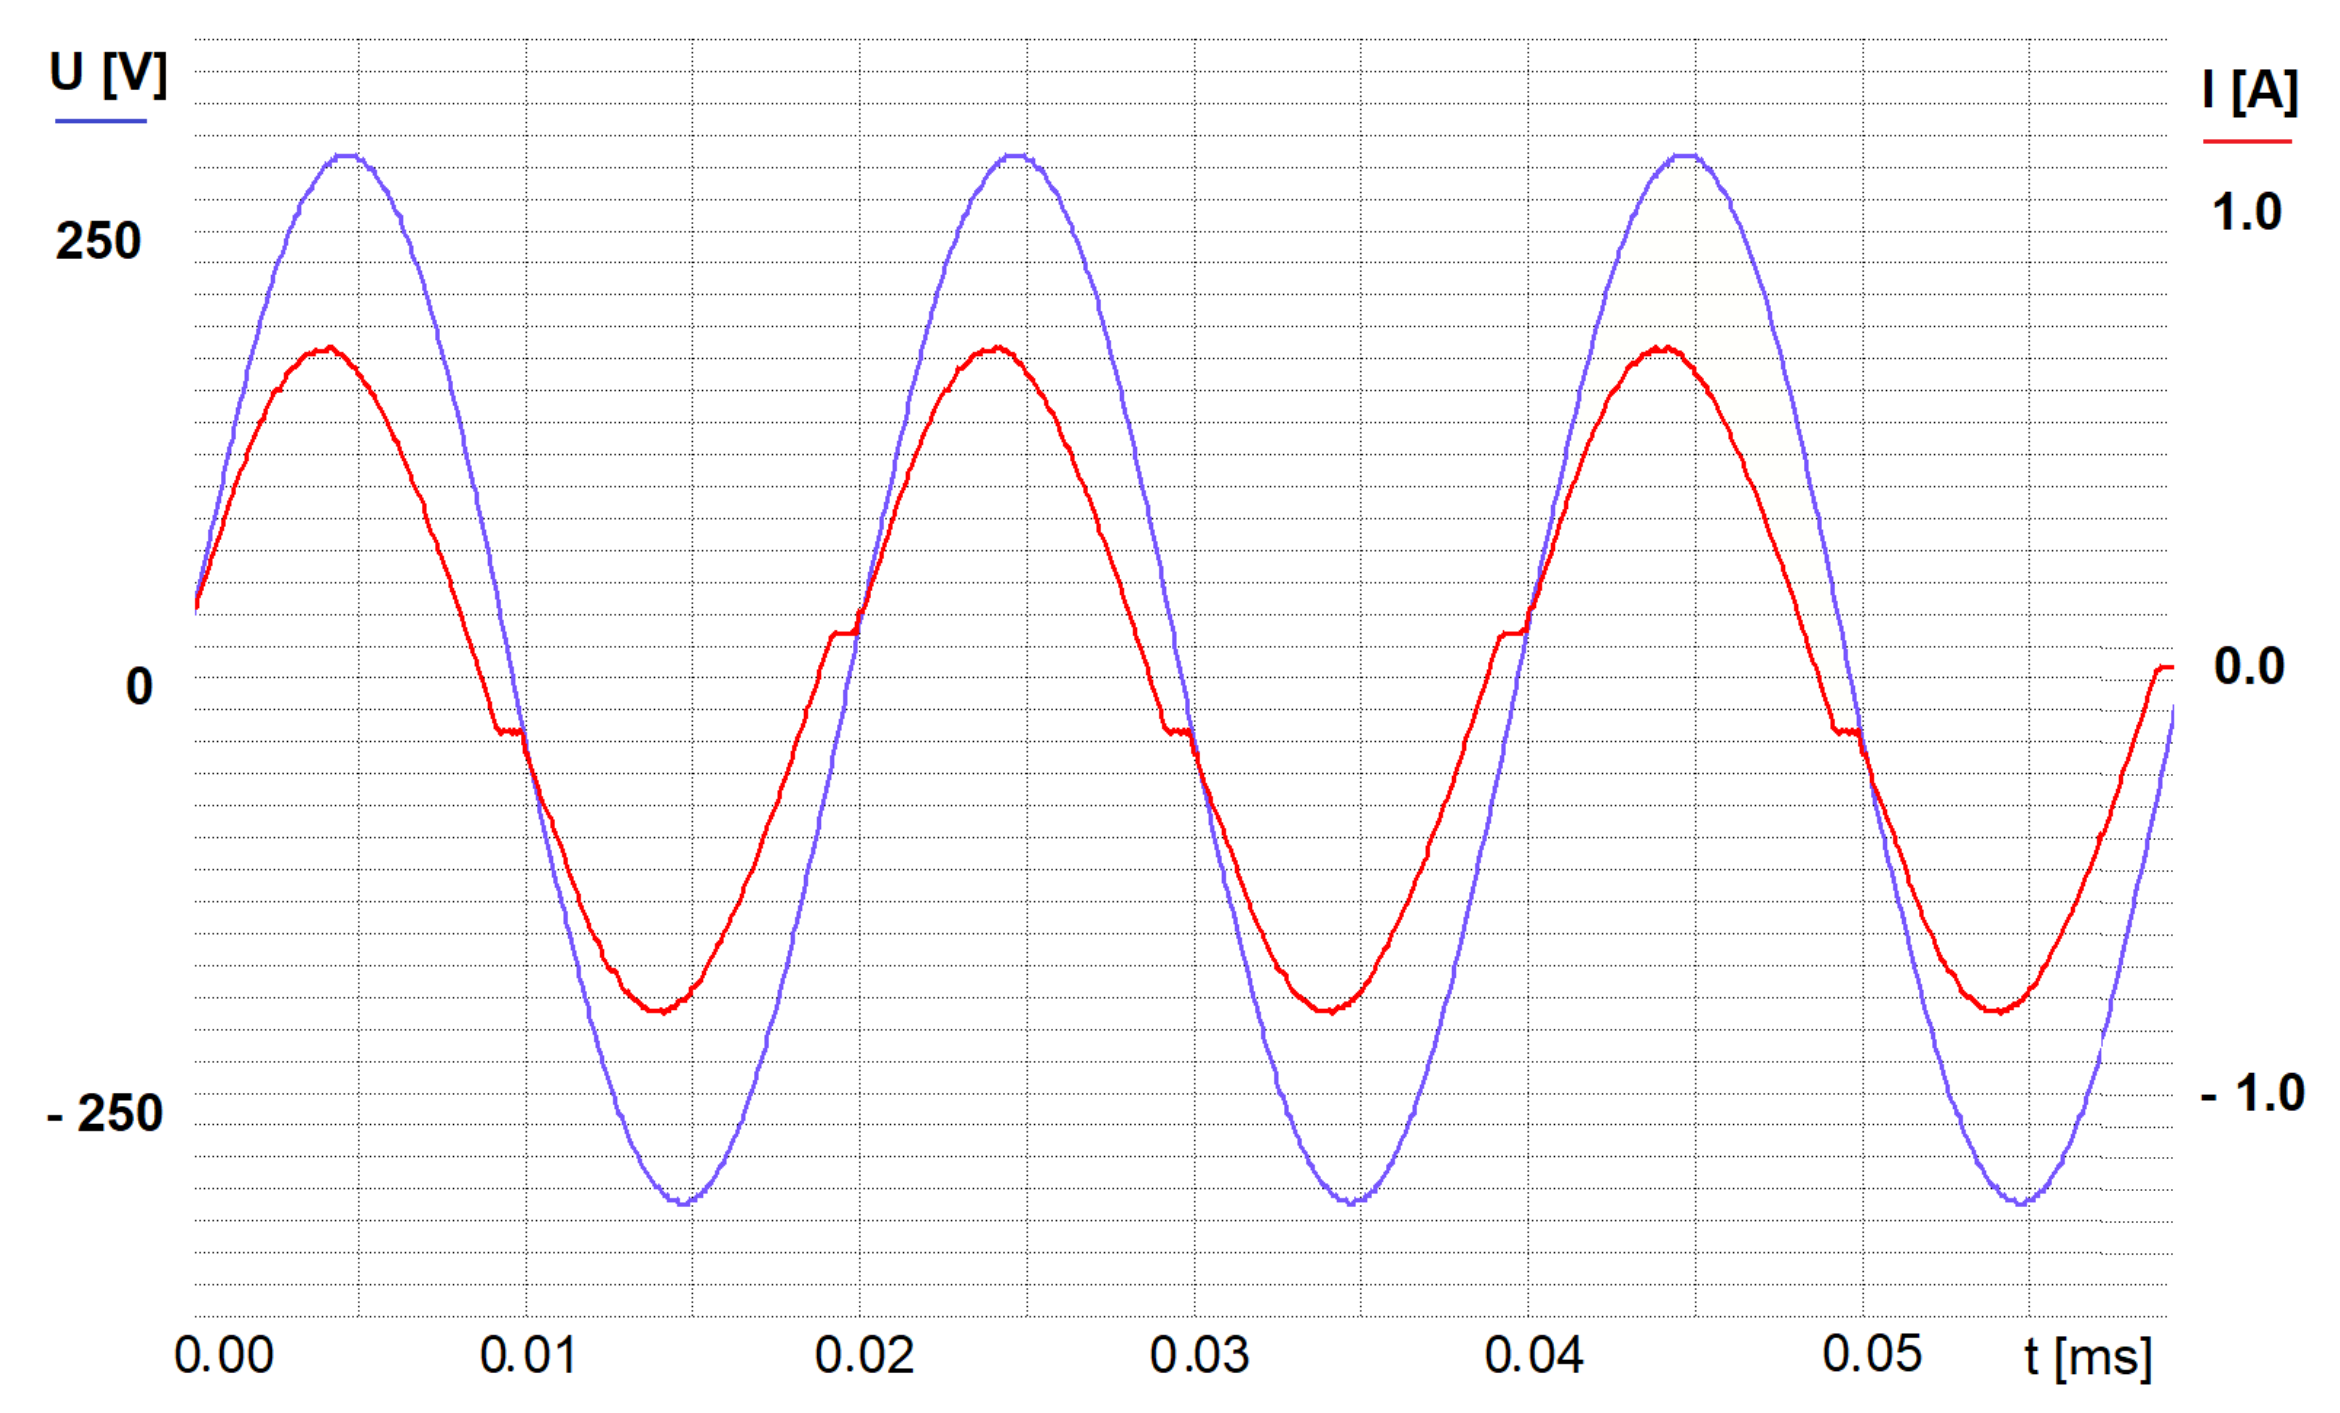
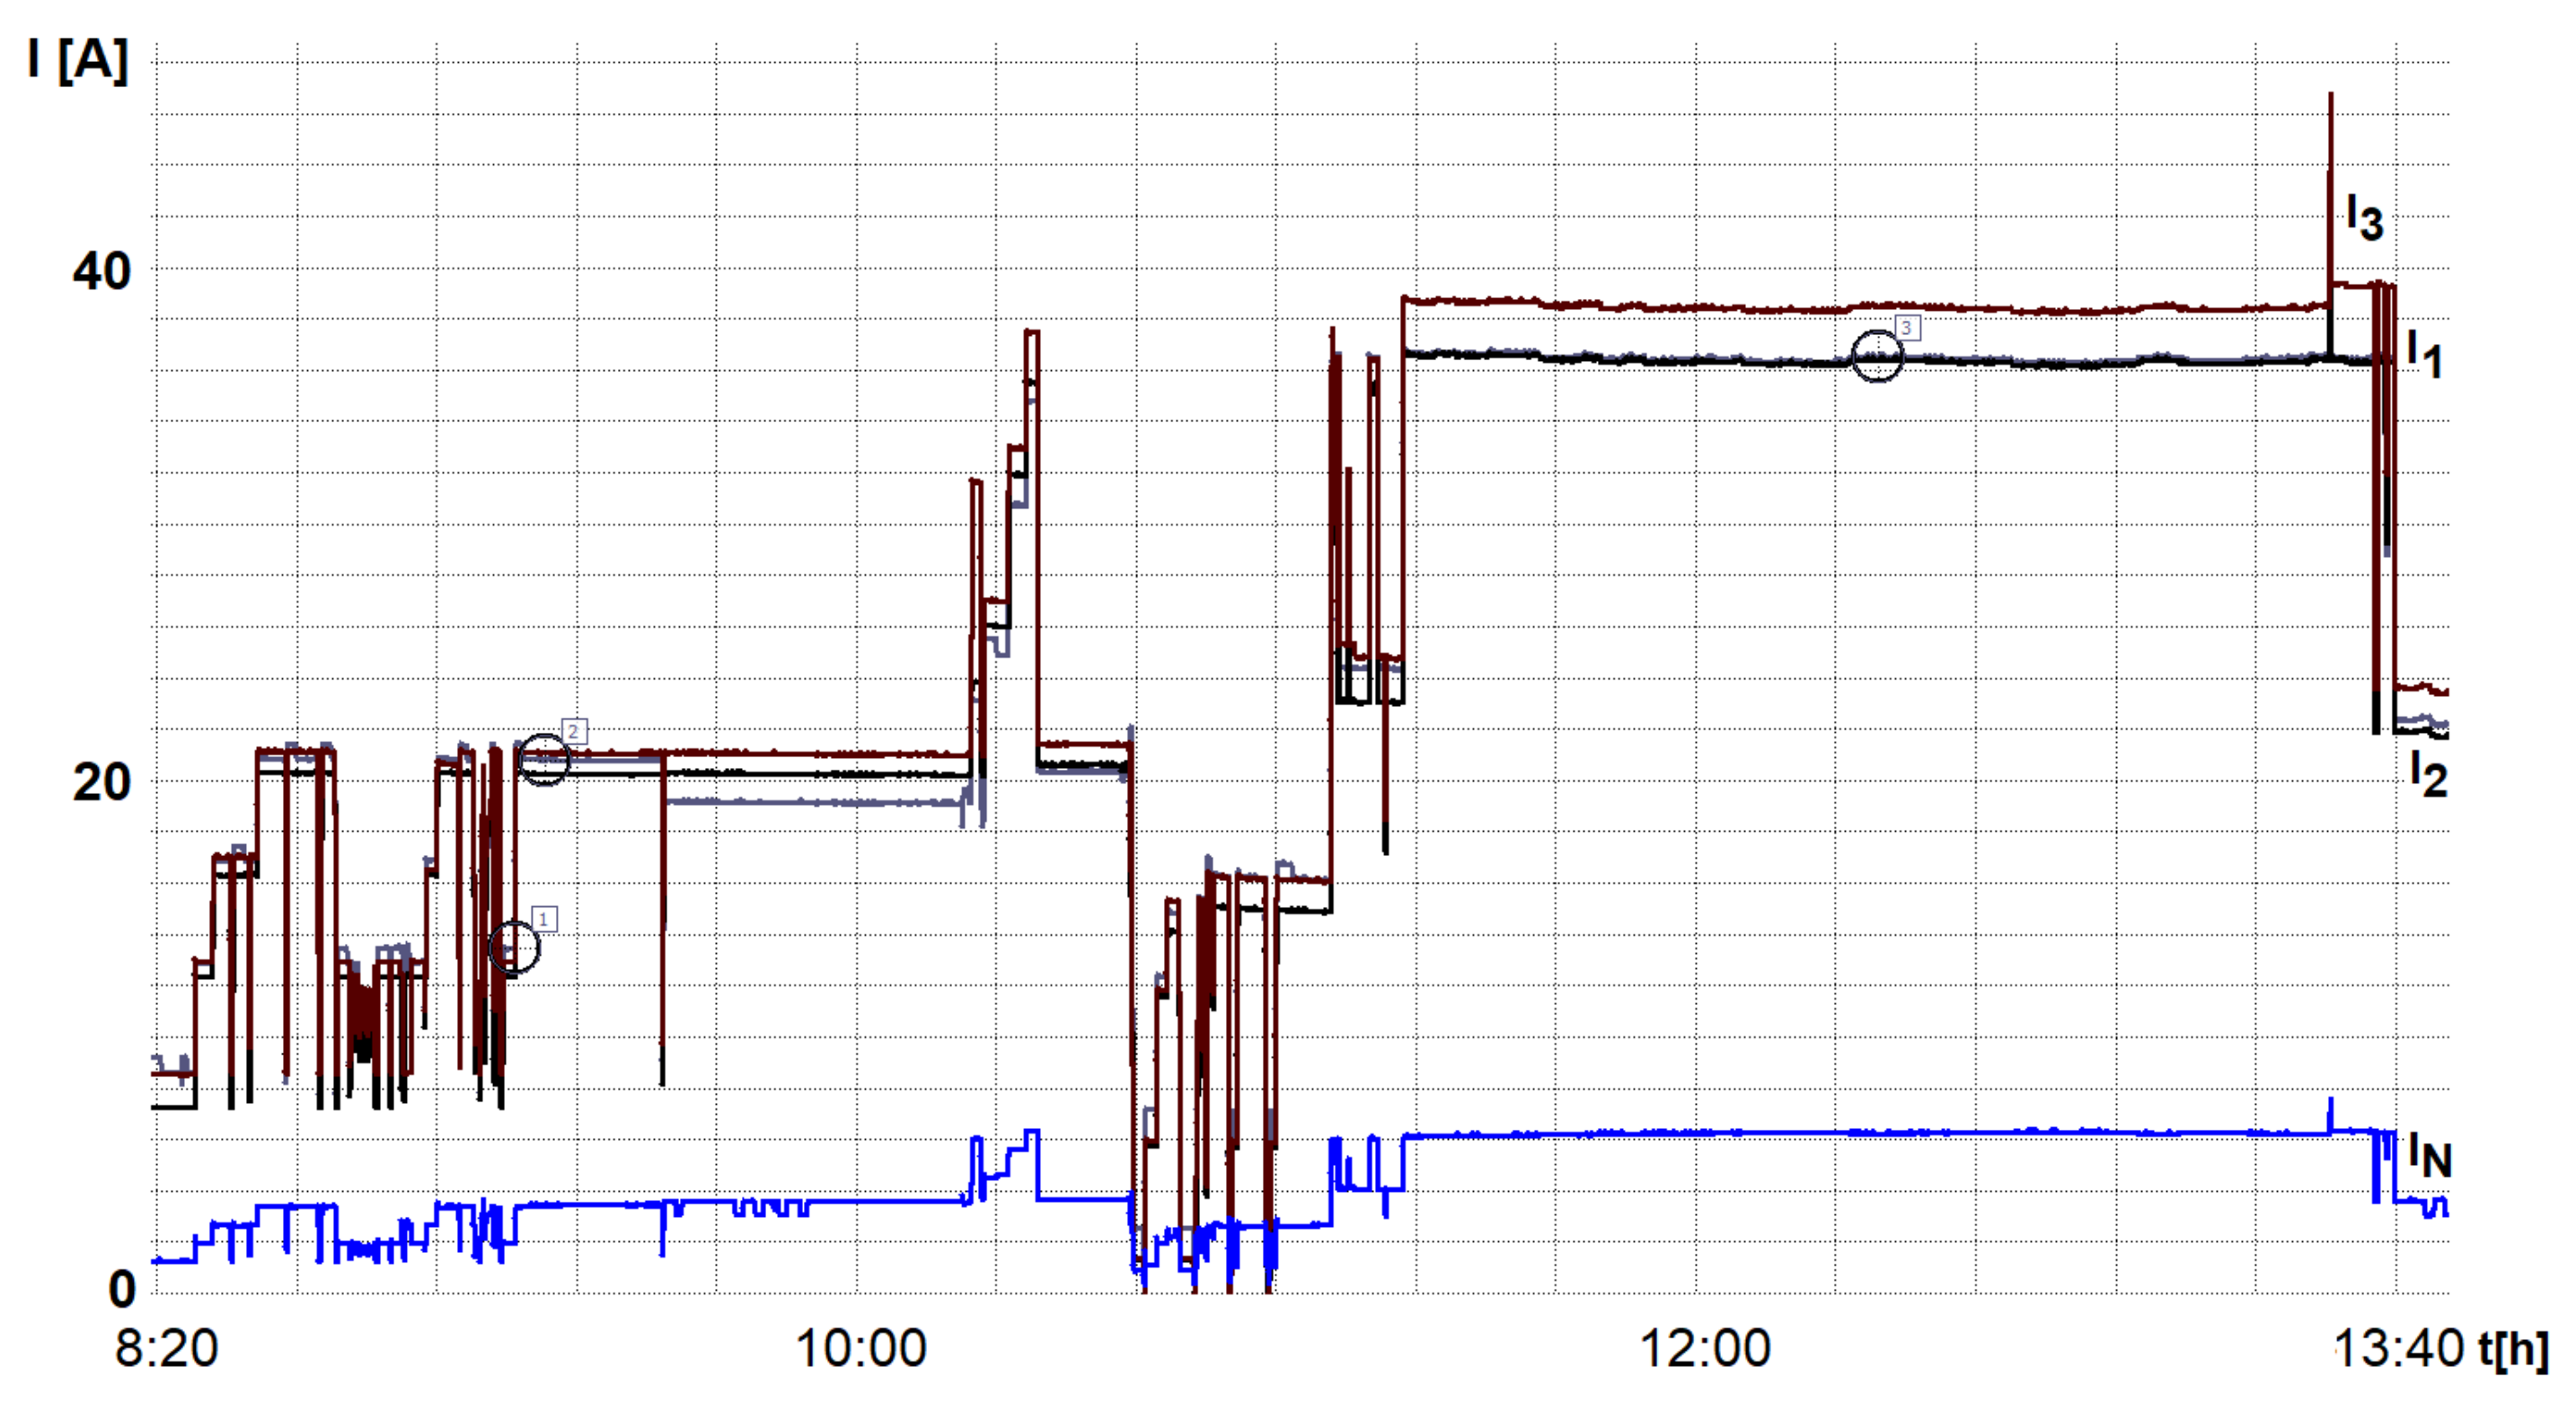
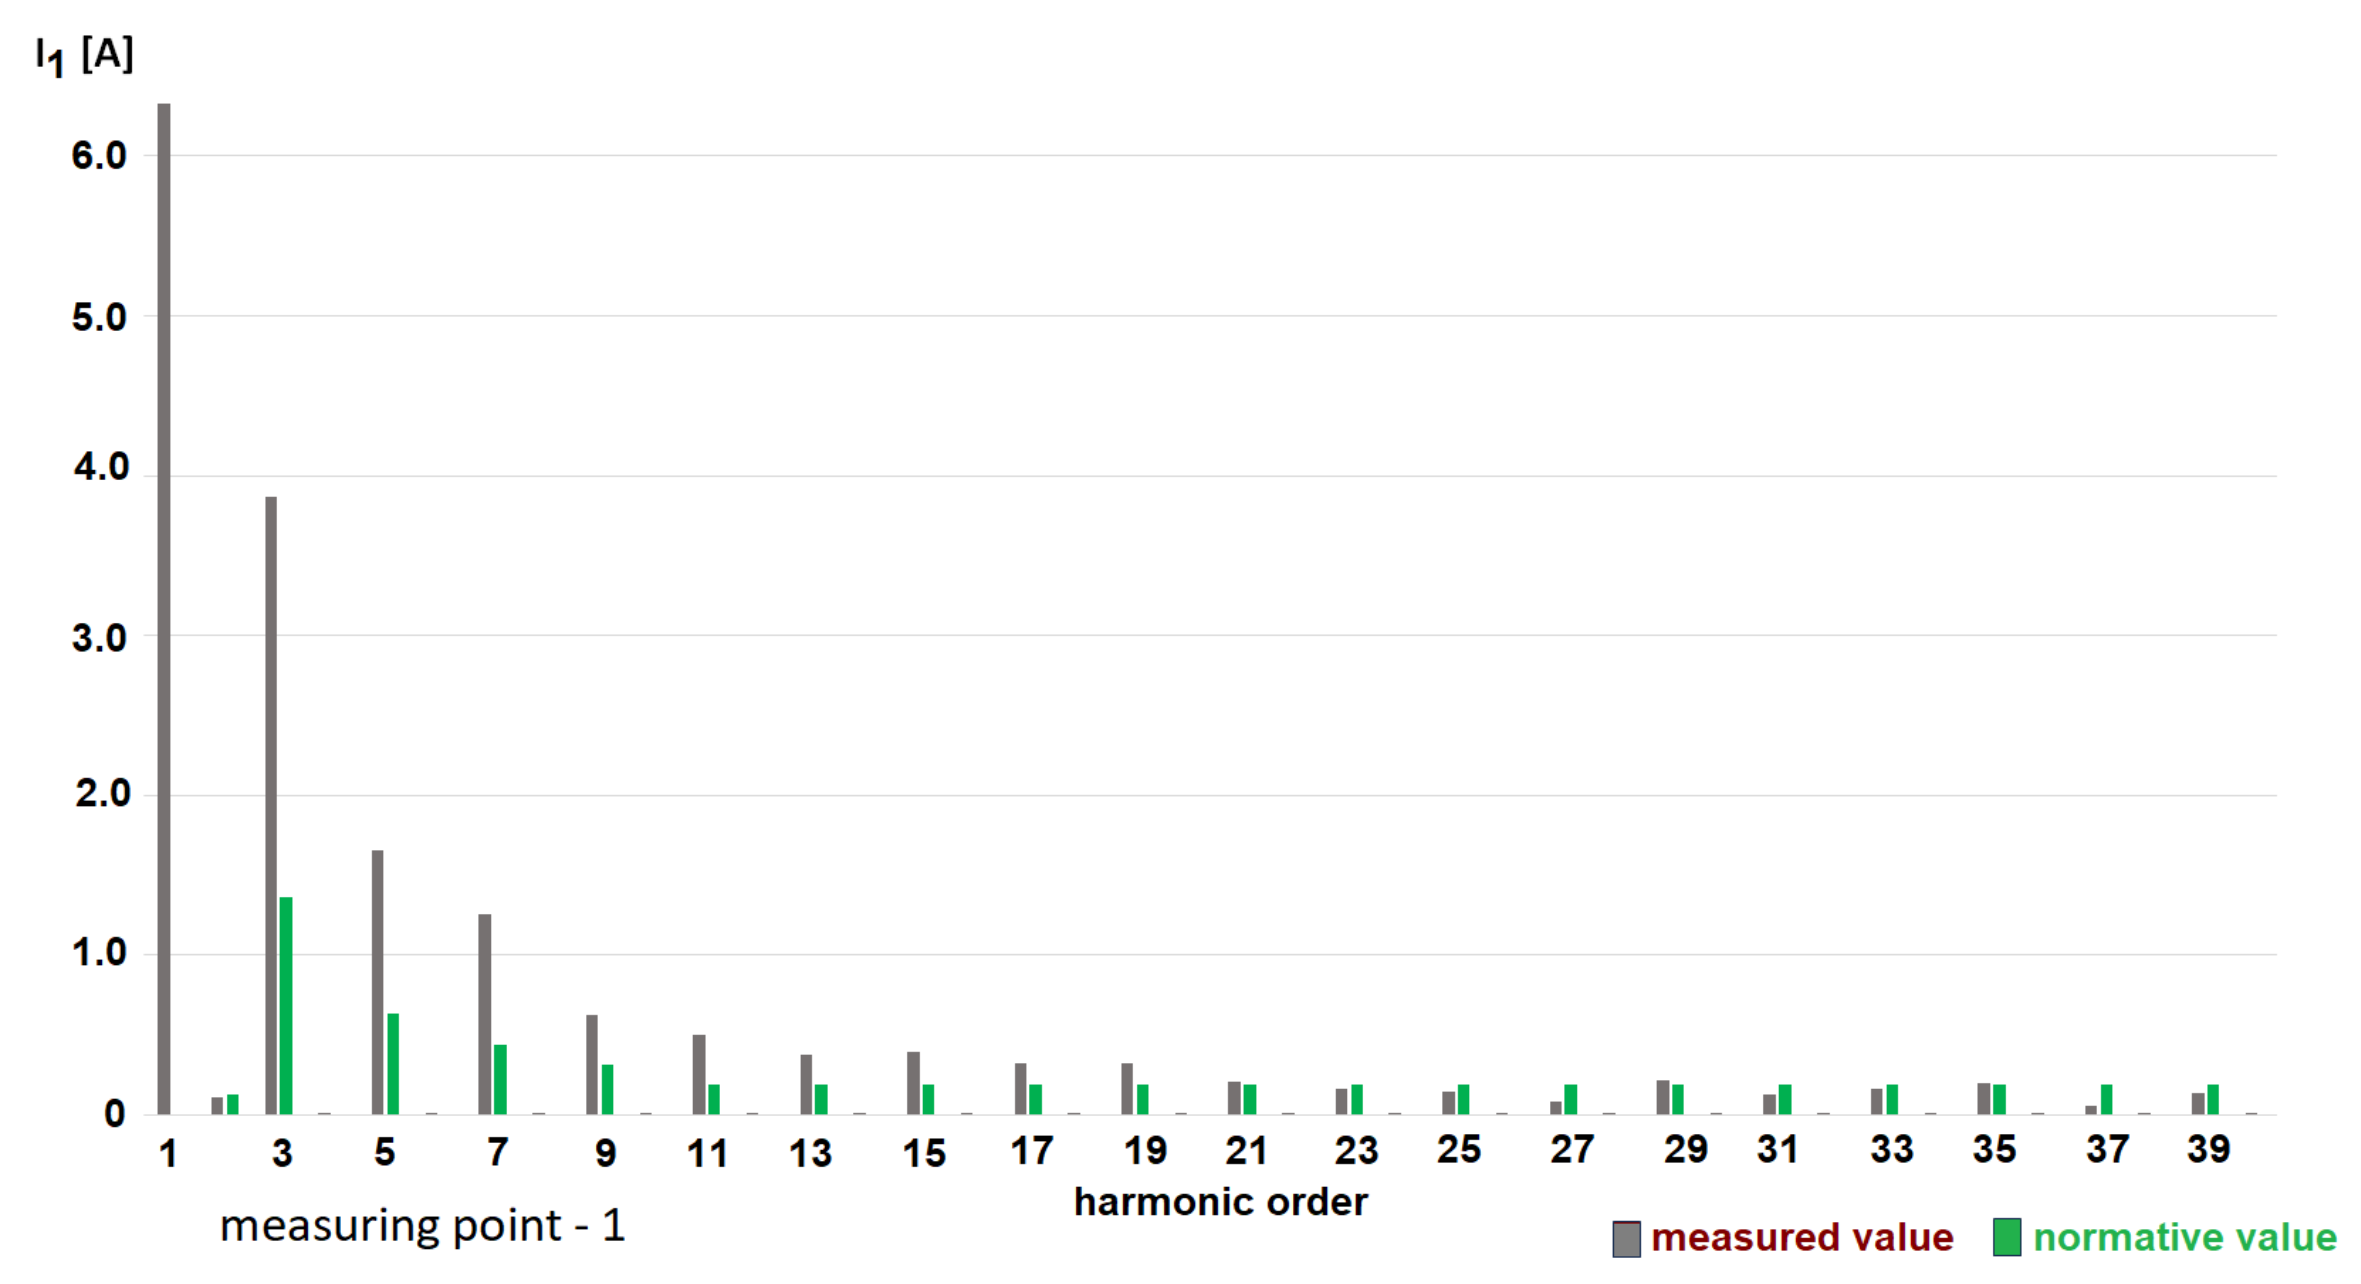
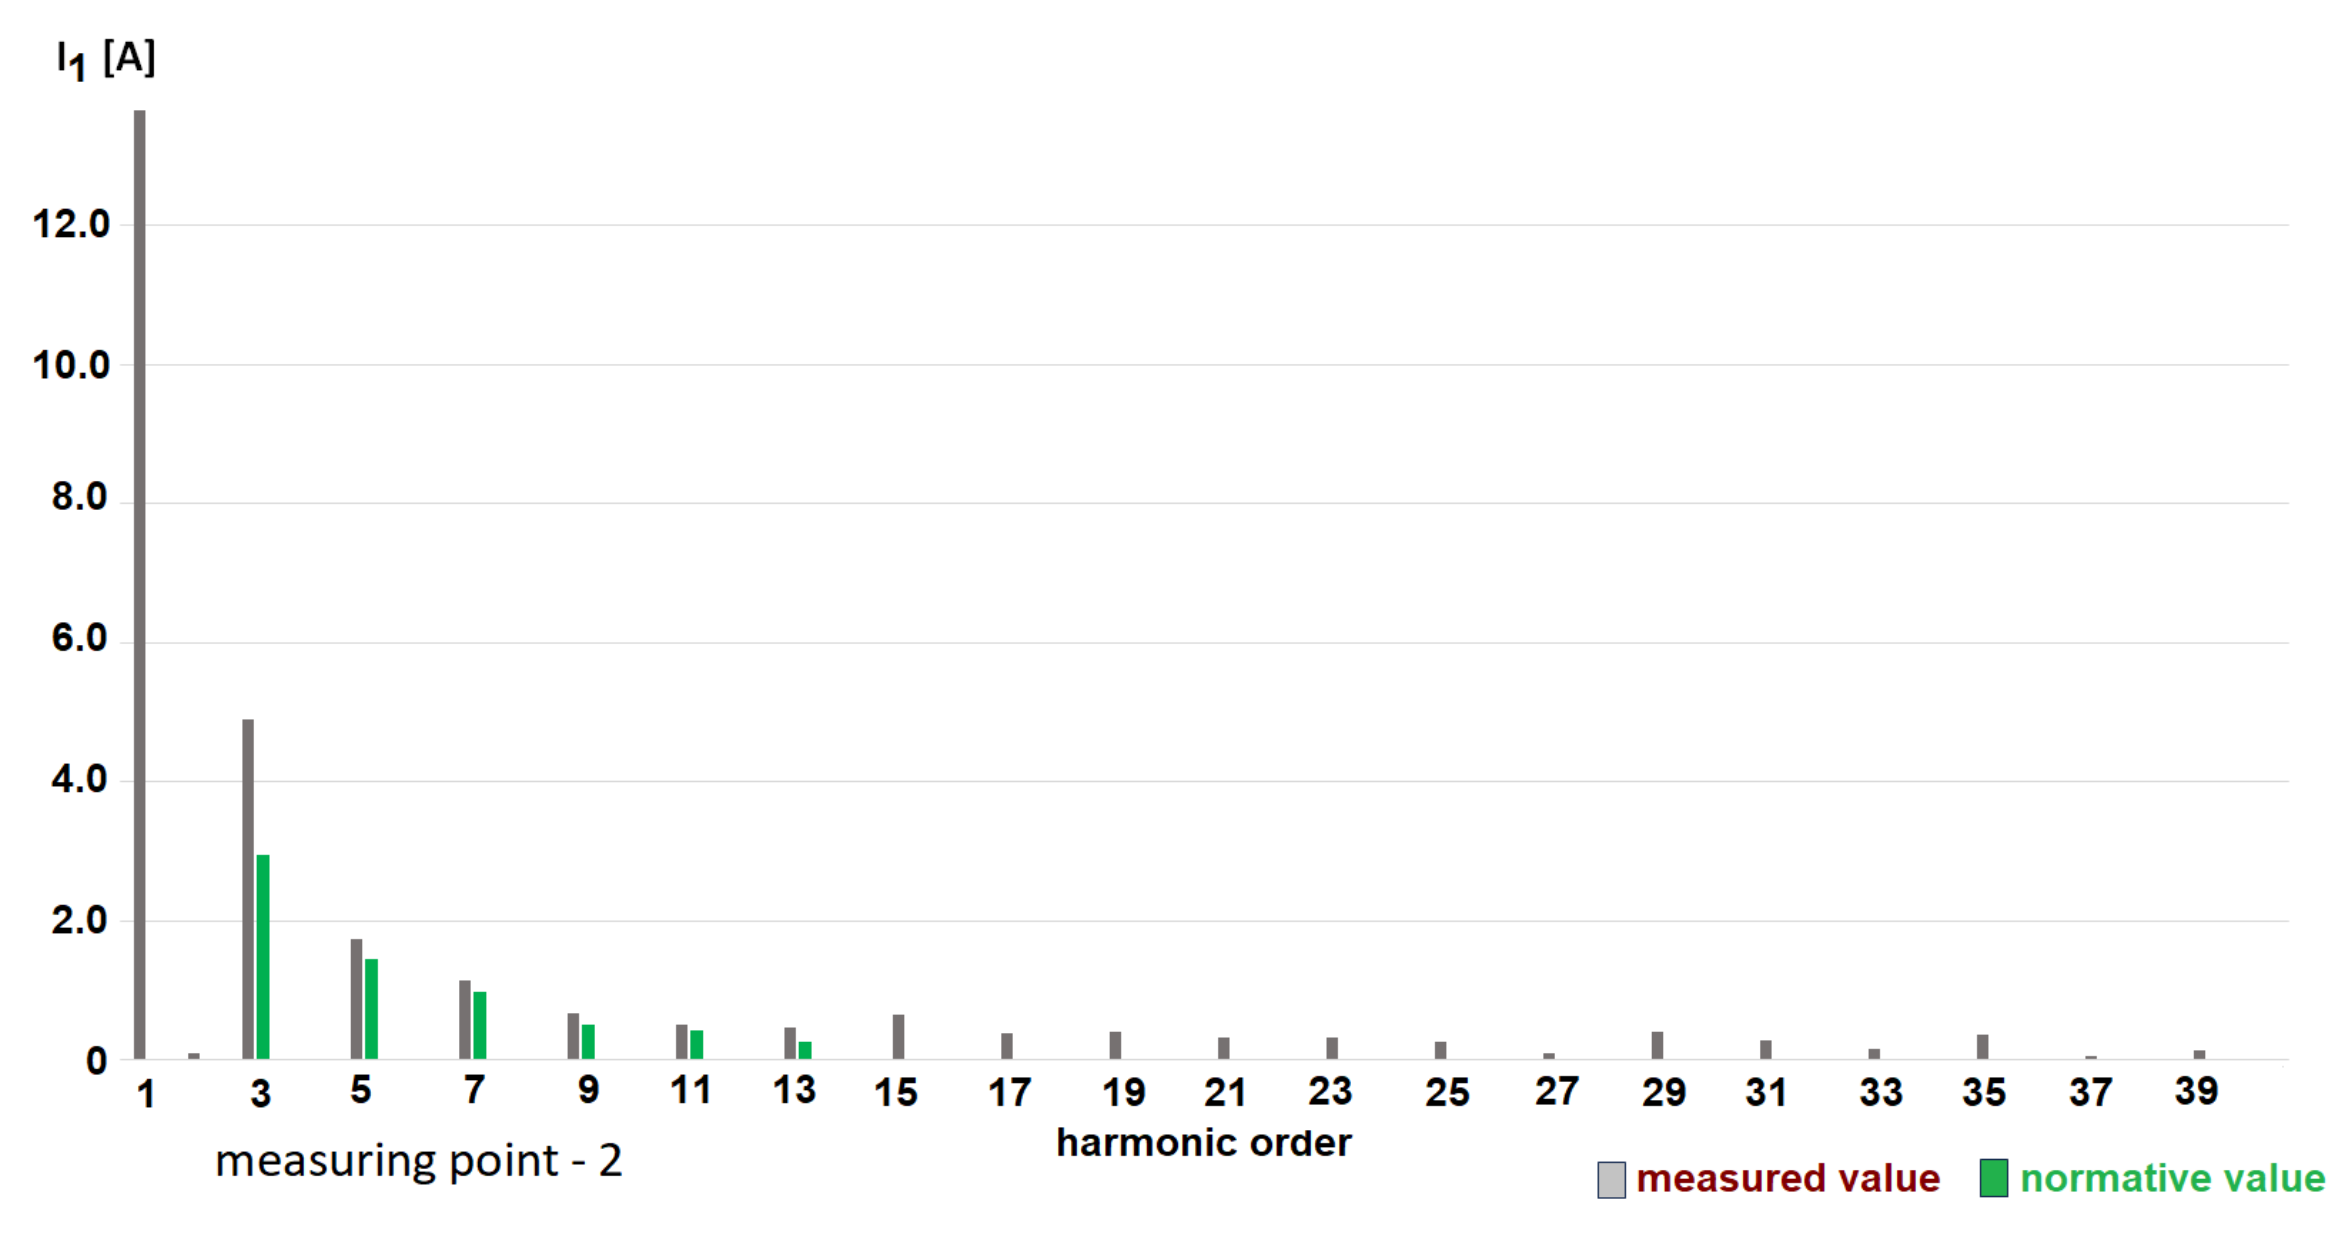
5. Measurement Results for the Modernized Indoor Lighting Installation with LED Sources

Measurements were taken in lighting circuits of modernized industrial halls. The results of the measurements are presented in Table 2. The values of the power factors and harmonic distortion coefficients determined during the measurements were in accordance with the normative requirements. The parameters of the LED luminaires used are listed in Table 2, line five. The analyzed installation was equipped with presence sensors that controlled the value of the flux emitted by separate fragments of the lighting circuits. Figure 10 shows a selection of the measurement results for the selected sequence of the control system. It clearly shows that the control of the selected parts of the circuits caused asymmetry and significant changes in the current value in the phase conductors.
Points 1, 2, 3 in the figure show the measurement points of the harmonic current components shown in Figures 12–14.
In order to better illustrate the examined phenomenon, the waveforms of the harmonic components of the currents in the neutral conductor are shown in Figure 11 at a different scale. Also, in this case, it can be seen that the control of selected parts of the circuits caused asymmetry and significant changes in the value of the current harmonic content factor in the neutral conductor THD I N .
Points 1, 2, 3 in the figure show the THD I N values determined at these points, shown in Figure 10.
The authors were concerned about the fact that the value of the third harmonic of the current in the neutral conductor was greater than the third component of the current in the phase circuits. As can be seen in Figure 10 and Figure 11, the implementation of control procedures caused changes in the values of the flowing currents. For three measurement points, analyses of the content of the current harmonics in the first circuit were carried out. Figure 12 shows a comparison of the values of the current harmonics in relation to the requirements of the standard [11] (phase current ≤16 A—measurement point one), while Figure 13 and Figure 14 show a comparison of the values of the current harmonics in relation to the requirements of the standard [12] (phase current >16 A—measurement points two and three).
The analysis was performed by comparing the obtained results with the requirements from the standards [11,12]. At all three measurement points (one, two, and three), the harmonic current values in the current supplying circuit one with LED luminaires exceeded the permissible limits. The results of the measurements and analyses undertaken with other circuits were similar.
Following the measurements carried out with the installation with the control, the below conclusions were drawn:
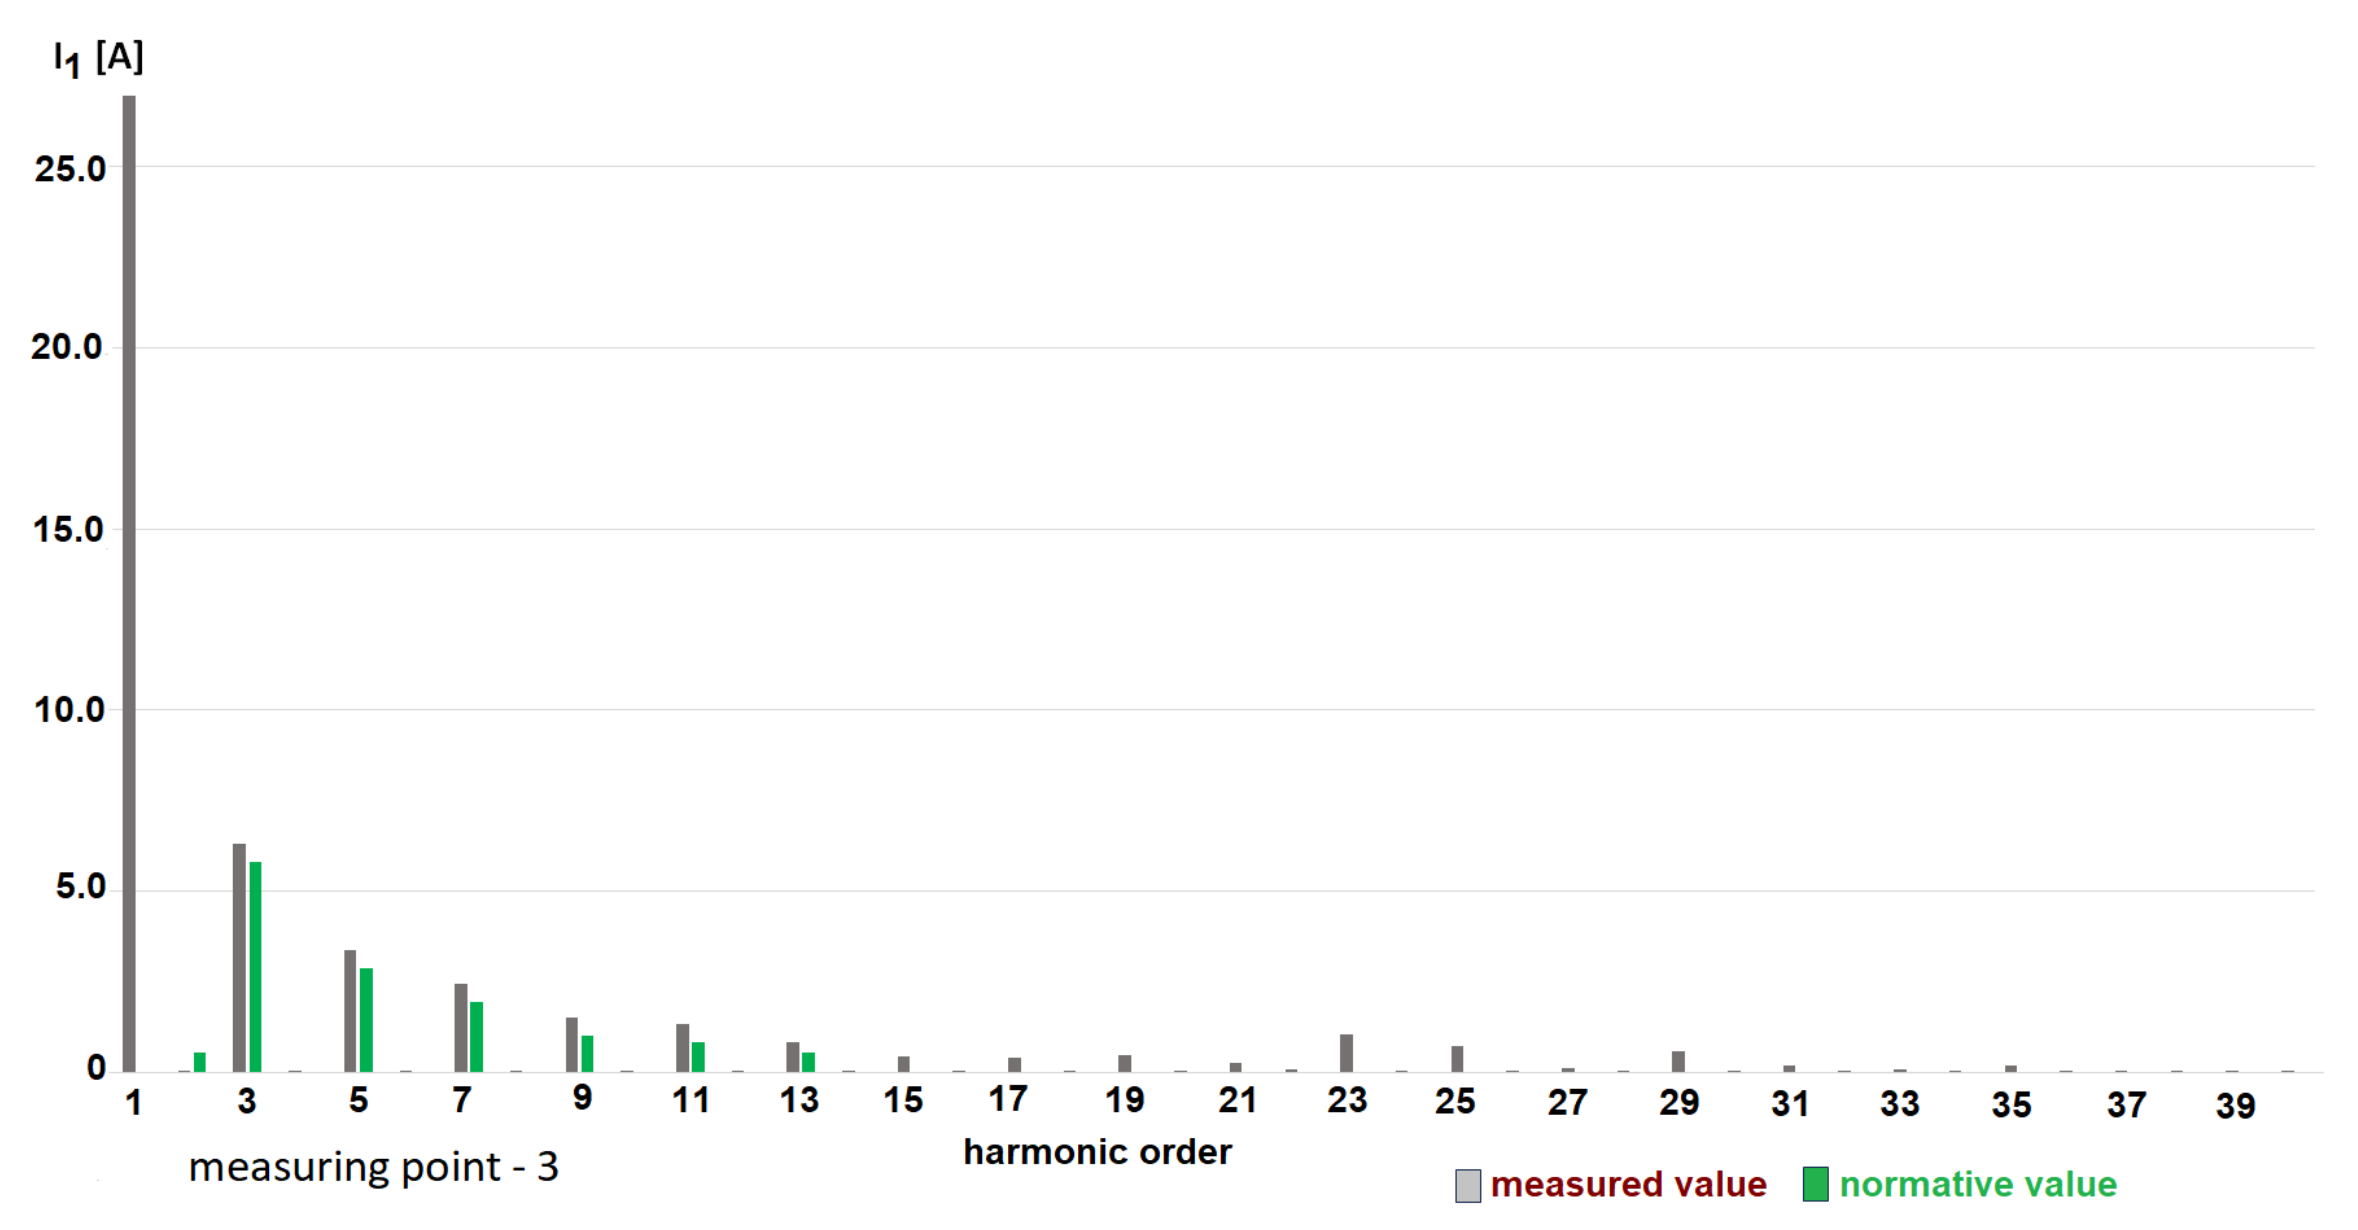
  • Based on an analysis of the documentation of the LED luminaires (manufacturer’s test reports), it was found that the requirements of the standard were met [11]. Unfortunately, the results of measurements at point three of circuit one showed that the lighting installation with LED luminaires did not meet the requirements of the standards [11,12] regarding the permissible levels of harmonic current emissions;
  • The measurement results obtained during the implementation of the control procedures (measurements at points one and two of circuit one) showed increases in the values of individual harmonic current components.
Selection of power cables was carried out without taking into account the requirements of the standard [35].

6. Selection of the Conductor Cross-Section Taking into Account the Share of Higher Harmonics

Selection of cables in installations with lighting loads seems to be a simple matter. The ratings of the luminaires and the power supply parameters are used for the calculations.
An important issue in the cable selection procedure is the cables’ long-term current-carrying capacity. In the standard [35], reduction factors for higher harmonics for four-wire and five-wire receiving installations with a voltage not higher than 1 kV are provided for information. If the share of the third harmonic does not exceed 15% of the phase current, the cable is selected on the basis of the phase current value. For shares of 15–33% for the harmonics in the phase current, a correction factor of 0.86 is used. In turn, when the content of the third harmonic exceeds 33% of the phase current, analogous factors are used, but the selection is undertaken on the basis of the neutral conductor current. Table 4 presents the factors reducing the current-carrying capacity of cables for higher harmonics in four-wire and five-wire installations [35].
The cable selection procedure in terms of current-carrying capacity is as follows:
  • Determination of the value of the operating current I B ;
  • Verification that the share of the third harmonic in the phase current does not exceed 33% and determination of whether the selection will be based on the neutral or phase current;
  • Selection of reduction factor;
  • Calculation of the working current I’ B after taking into account the correction factor k according to Formulas (1)–(3);
  • Selection of the cable on the basis of the load capacity indicated in the manufacturer’s catalog, taking into account the correction factors.
I B I B k
or
I N = 3 I B I 3 h % 100
I B = I N k
where k is the reduction factor selected from Table 5, I N is the neutral conductor current value, and I 3 h % is the percentage of the third harmonic current in the phase current.
Table 6 shows the calculations undertaken on the basis of the measurement values presented in Section 5 of the article. In the analyzed three-phase (three-circuit) circuit, the installation was made in the ground (five-wire cables laid in the ground without a cover). The content of the third harmonic of the currents in each phase conductor exceeded the value of 15% indicated in the standard.
Therefore, the selection of phase conductors should be undertaken on the basis of the phase conductor, and a correction factor of 0.86 should be applied. This means that, for cable routing in this way, a cable with a larger cross-section of 16 mm 2 should be selected, although for operating current of the given values in working conditions without the participation of harmonics, the appropriate cross-section would be 10 mm 2 . The value for the third harmonic in the neutral current was 95.2%. Selection of the conductor should be based on the cross-section of the neutral conductor. However, only Formula (2) will apply because the correction factor k for circuits where the third harmonic current is more than 45% is equal to unity. The value of such a current could be as much as 135.52A. This means that, despite the determined working current I B = 8.024A, the value calculated for the neutral conductor current reached as high as 22.92A. Thus, when selecting the conductor cross-section, it is necessary to use conductors with a cross-section of 2.5 mm 2 . The flow of current through the neutral conductor causes its additional heating, which does not occur under conditions of symmetrical operation of the circuit. This may lead to exceeding the permissible operating temperature for the cable and, in extreme cases, result in ignition of the insulation. Therefore, when the share of harmonics corresponding to zero sequences in the current is significant, it is necessary to take them into account during the cable selection procedure.

7. Conclusions

The article describes the results of measurements of electrical parameters of individual LED luminaires and LED lighting installations in an external and modernized plant. Based on the measurements and analyses carried out, it was found that the LED luminaires used in the tested circuits did not comply with the requirements of the cited EU regulations [11,12].
Based on the selected measurement results, it can be concluded that the outdoor lighting installation with discharge luminaires and LED luminaires described in Section 4 can be characterized as exceeding the permissible values for harmonic current components (the measurements of the parameters of the LED luminaires) by several times. The analysis was performed according to the requirements of the standard [11]. In the considered installation, LED luminaires with a rated active power of about 3 W were used.
LED lighting is a source of harmonic current emissions (for loads < 5, it may be in accordance with the regulations [11]). Hence, with a large number of such luminaires in use, there are significant excesses of current harmonic components. Section 5 presented selected measurement results for indoor lighting installation parameters. The installation was equipped with a lighting control system. Unfortunately, based on the analysis, it was found that the requirements of the standards were not met [11,12]. Unfortunately, there are no regulations regarding a requirement to test the values of harmonic current components when implementing control. Hence, it is necessary (recommended) to introduce into the regulations: (1) the requirement to perform acceptance measurements within the scope of determining power quality parameters and (2) the permissible values of these parameters (which should also be introduced into the control conditions).
Section 6 contains the results of calculations of cable cross-sections for the installation analyzed in Section 5. Unfortunately, the obtained results show that the selection of power cables was carried out without taking into account the requirements of the standard [35].
The problem of phenomena related to the occurrence of harmonic currents in power installations, although felt for several decades, is still ignored; e.g., when designing installations. This is despite the possibility of applying the provisions contained in standards, such as the quoted standard [35]. Regulations concerning lighting receivers (especially low-power ones) are very liberal, and there are simply no requirements regarding one important aspect of electricity quality, which is determining the values of current harmonic content coefficients for groups of lighting loads. Therefore, the authors have tried to present these problems in this article.

Author Contributions

Conceptualization, T.P. and M.K.; methodology, T.P. and M.K.; validation, investigation, M.K.; analysis, T.P. and M.K.; data curation, M.K.; writing—original draft preparation, T.P. and M.K.; writing—review and editing, T.P.; theoretical modeling, T.P.; software, M.K.; visualization, T.P. and M.K.; supervision, T.P.; project administration, M.K. All authors have read and agreed to the published version of the manuscript.

Funding

This research received no external funding.

Conflicts of Interest

The authors declare no conflict of interest.

References

  1. Commission Regulation (EU) 2019/2020 of 1 October 2019 Laying Down Ecodesign Requirements for Light Sources and Separate Control Gears Pursuant to Directive 2009/125/EC of the European Parliament and of the Council and Repealing Commission Regulations (EC) No 244/2009, (EC) No 245/2009 and (EU) No 1194/2012 (Text with EEA Relevance). Available online: https://webstore.iec.ch/publication/67329 (accessed on 1 October 2019).
  2. Pracki, P.; Jägerbrand, A. Application of road lighting energy efficiency evaluation system in practice. In Proceedings of the CIE Centenary Conference: Towards a New Century of Light, CIE, Paris, France, 15–16 April 2013. [Google Scholar]
  3. Zajkowski, M. The SOWA program for the modernization of road lighting in the commune. Przegląd Elektrotechniczny 2015, R. 91, 85–88. (In Polish) [Google Scholar]
  4. Weżgowiec, M.; Popławski, T.; Kurkowski, M. Forecasting energy consumption on lighting objectives in the years 2018–2030 in the aspect of resolving network of Polish progressive cities. Rynek Energii 2019, 1, 20–24. (In Polish) [Google Scholar]
  5. Cao, Y.; Wang, N.; Tian, H.; Guo, J.; Wei, Y.; Chen, H.; Miao, Y.; Zou, W.; Pan, K.; He, Y.; et al. Perovskite light-emitting diodes based on spontaneously formed submicrometre-scale structures. Nature 2018, 562, 249–253. [Google Scholar] [CrossRef] [PubMed]
  6. Lin, K.; Xing, J.; Quan, L.N.; de Arquer, F.P.G.; Gong, X.; Lu, J.; Xie, L.; Zhao, W.; Zhang, D.; Yan, C.; et al. Perovskite light-emitting diodes with external quantum efficiency exceeding 20 percent. Nature 2018, 562, 245–248. [Google Scholar] [CrossRef] [PubMed]
  7. Schabowski, J. Benefits of using modern composite technologies in the design, construction and maintenance of safe road infrastructure. Zeszyty Naukowo-Techniczne SITK RP Oddział w Krakowie 2020, 1, 45–59. (In Polish) [Google Scholar]
  8. Rockhill, A.A.; Liserre, M.; Teodorescu, R.; Rodriguez, P. Grid-filter design for a multimegawatt medium-voltage voltage-source inverter. IEEE Trans. Ind. Electron. 2011, 58, 1205–1217. [Google Scholar] [CrossRef]
  9. Gabe, I.J.; Montagner, V.F.; Pinheiro, H. Design and implementation of a robust current controller for VSI connected to the grid through an LCL filter. IEEE Trans. Power Electron. 2009, 24, 1444–1452. [Google Scholar] [CrossRef]
  10. Turkay, B.E.; Telli, A.Y. Economic analysis of standalone and grid connected hybrid energy systems. Renew. Energy 2011, 36, 1931–1943. [Google Scholar] [CrossRef]
  11. IEC 61000-3-2:2019+A1:2021; Electromagnetic compatibility (EMC)—Part 3-2: Permissible Levels—Permissible Levels of Harmonic Current Emissions (Phase Current Supply of the Load <or = 16 A). Available online: https://webstore.iec.ch/publication/28164 (accessed on 26 January 2018).
  12. IEC 61000-3-12: 2011; Electromagnetic Compatibility (Emc)—Part 3-12: Permissible Levels - Permissible Levels of Harmonic Currents Caused by the Operation of Loads to Be Connected to the Public Low-Voltage Power Supply Network with a Phase Current Supplying the Load Greater than 16 a and Less than or Equal to 75 A. Available online: https://webstore.iec.ch/publication/4144 (accessed on 12 May 2011).
  13. Kurkowski, M.; Popławski, T.; Mirowski, J. Results of Expert Opinions on Electricity Loads (including Lighting) and Audits of Electrical Installations; ABC Tarnaslight: Czestochowa, Poland, 2020; Company research unpublished. (In Polish) [Google Scholar]
  14. Holdyński, G.; Skibko, Z. Analysis of the phenomenon of current and voltage distortions on the example of a selected entertainment facility. ElektroInfo 2020, 11. (In Polish) [Google Scholar]
  15. Schneider Electric, Harmonic Filtering and Detection. Available online: http://www.schneider-electric.pl (accessed on 5 July 2023).
  16. Park, B.; Lee, J.; Yoo, H.; Jang, G. Harmonic Mitigation Using Passive Harmonic Filters: Case Study in a Steel Mill Power System. Energies 2021, 14, 2278. [Google Scholar] [CrossRef]
  17. Yu, Y.; Li, H.; Li, Z.; Zhao, Z. Modeling and analysis of resonance in LCL-type grid-connected inverters under different control schemes. Energies 2017, 10, 104. [Google Scholar] [CrossRef]
  18. Liserre, M.; Blaabjerg, F.; Hansen, S. Design and control of an LCL-filter-based three-phase active rectifier. IEEE Trans. Ind. Appl. 2005, 41, 1281–1291. [Google Scholar] [CrossRef]
  19. Cha, H.; Vu, T.K. Comparative analysis of low-pass output filter for single-phase grid-connected photovoltaic inverter. In Proceedings of the Twenty-Fifth Annual IEEE Applied Power Electronics Conference and Exposition (APEC), Palm Springs, CA, USA, 21–25 February 2010; pp. 1659–1665. [Google Scholar]
  20. Çiçek, A.; Erenoğlu, A.K.; Erdinç, O.; Bozkurt, A.; Taşcıkaraoğlu, A.; Catalão, J.P.S. Implementing a demand side management strategy for harmonics mitigation in a smart home using real measurements of household appliances. Int. J. Electr. Power Energy Syst. 2021, 125, 106528. [Google Scholar] [CrossRef]
  21. Bhonsle, D.C.; Kelkar, R.B. Design and Analysis of Composite Filter for Power Quality improvement of Electric Arc Furnace. In Proceedings of the 2013 3rd International Conference on Electric Power and Energy Conversion Systems, Istanbul, Turkey, 2–4 October 2013. [Google Scholar]
  22. Dzhankhotov, V.; Pyrhonen, J. Passive LC Filter Design Considerations for Motor Applications. IEEE Trans. Ind. Electron. 2013, 10, 4253–4259. [Google Scholar] [CrossRef]
  23. Meenakshi, J.; Sreedevi, V.T. Power Quality Improvement in a Cascaded Multilevel Inverter Interfaced Grid Connected System Using a Modified Inductive–Capacitive–Inductive Filter with Reduced Power Loss and Improved Harmonic Attenuation. Energies 2017, 10, 1834. [Google Scholar] [CrossRef]
  24. Gong, J.; Li, D.; Wang, T.; Pan, W.; Ding, X. A comprehensive review of improving power quality using active power filters. Electr. Power Syst. Res. 2021, 199, 107389. [Google Scholar] [CrossRef]
  25. Sikora, R.; Markiewicz, P. Analysis of Electric Power Quantities of Road LED Luminaires under Sinusoidal and Non-Sinusoidal Conditions. Energies 2019, 12, 109. [Google Scholar] [CrossRef]
  26. Karim, F.A.; Ramdhani, M.; Kurniawan, E. Low pass filter installation for reducing harmonic current emissions from LED lamps based on EMC standard. In Proceedings of the 2016 International Conference on Control, Electronics, Renewable Energy and Communications (ICCEREC), Bandung, Indonesia, 13–15 September 2016; pp. 132–135. [Google Scholar]
  27. Syafrudin, M.; Hadzer, C.M.; Sutanto, J. Zero-Sequence Harmonics Current Minimization Using Zero-Blocking Transformer and Shunt LC Passive Filters. In Proceedings of the International Conference on Power System Technology, Kunming, China, 13–17 October 2002; pp. 116–120. [Google Scholar]
  28. Popławski, T.; Kurkowski, M.; Mirowski, J. Improving the Quality of Electricity in Installations with Mixed Lighting Fittings. Energies 2020, 13, 6017. [Google Scholar] [CrossRef]
  29. Kurkowski, M.; Popławski, T.; Zajkowski, M.; Kurkowski, B.; Szota, M. Effective Control of Road Luminaires—A Case Study on the Example of a Selected City in Poland. Energies 2022, 15, 5378. [Google Scholar] [CrossRef]
  30. IEC 60598—1: 2021; Luminaires—Part 1: General Requirements and Tests. Available online: https://webstore.iec.ch/publication/67473 (accessed on 17 August 2020).
  31. Żagan, W. Fundamentals of Lighting Technology; OWPW: Warsaw, Poland, 2005. (In Polish) [Google Scholar]
  32. Wiśniewski, A. Electric Light Sources; VentureWell: Warsaw, Poland, 2010. (In Polish) [Google Scholar]
  33. EN 62384:2020; DC or AC Supplied Electronic Control Gear for Led Modules—Performance Requirements. Available online: https://sklep.pkn.pl/pn-en-iec-62384-2021-02e.html (accessed on 10 February 2021).
  34. Kurkowski, M. Sources, Modules and Led Luminaires in Terms of Normative Requirements. Selected Issues; Academic Textbook, Spatium Scientific and Publishing Institute: Radom, Poland, 2019; p. 137. (In Polish) [Google Scholar]
  35. HD 60364-5-52:2011+A12:2023-04; Electrical Installations in Buildings. Selection and Erection of Electrical Equipment. Available online: https://sklep.pkn.pl/pn-hd-60364-5-52-2011-a12-2023-04e.html (accessed on 18 April 2023).
Figure 1. Measured current and voltage waveforms of a lighting device with a discharge source. Source: authors’ own work adapted from [13].
Energies 16 06024 g001
Figure 2. Scheme of the measuring system. Source: authors’ own study.
Energies 16 06024 g002
Figure 3. The methodology used to test the electrical parameters of luminaires. Source: authors’ own study.
Energies 16 06024 g003
Figure 4. Waveforms of currents and voltages of lighting devices with LED diodes without a system of harmonic filters. Source: authors’ own work adapted from [13].
Energies 16 06024 g004
Figure 5. A simplified diagram of a lighting device with harmonic filtered LEDs. Source: authors’ own work adapted from [13].
Energies 16 06024 g005
Figure 6. Waveforms of current and voltage of a lighting device with LED diodes with a power factor correction system. Source: authors’ own work adapted from [13].
Energies 16 06024 g006
Figure 7. Waveforms of current and voltage of a lighting device with LED diodes with a system of filters. Source: authors’ own work adapted from [13].
Energies 16 06024 g007
Figure 8. Measured values of currents in phase and neutral conductors (mixed lighting installation). Source: authors’ own work adapted from [13].
Energies 16 06024 g008
Figure 9. Measured harmonic distribution of LED luminaires (data from the third circuit). Source: authors’ own work adapted from [13].
Energies 16 06024 g009
Figure 10. Values of currents in phase conductors and neutral conductor measured in an installation with LED luminaires with control. Source: authors’ own study.
Energies 16 06024 g010
Figure 11. Values of the THD I N factor of the current in the neutral conductor measured in an installation with a system of LED luminaires with control. Source: authors’ own study.
Energies 16 06024 g011
Figure 12. Measured harmonic distribution of LED luminaires (data from one measurement point from circuit one). Source: authors’ own work adapted from [13].
Energies 16 06024 g012
Figure 13. Measured harmonic distribution of LED luminaires (data from two measurement points from circuit one). Source: authors’ own work adapted from [13].
Energies 16 06024 g013
Figure 14. Measured harmonic distribution of LED luminaires (data from three measurement points from circuit one). Source: authors’ own work adapted from [13].
Energies 16 06024 g014
Table 1. Limit values of harmonic content [11,12,13].
Harmonic Order
h
Maximum Permissible Harmonic
Current Expressed as a Percentage
of the Input Current
at the Fundamental Frequency
(%)
Receivers with a
rated current less
than 16 A with
a power in the
range from 5 W to 25 W
[11,13]
Receivers with a
rated current
less than 16 A with
a power of more
than 25 W
[11,13]
Receivers with a
rated current
greater than 16 A
[12,13]
252-
33527 λ 21.6
5251010.7
73077.2
92053.8
112033.1
132032.0
15 ≥ h ≥ 39
(odd harmonics only)
-3-
λ is the circuit power factor.
Table 2. Rated and measured values of parameters of tested luminaires. Source: authors’ own work.
No.Type of Light SourceMeasured Electrical Parameters
UPIQSDF (cos ϕ )PF ( λ )THD I
(V)(W)(A)(var)(VA)(-)(-)(%)
1LED230.503.0230.03−1.1496.5010.9360.470171.00
2LED230.305.6960.05−3.47812.650.8570.450158.20
3Discharge230.2086.540.39−13.3590.190.9400.95024.99
4Discharge230.20150.540.7129.11167.190.9000.83434.15
5LED230.40115.30.52−29.08124.20.9700.9649.00
Table 3. Summary of the power of the lighting installation luminaires. Source: authors’ own study.
Circuit NumberTotal Circuit PowerLED LuminairesDischarge Luminaires
(W)P L E D (W)P W (W)
1106382981
21111881023
313222611061
Table 4. RMS values of odd harmonics in individual circuits of the lighting system. Source: authors’ own study.
Harmonic OrderI L 1 *I L 2 **I L 3 ***I L N ****
(A)(A)(A)(A)
NumberEffective value
10.3590.3801.0990.683
30.3530.3610.8041.498
50.3360.3430.6630.350
70.3200.3250.6130.332
90.3010.3020.5081.074
110.2710.2730.4310.231
130.2440.2510.3880.224
150.2140.2250.3030.695
170.1800.1920.2420.161
190.1500.1630.1940.117
210.1200.1320.1360.355
230.0910.0980.0950.088
250.0680.0690.0560.063
270.0490.0470.0120.095
290.0380.0330.0130.036
310.0360.0320.0350.023
330.0390.0370.0570.130
350.0420.0390.0530.014
370.0450.0410.0630.029
390.0450.0410.0560.136
* I L 1 —RMS value of the current in the phase conductor (circuit one), ** I L 2 —RMS value of the current in the phase conductor (circuit two), *** I L 3 —RMS value of the current in the phase conductor (circuit three), **** I L N —RMS value of the current in the neutral conductor.
Table 5. Factors reducing the current-carrying capacity of cables for higher harmonics in four- and five-wire installations. Source: [35].
Reducing Factor k
Selection of the
Cross-Section of
the Conductors on
the Basis of the
Phase Current
Value
Selection of the
Cross-Section of
the Conductors on
the Basis of the
Value of the
Neutral Current
( % ) --
0–151.00-
15–330.86-
33–45-0.86
>45-1.00
Table 6. Calculated corrected values for phase cross-sections of wires and neutral current of the lighting system with a significant share of the third harmonic. Source: authors’ own study.
Operating
Current Value
I B 1
45.83 A
I B 2
46.09 A
I B 3
47.45 A
I N
8.024 A
Wire
Cross-Section
Wire cross - section 10 mm 2 10 mm 2 10 mm 2 1.5 mm 2 (*) 5 × 10 mm 2 (**)
The share of the third harmonic in the phase current 16.5 % 17.2 % 16.6 % 95.2 %
I B 53.29 A 53.59 A55.17 A 22.92 A
Wire cross - section 16 mm 2 16 mm 2 16 mm 2 2.5 mm 2 (*) 5 × 16 mm 2 (**)
(*) result based on calculations, (**) cable selection in accordance with the standard [35].
Disclaimer/Publisher’s Note: The statements, opinions and data contained in all publications are solely those of the individual author(s) and contributor(s) and not of MDPI and/or the editor(s). MDPI and/or the editor(s) disclaim responsibility for any injury to people or property resulting from any ideas, methods, instructions or products referred to in the content.

