Article

Oat as a Potential Source of Energy

by
Renata Tobiasz-Salach
1,*,
Barbara Stadnik
1,2 and
Marcin Bajcar
3
1
Department of Crop Production, University of Rzeszow, Zelwerowicza 4, 35-601 Rzeszow, Poland
2
Doctoral School, University of Rzeszow, Rejtana 16C, 35-959 Rzeszow, Poland
3
Department of Bioenergetics, Food Analysis and Microbiology, University of Rzeszow, Ćwiklińskiej 2D, 35-601 Rzeszow, Poland
*
Author to whom correspondence should be addressed.
Energies 2023, 16(16), 6019; https://doi.org/10.3390/en16166019
Submission received: 17 July 2023 / Revised: 10 August 2023 / Accepted: 15 August 2023 / Published: 17 August 2023
(This article belongs to the Section K: State-of-the-Art Energy Related Technologies)

Abstract

:
Oat (Avena sativa L.) is one of the agricultural crops that can be grown in marginal areas. Grain and straw are used mainly for food and fodder purposes. However, due to the high-fat content in the grain and the small amount of ash, it can be an attractive raw material for energy production. The biomass can be straw and oat grain. Grain should be intended for food purposes, but if it does not meet the quality requirements, it can be used for energy purposes. The aim of the experiment was to evaluate the energy usefulness of four oat cultivars depending on the applied level of nitrogen fertilization. The research results show that oat grain and straw can be used as fuel for energy purposes. The average calorific value of grain was 18.7 MJ·kg−1, and the ash content in dry matter was 2.03%. With the increase in the dose of nitrogen fertilization, a decrease in the calorific value of oat and straw grains and a decrease in ash content were noted. The findings show significant varietal differences. Oat straw had a lower calorific value and a higher ash content, which indicates its lower usefulness for energy purposes compared to grain.

1. Introduction

The energy industry based on conventional fuels contributes significantly to environmental pollution. For these reasons, it is necessary to use renewable energy sources, which are an alternative to traditional energy carriers. Obtaining energy from these sources is more environmentally friendly and reduces the harmful impact of the energy industry on the natural environment, mainly by reducing the emission of harmful substances, especially greenhouse gases [1,2,3]. The framework of the European Union’s climate and energy policy until 2030 assumes an increase to at least 32% of the share of energy from renewable sources in total energy consumption [4].
One of the ways to implement the sustainable development policy is the use of low-emission fuels, which include biomass [5,6,7]. Biomass is currently considered the renewable energy source with the greatest potential [8]. When burning biomass, carbon dioxide and other pollutants are released, but this is a gas that has been absorbed into the original growth of the burned biomass and will be absorbed during photosynthesis by new plants [9,10,11]. The total emission factor using biomass is much lower than fossil fuels [12]. For countries whose economy is based on natural resources, it is a good idea to produce composite fuels from a combination of biomass and fossil fuel [13,14]. Implementing the principles of a low-emission economy is a long-term process, requiring many new investments and thus entailing significant financial outlays [15,16] In the current climate and energy crisis, plant biomass is of particular interest to the power industry, politics, and the economic sector. The energy potential and its general availability, as well as the possibility of effective management, make biomass a basic, renewable source of energy. For energy purposes, mainly wood and waste from its processing, plants from energy crops, agricultural products, organic waste, municipal waste, and sewage sludge are used [17,18,19,20,21,22].
The development of specific energy crops has been proposed as a strategy for energy production without negative impacts on food security and the environment [23]. Plants intended for cultivation for energy purposes should be characterized by stable yields and high resistance to diseases and pests. An important aspect is an ability to adapt to the largest possible area [24,25,26]. The suitability of plants for intensive cultivation for use in the energy sector is also determined by the energy efficiency of the crop, i.e., the ratio of the energy contained in biomass to the energy needed to produce it. Marginal land, meaning land of lower quality that is devastated and degraded, should be used for energy crops, which include soils contaminated with heavy metals, salty soils, and soils unsuitable for the cultivation of plants for consumption and fodder purposes but that meet the requirements for the cultivation of energy crops [27,28,29,30]. Popular species grown for energy purposes are perennial grasses, such as giant miscanthus (Miscanthus giganteus), reed canary grass (Phalaris arundinacea L.), and switchgrass millet (Panicum virgatum); perennials, such as Virginia mallow (Sida hermaphrodita L. Rusby) and sunflower (Helianthus salicifolius); and trees, such as willow (Salix viminalis) and poplar (Populus) [31,32,33,34,35]. There is also the possibility of alternative use of typical agricultural plant species. Energy crops can take many forms and can be transformed into many different products. Many crops are versatile because they can be used to produce more than one type of energy product, such as hemp (both oil and solid biomass) and cereals (ethanol and solid biomass) [32].
Cereals are the main agricultural crops in the world [36]. After resourcing the food market, with the surplus of grain produced, stocks that have not been used for food purposes or are not suitable for human or animal consumption can be used for energy purposes for the production of biogas or direct combustion. Among cereals, oat (Avena sativa L.) has a special energetic value [32,37,38]. Avena sativa L. is an annual plant belonging to the Poaceae family. In 2021, the global oat harvest area was over 9.5 million hectares, and the grain production volume was 22 million tons [36]. Scientific research on the possibilities of using oat focuses primarily on the nutritional value and health-promoting properties of the grain [39,40]. Oat is a valued cereal due to the high content of beta-glucan in the grain, which has a significant impact on the prevention and treatment of civilization diseases [32,41,42,43]. It is a cereal with low soil requirements and resistance to soil acidification, which can be successfully grown in marginal areas. In addition, it does not require the use of high doses of fertilizers, thanks to which expenditures on grain production can be limited [44,45]. It is a low-input cereal, widely cultivated around the world. The areas of oat production are in Northern Europe and North America, as well as in China and Australia [36,46]. This crop is also considered a valuable catch crop for disease control in cereal rotations, reducing the amount of chemicals even in successive crops. Oat production costs are lower than other cereals [46]. The unique chemical composition, high nutritional value, and relatively low input requirements make oat unique among cereal plants [45].
The oat grain has the ability to accumulate a large amount of fat in the endosperm compared to other cereals [47]. It has a relatively high total lipid content and consequently also a high energy value [48]. The total fat content and the ability to accumulate lipids in the endosperm are strongly determined by the cultivar. The naked cultivars have a higher content of this component in comparison to the hulled cultivars. Oat can accumulate from 10% to even 18% of fat, which is important when using grain for energy purposes [49,50,51]. The basic conditions that an energy plant must meet are high calorific value, ease of transport, and storage. The average calorific value of the grain is 18.5 MJ·kg−1 with an average moisture of 10–13%, and its bulk density is 0.75 kg·dm−3. The reasons why oat grains can be used for combustion are low soil requirements, a long tradition in the cultivation of this species in Poland and EU countries, and the availability of machines for cultivating this species. The combustion process is carried out in special burners that require the supply of the right amount of air and maintaining a temperature different from traditional biomass [37,52].
In addition to grain, surplus oat straw can also be used for energy purposes. However, post-harvest residues must be collected, processed, and compacted to facilitate efficient handling, transport, and use [53]. Straw is an agricultural waste that can be used as an energy carrier, which reduces the costs of heat generation and improves the profitability of agriculture and has a beneficial effect on the environment. Straw combustion reduces harmful NO, NOx, and SO2 pollutants and increases CO emissions compared to coal combustion [54]. The large-scale use of straw may, however, negatively affect biodiversity and humus content in the soil; therefore, only part of the potential of straw can be treated as waste and used for energy production [55,56].
Nitrogen (N) is one of the most important and complex components affecting the yield and quality of crops [57]. At the same time, it is the most energy-intensive and cost-intensive link in agricultural technology. The effect of nitrogen fertilization is noticeable in the form of a significant increase in yield; however, excess nitrogen can cause side effects, such as lodging plants or the accumulation of excessive amounts of nitrates and nitrites in them. Too much fertilization also causes soil pollution and can contribute to the eutrophication of inland waters. Therefore, it is desirable to optimize nitrogen fertilization, with possibly small doses, properly selected forms of fertilizer, and frequent control of the supply of this component in the development stages of cereals [57,58,59,60,61]. At present, when many countries are increasingly concerned about the environmental impact of agricultural production and the rising prices of fertilizers, the relatively low-input requirements of oat are an important advantage of cultivation. Oat is generally considered to have higher nitrogen utilization efficiency compared to other grains [46,58,62]. Nitrogen is the most absorbable nutrient in oat [63]. Although it is a field crop well adapted to cultivation in poorer farming conditions, nitrogen fertilization strongly affects oat yields and the chemical composition of grain. Nitrogen deficiency slows down plant growth, shortens the period of their vegetative development, accelerates maturation, and reduces the photosynthetic efficiency of chloroplasts. [59,62,64,65]. Determining the optimal fertilization for new oat culivars, the grain of which can be used for nutritional and energy purposes, is justified. In the scientific literature, there are few reports on the effect of nitrogen dose on the energy usefulness of crops. Oleszek and Matyka [66] showed that increased nitrogen fertilization improved the quality of biomass of perennial crops, such as Virginia mallow and reed canary grass for biogas production, primarily by reducing the lignin content and increasing the ratio of structural carbohydrates to lignin. Studies on the energy efficiency of biogas production from maize, sorghum, and canary reed silage indicated that, in general, the production technologies of crops where the low levels of nitrogen fertilization were applied proved to have the highest energy efficiency [67]. In the traditional tillage system of triticale for bioethanol production purposes, N fertilizer is recommended for use between 40 and 80 kg N·ha−1. Such a dose of nitrogen provides a sufficient yield of grain, starch, and bioethanol and good agronomic efficiency of N fertilizer [68].
Determining the cultivars of oat that can be grown for biomass is important, especially if the grain does not meet the quality requirements. This is especially true for bare-hulled forms, which, due to the lack of husks and lower yields, are used to a small extent for food and fodder purposes. Grain and straw of such forms can be used to obtain energy. It is also important to determine the optimal dose of nitrogen fertilization for such varieties, which not only determines the yield of grain and straw but also may affect biomass parameters.
The aim of the research is to compare the usefulness of grain and straw of hulled and naked oat cultivars for energy purposes with different nitrogen fertilization. The research hypothesis was adopted, which assumed that naked forms of oat are characterized by better energy usefulness than hulled forms and that differentiated nitrogen fertilization affects the calorific value of the grain.

2. Materials and Methods

2.1. Field Experiment

The study material consisted of grain and straw of four oat cultivars, namely the Nagus and Maczo cultivars of naked oat as well as the Gniady and Bingo cultivars of hulled oat. The study was conducted on the experimental fields of the Research and Educational Station in Krasne, Poland (50°02′52″ N 22°05′25″ E) belonging to the University of Rzeszow in 2015–2016. Ammonium nitrate (34% N) was used as a nitrogen fertilizer. Nitrogen fertilization was applied on four levels:
0 kg N ha−1 (control plots);
40 kg N ha−1;
80 kg N ha−1;
120 kg N ha−1.
The field experiment was conducted in four replications on brown soil with pH in KCl ranging from 6.1 to 7.2. The content of assimilable components in the 0–25 cm soil layer in mg·kg−1 was 138.3 (P), 161.4 (K), and 48.2 (Mg). Average level of microelement content was 1.6 (B); 149.1 (Mn); 4.6 (Cu); 8.6 (Zn); and 988.3 (Fe). The crop was harvested at the stage of full maturity of the plants. Grain and straw from each experimental facility were weighed to determine the yield. Grain and straw yields are given for a moisture content of 14%. Three samples of grain and straw for energy analysis were randomly taken from each object.

2.2. Laboratory Analysis

2.2.1. Analysis of the Content of Macro- and Microelements in Oat Grain

The samples were ground in a Retsch ZM2000 laboratory mill using a sieve with a diameter of 1 mm and were subjected to mineralization under high pressure, in super pure 65% HNO3. Five-gram samples were weighed and placed in Teflon vessels, which were then filled with 8 mL of nitric acid and sealed tightly. For each group of nine samples, the rotor of the digestion system was also filled with a blank sample. The samples were digested with the algorithm of temperature increase applied as specified for biological samples, without exceeding 200 °C. This was carried out using an Ethos One microwave digestion system from Milestone (Sorisole (BG)–Italy). The samples were cooled down to room temperature and supplemented with water to a volume of 50 mL. The detection threshold obtained for each element was not lower than 0.01 mg·kg−1 (with an assumed detection capacity of the measuring apparatus at a level exceeding 1 ppb). The measurements were performed with an ICP-OES spectrometer, Thermo iCAP Dual 6500 (Thermo Fisher Scientific, Schaumburg, IL, USA) with horizontal plasma, and with the capacity of detection being determined both along and across the plasma flame.

2.2.2. Combustion Analysis of Samples

The analyzed material was crushed in a lab mill to achieved a particle size of less than 1 mm, thus obtaining a fully homogeneous material. Next, 1 g tablets for the direct analysis of calorific value was prepared from the overall sample using an automatic tableting device. The calorific value (CV) was determined using the LECO AC500 apparatus for calorimetric tests. The heat of combustion was determined by burning the sample in the aerated atmosphere in a pressure container enmeshed in a water jacket from all sides in order to ensure the monitoring of heat transfer. An 8 cm long wire was used to ignite the sample. No additional catalysts were applied in the analysis. Measurements of the water temperature were monitored using an electronic thermometer with an accuracy of 0.0001 °C. Heat exchange was continually monitored using a measurement system. The calorific value of the analyzed material was determined by relying on the amount of heat generated.
The energetic value (EV) of the yield of grain and straw from 1 ha was calculated by multiplying the calorific value and the yield obtained from 1 ha.
The ash content was determined by burning the material in a muffle furnace at 850 °C and expressed in % as given in PN-EN ISO 18122:2016-01 [69].
The analysis of CO2, CO, and NOx concentrations was performed using the ULTRAMAT 23 analyzer. The analyzed sample was burned in the amount of 10 g under conditions controlled at 850 °C for 20 min (until completely incinerated).
Combustion was carried out using the Leco Tga 701 thermogravimetric analyzer, which was directly connected to the Ultramat 23 analyzer. The simulated combustion conditions corresponded to the real conditions of biomass combustion in boilers adapted to biomass combustion.
In order to calculate the content of particular gases during the combustion process, the algorithm presented in Table 1 (using the example of CO2) was used.
The research results are presented as averages for the years 2015–2016.

2.3. Statistical Analysis

Statistical analysis was performed using TIBCO Statistica 13.3.0 (TIBCO Software Inc., Palo Alto, CA, USA). In order to detect all deviations from the normal distribution at p = 0.05, the Shapiro–Wilk test was performed. The homogeneity of variance was checked. A two-way ANOVA analysis was performed. Tukey’s post hoc test with a significance level of p ≤ 0.05 was performed to determine and verify the relationship.

3. Results and Discussion

3.1. Yield of Grain and Straw

Understanding the impact of using nitrogen fertilizers on biomass production and N accumulation is essential to optimizing yield and quality [70]. Nitrogen (N) is the most absorbable nutrient for oat [63]. Nitrogen fertilization strongly affects both oat yields and grain quality, despite the fact that it is an agricultural species well adapted to cultivation in unfavorable soil and climatic conditions [64]. In the conducted experiment, a significant increase in the yield of oat grain and straw was noted with the increase in the dose of nitrogen fertilization (Table 2). Similarly, in other studies, the yields of the aboveground oat mass significantly increased under the influence of nitrogen fertilization [71,72]. Greater yield increases were noted between lower doses of nitrogen. Between the doses of 0–40 and 40–80 kg N·ha−1, an increase in yield by more than 0.50 t ha−1 was noted, while between the doses of 80 and 120 kg N·ha−1, the increase was 0.32 t·ha−1 (Table 2). Similar results were reported by May et al., 2020 [65] in their research, where grain yield increased to the highest N index (140 kg·ha−1), but started to level off at 100 kg·ha−1 increasing from 6.63 to 6.74 t·ha−1 at 140 kg·ha−1.
Significant differences in the yield of the studied cultivars were found. In hulled cultivars (Bingo and Gniady), the average grain yield was 6.90 t·ha−1, while in naked ones (Maczo and Nagus), it was 4.50 t·ha−1. In addition, in the study of Wróbel et al., 1999 [72], hulled oat was characterized by higher yields than naked oat. The hulled forms were characterized by better yields, but this was strictly dependent on the cultivar. Some types of naked oat exceeded the yield of naked oat grain [73]. The average straw yield in the experiment was similar to grain yield and amounted to 5.66 t·ha−1. Nitrogen fertilization and cultivar, as in the case of grain, determined the obtained yield (Table 2).

3.2. Energetic Value of Grain and Straw

Cereal grains, especially oat and corn, are increasingly used for energy purposes in the USA, Scandinavia, and Poland. It is a raw material that does not cause difficulties in the automation of heating devices, which are often equipped with replaceable grates and burners, thanks to which devices can be adapted to burn different types of biomass [74,75,76]. Biomass can be used directly in raw form or processed in thermal, thermochemical, or biochemical processes to obtain a liquid, solid, and gaseous fuels. Each of these processes is characterized by a different efficiency of biomass conversion. Biogas has the lowest conversion efficiency, while direct combustion is the highest and least problematic. The literature sources give an average level of efficiency of direct combustion of solid biomass at the level of 70–90% [14,77,78].
The calorific value (CV) is an important indicator of the energetic value of raw materials [79,80]. CV is usually measured in terms of energy content per unit mass or volume, hence MJ·kg−1 for solids, MJ·L−1 for liquids, and MJ (N·m3)−1 for gases [17]. The condition that an energy plant must meet is a high CV. It should be in the range of 15–19 MJ·kg−1 [81]. Among cereals, oat is considered to be a better raw material for combustion than wheat, triticale, and barley [37]. The calorific value strictly depends on the moisture content of the material, and for cereals it ranges from 15.3 MJ·kg−1 for barley to 16.6 MJ·kg−1 for oat [37,76,82,83]. Pinto et al., 2021 [38] concluded that oat is a species with high potential for use as an energy product, and selecting the most productive cultivars in the region is critical. The average calorific value of grain in their experiment was 17.9 MJ·kg−1. In this study, the average calorific value of oat was high and amounted to 18.3 MJ·kg−1. Significant varietal differences were noted. The grain of the Maczo and Nagus cultivars had a higher calorific value compared to the Bingo and Gniady cultivars (Table 3). This dependence may result from the different chemical compositions of the tested cultivars. Naked cultivars are known to have a characteristically higher grain fat content. With the aim of energy use of cereals, it becomes more desirable to increase the fat content in grain, because its combustion gives twice as much energy as when burning the same amount of protein [84,85,86,87]. At higher doses of nitrogen, a lower calorific value of grain and straw was noted compared to objects without fertilization and fertilized with 40 kg N·ha−1 (Table 3). However, in the study of Kaszkowiak and Kaszkowiak [82], increasing the dose of nitrogen fertilization in oat caused a significant increase in the energetic value of grain. The observed differences could have resulted from the fact that higher nitrogen fertilization had a negative effect on the fat content, but a positive one on the protein content in cereal grains, which was also observed in the studies of several authors [75,84,88].
The average CV of oat straw is 17.8 MJ·kg−1 [17]. In the conducted experiment, this value was lower and averaged 14.8 MJ·kg−1. The cultivar factor had no significant effect on the obtained values, while the level of nitrogen fertilization determined the size of the examined feature. Significant decreases in the calorific value of oat straw were noted with the increase in the nitrogen dose. Oat straw from samples fertilized with nitrogen at the level of 120 kg N·ha−1 had a lower calorific value by 0.78 MJ·kg−1 compared to objects without fertilization (Table 3).
To assess the energy suitability of a crop, an important indicator may be the energetic value obtained from the cultivation area (EV), which is influenced by the yield and the calorific value of the crop. In the conducted study, along with the increase in nitrogen fertilization, an increase in EV of both grain and straw from 1 ha of cultivation was noted. This is due to the increase in grain yield per area unit (Table 3). The yield increase compensated for the decrease in the calorific value of the yield occurring with the increase in the nitrogen dose (Table 3). Optimization of nitrogen fertilization of energy crops must balance the conflict between the aspects of combustion efficiency and quality [89]. The significantly higher value of the EV index was noted in hulled cultivars, despite the fact that they were characterized by lower calorific value (Table 3).

3.3. Ash Content

The ash content has a significant impact on the suitability of the raw material for energy purposes [90,91,92]. The lower the ash content, the more useful the raw material is for energy purposes. Knowledge of the ash content is necessary for the selection of appropriate combustion and ash treatment technologies. The high content of this component and its melting and slagging are problematic. For fuels with a high ash content, combustion of the raw material can lead to irregular airflow, resulting in incomplete combustion and increased gas emissions [93,94].
Cereal grain contains about 3.5–6.0% ash, while fuelwood contains only about 0.5% [94]. As a result of the combustion of oat biomass, a relatively low amount of ash is generated (Table 4). Due to its properties, it can be considered a useful fertilizer and not a burdensome waste [74]. Ash from biomass combustion is a good source of phosphorus in the soil and may replace phosphate rock in the future [95]. The melting point of oat grain ash exceeds 1200 °C, which is why it can be recommended for the production of thermal energy. Considering these favorable features, an analysis of the ash content was undertaken in terms of the cultivar and the level of nitrogen fertilization in oat grain and straw. The results of other studies indicate that increased nitrogen fertilization leads to an increase in the ash content in oat grain [61,62]. In the experiment, oat grain contained less ash (average 2.03%) compared to the results in other studies, where this value was 3.90–6.02% [96]. The analysis of ash content in oat showed that oat straw contained much more ash (3.85% on average) (Table 4). Studies have shown that increasing the level of nitrogen fertilization reduces the ash content in oat yield (Table 4). With N fertilization at the level of 120 kg·ha−1, 0.17% less ash was recorded in grain and 0.19% less in straw compared to objects without N fertilization.
Significant cultivar differences were observed. The lowest amount of ash in grain was found in the Maczo cultivar and the highest in the Nagus cultivar. The difference was 0.15% (Table 4). In oat straw, the lowest amount of ash was recorded in the Bingo cultivar and the highest in the Nagus cultivar. There was no relationship between the ash content and the form of oat—hulled or naked. The ash content in oat biomass is positive from the point of view of suitability for energy purposes through direct combustion [93]. This share is lower than that obtained in other studies; e.g., Keppel et al. [37] measured the ash content of oat grain at 2.86%.

3.4. Analysis of the Content of Macro- and Microelements in Oat Grain
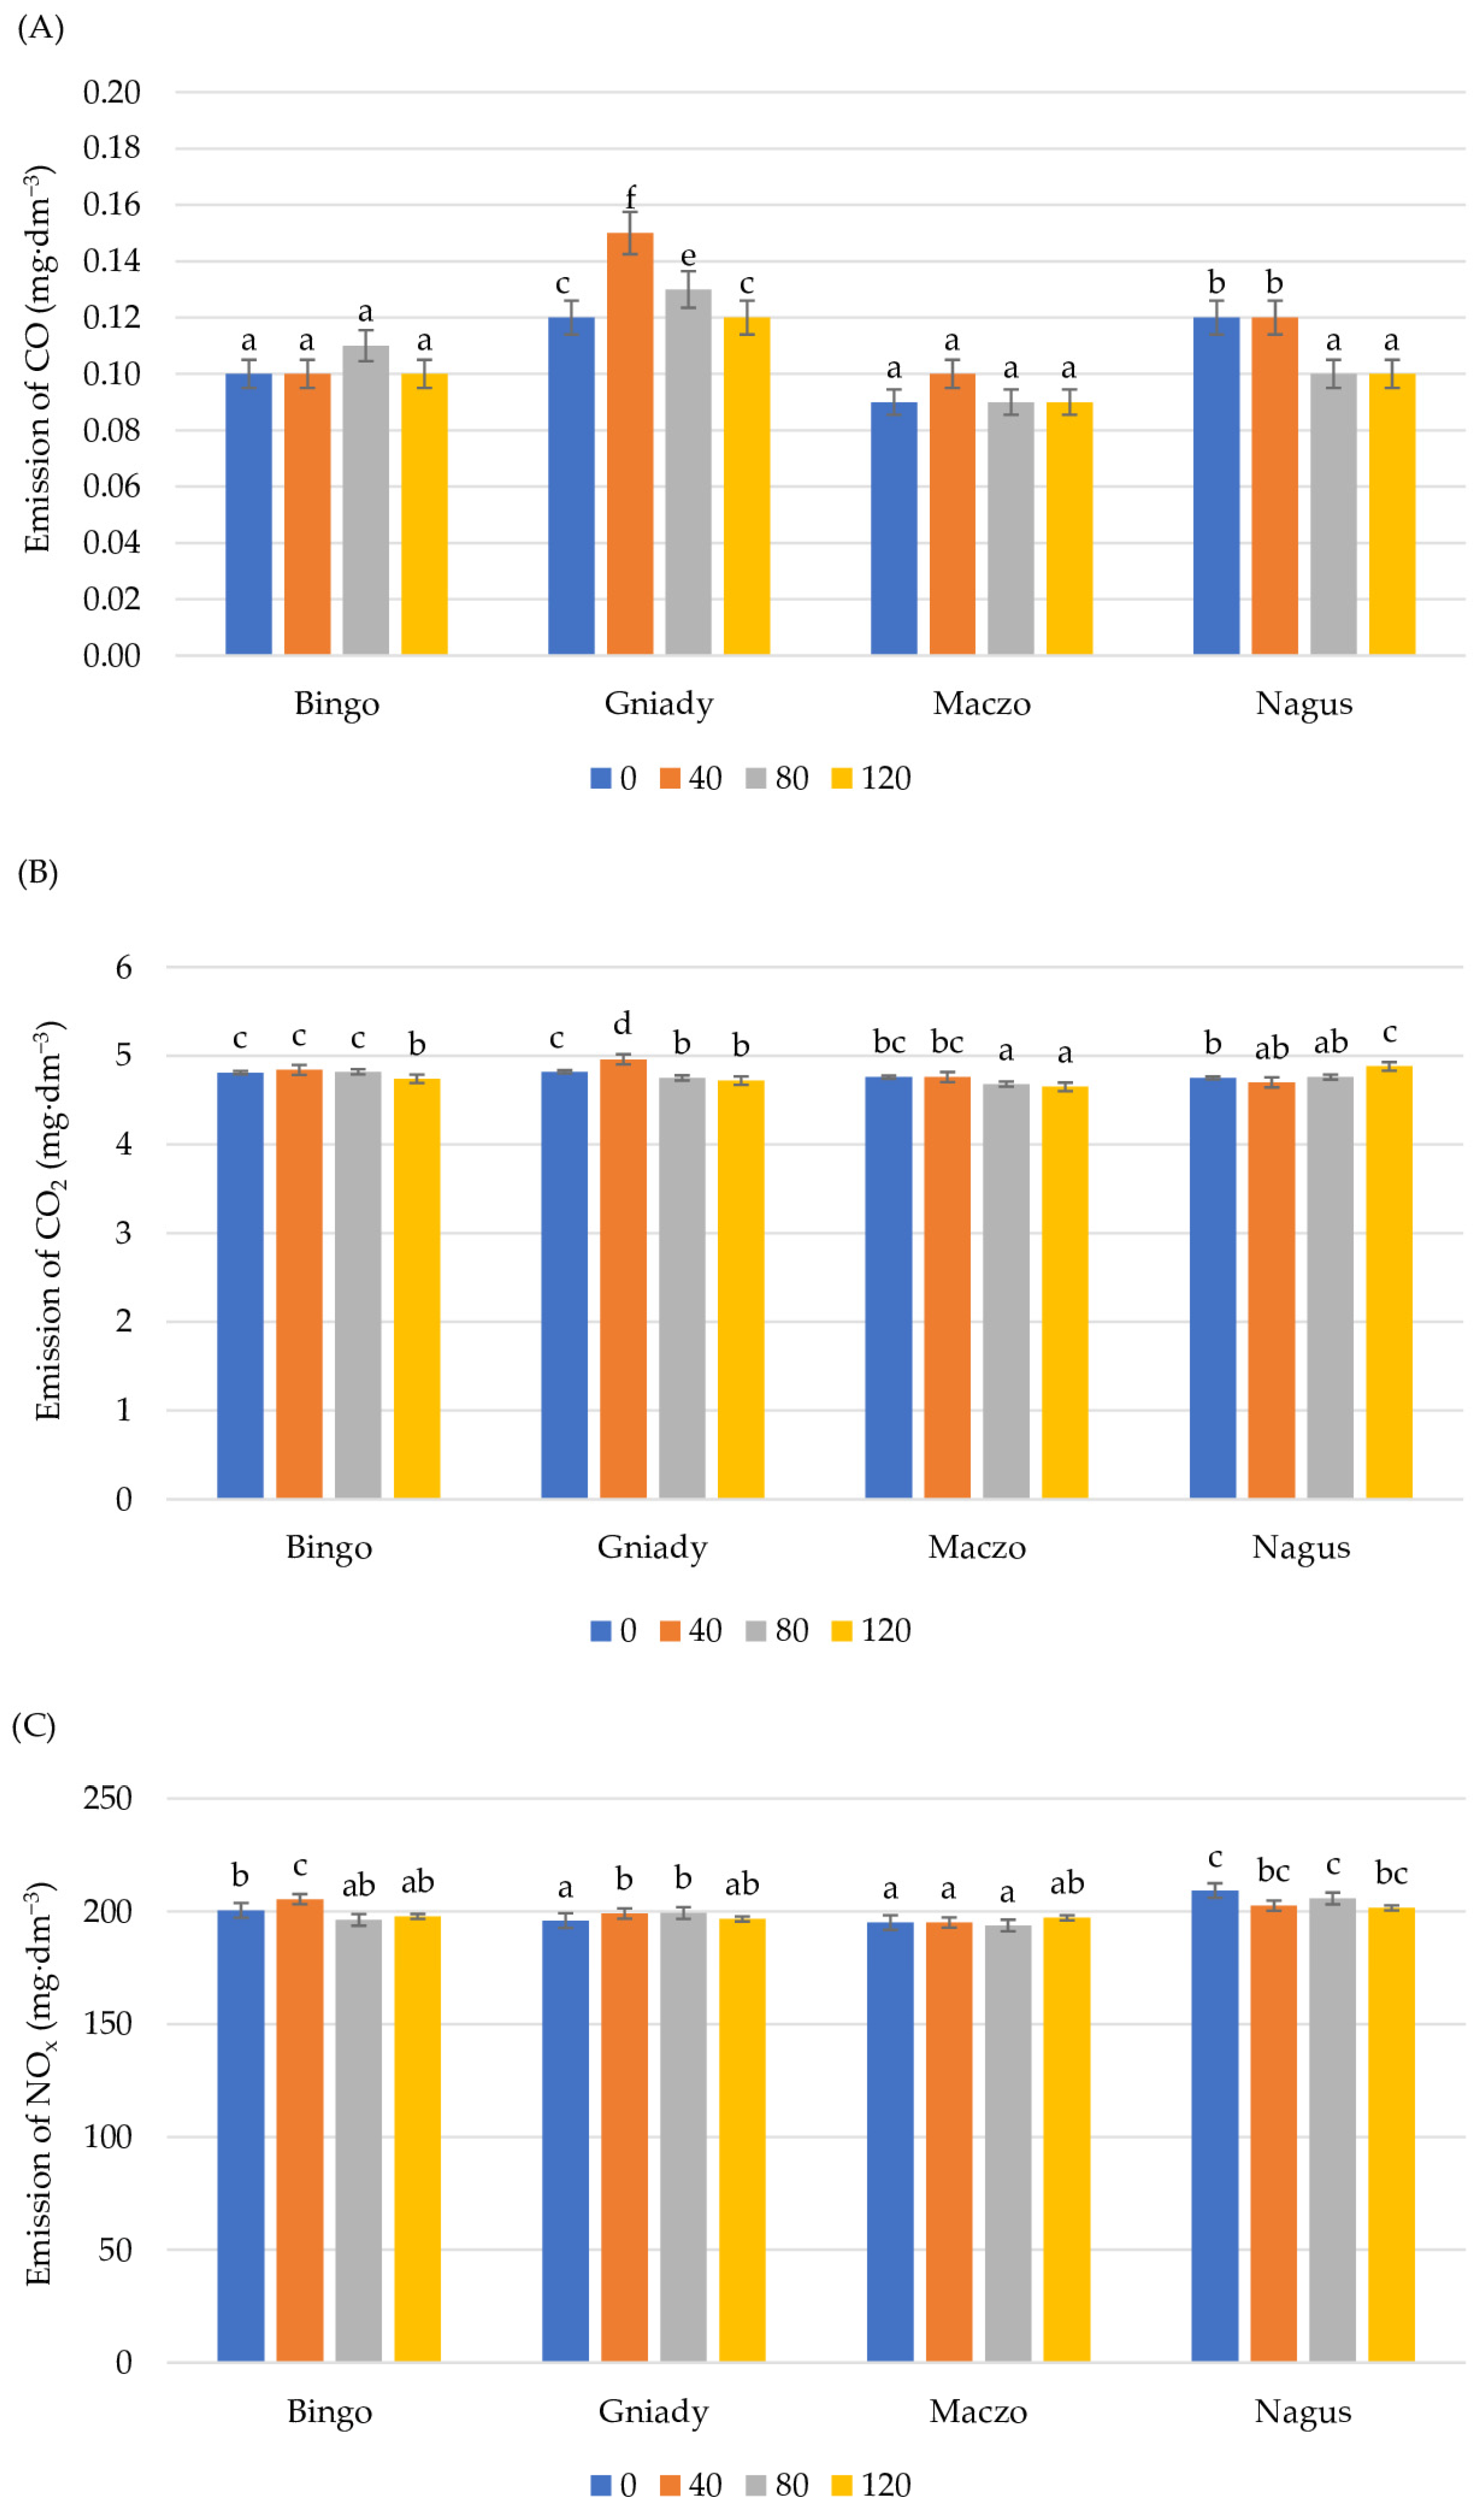
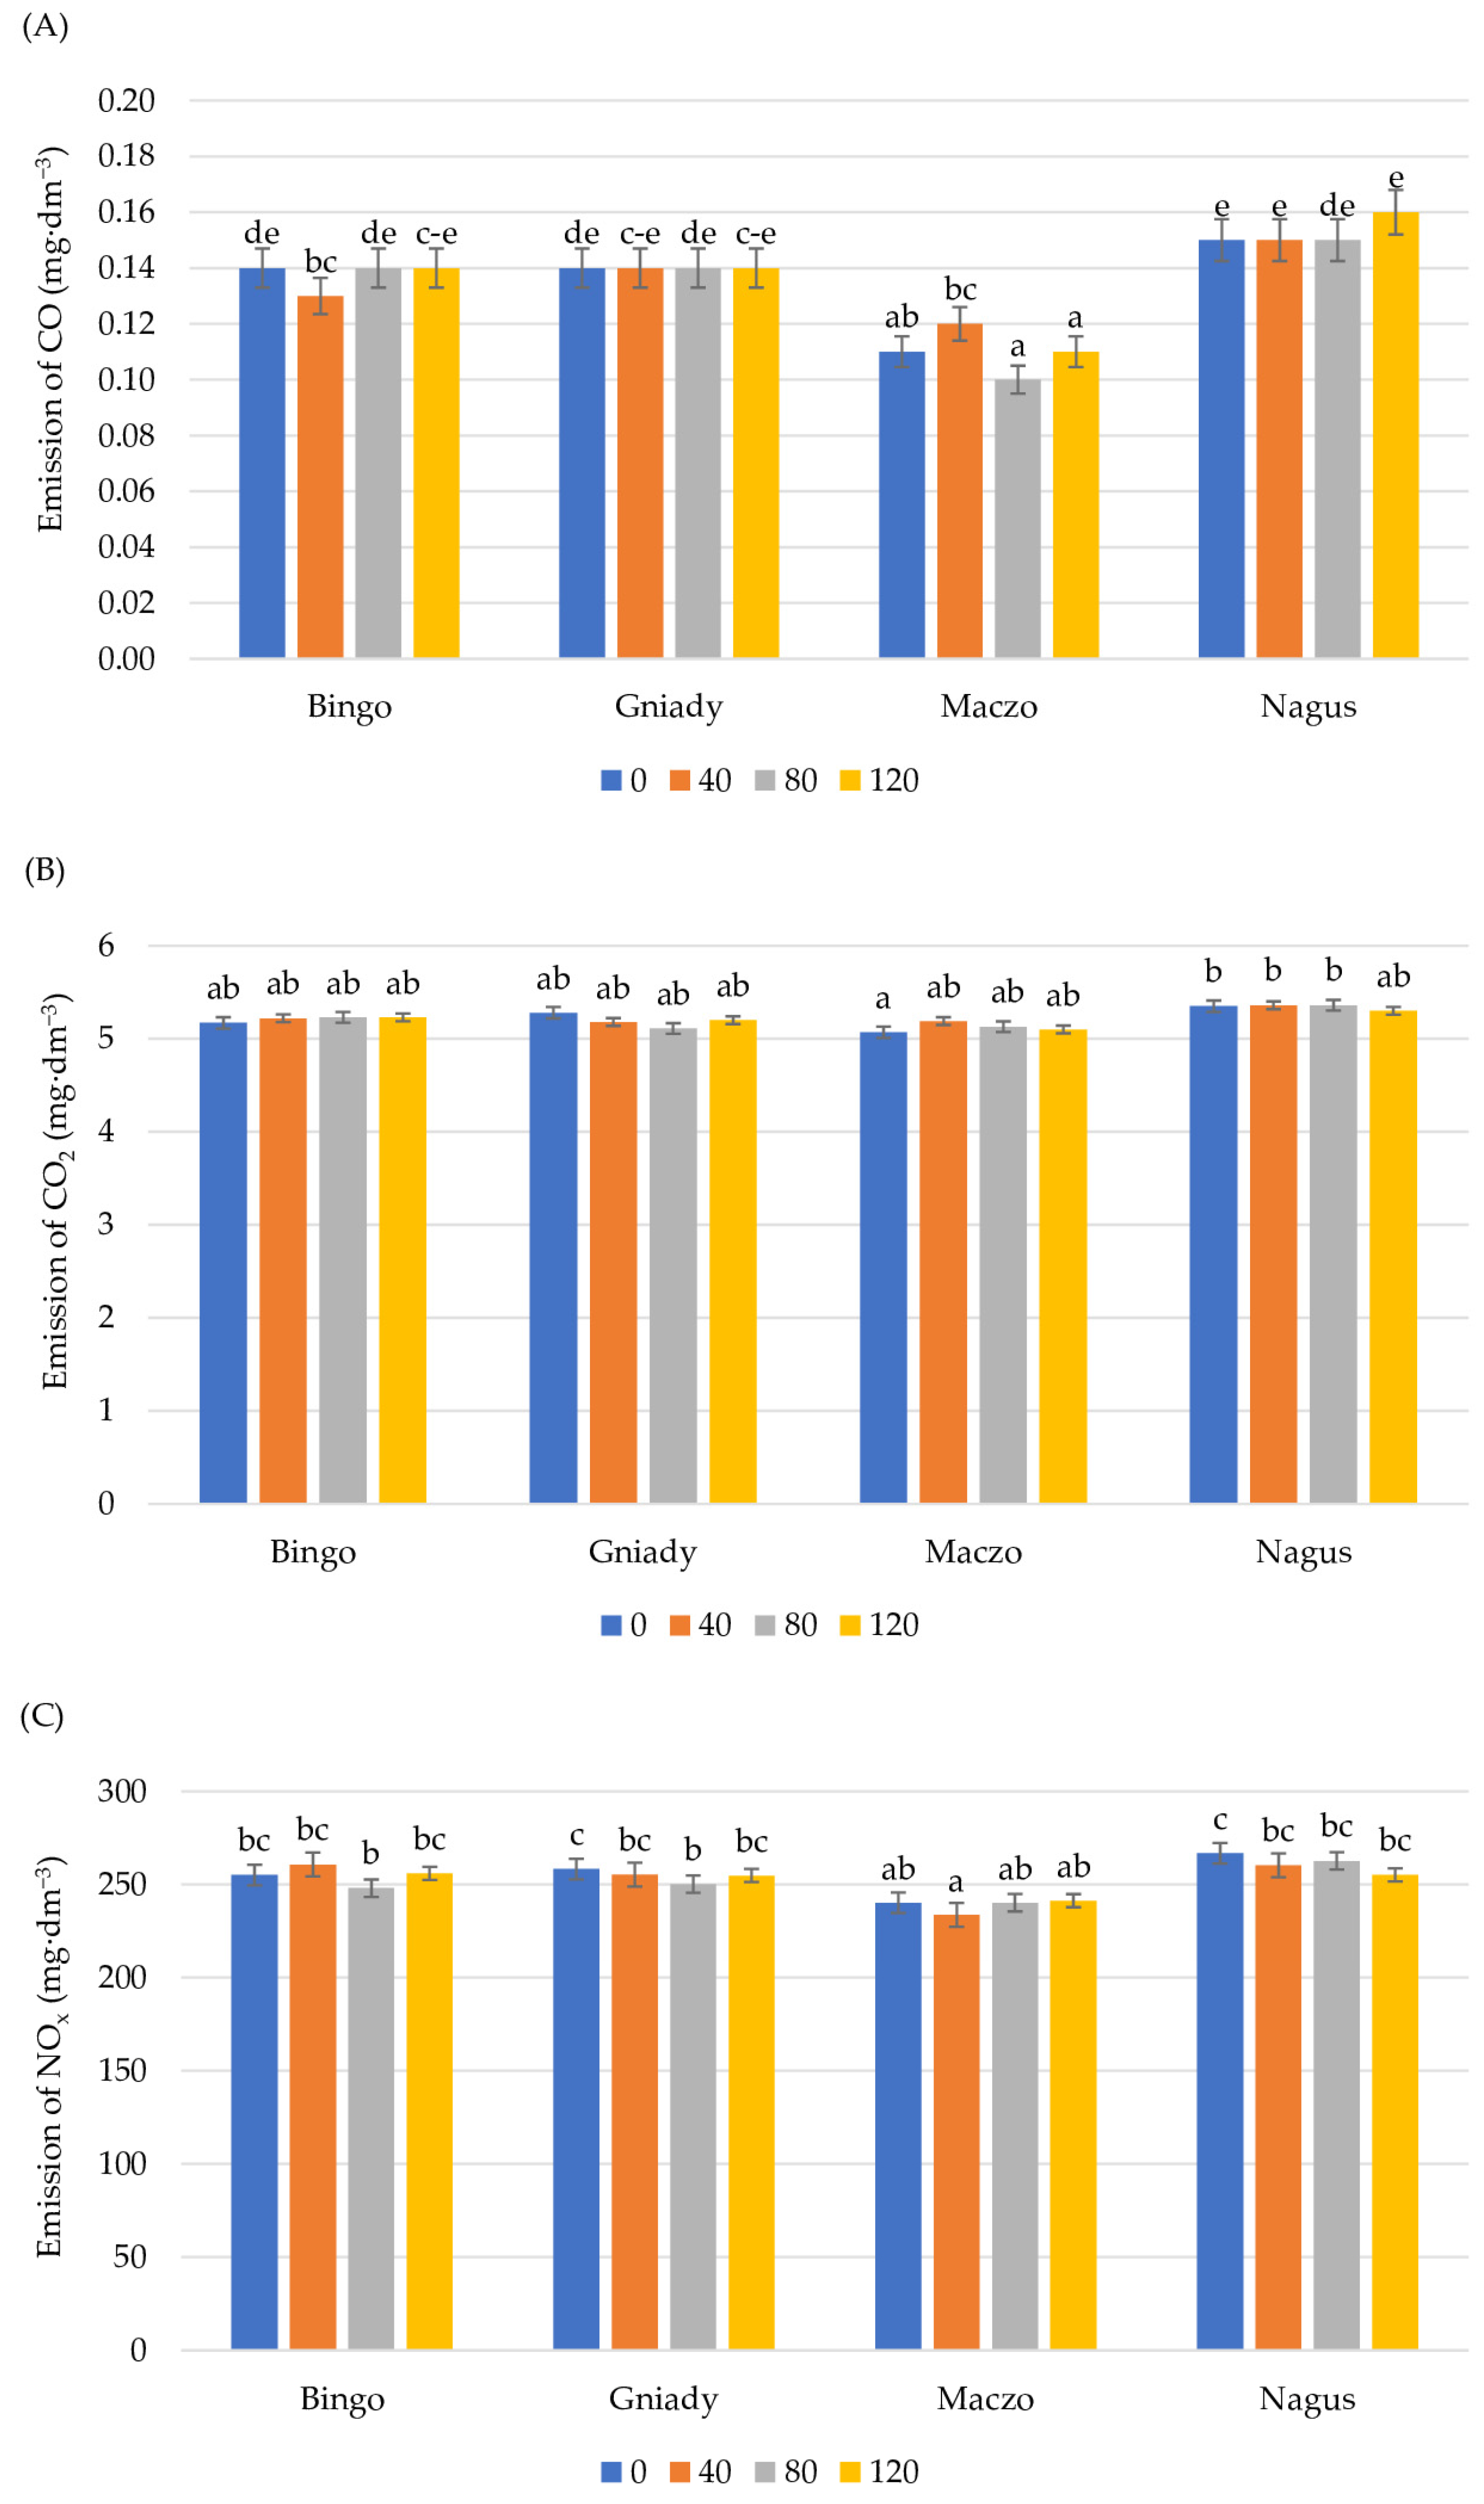
In order to characterize the biomass tested in the experiment, an analysis of the elemental composition of the grain was carried out. The contents of macro- and microelements in oat depend on many factors, such as soil fertility, soil type, humus content, climatic conditions, fertilization, and cultivars [97,98,99]. The chemical composition of the oat grain analyzed in the experiment was typical for the species (Table 5 and Table 6). The nitrogen content was higher in naked cultivars than in husked cultivars. The Nagus cultivar contained the most nitrogen. The experiment showed a higher content of Ca in hulled cultivars. Bingo and Gniady contained significantly less Mg, P, and S (Table 5). After the application of nitrogen fertilization in the highest dose—120 kg N·ha−1, the highest contents of N, K, P, and S were recorded in grain (Table 5). Ma et al. [64] found that total plant N uptake increased linearly with increasing N rates and was dependent on the growing region. According to Onyenwoke et al. [100], the nitrogen content of aspen straw ranged from 0.33 to 0.41%. In the study by Górnicki et al. [101], the nitrogen content of oat straw was significantly lower (0.6%) than that of hay (1.7%). In the research of Bobrecka-Jamro et al. [102] carried out on soybean, nitrogen fertilization had no effect on the content of macronutrients determined in seeds, while in the study by Klikocka and Marks [103] on wheat, nitrogen fertilization had a positive effect on the contents of Fe, Mn, Zn, and Cu. In our study, doses of N caused an increase in the S content. Nitrogen and sulfur are very important components of protein. The correct N:S ratio results in better yields and crop quality. There are many interactions between sulfur and nitrogen in the plant at various levels, such as uptake, assimilation of NO3 and SO42−, and formation of N and S metabolites [103]. Higher doses of N increased the Zn and Cu contents in cereal plants and generally increased the Mn content and decreased the Mo content in plants in the study of Jurkowska et al. [104].

3.5. Gas Emissions

Pollutant emissions from combustion are particulate matter (PM), CO, HC, nitrogen oxides, and sulfur oxides. Nitrogen oxides (NOx) are one of the most important substances formed during the combustion of fuels. Currently, new technological solutions aim to reduce CO2, NOx, and SOx emissions from energy processes. Interest in energy crops has grown worldwide due to their potential use as a carbon-neutral, environmentally friendly, and renewable energy source that can help meet global energy needs to some extent [105]. Research results indicate that oat is a fuel with relatively low emissions during combustion, almost as low as wood pellets [106]. In recent years, a strategy has emerged to use oat in direct combustion for energy production, taking into account the possibility of its combustion in conventional coal-fired boilers [19]. The combustion of biomass in domestic boilers can be problematic, and the main obstacle may be the formation of clinker with an agglomeration of ash. In the studies of Keppel et al. [37], in which the efficiency of combustion of several types of cereals was compared, oat was characterized by easy combustion and caused fewer operational problems. Proszak-Miąsik et al. [54] showed that surplus oat straw can be successfully used as an energy resource, including for co-combustion with hard coal.
Analyzing the list of gas emissions, it was shown that the lowest level of CO emissions was recorded as a result of the combustion of oat grain and straw of the Maczo cultivar (Figure 1A). It was at the level of 0.09–0.10 mg (m3)−1. The highest emission value of this gas was recorded in the Gniady cultivar, and it was in the range of 0.12–0.15 mg (m3)−1. The analysis of the CO2 emission level showed the lowest value for the Maczo cultivar. The parameter value was 4.71 mg (m3)−1 for grain (Figure 1B) and 5.12 mg (m3)−1 for straw (Figure 2B). The highest emission value of this gas was recorded for a grain of the Gniady cultivar and straw of the Nagus cultivar. Similar relationships were noted when analyzing NOx emissions. Although the grain analysis showed a higher nitrogen content in the fertilized samples (80 and 120 kg·−1), the analysis of variance did not show a higher NOx emission. As a rule, when burning biomass, NOx emissions increase with increasing N fertilization. However, the N concentration in the fuel is not the only factor determining the presence of NOx emissions. Other factors include the type of combustion installation, combustion, and post-combustion conditions [89] No increase in NOx emissions was observed as a result of increasing nitrogen doses, also in oat straw. Reduction in N fertilization, which is recommended for too high NOx emissions [37] from biomass combustion, did not have a significant impact on the measured parameter (Figure 1 and Figure 2).

4. Conclusions

The conducted research shows that naked oat is characterized by a higher energetic value compared to hulled oat. However, taking into account the yield per area unit, hulled cultivars are more suitable for cultivation for energy purposes. The average calorific value of oat obtained in the experiment was 18.7 MJ·kg−1, and the average ash content was 2.03% d.m. and is quite competitive in relation to other energy sources based on biomass, which confirms its suitability for energy purposes. Significant varietal differences were observed. Higher doses of nitrogen caused higher yields per 1 ha of oat cultivation, which compensated for the lower calorific value of the yield, positively affecting the EV index. Straw was characterized by a lower calorific value and higher ash content, as well as higher CO, CO2, and NOx emissions, which indicates its lower suitability for energy purposes compared to grain.
The obtained research results indicate the possibility of the effective use of oat as an alternative source of energy. The use of unsuitable grain for consumption and fodder purposes in order to obtain energy may contribute to reducing crop losses and increasing the importance of energy from renewable sources. In addition, owing to the possibility of oat cultivation in marginal areas, the promotion of oat sowing for energy purposes may have a positive impact on the increase in the profitability of farms and the development of wastelands.

Author Contributions

Conceptualization, R.T.-S.; methodology, R.T.-S. and M.B.; investigation, R.T.-S., B.S. and M.B.; data curation, R.T.-S. and B.S.; writing—original draft preparation, B.S. and M.B.; writing—review and editing, R.T.-S. and B.S.; visualization, R.T.-S. and B.S.; supervision, R.T.-S. All authors have read and agreed to the published version of the manuscript.

Funding

This research was funded from the financial resources of the Ministry of Science and Higher Education for scientific activities of the Institute of Agricultural Sciences, Land Management and Environmental Protection, University of Rzeszow.

Data Availability Statement

The data presented in this study are available from the corresponding author upon reasonable request.

Conflicts of Interest

The authors declare no conflict of interest.

References

  1. Niedziółka, I.; Szpryngiel, M.; Zaklika, B. Possibilities of using biomass for energy purposes. Agric. Eng. 2014, 1, 155–164. [Google Scholar] [CrossRef]
  2. Güney, T. Renewable energy, non-renewable energy and sustainable development. Int. J. Sustain. Dev. World Ecol. 2019, 26, 389–397. [Google Scholar] [CrossRef]
  3. Amjith, L.R.; Bavanish, B. A review on biomass and wind as renewable energy for a sustainable environment. Chemosphere 2022, 293, 133579. [Google Scholar] [CrossRef]
  4. In Focus: Renewable Energy in Europe. Available online: https://commission.europa.eu/news/focus-renewable-energy-europe-2020-03-18_pl (accessed on 15 March 2023).
  5. Dhillon, R.S.; von Wuehlisch, G. Mitigation of global warming through renewable biomass. Biomass Bioenergy 2013, 48, 75–89. [Google Scholar] [CrossRef]
  6. Nues, L.J.R.; Matias, J.C.O.; Catalao, J.P.S. Mixed biomass pellets for thermal energy production: A review of combustion models. Appl. Energy 2014, 127, 135–140. [Google Scholar] [CrossRef]
  7. Maj, G. Emission factors and energy properties of agro and forest biomass in aspect of sustainability of energy sector. Energies 2018, 11, 1516. [Google Scholar] [CrossRef]
  8. Vargas-Moreno, J.M.; Callejón-Ferre, A.J.; Pérez-Alonso, J.; Velázquez-Martí, B. A review of the mathematical models for predicting the heating value of biomass materials. Renew. Sustain. Energy 2012, 16, 3065–3083. [Google Scholar] [CrossRef]
  9. Jahirul, M.I.; Rasul, M.G.; Chowdhury, A.A.; Ashwath, N. Biofuels production through biomass pyrolysis—A technological review. Energies 2012, 5, 4952–5001. [Google Scholar] [CrossRef]
  10. Tumuluru, J.S.; Lim, C.J.; Bim, X.T.; Kuang, X.; Melin, S.; Yazdanpanah, F.; Sokhansanj, S. Analysis on storage off-gass emissions from woody, herbaceous and torrefied biomass. Energies 2015, 8, 1745–1759. [Google Scholar] [CrossRef]
  11. Fournel, S.; Palacios, J.H.; Morissette, R.; Villeneuve, J.; Godbout, S.; Heitz, M.; Savoie, P. Influence of biomass properties on technical and environmental performance of a multi-fuel boiler during on-farm combustion of energy crops. Appl. Energy 2015, 141, 247–259. [Google Scholar] [CrossRef]
  12. Suzuki, K.; Tsuji, N.; Shirai, Y.; Hassan, M.A.; Osaki, M. Evaluation of biomass energy potential towards achieving sustainability in biomass energy utilization in Sabah, Malaysia. Biomass Bioenergy 2017, 97, 149–154. [Google Scholar] [CrossRef]
  13. Jegannathan, K.R.; Chan, E.S.; Ravindra, P. Harnessing biofuels: A global renaissance in energy production? Renew. Sustain. Energy Rev. 2009, 13, 2163–2168. [Google Scholar] [CrossRef]
  14. Maj, G. Diversification and environmental impact assessment of plant biomass energy Use. Pol. J. Environ. Stud. 2015, 24, 2055–2061. [Google Scholar] [CrossRef] [PubMed]
  15. Nakomcic-Smaragdakis, B.; Cepic, Z.; Dragutinovic, N. Analysis of solid biomass energy potential in Autonomous Province of Vojvodina. Renew. Sustain. Energy Rev. 2016, 57, 186–191. [Google Scholar] [CrossRef]
  16. Herbert, G.J.; Krishnan, A.U. Quantifying environmental performance of biomass energy. Renew. Sustain. Energy Rev. 2016, 59, 292–308. [Google Scholar] [CrossRef]
  17. McKendry, P. Energy production from biomass (part 1): An overview of biomass. Bioresour. Technol. 2002, 83, 37–46. [Google Scholar] [CrossRef]
  18. Paula, L.E.R.; Trugilho, P.F.; Napoli, A.; Bianchi, M.L. Characterization of residues from plant biomass for use in energy generation. Cerne 2011, 17, 237–246. [Google Scholar] [CrossRef]
  19. Magdziarz, A.; Wilk, M. Thermal characteristics of the combustion process of biomass and sewage sludge. J. Therm. Anal. Calorim. 2013, 114, 519–529. [Google Scholar] [CrossRef]
  20. Khan, S.; Paliwal, V.; Pandey, V.V.; Kumar, V. Biomass as renewable energy. Int. Adv. Res. J. Sci. Eng. Technol. 2015, 2, 301–304. [Google Scholar]
  21. Perea-Moreno, M.A.; Samerón-Manzano, E.; Perea-Moreno, A.J. Biomass as renewable energy: Worldwide research trends. Sustainability 2019, 11, 863. [Google Scholar] [CrossRef]
  22. Czekała, W.; Pulka, J.; Jasiński, T.; Szewczyk, P.; Bojarski, W.; Jasiński, J. Waste as substrates for agricultural biogas plants: A case study from Poland. J. Water Land Dev. 2023, 56, 45–50. [Google Scholar] [CrossRef]
  23. López-Bellido, L.; Wery, J.; López-Bellido, R.J. Energy crops: Prospects in the context of sustainable agriculture. Eur. J. Agron. 2014, 60, 1–12. [Google Scholar] [CrossRef]
  24. Muller, A. Sustainable agriculture and the production of biomass for energy use. Clim. Change 2009, 94, 319–331. [Google Scholar] [CrossRef]
  25. Martyniak, D. Energy crops useful for the development of soils of poor agricultural value. In Proceedings of the Cereal Grain and Cereal Products Promotion Fund 2016, Radzików, Poland, 14 October 2016. (In Polish). [Google Scholar]
  26. Hauptvogl, M.; Kotrla, M.; Prčík, M.; Pauková, Ž.; Kováčik, M.; Lošák, T. Phytoremediation potential of fast-growing energy plants: Challenges and perspectives—A review. Pol. J. Environ. Stud. 2019, 29, 505–516. [Google Scholar] [CrossRef]
  27. Uellendahl, H.; Wang, G.; Møller, H.B.; Jørgensen, U.; Skiadas, I.V.; Gavala, H.N.; Ahring, B.K. Energy balance and cost-benefit analysis of biogas production from perennial energy crops pretreated by wet oxidation. Water Sci. Technol. 2008, 58, 1841–1847. [Google Scholar] [CrossRef] [PubMed]
  28. Blanco-Canqui, H. Energy crops and their implications on soil and environment. Agron. J. 2010, 102, 403–419. [Google Scholar] [CrossRef]
  29. Koçar, G.; Civaş, N. An overview of biofuels from energy crops: Current status and future prospects. Renew. Sustain. Energy Rev. 2013, 28, 900–916. [Google Scholar] [CrossRef]
  30. Małuszyńska, I.; Wodziński, M.; Małuszyński, M. The use of biomass for energy purposes. Possibilities and limitations. Sci. Rev. Eng. Environ. Sci. 2013, 62, 487–497. (In Polish) [Google Scholar]
  31. Dahl, J.; Obernberger, I. Evaluation of the combustion characteristics of four perennial energy crops (Arundo donax, Cynara cardunculus, Miscanthus × giganteus and Panicum virgatum). In Proceedings of the 2nd World Conference on Biomass for Energy, Industry and Climate Protection, Rome, Italy, 10–14 May 2004. [Google Scholar]
  32. Sims, R.E.; Hastings, A.; Schlamadinger, B.; Taylor, G.; Smith, P. Energy crops: Current status and future prospects. Glob. Change Biol. 2006, 12, 2054–2076. [Google Scholar] [CrossRef]
  33. Borkowska, H.; Molas, R. Yield comparison of four lignocellulosic perennial energy crop species. Biomass Bioenergy 2013, 51, 145–153. [Google Scholar] [CrossRef]
  34. Stolarski, M.J.; Krzyżaniak, M.; Warmiński, K.; Tworkowski, J.; Szczukowski, S.; Olba–Zięty, E.; Gołaszewski, J. Energy efficiency of perennial herbaceous crops production depending on the type of digestate and mineral fertilizers. Energy 2017, 134, 50–60. [Google Scholar] [CrossRef]
  35. Feledyn-Szewczyk, B.; Matyka, M.; Staniak, M. Comparison of the effect of perennial energy crops and agricultural crops on weed flora diversity. Agronomy 2019, 9, 695. [Google Scholar] [CrossRef]
  36. FAO. Crops and Livestock Products. Available online: https://www.fao.org/faostat/en/#data/QCL (accessed on 24 February 2023).
  37. Keppel, A.; Finnan, J.; Rice, B.; Owende, P.; MacDonnell, K. Cereal grain combustion in domestic boilers. Biosyst. Eng. 2013, 115, 136–143. [Google Scholar] [CrossRef]
  38. Pinto, C.W.; Barth, G.; Molin, R.; Silva, D.A.D.; Pauletti, V. Characterization of oat biomass for energy production. Rev. Caatinga 2021, 34, 537–547. [Google Scholar] [CrossRef]
  39. Zhang, K.; Dong, R.; Hu, X.; Ren, C.; Li, Y. Oat-based foods: Chemical constituents, glycemic index, and the effect of processing. Foods 2021, 10, 1304. [Google Scholar] [CrossRef]
  40. Yue, J.; Gu, Z.; Zhu, Z.; Yi, J.; Ohm, J.B.; Chen, B.; Rao, J. Impact of defatting treatment and oat varieties on structural, functional properties, and aromatic profile of oat protein. Food Hydrocoll. 2021, 112, 106368. [Google Scholar] [CrossRef]
  41. Singh, R.; De, S.; Belkheir, A. Avena sativa (Oat), a potential neutraceutical and therapeutic agent: An overview. Crit. Rev. Food Sci. Nutr. 2013, 53, 126–144. [Google Scholar] [CrossRef]
  42. Sterna, V.; Zute, S.; Brunava, L. Oat grain composition and its nutrition benefice. Agric. Agric. Sci. Procedia 2016, 8, 252–256. [Google Scholar] [CrossRef]
  43. Martínez-Villaluenga, C.; Peñas, E. Health benefits of oat: Current evidence and molecular mechanisms. Curr. Opin. Food Sci. 2017, 14, 6–31. [Google Scholar] [CrossRef]
  44. Kelling, K.A.; Fixen, P.E. Soil and nutrient requirements for oat production. In Oat Science and Technology; Marshall, H.G., Sorrells, M.E., Eds.; American Society of Agronomy, Inc.: Madison, WI, USA; Crop Science Society of America, Inc.: Madison, WI, USA, 1992; Volume 33, pp. 165–190. [Google Scholar] [CrossRef]
  45. Menon, R.; Gonzalez, T.; Ferruzzi, M.; Jackson, E.; Winderl, D.; Watson, J. Oat—From farm to fork. Adv. Food Nutr. Re. 2016, 77, 1–55. [Google Scholar] [CrossRef]
  46. Marshall, A.; Cowan, S.; Edwards, S.G.; Griffiths, I.; Howarth, C.; Langdon, T.; White, E. Crops that feed the world 9. Oat—A cereal crop for human and livestock feed with industrial applications. Food Sec. 2013, 5, 13–33. [Google Scholar] [CrossRef]
  47. Banaś, A.; Dębski, H.; Banaś, W.; Heneen, W.K.; Dahlqvist, A.; Bafor, M.; Stymn, S. Lipids in grain tissues of oat (Avena sativa): Differences in content, time of deposition, and fatty acid composition. J. Exp. Bot. 2007, 58, 2463–2470. [Google Scholar] [CrossRef] [PubMed]
  48. Kurtz, E.S.; Wallo, W. Colloidal oatmeal: History, chemistry and clinical properties. J. Drugs Dermatol. 2007, 6, 167–170. [Google Scholar] [PubMed]
  49. Thro, A.M.; Frey, K.J. Inheritance of groat-oil content and high-oil selection in oat Avena sativa L.). Euphytica 1985, 34, 251–263. [Google Scholar] [CrossRef]
  50. Biel, W.; Bobko, K.; Maciorowski, R. Chemical composition and nutritive value of husked and naked oat grain. J. Cereal Sci. 2009, 49, 413–418. [Google Scholar] [CrossRef]
  51. Kouřimská, L.; Sabolová, M.; Horčička, P.; Rys, S.; Božik, M. Lipid content, fatty acid profile, and nutritional value of new oat cultivars. J. Cereal Sci. 2018, 84, 44–48. [Google Scholar] [CrossRef]
  52. Kwaśniewski, D. Production and utilization of the oats grain as renewable energy source. Probl. Inż. Roln. 2010, 3, 95–101. (In Polish) [Google Scholar]
  53. Adapa, P.; Tabil, L.; Schoenau, G. Compaction characteristics of barley, canola, oat and wheat straw. Biosyst. Eng. 2009, 104, 335–344. [Google Scholar] [CrossRef]
  54. Proszak-Miąsik, D.; Jarecki, W.; Nowak, K. Selected parameters of oat straw as an alternative energy raw material. Energies 2022, 15, 331. [Google Scholar] [CrossRef]
  55. Gomiero, T.; Paoletti, M.G.; Pimentel, D. Biofuels: Efficiency, ethics, and limits to human appropriation of ecosystem services. J. Agric. Environ. Ethics 2010, 23, 403–434. [Google Scholar] [CrossRef]
  56. Rozakis, S.; Kremmydas, D.; Pudełko, R.; Borzęcka-Walker, M.; Faber, A. Straw potential for energy purposes in Poland and optimal allocation to major co-firing power plants. Biomass Bioenergy 2013, 58, 275–285. [Google Scholar] [CrossRef]
  57. Maral, H.; Dumlupınar, Z.; Dokuyucu, T.; Akkaya, A. Response of six oat (Avena sativa L.) cultivars to nitrogen fertilization for agronomical traits. Turk. J. Field. Crops. 2013, 18, 254–259. Available online: https://dergipark.org.tr/en/pub/tjfc/issue/17121/179032 (accessed on 15 May 2023).
  58. Sylvester-Bradley, R.; Kindred, D.R. Analysing nitrogen responses of cereals to prioritize routes to the improvement of nitrogen use efficiency. J. Exp. Bot. 2009, 60, 1939–1951. [Google Scholar] [CrossRef] [PubMed]
  59. Pecio, A.; Bichonski, A. Nitrogen fertilization and fungicide application as elements of oat production. Pol. J. Environ. Stud. 2010, 19, 1297–1305. [Google Scholar]
  60. Neugschwandtner, R.W.; Kaul, H.P. Sowing ratio and N fertilization affect yield and yield components of oat and pea in intercrops. Field Crops Res. 2014, 155, 159–163. [Google Scholar] [CrossRef]
  61. Podolska, G.; Maj, L.; Nita, Z. Effect of sowing density and nitrogen fertilization doses on grain yield and chemical components of naked short-shoot oat. Biul. IHAR 2006, 239, 49–59. (In Polish) [Google Scholar]
  62. Tobiasz-Salach, R.; Bobrecka-Jamro, D. Impacts of nitrogen fertilisation on yields and nutritional values of oats grains. Przegląd. Zboż.-Młyn. 2016, 60, 28–30. (In Polish) [Google Scholar]
  63. Da Silva, J.A.G.; Neto, C.J.G.; Fernandes, S.B.V.; Mantai, R.D.; Scremin, O.B.; Pretto, R. Nitrogen efficiency in oat on grain yield with stability. Rev. Bras. Eng. Agric. E Ambient. 2016, 20, 1095–1100. [Google Scholar] [CrossRef]
  64. Ma, B.L.; Zheng, Z.; Pageau, D.; Vera, C.G.; Fregeau-Reid, J.; Xue, A.; Yan, W. Nitrogen and phosphorus uptake, yield and agronomic traits of oat cultivars as affected by fertilizer N rates under diverse environments. Nutr. Cycl. Agroecosyst. 2017, 108, 245–265. [Google Scholar] [CrossRef]
  65. May, W.E.; Brandt, S.; Hutt-Taylor, K. Response of oat grain yield and quality to nitrogen fertilizer and fungicides. Agron. J. 2020, 112, 1021–1034. [Google Scholar] [CrossRef]
  66. Oleszek, M.; Matyka, M. Nitrogen fertilization level and cutting affected lignocellulosic crops properties important for biogas production. BioResources 2017, 4, 8565–8580. [Google Scholar] [CrossRef]
  67. Krzystek, L.; Wajszczuk, K.; Pazera, A.; Matyka, M.; Slezak, R.; Ledakowicz, S. The influence of plant cultivation conditions on biogas production: Energy efficiency. Waste Biomass Valorization 2020, 11, 513–523. [Google Scholar] [CrossRef]
  68. Klikocka, H.; Kasztelan, A.; Zakrzewska, A.; Wyłupek, T.; Szostak, B.; Skwaryło-Bednarz, B. The energy efficiency of the production and conversion of spring triticale grain into bioethanol. Agronomy 2019, 9, 423. [Google Scholar] [CrossRef]
  69. PN-EN ISO 18122:2016-01; English Version—Solid Biofuels—Determination of Ash Content. ISO: Geneva, Switzerland, 2016. Available online: https://sklep.pkn.pl/pn-en-iso-18122-2016-01e.html (accessed on 10 March 2023).
  70. Zhou, Q.P.; Biswas, D.K.; Ma, B.L. Comparisons among cultivars of wheat, hulless and hulled oat: Dry matter, N and P accumulation and partitioning as affected by N supply. J. Plan Nutr. Soil Sci. 2013, 176, 929–941. [Google Scholar] [CrossRef]
  71. Mantai, R.D.; da Silva, J.A.; Carbonera, R.; Carvalho, I.R.; Lautenchleger, F.; Pereira, L.M. Technical and agronomic efficiency of nitrogen use on the yield and quality of oat grains. Rev. Bras. Eng. Agric. E Ambient. 2021, 25, 529–537. [Google Scholar] [CrossRef]
  72. Wróbel, E.; Budzyński, W.; Dubis, B. Agricultural, energy and economic efficiency of oat and spring barley cultivation on light soil. Żywn Ńauka Technol. Jakość 1999, 1, 166–172. (In Polish) [Google Scholar]
  73. Gorash, A.; Armonienė, R.; Mitchell Fetch, J.W.; Liatukas, Ž.; Danytė, V. Aspects in oat breeding: Nutrition quality, nakedness and disease resistance, challenges and perspectives. Ann. Appl. Biol. 2017, 171, 281–302. [Google Scholar] [CrossRef]
  74. Nakonieczny, P.; Kluza, P.A.; Tatar, G.; Bródka, R. Characteristics of types and selected utilization problems of boilers and stoves fired by different fuels. Acta Scie Pol. Tech. Agrar. 2014, 13, 27–40. (In Polish) [Google Scholar] [CrossRef]
  75. Terlikowski, J. Biomass from permanent grassland as a source of renewable energy. Prob. Agric. Eng. 2012, 20, 43–49. (In Polish) [Google Scholar]
  76. Żabiński, A.; Sadowska, U. Heat of combustion of grains caryopses of lowered quality properties. Agric. Eng. 2012, 136, 353–359. (In Polish) [Google Scholar]
  77. de Witt, M.; Faaji, A. European biomass resource potential and costs. Biomass Bioenergy 2010, 34, 188–202. [Google Scholar] [CrossRef]
  78. De la Torre Ugarte, D.G. Bioenergy and agriculture promises and challenges. In Developing Bioenergy Economic and Social Issues; Hazell, P.B.R., Pachauri, R.K., Eds.; International Food Policy Research Institute (IFPRI): Washington, DC, USA, 2006; Volume 14, pp. 5–8. [Google Scholar] [CrossRef]
  79. Özyuğuran, A.; Yaman, S. Prediction of calorific value of biomass from proximate analysis. Energy Procedia 2017, 107, 130–136. [Google Scholar] [CrossRef]
  80. Deshannavar, U.B.; Hegde, P.G.; Dhalayat, Z.; Patil, V.; Gavas, S. Production and characterization of agro-based briquettes and estimation of calorific value by regression analysis: An energy application. Mater. Sci. Technol. 2018, 1, 175–181. [Google Scholar] [CrossRef]
  81. Smaga, M. Comparison of energy crops grown in Poland. Mag. Biomasa 2017, 1, 22–24. [Google Scholar]
  82. Kaszkowiak, E.; Kaszkowiak, J. Energetic use of oat grain and spring barley. Inż. Ap. Chem. 2010, 49, 57–58. (In Polish) [Google Scholar]
  83. Mółka, J.; Łapczyńska-Kordon, B. Energy properties of selected types of biomass. Agric. Eng. 2011, 6, 141–147. (In Polish) [Google Scholar]
  84. Piątkowska, E.; Witkowicz, R.; Pisulewska, E. Basic chemical composition of selected cultivars of oat. Food Sci. Technol. Qual. 2010, 3, 88–99. (In Polish) [Google Scholar] [CrossRef]
  85. Sykut-Domańska, E.; Rzedzicki, Z.; Nita, Z. Chemical composition variability of naked and husked oat grain (Avena sativa L.). Cereal Res. Commun. 2013, 41, 327–337. [Google Scholar] [CrossRef]
  86. Biel, W.; Jacyno, E.; Kawęcka, M. Chemical composition of hulled, dehulled and naked oat grains. S. Afr. J. Anim. Sci. 2014, 44, 189–197. [Google Scholar] [CrossRef]
  87. Pisulewska, E.; Tobiasz-Salach, R.; Witkowicz, R.; Cieślik, E.; Bobrecka-Jamro, D. Effect of habitat conditions on content and quality of lipids in selected oat forms. Food. Sci. Tech. Qu. 2011, 3, 66–77. (In Polish) [Google Scholar] [CrossRef]
  88. Jarecki, W.; Buczek, J.; Bobrecka-Jamro, D. Influence of nitrogen fertilization on yield of durum wheat (Triticum durum Desf). Frag. Agron. 2013, 30, 68–75. (In Polish) [Google Scholar]
  89. Lewandowski, I.; Kauter, D. The influence of nitrogen fertilizer on the yield and combustion quality of whole grain crops for solid fuel use. Ind. Crops. Prod. 2003, 17, 103–117. [Google Scholar] [CrossRef]
  90. Sheng, C.; Azevedo, J.L.T. Estimating the higher heating value of biomass fuels from basic analysis data. Biomass Bioenergy 2005, 28, 499–507. [Google Scholar] [CrossRef]
  91. Huang, C.; Han, L.; Liu, X.; Yang, Z. Models predicting calorific value of straw from the ash content. Int. J. Green Energy 2008, 5, 533–539. [Google Scholar] [CrossRef]
  92. Vassilev, S.V.; Vassilevam, C.G.; Song, Y.C.; Li, W.Y.; Feng, J. Ash contents and ash-forming elements of biomass and their significance for solid biofuel combustion. Fuel 2017, 208, 377–409. [Google Scholar] [CrossRef]
  93. Carroll, J.P.; Finnan, J. Physical and chemical properties of pellets from energy crops and cereal straws. Biosyst. Eng. 2012, 112, 151–159. [Google Scholar] [CrossRef]
  94. Kaķītis, A.; Šmits, M.; Belicka, I. Suitability of crop varieties for energy production. In Proceedings of the 8th International Scientific Conference Engineering for Rural Development 2009, Jelgava, Lativia, 28–29 May 2009. [Google Scholar]
  95. Vassilev, S.V.; Vassileva, C.G.; Bai, J. Content, modes of occurrence, and significance of phosphorous in biomass and biomass ash. J. Energy Inst. 2023, 108, 101205. [Google Scholar] [CrossRef]
  96. Ibrahim, M.S.; Ahmad, A.; Sohail, A.; Asad, M.J. Nutritional and functional characterization of different oat (Avena sativa L.) cultivars. Int. J. Food Prop. 2020, 23, 1373–1385. [Google Scholar] [CrossRef]
  97. Witkowicz, R.; Antonkiewicz, J.; Pisulewska, E.; Bogocz, D. The impact of agronomic factors on the content of selected microelements in naked oat (Avena sativa var. nuda) grain. Ecol. Chem. Eng. 2015, 22, 239–250. [Google Scholar] [CrossRef]
  98. Schmitz, E.; Nordberg Karlsson, E.; Adlercreutz, P. Warming weather changes the chemical composition of oat hulls. Plant Biol. 2020, 22, 1086–1091. [Google Scholar] [CrossRef]
  99. Tang, Y.M.; Qiu, S.N.; Li, Q.Y.; Di, G.L.; Wang, J.L.; Sun, H.X. Simulated global climate change benefits the nutritive value of oat grass. Plant Biol. 2022, 24, 846–853. [Google Scholar] [CrossRef] [PubMed]
  100. Onyenwoke, C.; Tabil, L.G.; Dumonceaux, T.; Cree, D.; Mupondwa, E.; Adapa, P.; Karunakaran, C. Investigation of Steam Explosion Pretreatment of Sawdust and Oat Straw to Improve Their Quality as Biofuel Pellets. Energies 2022, 15, 7168. [Google Scholar] [CrossRef]
  101. Górnicki, K.; Kaleta, A.; Winiczenko, R. Prediction of higher heating value of oat grain and straw biomass. E3S Web. Conf. 2020, 154, 01003. [Google Scholar] [CrossRef]
  102. Bobrecka-Jamro, D.; Jarecki, W.; Buczek, J. Response of soya bean to different nitrogen fertilization levels. J. Elem. 2018, 2. [Google Scholar] [CrossRef]
  103. Klikocka, H.; Marks, M. Sulphur and nitrogen fertilization as a potential means of agronomic biofortification to improve the content and uptake of microelements in spring wheat grain DM. J. Chem. 2018, 2018, 9326820. [Google Scholar] [CrossRef]
  104. Jurkowska, H.; Wiśniowska-Kielian, B.; Rogoż, A.; Wojciechowicz, T. The effect of nitrogen fertilizer rate on the levels of mineral components in various plant species. II. Microelements. Zesz. Nauk. A. Roln. Im. H. Kołłątaja W Krakowie 1990, 29, 51–64. (In Polish) [Google Scholar]
  105. Pandey, V.C.; Bajpai, O.; Singh, N. Energy crops in sustainable phytoremediation. Renew. Sustain. Energ. 2016, 54, 58–73. [Google Scholar] [CrossRef]
  106. Perzon, M. Emissions of organic compounds from the combustion of oat—A comparison with softwood pellets. Biomass Bioenergy 2010, 34, 828–837. [Google Scholar] [CrossRef]
Figure 1. List of gas emissions arising in the process of burning a grain of oat cultivars studied: (A) CO, (B) CO2, and (C) NOx depending on nitrogen fertilization. Different letters show significant differences between the means (p = 0.05).
Energies 16 06019 g001
Figure 2. List of gas emissions arising in the process of burning straw of oat cultivars studied: (A) CO, (B) CO2, and (C) NOx depending on nitrogen fertilization. Different letters show significant differences between the means (p = 0.05).
Energies 16 06019 g002
Table 1. The algorithm for calculating the volume structure of gases.
Calculated ParametersMethod
Calculated volume of CO2S CO2 = 0.5 · (|Xn−1 − Xn|) · (tn−1 − tn)
Calculated volume of gas mixture collectedSg = tc · 100
% CO2 in the gas mixture under analysis% CO2 = SCO2/Sg
Quantity of gas mixture taken during the testAL. = tc · 0.025 (dm3 s−1)
Volume of CO2 taken during the testACO2 = AL.· % CO2
Density of CO2 at room temperature (20 °C) (mg·dm−3) 1977
Volume of CO2 taken during the measurement (mg)ACO2 · 1977
S CO2: calculated volume of CO2; Sg: calculated volume of gas mixture collected; Xn−1, Xn − n: CO2 concentration results recorded during the intervals by the analyzer; tn−1 − tn: measured time intervals; tc · 100: the sum (%) of absorbed gases; AL.: the quantity of gas mixture collected during the test; ACO2: the volume of CO2 taken during the test; 0.5: the complement of the curve integrating the measurement result.
Table 2. Yields of grain and straw of oat cultivars depending on the dose of nitrogen fertilization applied (mean from 2015–2016).
CultivarN Fertilization (kg·ha−1)Grain Yield (t·ha−1)Straw Yield (t·ha−1)
Bingo06.22 ± 0.44 e5.92 ± 0.22 ef
405.88 ± 1.60 e5.98 ± 1.62 f
807.45 ± 0.69 f7.31 ± 0.69 g
1207.73 ± 0.45 f7.54 ± 0.40 g
Gniady06.13 ± 0.38 e5.92 ± 0.27 ef
407.30 ± 0.31 f7.11 ± 0.25 g
807.21 ± 0.52 f7.04 ± 0.48 g
1207.29 ± 0.71 f7.11 ± 0.70 g
Maczo03.58 ± 0.43 a3.45 ± 0.38 a
404.66 ± 0.42 cd4.80 ± 0.35 cd
804.92 ± 0.51 cd4.99 ± 0.42 cd
1205.13 ± 0.37 d5.27 ± 0.26 de
Nagus03.91 ± 0.21 ab3.82 ± 0.21 ab
404.29 ± 0.30 a–c4.45 ± 0.22 bc
804.53 ± 0.37 b–d4.76 ± 0.31 cd
1205.02 ± 0.75 cd5.14 ± 0.68 d
AverageBingo6.82 ± 1.18 B6.69 ± 1.14 B
Gniady6.98 ± 0.69 B6.80 ± 0.67 B
Maczo4.57 ± 0.73 A4.63 ± 0.79 A
Nagus4.44 ± 0.59 A4.54 ± 0.62 A
Average04.96 ± 1.30 A4.78 ± 1.20 A
405.53 ± 1.44 B5.59 ± 1.33 B
806.03 ± 1.43 C6.03 ± 1.27 C
1206.29 ± 1.37 C6.26 ± 1.21 C
Average5.705.66
C******
F******
CxF******
C—Cultivar; F—N Fertilization; CxF—Cultivar x N Fertilization; *** indicates significant differences at p < 0.001, according to Tukey’s honestly significant difference test (HSD). Different letters indicate statistically significant differences.
Table 3. Calorific value (CV) and energetic value (EV) of oat grain and straw depending on cultivar and nitrogen fertilization (mean 2015–2016).
CultivarN Fertilization (kg·ha−1)Calorific Value (CV) of Grain (MJ·kg−1)Calorific Value (CV) of Straw
(MJ·kg−1)
Energetic Value (EV) of Grain Yield (MJ ha−1)Energetic Value (EV) of Straw Yield (MJ ha−1)
Bingo019.05 ± 0.13 hi15.61 ± 0.71 g118,507 ± 8160 de92,430 ± 4150 de
4018.13 ± 0.07 de14.89 ± 0.27 cd106,559 ± 29,237 d89,402 ± 25,479 d
8017.63 ± 0.06 b14.57 ± 0.22 ab131,297 ± 12,528 fg106,617 ± 10,820 f
12017.15 ± 0.04 a14.24 ± 0.24 a132,479 ± 7380 g107,357 ± 6452 f
Gniady019.06 ± 0.11 hi15.08 ± 0.22 e116,853 ± 7592 de89,402 ± 3720 d
4018.67 ± 0.13 f15.18 ± 0.10 f136,287 ± 6378 g107,956 ± 3838 f
8017.70 ± 0.05 b14.69 ± 0.16 c127,627 ± 9097 ef103,361 ± 6184 f
12017.56 ± 0.04 b14.44 ± 0.11 a128,078 ± 12,299 ef102,638 ± 9955 ef
Maczo018.89 ± 0.11 gh15.15 ± 0.17 ef67,528 ± 8122 a52,309 ± 6105 a
4018.82 ± 0.07 fg14.81 ± 0.06 c87,629 ± 8016 bc71,123 ± 5065 c
8017.92 ± 0.05 c14.66 ± 0.05 ab88,138 ± 9035 bc73,123 ± 6242 c
12017.95 ± 0.06 cd14.48 ± 0.13 ab92,107 ± 6639 c76,270 ± 3667 c
Nagus019.70 ± 0.15 j15.05 ± 0.10 e77,075 ± 3986 ab57,423 ± 3474 ab
4019.20 ± 0.14 i15.01 ± 0.07 cd82,321 ± 5581 bc66,704 ± 3225 bc
8018.20 ± 0.09 e14.77 ± 0.08 c823,45 ± 6490 bc70,336 ± 4490 c
12017.91 ± 0.08 c14.60 ± 0.18 ab89,935 ± 13,322 bc75,185 ± 10,817 c
AverageBingo17.99 ± 0.72 A14.83 ± 0.65 A122,211 ± 19,047 B98,951 ± 15,748 B
Gniady18.25 ± 0.65 B14.85 ± 0.34 A127,211 ± 11,044 B100,810 ± 9307 B
Maczo18.39 ± 0.48 C14.77 ± 0.27 A82,919 ± 12,306 A68,206 ± 10,793 A
Nagus18.75 ± 0.75 D14.86 ± 0.21 A83,851 ± 8938 A67,412 ± 8880 A
Average019.17 ± 0.34 D15.22 ± 0.43 D94,991 ± 24,377 A72,861 ± 18,976 A
4018.70 ± 0.41 C14.97 ± 0.20 C103,199 ± 26,094 B83,796 ± 20,754 B
8017.86 ± 0.24 A14.67 ± 0.15 B107,352 ± 24,398 BC88,359 ± 18,374 C
12017.64 ± 0.33 B14.44 ± 0.21 A110,650 ± 22,317 C90,363 ± 16,897 C
Average18.3514.83104,04883,845
C***n.s.******
F************
CxF***********
C—Cultivar; F—N Fertilization; CxF—Cultivar x N Fertilization; *** and ** indicate significant differences at p < 0.001 and p < 0.01; n.s.—non-significant, according to Tukey’s honestly significant difference test (HSD). Different letters indicate statistically significant differences.
Table 4. Ash contents in oat grain and straw (mean 2015–2016).
CultivarN Fertilization (kg·ha−1)Ash Content in Grain
(% of Dry Mass)
Ash Content in Straw
(% of Dry Mass)
Bingo02.07 ± 0.02 e3.12 ± 0.02 a
402.15 ± 0.03 fg3.11 ± 0.12 a
802.06 ± 0.01 de3.06 ± 0.11 a
1202.05 ± 0.01 de3.05 ± 0.02 a
Gniady02.17 ± 0.02 gh4.33 ± 0.04 j
402.00 ± 0.02 c4.26 ± 0.05 h-j
801.87 ± 0.02 a4.18 ± 0.04 fg
1201.92 ± 0.01 b4.14 ± 0.04 f
Maczo02.03 ± 0.02 c–e4.02 ± 0.05 e
402.02 ± 0.01 cd3.92 ± 0.06 d
801.86 ± 0.02 a3.76 ± 0.09 c
1201.95 ± 0.02 b3.61 ± 0.05 b
Nagus02.20 ± 0.03 hi4.27 ± 0.05 ij
402.24 ± 0.03 i4.28 ± 0.04 ij
802.11 ± 0.05 f4.24 ± 0.05 g–i
1201.87 ± 0.03 a4.19 ± 0.03 f–h
MeanBingo2.08 ± 0.04 C3.09 ± 0.04 A
Gniady1.99 ± 0.12 B4.23 ± 0.08 C
Maczo1.96 ± 0.07 A3.83 ± 0.17 B
Nagus2.11 ± 0.015 D4.24 ± 0.05 C
Mean02.12 ± 0.07 D3.94 ± 0.50 D
402.10 ± 0.10 C3.89 ± 0.49 C
801.97 ± 0.12 B3.81 ± 0.48 B
1201.95 ± 0.07 A3.75 ± 0.47 A
Mean2.033.85
C******
F******
CxF******
C—Cultivar; F—N Fertilization; CxF—Cultivar x N Fertilization; *** indicates significant differences at p < 0.001, according to Tukey’s honestly significant difference test (HSD). Different letters indicate statistically significant differences.
Table 5. The contents of macroelements in oat grain depending on the cultivar and nitrogen fertilization (average from 2015–2016).
CultivarNtotCaKMgNaPS
(g·kg−1 DM)
Bingo2.27 ± 0.35 A0.98 ± 0.09 C3.20 ± 0.25 A1.26 ± 0.07 A0.024 ± 0.002 B4.61 ± 0.42 B1.64 ± 0.14 A
Gniady2.34 ± 0.38 A0.97 ± 0.09 C3.23 ± 0.28 AB1.25 ± 0.07 A0.022 ± 0.004 A3.90 ± 0.36 A1.67 ± 0.13 A
Maczo2.47 ± 0.38 B0.89 ± 0.05 B3.30 ± 0.20 B1.45 ± 0.09 B0.023 ± 0.003 B5.64 ± 0.36 C2.08 ± 0.13 B
Nagus2.59 ± 0.36 C0.84 ± 0.06 A3.70 ± 0.21 C1.59 ± 0.07 C0.025 ± 0.004 C6.30 ± 0.35 D2.19 ± 0.13 C
N Fertilization (kg·ha−1) (g·kg−1 DM)
02.21 ± 0.22 A0.89 ± 0.08 A3.28 ± 0.33 A1.39 ± 0.18 AB0.023 ± 0.004 A5.09 ± 1.16 A1.84 ± 0.30 A
402.24 ± 0.27 A0.95 ± 0.11 B3.38 ± 0.29 BC1.40 ± 0.15 B0.024 ± 0.003 A5.07 ± 0.98 A1.86 ± 0.27 A
802.62 ± 0.39 B0.92 ± 0.10 A3.30 ± 0.30 AB1.37 ± 0.15 A0.023 ± 0.004 A5.01 ± 0.97 A1.88 ± 0.29 A
1202.61 ± 0.43 B0.92 ± 0.07 A3.46 ± 0.28 C1.39 ± 0.15 AB0.024 ± 0.003 A5.28 ± 0.85 B2.01 ± 0.23 B
Mean2.420.923.361.390.0235.111.90
C ******************
F **************
CxF ****************
C—Cultivar; F—N Fertilization; CxF—Cultivar x N Fertilization; ***, **, and * indicate significant differences at p < 0.001, p < 0.01, and p < 0.05, according to Tukey’s honestly significant difference test (HSD). Different letters indicate statistically significant differences.
Table 6. The contents of microelements in oat grain depending on the cultivar and nitrogen fertilization (average from 2015–2016).
CultivarCuFeMnZn
(mg·kg−1 DM)
Bingo2.11 ± 0.07 A31.5 ± 4.39 A39.7 ± 5.09 B20.7 ± 2.38 A
Gniady4.44 ± 0.70 B29.6 ± 10.5 A35.2 ± 5.44 A23.7 ± 3.04 B
Maczo3.71 ± 0.06 B46.4 ± 9.4 B34.9 ± 3.56 A29.0 ± 2.32 D
Nagus3.45 ± 0.05 AB47.7 ± 10.3 B34.6 ± 2.89 A26.8 ± 1.97 C
N Fertilization (kg·ha−1)(mg·kg−1 DM)
03.00 ± 0.10 A33.8 ± 3.25 A34.0 ± 4.92 A25.5 ± 3.92 BC
402.92 ± 0.10 A38.8 ± 4.12 A35.9 ± 3.35 B24.8 ± 3.65 AB
802.81 ± 0.09 A37.6 ± 5.15 B36.1 ± 3.92 B24.1 ± 4.75 A
1204.98 ± 0.06 B45.0 ± 8.24 C38.4 ± 5.81 C25.8 ± 3.57 C
Average3.4338.836.125.1
C************
F************
CxF************
C—Cultivar; F—N Fertilization; CxF—Cultivar x N Fertilization; *** indicates significant differences at p < 0.001, according to Tukey’s honestly significant difference test (HSD). Different letters indicate statistically significant differences.
Disclaimer/Publisher’s Note: The statements, opinions and data contained in all publications are solely those of the individual author(s) and contributor(s) and not of MDPI and/or the editor(s). MDPI and/or the editor(s) disclaim responsibility for any injury to people or property resulting from any ideas, methods, instructions or products referred to in the content.

