

Gradient Boosting Approach to Predict Energy-Saving Awareness of Households in Kitakyushu


Abstract
:1. Introduction
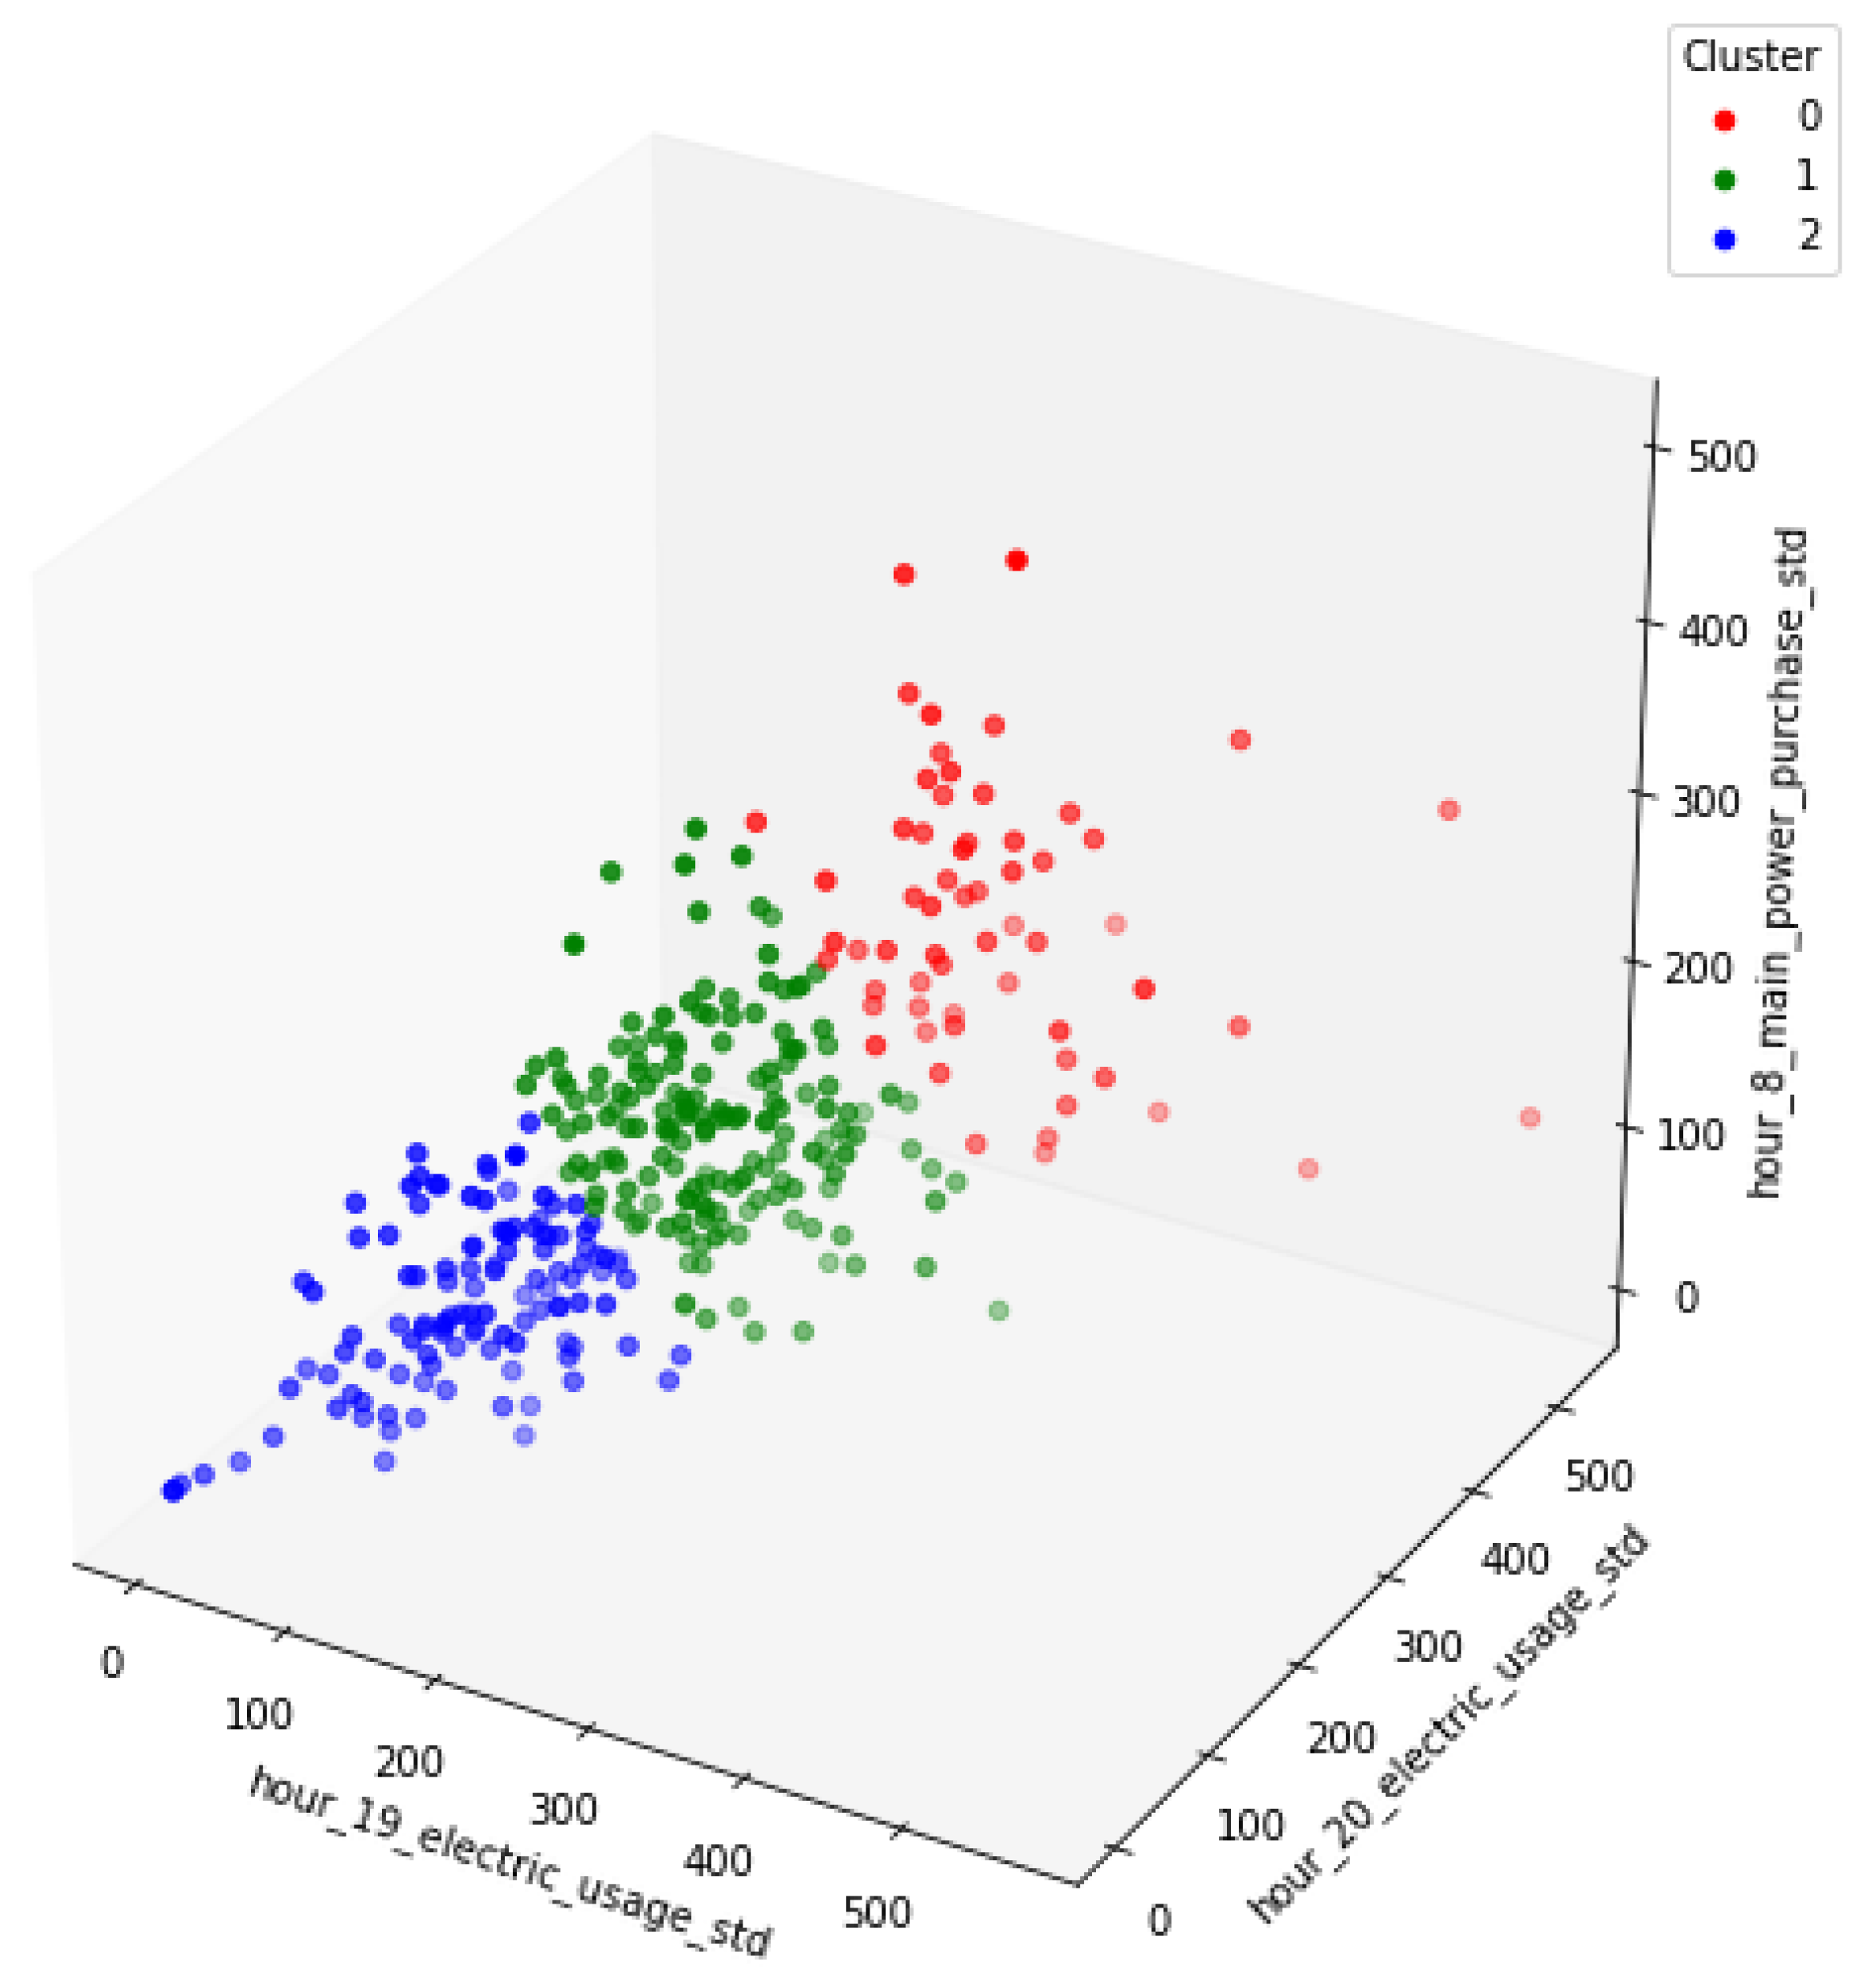
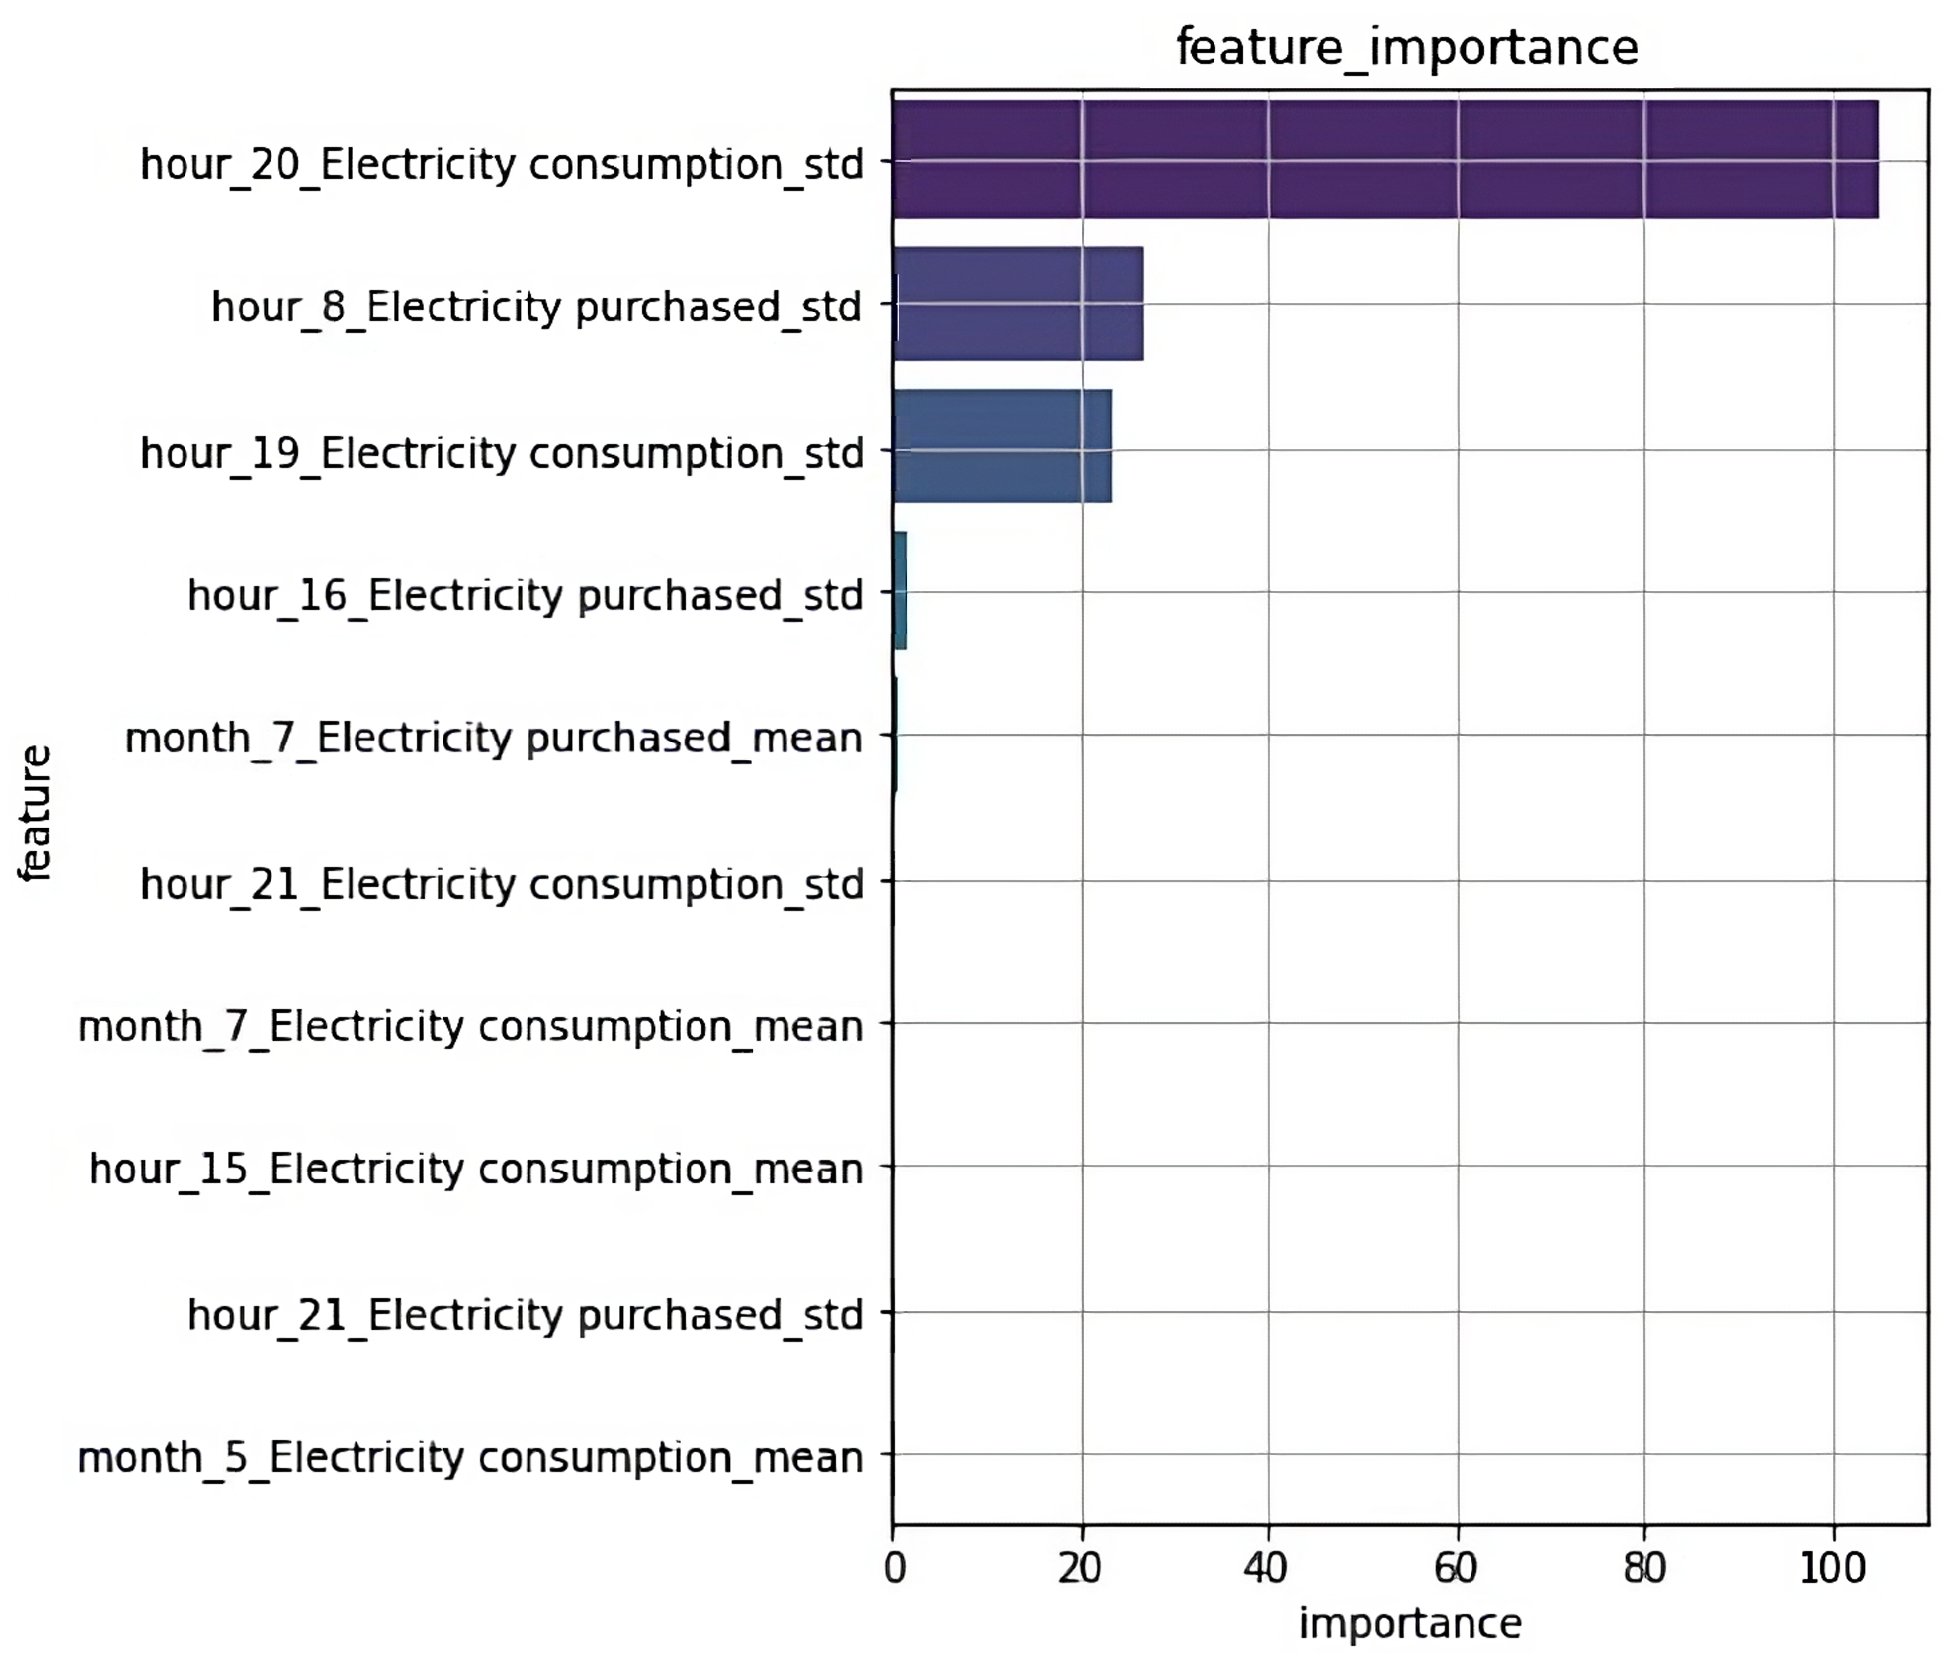
- The standard deviation of the electricity purchased between 8 a.m. and 9 a.m.,
- The standard deviation of the electricity consumed between 8 p.m. and 9 p.m., and
- The standard deviation of the electricity consumed between 7 p.m. and 8 p.m.
2. Materials and Methods
2.1. Data Collection and Description
Survey Question
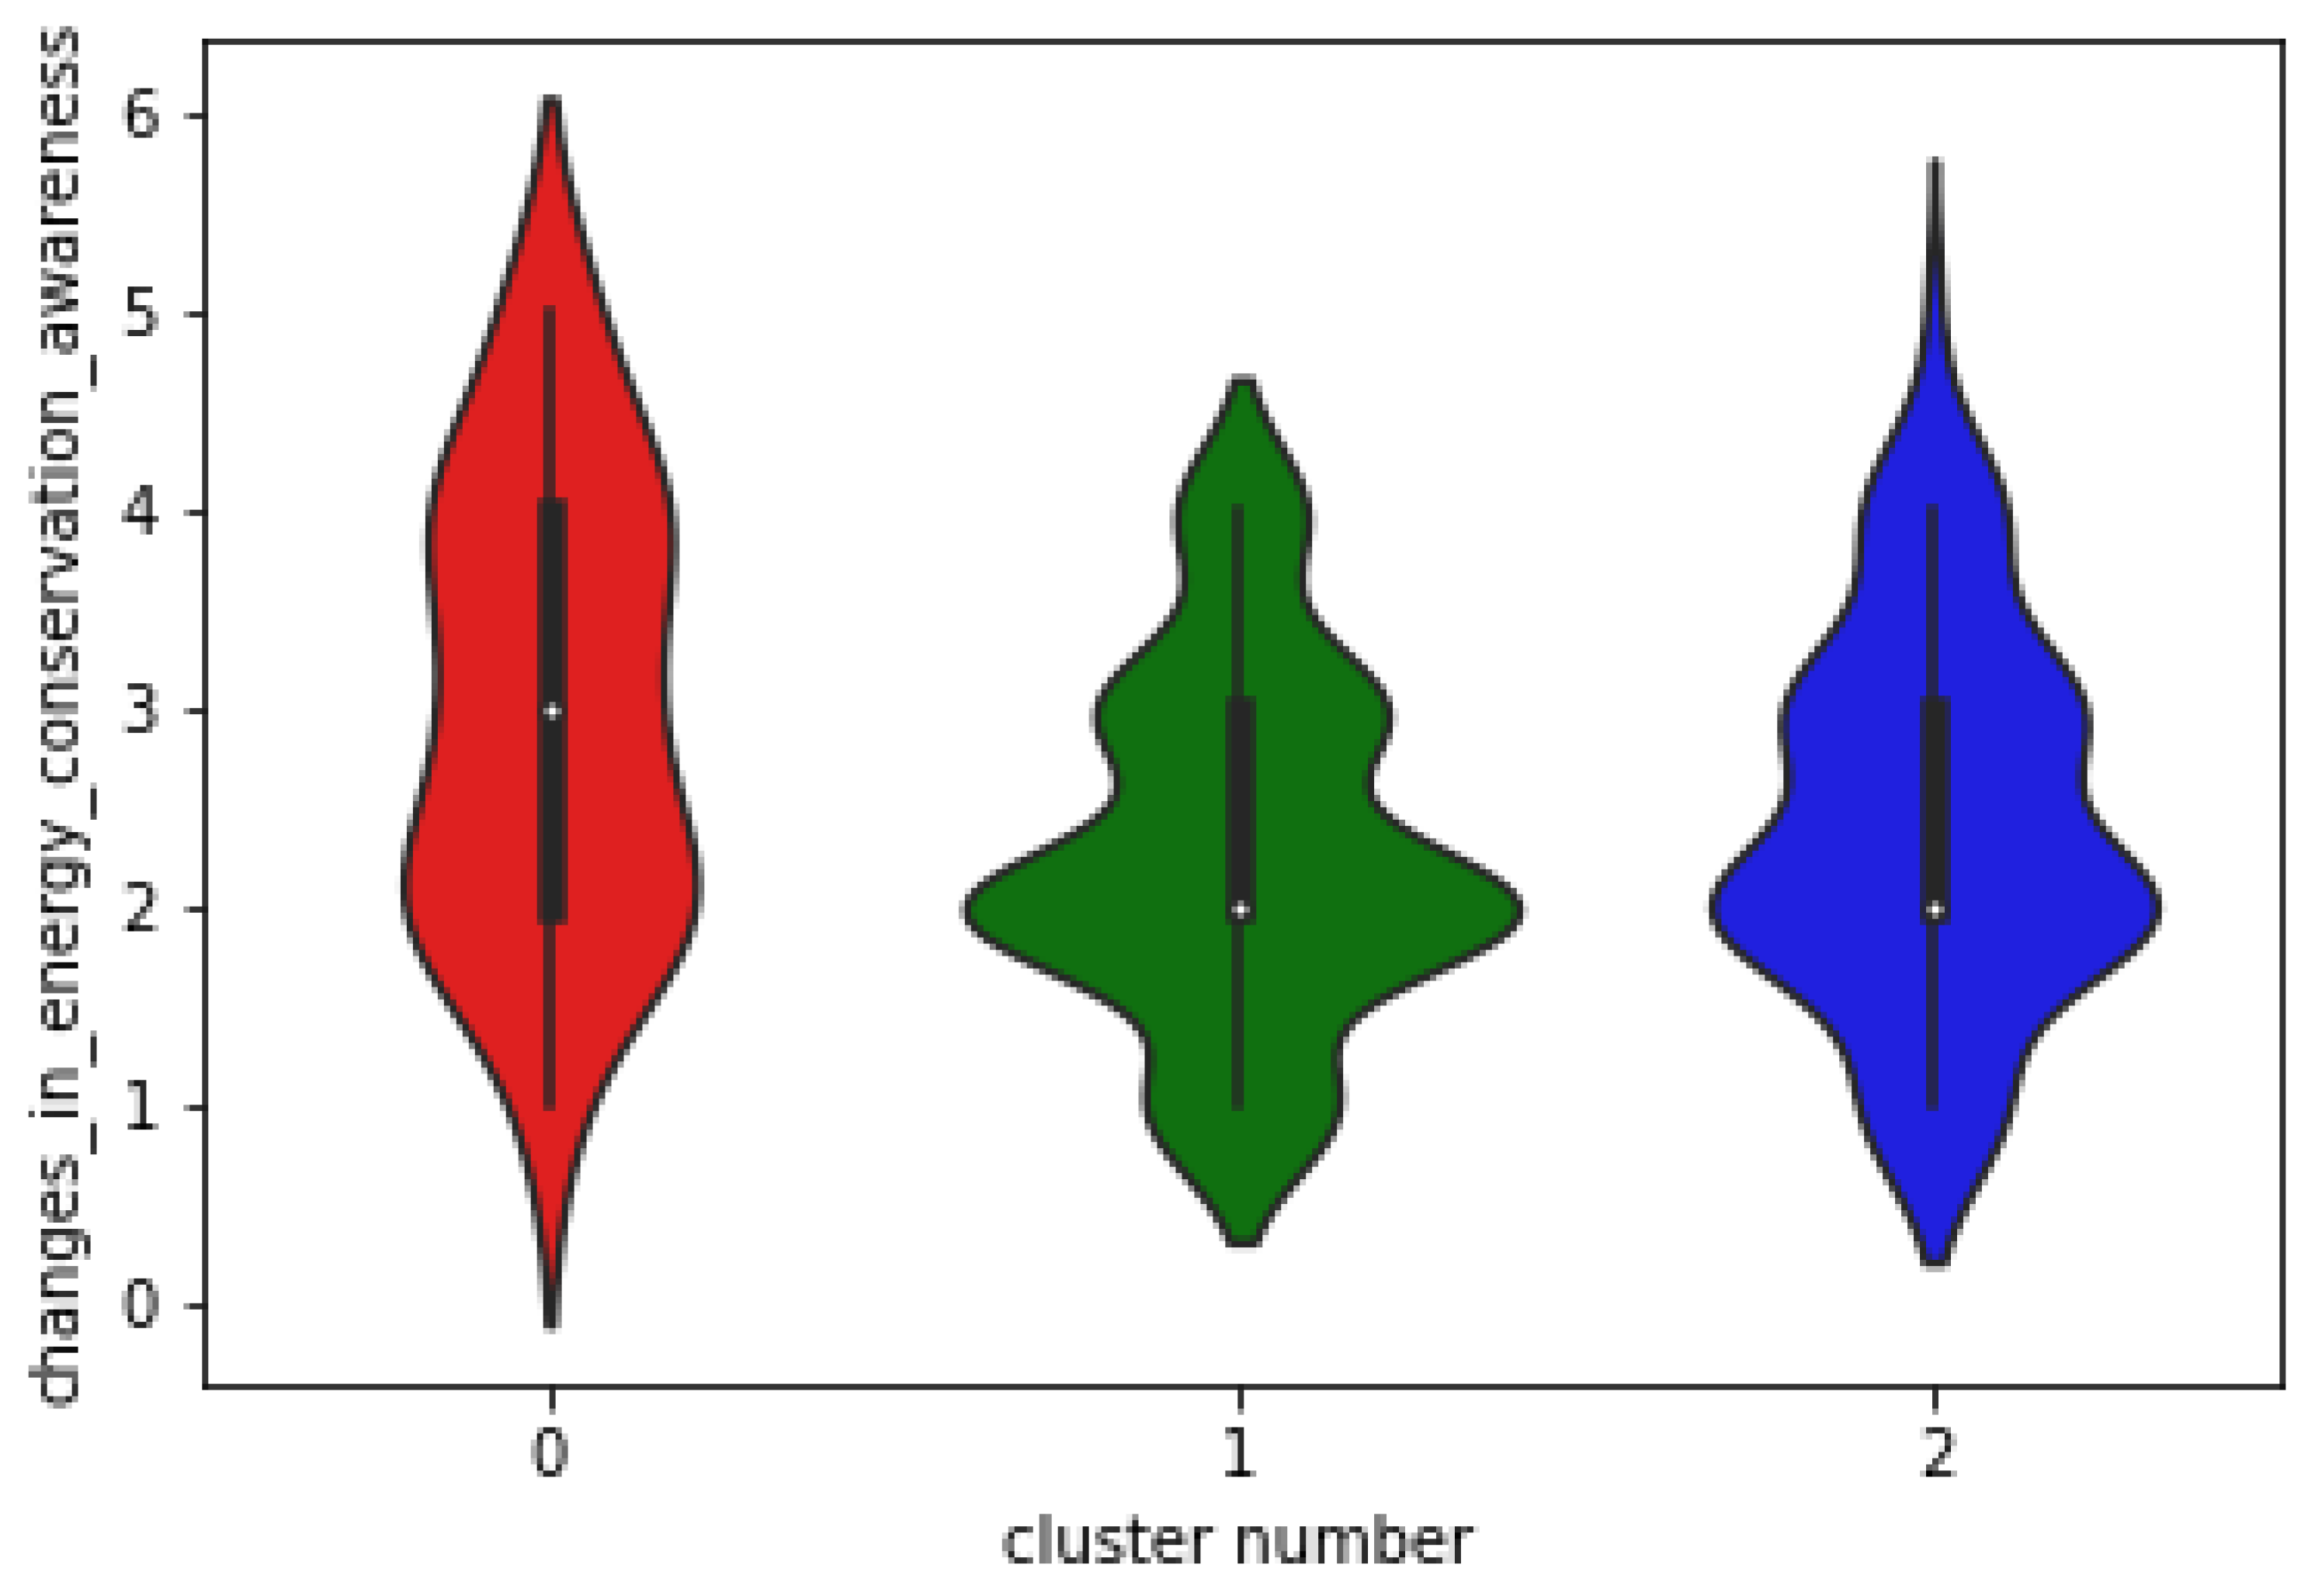
- Survey question: how has your energy-saving awareness changed compared to before you moved into smart houses?
- Very high.
- A little bit higher.
- It is almost the same (I have been aware of it for a long time).
- It is almost the same (no awareness as before).
- I am not as aware of it as I used to be.
2.2. Data Pre-Processing
2.3. Model Development
2.3.1. Light Gradient Boosting Machine
- Explanatory variables: mean and standard deviations of household energy data (hourly and monthly)
- Target variables: different levels of energy saving awareness (changes in energy conservation awareness, i.e., options (1–5) to the survey question)
2.3.2. k-Means Clustering
2.3.3. Statistical Hypothesis Testing
- Null hypothesis: this assumes changes in energy conservation awareness and the clusters are mutually independent
- Alternative hypothesis: this assumes changes in energy conservation awareness and the clusters are mutually dependent
- test: for this, we conduct a test to calculate the p-value for making a decision to accept or reject the null hypothesis.
3. Results and Discussion
- Most occupants stay at home during this time interval (as fluctuations in energy data are comparatively huge during the morning and evening hours), so it is effective to conduct a questionnaire survey or compare households based on energy-saving awareness during the morning (until 9 a.m.) or evening hours (until 9 p.m.).
- Home appliances used for space heating and space cooling (which consume high amounts of energy) may be strongly associated with energy-saving awareness.
4. Conclusions
Author Contributions
Funding
Institutional Review Board Statement
Informed Consent Statement
Data Availability Statement
Acknowledgments
Conflicts of Interest
Abbreviations
| GBM | Gradient-boosting machine |
| HEMS | Home energy management systems |
| ZEH | Zero energy house |
| STD | Standard deviation |
| RF | Random forest |
| MLR | Mltiple regression |
| MNN | Multilayer neural network |
References
- Geng, Y.; Chen, W.; Liu, Z.; Chiu, A.S.; Han, W.; Liu, Z.; Zhong, S.; Quia, Y.; Wei, Y.; Cui, X. A biblio-metric review: Energy consumption and greenhouse gas emissions in the residential sector. J. Clean. Prod. 2017, 159, 301–316. [Google Scholar]
- Sheng, P.; He, Y.; Guo, X. The impact of urbanization on energy consumption and efficiency. Energy Environ. 2017, 28, 673–686. [Google Scholar] [CrossRef]
- Dorian, J.P.; Franssen, H.T.; Simbeck, D.R. Global challenges in energy. Energy Policy 2006, 34, 1984–1991. [Google Scholar] [CrossRef]
- Dong, K.; Hochman, G.; Timilsina, G.R. Do drivers of CO2 emission growth alter overtime and by the stage of economic development? Energy Policy 2020, 140, 111420. [Google Scholar] [CrossRef]
- Schleussner, C.-F.; Rogelj, J.; Schaeffer, M.; Lissner, T.; Licker, R.; Fischer, E.M.; Knutti, R.; Levermann, A.; Frieler, K.; Hare, W. Science and policy characteristics of the Paris Agreement temperature goal. Nat. Clim. Chang. 2016, 6, 827–835. [Google Scholar] [CrossRef]
- Guzović, Z.; Duić, N.; Piacentino, A.; Markovska, N.; Mathiesen, B.V.; Lund, H. Paving the way for the Paris Agreement: Contributions of SDEWES science. Energy 2022, 263, 125617. [Google Scholar]
- Nejat, P.; Jomehzadeh, F.; Taheri, M.M.; Gohari, M.; Abd Majid, M.Z. A global review of energy con-sumption, CO2 emissions and policy in the residential sector (with an overview of the top ten CO2 emitting countries). Renew. Sustain. Energy Rev. 2015, 43, 843–862. [Google Scholar] [CrossRef]
- Park, E.; Kim, B.; Park, S.; Kim, D. Analysis of the Effects of the Home Energy Management System from an Open Innovation Perspective. J. Open Innov. 2018, 4, 31. [Google Scholar] [CrossRef]
- Zhou, B.; Li, W.; Chan, K.W.; Cao, Y.; Kuang, Y.; Liu, X.; Wang, X. Smart home energy management systems: Concept, configurations, and scheduling strategies. Renew. Sustain. Energy Rev. 2016, 61, 30–40. [Google Scholar]
- Beaudin, M.; Zareipour, H. Home energy management systems: A review of modelling and complexity. Renew. Sustain. Energy Rev. 2015, 45, 318–335. [Google Scholar]
- AlFaris, F.; Juaidi, A.; Manzano-Agugliaro, F. Intelligent homes’ technologies to optimize the energy per-formance for the net zero energy home. Energy Build. 2017, 153, 262–274. [Google Scholar] [CrossRef]
- Iweka, O.; Liu, S.; Shukla, A.; Yan, D. Energy and behaviour at home: A review of intervention methods and practices. Energy Res. Soc. Sci. 2019, 57, 101238. [Google Scholar]
- Słupik, S.; Kos-Łabędowicz, J.; Trzęsiok, J. Energy-Related Behaviour of Consumers from the Silesia Province (Poland)—Towards a Low-Carbon Economy. Energies 2021, 14, 2218. [Google Scholar] [CrossRef]
- Zhao, X.; Cheng, H.; Zhao, H.; Jiang, L.; Xue, B. Survey on the households’ energy-saving behaviors and influencing factors in the rural loess hilly region of China. J. Clean. Prod. 2019, 230, 547–556. [Google Scholar] [CrossRef]
- Zhang, Y.; Bai, X.; Mills, F.P.; Pezzey, J.C.V. Rethinking the role of occupant behavior in building energy performance: A review. Energy Build. 2018, 172, 279–294. [Google Scholar]
- Ali, U.; Buccella, C.; Cecati, C. Households electricity consumption analysis with data mining techniques. In Proceedings of the IECON 2016—42nd Annual Conference of the IEEE Industrial Electronics Society, Florence, Italy, 23–26 October 2016. [Google Scholar]
- Olu-Ajayi, R.; Alaka, H.; Owolabi, H.; Akanbi, L.; Ganiyu, S. Data-Driven Tools for Building Energy Consumption Prediction: A Review. Energies 2023, 16, 2574. [Google Scholar]
- Shen, M.; Lu, Y.; Wei, K.H.; Cui, Q. Prediction of household electricity consumption and effectiveness of concerted intervention strategies based on occupant behaviour and personality traits. Renew. Sustain. Energy Rev. 2020, 127, 109839. [Google Scholar] [CrossRef]
- Nilsson, A.; Wester, M.; Lazarevic, D.; Brandt, N. Smart homes, home energy management systems and real-time feedback: Lessons for influencing household energy consumption from a Swedish field study. Energy Build. 2018, 179, 15–25. [Google Scholar]
- Sun, M.; Konstantelos, I.; Strbac, G. C-Vine Copula Mixture Model for Clustering of Residential Electrical Load Pattern Data. IEEE Trans. Power Syst. 2017, 32, 2382–2393. [Google Scholar] [CrossRef]
- Estiri, H. Building and household X-factors and energy consumption at the residential sector. Energy Econ. 2014, 43, 178–184. [Google Scholar] [CrossRef]
- Ahmed Gassar, A.A.; Yun, G.Y.; Kim, S. Data-driven approach to prediction of residential energy con-sumption at urban scales in London. Energy 2019, 187, 115973. [Google Scholar] [CrossRef]
- Zhou, K.; Yang, S. Understanding household energy consumption behavior: The contribution of energy big data analytics. Renew. Sustain. Energy Rev. 2016, 56, 810–819. [Google Scholar]
- Liu, X.; Tang, H.; Ding, Y.; Yan, D. Investigating the performance of machine learning models combined with different feature selection methods to estimate the energy consumption of buildings. Energy Build. 2022, 273, 112408. [Google Scholar] [CrossRef]
- Ke, G.; Meng, Q.; Finley, T.; Wang, T.; Chen, W.; Ma, W.; Ye, Q.; Liu, T.Y. Lightgbm: A highly efficient gradient boosting decision tree. Adv. Neural Inf. Process. Syst. 2017, 30, 3149–3157. [Google Scholar]
- Bassi, A.; Shenoy, A.; Sharma, A.; Sigurdson, H.; Glossop, C.; Chan, J.H. Building Energy Consumption Forecasting: A Comparison of Gradient Boosting Models. In Proceedings of the IAIT2021: The 12th International Conference on Advances in Information Technology, Bangkok, Thailand, 29 June–1 July 2021; ACM: New York, NY, USA, 2021. [Google Scholar]
- Zhang, Y.; Teoh, B.K.; Wu, M.; Chen, J.; Zhang, L. Data-driven estimation of building energy con-sumption and GHG emissions using explainable artificial intelligence. Energy 2023, 262, 125468. [Google Scholar] [CrossRef]
- Emami Javanmard, M.; Ghaderi, S.F.; Hoseinzadeh, M. Data mining with 12 machine learning algorithms for predict costs and carbon dioxide emission in integrated energy-water optimization model in buildings. Energy Convers. Manag. 2021, 238, 114153. [Google Scholar]
- Nagahara, M. Sparsity Methods for Systems and Control; Now Publishers: Norwell, MA, USA, 2020. [Google Scholar]


| Energy Type | Unit |
|---|---|
| Electricity purchased | Watt-hour |
| Electricity sold | Watt-hour |
| Electricity produced by solar panels | Watt-hour |
| Net domestic electricity consumption | Watt-hour |
| Fold Number | F1 Score |
|---|---|
| 1 | 0.05 |
| 2 | 0.05 |
| 3 | 0.10 |
| 4 | 0.04 |
| 5 | 0.13 |
| 6 | 0.04 |
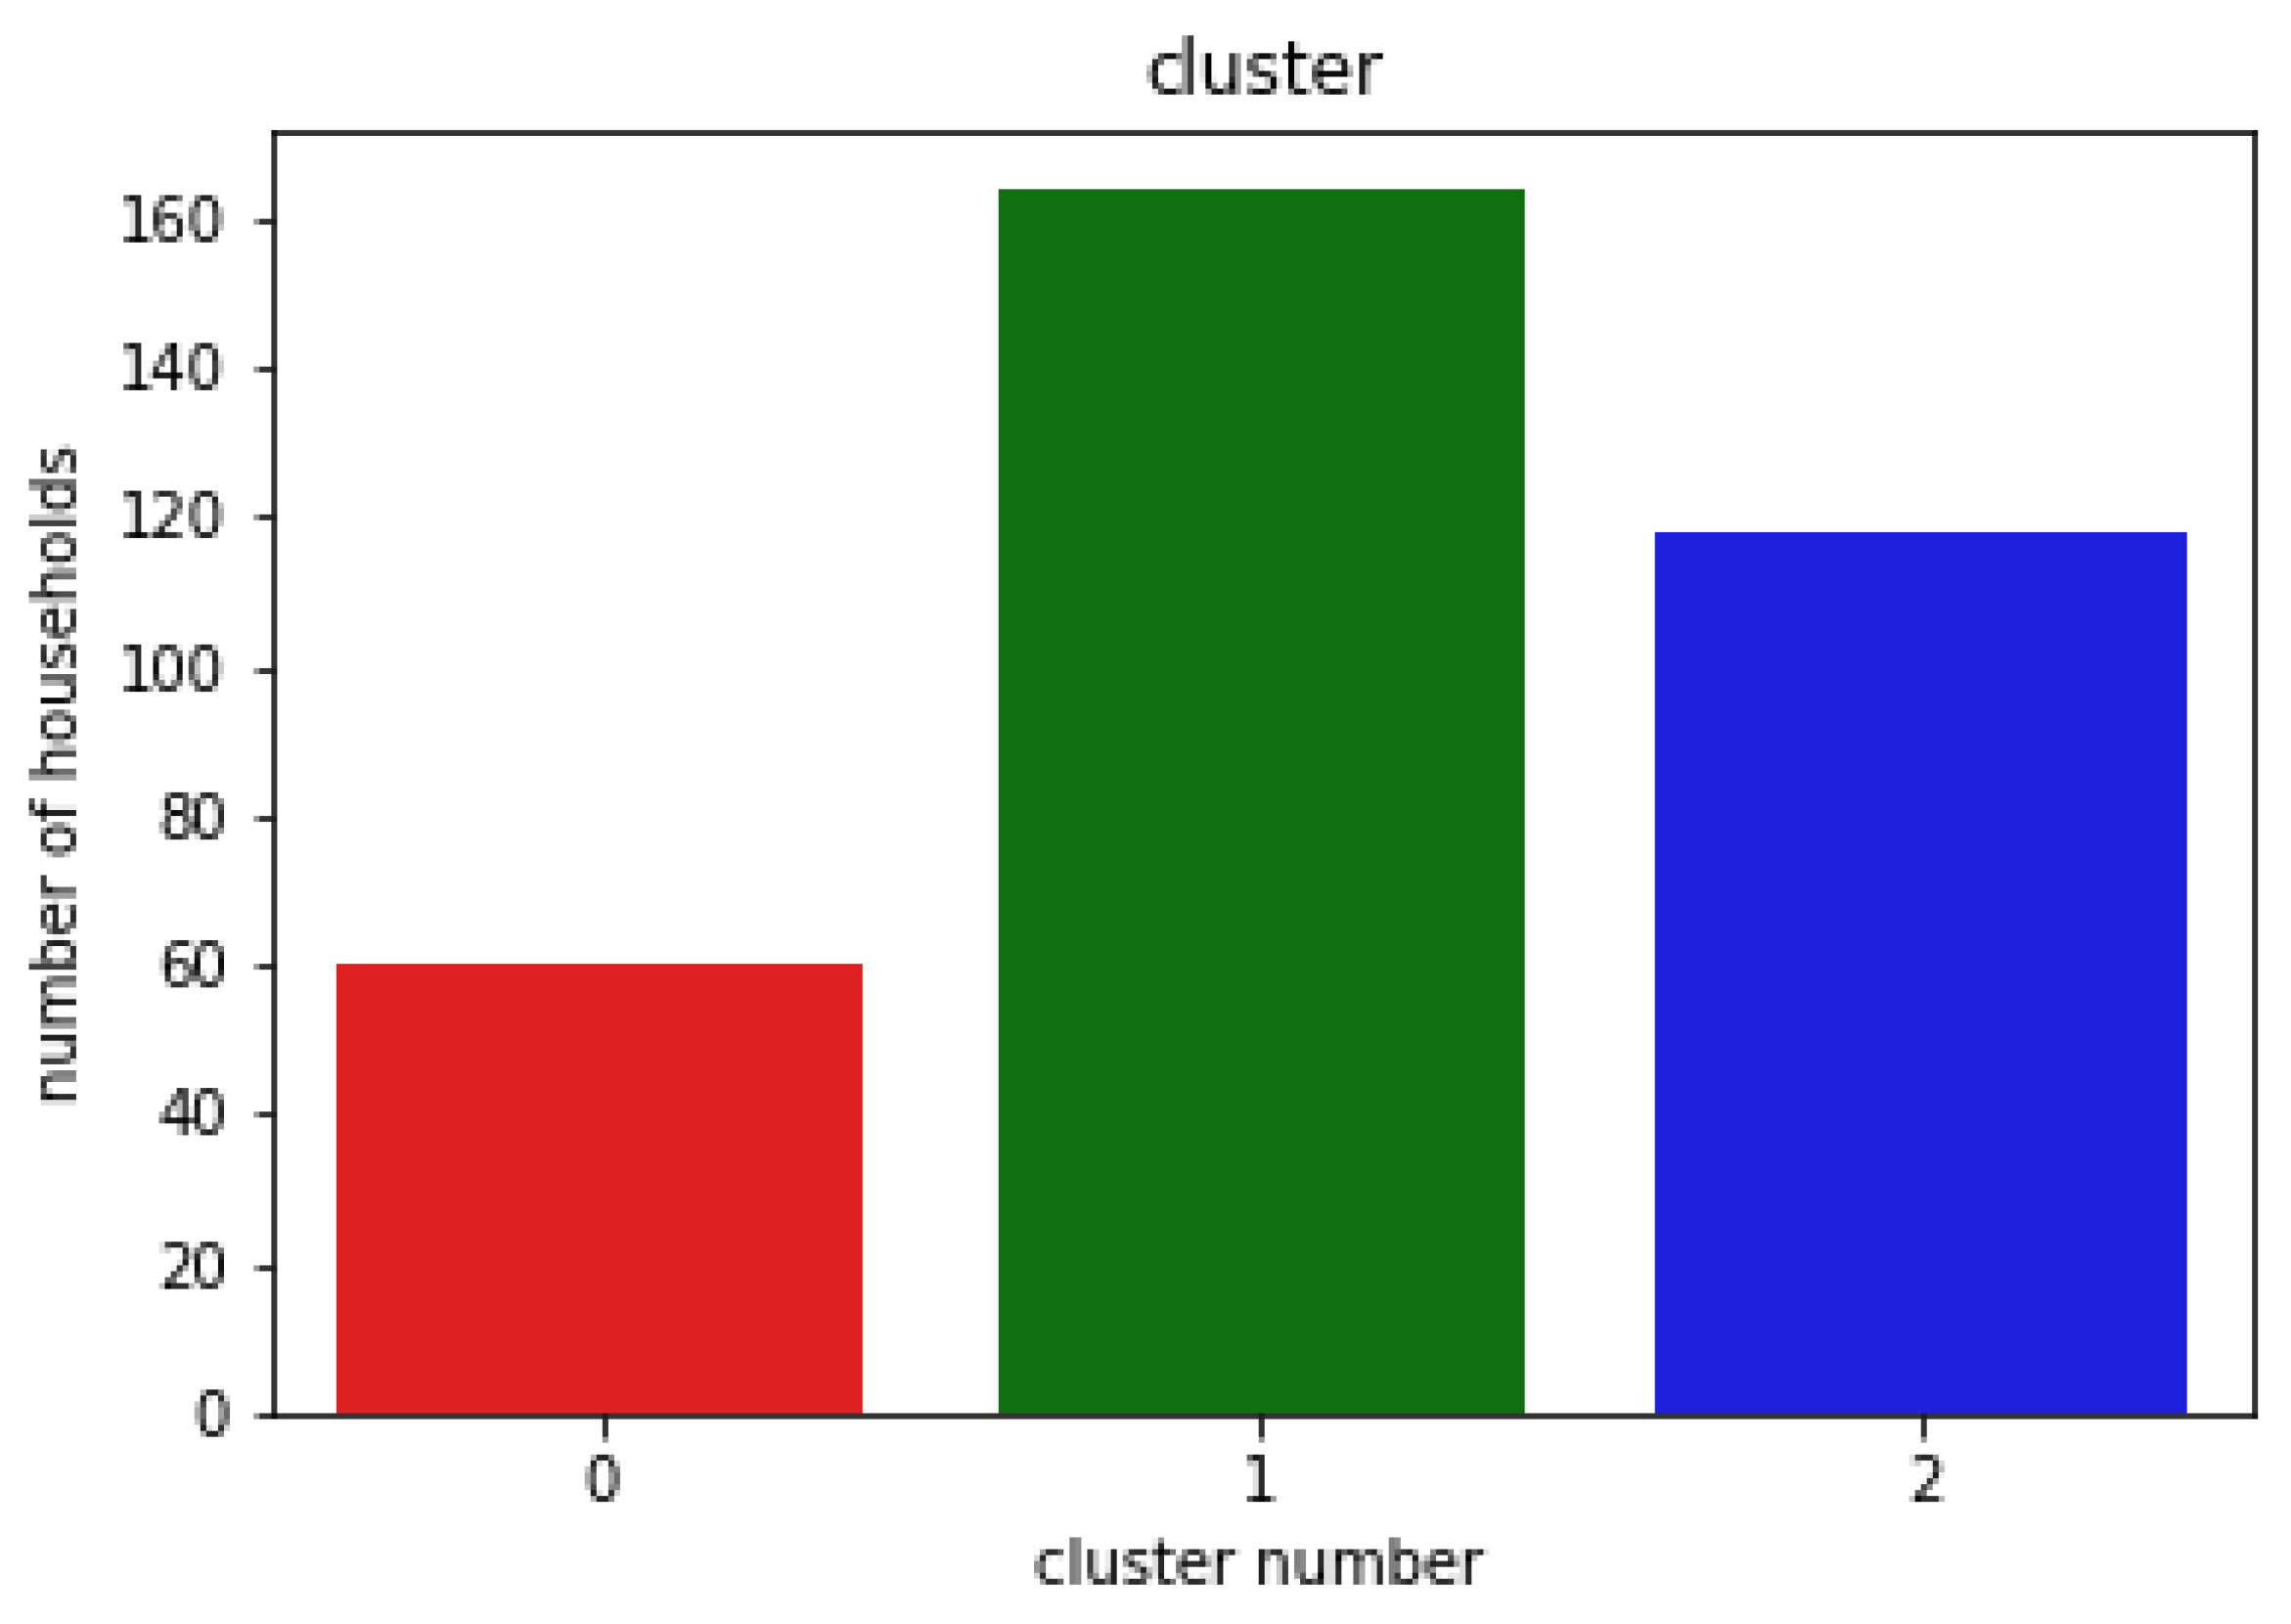
| Cluster | Count | Mean | Std | Min | 25% | 50% | 75% | Max |
|---|---|---|---|---|---|---|---|---|
| 0 | 39 | 3.02 | 1.13 | 1 | 2 | 3 | 4 | 5 |
| 1 | 117 | 2.30 | 0.87 | 1 | 2 | 2 | 3 | 4 |
| 2 | 81 | 2.45 | 0.93 | 1 | 2 | 2 | 3 | 5 |
Disclaimer/Publisher’s Note: The statements, opinions and data contained in all publications are solely those of the individual author(s) and contributor(s) and not of MDPI and/or the editor(s). MDPI and/or the editor(s) disclaim responsibility for any injury to people or property resulting from any ideas, methods, instructions or products referred to in the content. |
© 2023 by the authors. Licensee MDPI, Basel, Switzerland. This article is an open access article distributed under the terms and conditions of the Creative Commons Attribution (CC BY) license (https://creativecommons.org/licenses/by/4.0/).
Share and Cite
Singh, N.K.; Fukushima, T.; Nagahara, M. Gradient Boosting Approach to Predict Energy-Saving Awareness of Households in Kitakyushu. Energies 2023, 16, 5998. https://doi.org/10.3390/en16165998
Singh NK, Fukushima T, Nagahara M. Gradient Boosting Approach to Predict Energy-Saving Awareness of Households in Kitakyushu. Energies. 2023; 16(16):5998. https://doi.org/10.3390/en16165998
Chicago/Turabian StyleSingh, Nitin Kumar, Takuya Fukushima, and Masaaki Nagahara. 2023. "Gradient Boosting Approach to Predict Energy-Saving Awareness of Households in Kitakyushu" Energies 16, no. 16: 5998. https://doi.org/10.3390/en16165998
APA StyleSingh, N. K., Fukushima, T., & Nagahara, M. (2023). Gradient Boosting Approach to Predict Energy-Saving Awareness of Households in Kitakyushu. Energies, 16(16), 5998. https://doi.org/10.3390/en16165998