1. Introduction
Demonstrated in the U.S. Department of Energy’s
Powering the Blue Economy report by LiVecchi et al. [
1], there is a surging interest in how wave energy can benefit the marine industry through at-sea power production. At-sea power is currently a limiting factor for most marine industries, including oil and gas, civil defense, and metocean science. Previous studies have proposed wave energy converter (WEC)-integrated metocean platforms as a solution to at-sea power needs, with examples including wave-powered navigation aids and resident autonomous underwater vehicle (RAUV) docking stations [
2,
3].
Although LiVecchi et al. [
1] does not specify wave energy as the only form of marine renewable energy capable of powering at-sea operations, wave energy is one of the most viable technologies available. Current alternatives to at-sea power production, such as wind and solar power, may not be well-suited to every end-user need due to site-specific conditions. For example, solar photovoltaic panels are geographically and seasonally dependent, limiting the location of the application to tropical and subtropical zones [
1]. Placing solar photovoltaic panels close to the ocean surface will require frequent cleaning of the panels from salt spray and bird droppings [
1]. Wind turbines would have to be surface-based on a platform or bottom-mounted on foundations, making them depth-limited for underwater recharge applications [
1]. Wave energy has the potential to provide alternative solutions to at-sea power where wind and solar may be unable to, and as such, warrants further investigation.
Within wave energy converters, there exist a variety of energy extraction methods, which are classified into various types of devices [
4]. Each WEC type is typically well-suited for a specific wave environment, deployment location, and application [
5]. One such WEC type is known as an oscillating water column (OWC)-type WEC. OWC-type WECs convert the kinetic and potential energy of a wave into pneumatic kinetic energy. This energy can be captured via a turbine. Fundamentally, an OWC system consists of a semisubmerged body with a semiclosed pneumatic chamber, commonly referred to as the OWC chamber. As the incoming wave interacts with and enters the OWC chamber, the internal air-water surface rises to compress the entrained air. The entrained mass of air is typically forced through an opening where a pneumatic power take-off (PTO) can convert the focused kinetic energy of the air into rotational mechanical energy [
6,
7]. The mechanical energy is then converted into electrical energy via a generator. This concept has been demonstrated previously in a number of applications, such as breakwaters, coastal armaments, and navigation buoys [
3,
8,
9,
10].
In viewing the history of energy production in Western society, pneumatic and mixed gas turbines have long functioned as a keystone technology for power production. A major advantage of OWC-type WECs over other WEC types is the prevalence of a pre-existing industry surrounding the core aspects of the PTO, as the design and manufacturing of pneumatic turbines has long been established [
7]. An additional advantage of OWC-type WECs can come from the reduction in maintenance costs due to the location of the primary power extraction method. As the PTO exists entirely above the water surface, the impact of accessing and replacing components may be simplified. Additional benefits in maintenance schedules, as they relate to concerns of biofouling on the PTO, may not be as significant as submerged PTO methods. The versatility of offshore applications highlight a benefit of OWC systems; the technology is easily integrated with existing infrastructure and industry to accelerate market acceptance.
Although pneumatic PTO methods have many end use benefits, the treatment of the PTO in scale testing is a critical aspect of validating development. As outlined by Falcao and Henriques [
7], Viviano et al. [
11], and Falcao and Henriques [
12], the application of real pneumatic PTOs in scale tests is an impractical approach to developing OWC-type WECs. To maintain physical similarity when Froude scaling the PTO in OWC systems, the previous literature has demonstrated that the use of parametric damping methods is appropriate in recreating the effects of quadratic dampers [
7,
13]. These dampers have been employed in the form of porous media and sharp-edged openings, such as slats and orifice plates [
13,
14,
15,
16]. Sharp-edged orifices have a long history of use in research and industrial applications, specifically in flow in a cylindrical pipe, dating back to the 1930s [
17]. For this reason, circular orifices are seen as a desirable way to characterize the effects of PTO damping on cylindrical OWC-type WECs.
The application of the OWC-type WEC in a blue economy setting needs to be considered when making design decisions around the PTO, as well as in the selection of the general geometric configuration. OWC geometries have been well-studied in many geometric forms, for both fixed and floating structures [
7]. Previous examples include, but are not limited to, sloped coastal structures and cylindrical structures. Sloped coastal applications of OWCs, as the descriptor implies, have a sloped OWC chamber, where a hollow chamber slopes down to the seabed and has a submerged opening to the ocean. Spar OWCs are hollow cylindrical semisubmerged structures that are partially or fully open at the bottom and can function as fixed or floating structures. Both of these structures have been employed to provide coastal protection, such as harbor armaments, breakwaters, and levies [
3,
8,
9,
10]. The most notable application has been the Islay-LIMPET system deployed in Portugal [
10]. Power production in this case is produced for on-shore residential and commercial activities, which imposes site-specific constraints on how the geometry can be applied. In the previous literature, investigated designs are constrained to shallow water conditions, which may not be directly applicable to platforms intended for the intermediate water depth, where ocean observing activities may occur. It is important to note that in the intermediate-water-depth environment, deployment of sloped OWC structures may not always prove to be practical to incorporate into existing designs.
For the purpose of this paper, we consider the geometric configuration of fixed OWCs as an ocean observing platform. The objective of an ocean observing platform often dictates constrained motion requirements in certain degrees of freedom. For example, it could be desirable for specific types of RAUV docking to have a platform where the rotational degrees of freedom are constrained [
1,
2]. Floating spars OWCs typically absorb energy from incident waves through their heaving oscillation, while restricting motion in pitch and roll [
18]. In the most motion-restricted case, the spar is represented by a pile and is fixed relative to the seabed.
If we consider the design of a fixed offshore OWC, the previous literature has explored the effects of certain geometric configurations on general OWC performance. For example, the draft of the OWC chamber relative to the incident wavelength has been observed to impact the resonant frequency and capture efficiency [
8,
9,
19]. It has been observed by Ning et al. [
19] that a larger draft decreases capture efficiency in shorter wavelengths (
kh > 1.75). This was previously explained analytically by He and Huang [
8], as an increased draft blocks more of the incident wave, and thus reflects and scatters more of the incident wave energy. Both He and Huang [
8] and Ning et al. [
19] express the OWC as an open-bottom structure, where the draft,
d, is expressed relative to the overall depth of the seafloor,
h.
In Xie et al. [
9], an open-bottom OWC structure was investigated relative to its location to a breakwater, which functioned to reflect and impinge the incident wave. It was determined that an optimal draft could be determined relative to the thickness of the OWC chamber [
9]. It was also found that the inclusion and location of a breakwater could both increase the efficiency of the OWC system as well as widen the OWC capture frequency bandwidth [
9]. In intermediate water depths, large breakwater structures may be impractical. Yet a wider capture frequency bandwidth and improved efficiency is still desirable.
This design question is addressed in both Deng et al. [
14] and Deng et al. [
15], where an asymmetric OWC with a long submerged bottom plate, also commonly referred to as a heave plate in free-floating structures, was investigated. In Deng et al. [
15], the OWC characteristic lengths were changed relative to the depth. Heave plates or bottom plates are commonly applied in the offshore industry to damp the resonant motion response of floating structures but are also useful in a fixed application to emulate the effects of wave interaction with the seabed. In a previous study, the characteristic lengths include the OWC chamber draft and width, as well as submerged heave plate depth and length. It was shown that as the OWC opening gap between the bottom of the chamber and the heave plate increases, the frequency for peak diffraction flux shifts to a lower-frequency range, while the amplitude increases [
15]. A similar trend was previously reported by Martins-Rivas and Mei [
20] and Deng et al. [
21], where an increase in draft in other bottom-fixed OWC geometries induces a similar effect on the peak radiation damping and diffraction flux frequencies and amplitudes.
More recently, Wang and Zhang [
22] numerically investigated a similar asymmetric OWC, specifically addressing the influence of the bottom plate submergence depth and length. This investigation differed from the previous literature as the OWC chamber was open on both sides, allowing the wave to pass through the gap between the OWC chamber and the submerged bottom plate. It was shown that the peak energy absorption increases in amplitude due to a decrease in the gap between the OWC chamber and the submerged heave plate. It was also demonstrated that an optimal heave plate length relative to the OWC chamber exists [
22]. As a result, the previous literature implies the resonance is present in the OWC chamber, influenced by a change in draft and the OWC chamber opening, and therefore, the OWC chamber draft and bottom plate submergence depth must be a fixed parameter.
As it has been demonstrated that OWC chamber resonance can be tuned using geometric parameters; the literature further assesses the influence of the OWC chamber width relative to the wave length [
15,
20,
21]. In each study, a relationship was demonstrated clearly, such that as the width of the OWC chamber increases, the peak capture length shifts to lower-frequency waves, with some indications of an increase in capture length amplitude [
15,
20,
21]. In comparison with the influence of the OWC draft, the previous literature clearly demonstrates that the peak capture frequency is more sensitive to a change in OWC chamber width than a change in draft [
15,
20].
As changes in the OWC chamber width and draft show clear resonant modes in the previous literature, it stands to reason that the inclusion of a heave plate could demonstrate additional resonant modes. In fact, Deng et al. [
15] and Wang and Zhang [
22] imply that the horizontal plate could provide an additional resonance mechanism and could function to widen the bandwidth of frequencies captured. A similar investigation was previously conducted by Deng et al. [
14]. In this case, an optimization was conducted by varying PTO damping through the use of different diameter orifice plates on different length bottom plates [
14]. It was found that an optimal heave plate length relative to an orifice diameter could be found.
Aside from OWC chamber and heave plate design, it has been demonstrated analytically by Deng et al. [
23] that for a fixed cylindrical OWC, the addition of thin, flat, rectangular waveguides affixed as a V-shaped channel into the pile opening can induce resonance phenomena in the OWC chamber through the creation of a resonant moonpool. In this case as well, the resonant frequency of the moonpool can be tuned via the chamber diameter. The opening angle and length of the waveguides function to widen the peak resonant bandwidth and increase the capture width of the OWC.
It is often the objective of the previous literature to understand how different geometric features impact resonant frequency of an OWC, with the objective of increasing the capture width, and thus the extraction efficiency of an OWC system. The extraction efficiency of an OWC system is often discussed in the literature relative to two performance indicators: the coefficient of amplification and the coefficient of pressure [
13,
24,
25]. These performance indicators are often used to describe the primary conversion mechanics of an OWC, and although linkages can be made to extraction efficiency, the previous literature demonstrates that the trend of each indicator does not always reflect that of extraction efficiency. An analytical framework is required to demonstrate how each indicator can predict efficiency, which requires surface displacement and pressure fluctuation to adhere to a known function in time. As nonlinear higher-order effects can be present in regular conditions, this may not always be practical [
16].
What is often overlooked is how these indicators can be also used to inform design choices outside of power applications. As the coefficient of amplification describes the relative surface displacement inside the OWC chamber, one could apply this coefficient to determine the minimum distance between the still waterline and the OWC chamber lid. This can be useful to prevent slamming events during compression, which can damage the OWC chamber and PTO. Similarly, the coefficient of pressure can be used to determine the minimum strength requirements to prevent failure modes in fatigue. Without discounting how these indicators impact extraction efficiency, a more holistic approach to using these parameters is proposed.
Objective
In this paper, we investigate an axisymmetric variation in the V-shaped channel geometry, where the OWC chamber is open on four sides. The objective of this investigation is to characterize the power performance of this novel geometry and evaluate its design through the lens of blue economy applications of the technology. We can use the aforementioned performance indicators (extraction efficiency, coefficient of pressure, and coefficient of amplification) to evaluate the performance of the OWC system and try to determine an analytical framework to link them to extraction efficiency. We propose augmenting the geometry to include a heave plate suspended below the OWC chamber, at the base of the waveguides. The heave plate will function as an artificial boundary similar to the seabed found in the previous literature for shallow water applications. As previously mentioned, a review of the literature has demonstrated the importance of characteristic lengths, which have been considered in the final design. The characteristic lengths, including OWC draft, heave plate diameter, waveguide length, OWC chamber heave plate gap, and OWC chamber diameter, are fixed in the proposed geometry. The effects of varying wave length and wave height relative to the geometry will be investigated. As energy extraction is the primary objective of a wave energy converter, a range of PTO damping values will also be investigated in this study.
We evaluate the performance of this design under a proposed application, namely providing power to ocean observing activities in the intermediate water depth for locations on the south shore of Oahu. The chosen wave lengths and wave heights are Froude-scaled regular waves based on observed wave conditions characteristic of the south shore of Oahu. The previous literature has investigated fixed applications in the nearshore environment, where there is a reasonable expectation that the direction of the incident wave is constrained [
10,
20,
23]. As intermediate-depth WEC applications may experience multiple incident wave directions, creating an axisymmetric geometry may enable multidirectional energy capture. For this reason, an investigation of the directional dependence of energy extraction is conducted.
2. Methods
2.1. Model Description
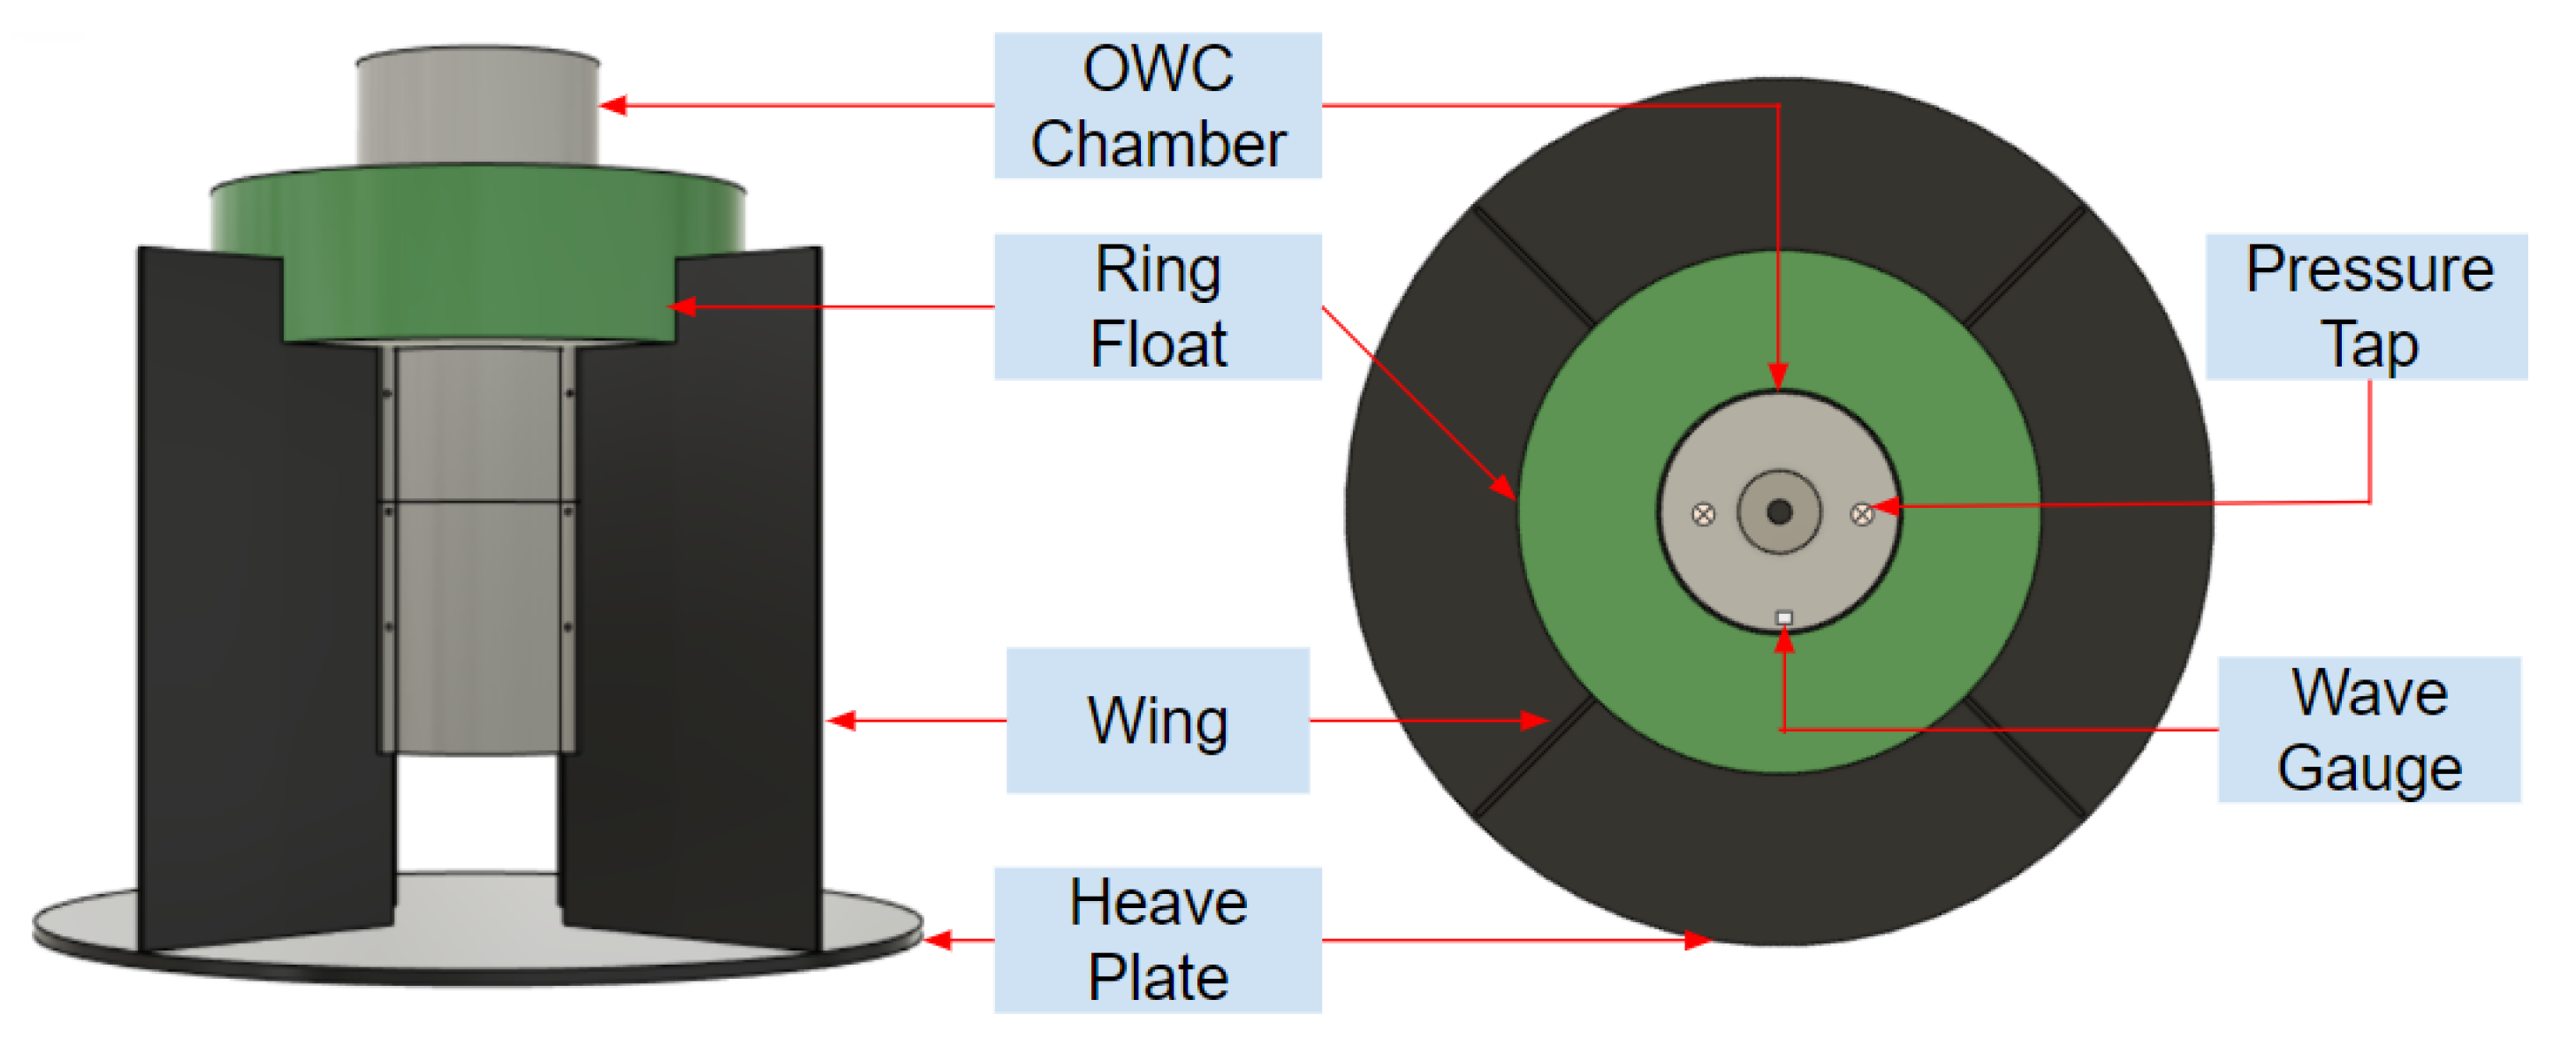
Referring to
Figure 1, here, we study a fixed variation in the V-shaped channel OWC. The model can be described as a cylindrical axisymmetric OWC with V-shaped channels that focus the incident wave energy into a central compression chamber. To emulate the effects of the seabed, a circular heave plate is affixed to the base of the V-shaped channel wings at a distance below the opening of the compression chamber.
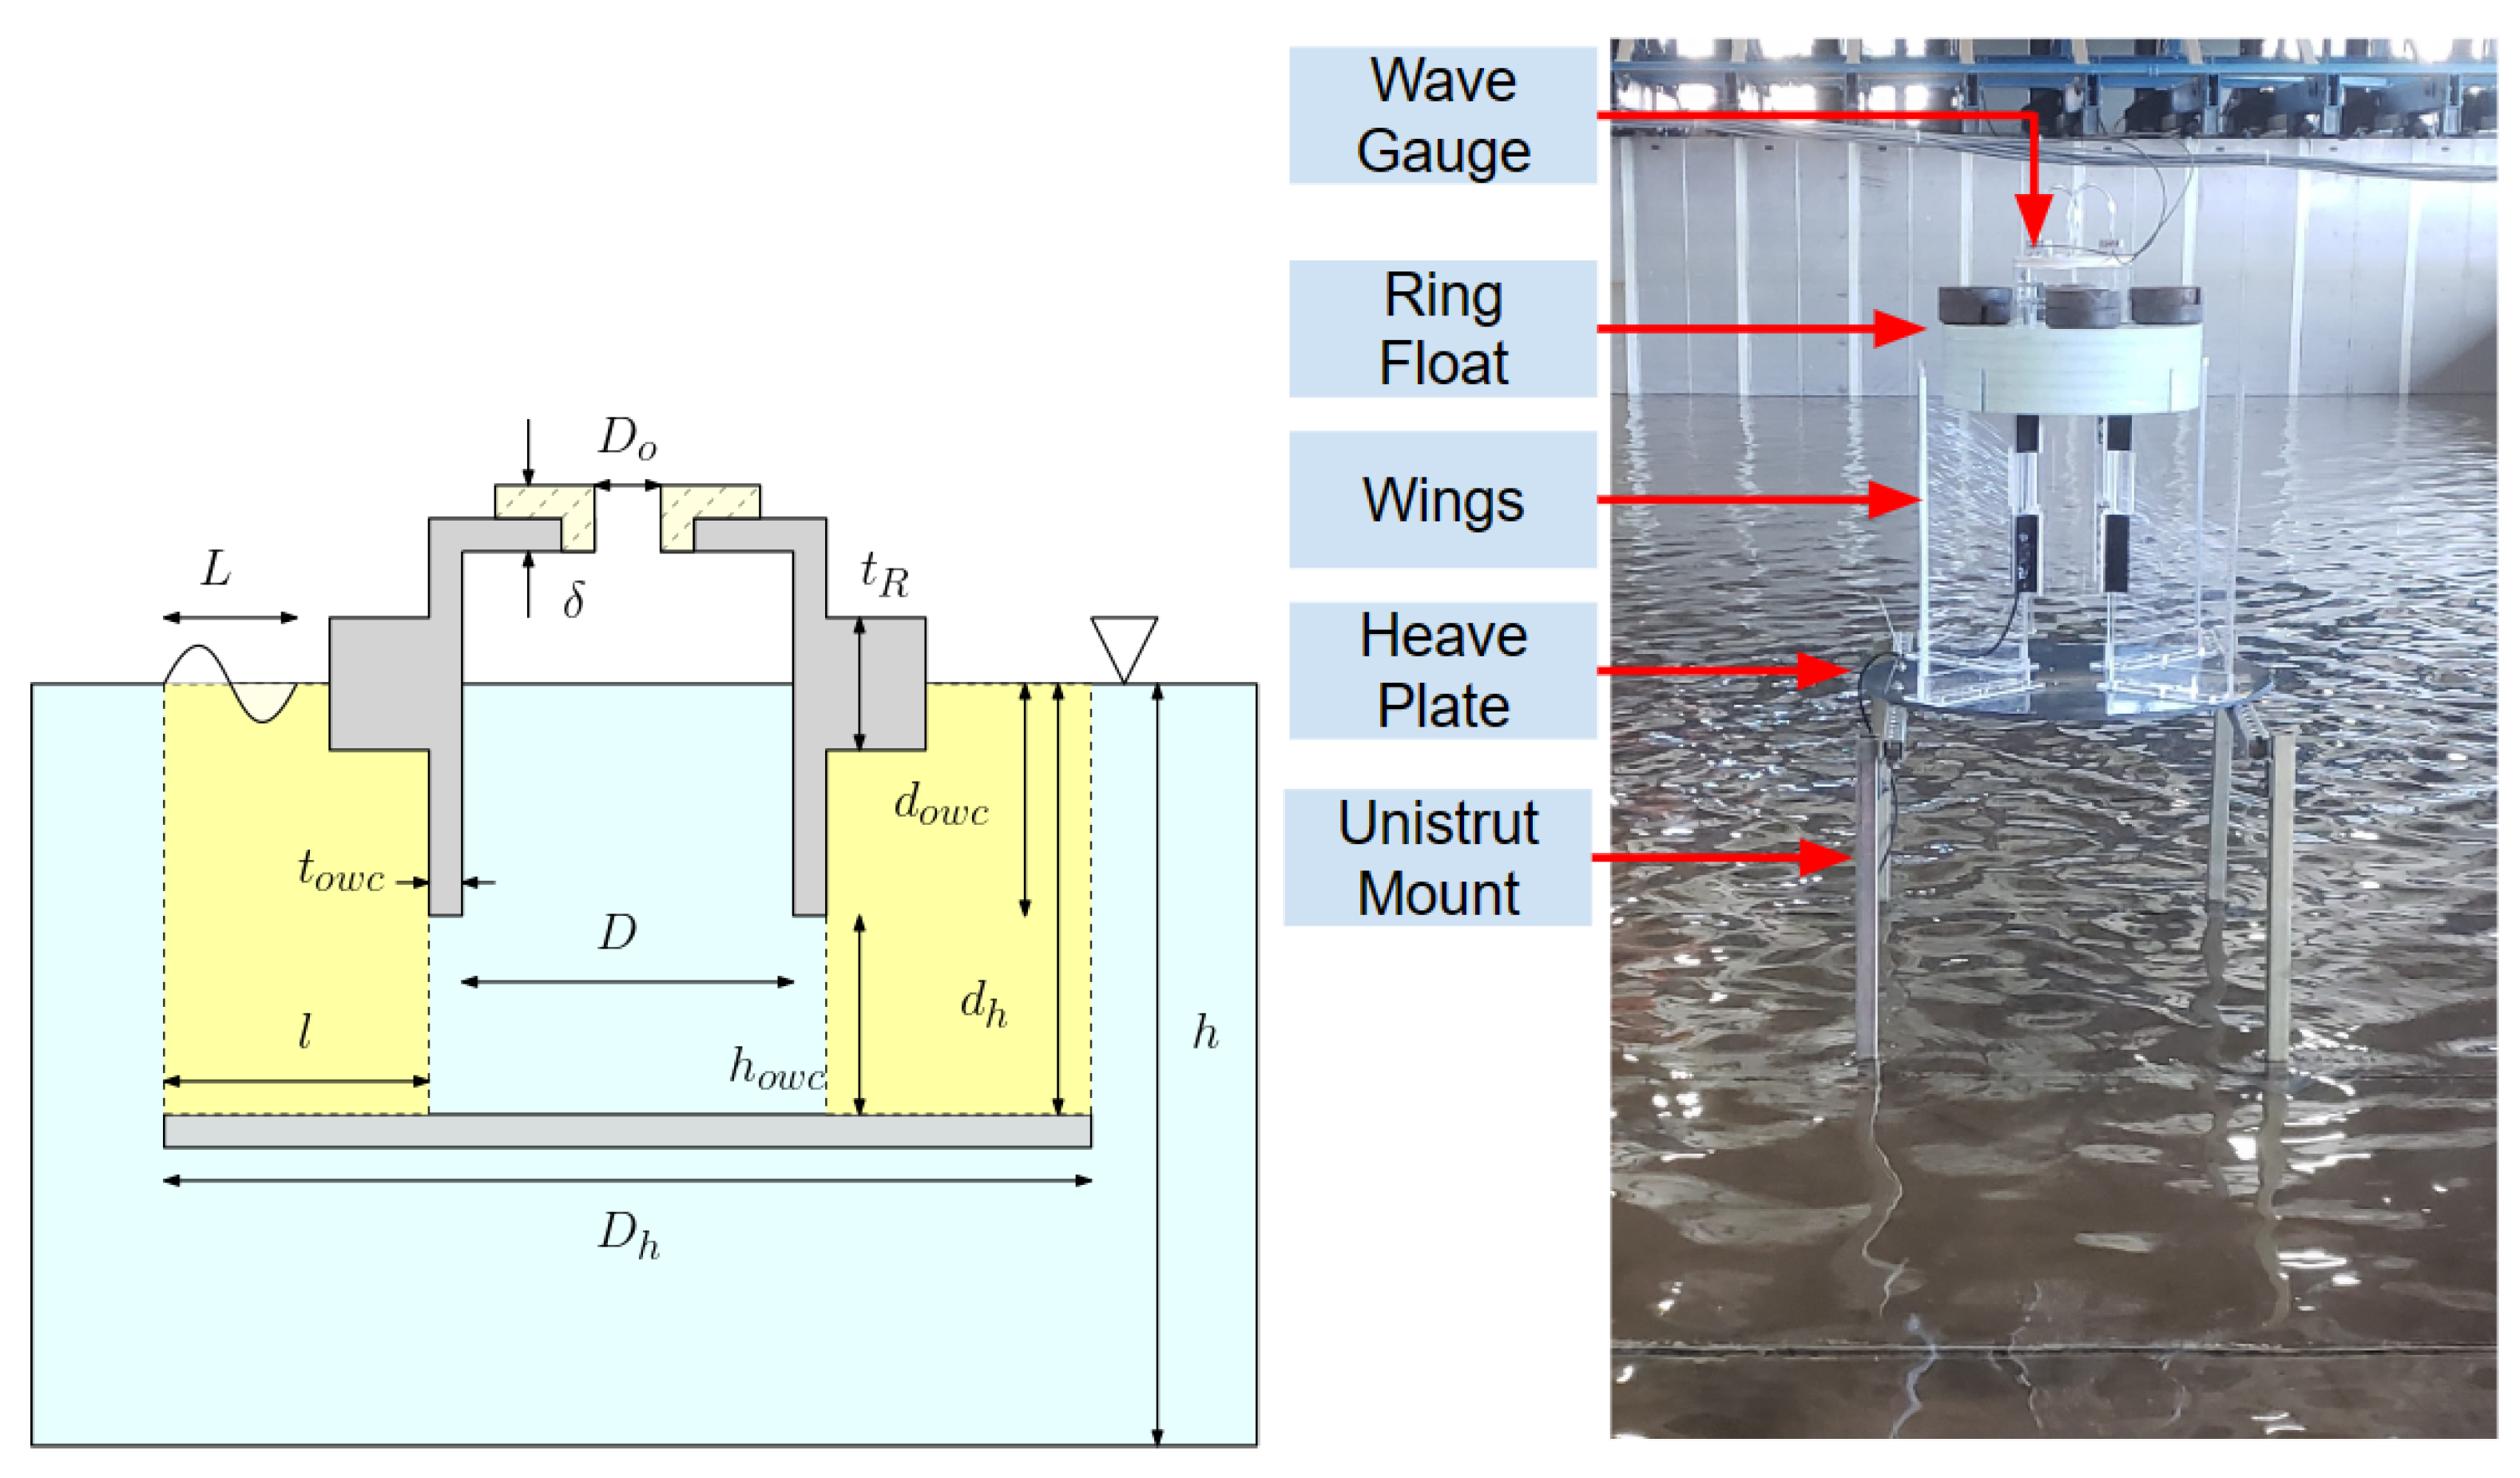
Referring to
Figure 2, the model was designed using the following characteristic lengths:
OWC chamber diameter D = 22 cm;
OWC chamber draft d = 44 cm;
Heave plate diameter = 84 cm;
Thickness of OWC chamber = 3 mm;
Length of the wing l = cm;
Diameter of the orifice = 19 mm to 32 mm;
Thickness of the orifice plate = 8 mm;
Distance between the bottom plate and the OWC chamber = 16 cm;
Thickness of the top float = 15 cm.
The previous literature outlines a number of geometric considerations that can affect the extraction efficiency and thus guide decision making in design. These parameters inform developers on the range of values that might yield an appropriate starting design of the OWC system [
15,
16,
19,
21,
23]. For each design consideration, the geometric ratios of the proposed design fall within the range of investigated values asserted in the previous literature [
15,
16,
19,
21,
23]. The OWC chamber leading edge draft was informed by the previous literature investigating the amount of energy captured vs. the wave energy reflected [
21]. The subsequent literature investigated the effect of the OWC chamber leading edge draft relative to the submerged distance of a heave plate [
15]. Combining the understanding of heave plate submergence with OWC chamber draft relative to the seabed can inform a recommended distance between the OWC chamber bottom and the heave plate. Furthermore, the same authors discuss the impact of the heave plate diameter relative to capture width.
When comparing this work with that of other OWCs, a relationship exists between OWC chamber diameter, wavelength, and capture width [
19,
21,
23]. In combination with the literature relating heave plate diameter to capture width, an appropriate ratio of the OWC chamber diameter and the heave plate diameter can be postulated. Similarly, the design of a V-shaped channel has been previously been investigated relative to the water depth and OWC chamber diameter [
23]. This can be used to relate the OWC chamber diameter to the length of the V-shaped channel walls, which we refer to as wings. As there is a desire to enable omni-directional power performance, axisymmetry is applied to the V-shaped channels. The same authors also investigated the impact of the opening angle of the V-shaped channel on energy extraction [
23]. This work was used to determine the number of wings affixed radially to the OWC chamber.
It is worth noting that the geometry of the fixed structure deviates from the V-shaped channel OWC discussed in the previous literature via a ring float attached at the still waterline. The model was tested concurrently with a free-floating test article of the same geometry, with the intent of conducting a side-by-side comparison of the two models. In the fixed model, the ring float functions as a barrier to force the water into the chamber. In the free-floating model, the ring float has the dual function of acting as a barrier, as well as acting as the primary buoyancy. The ring float has the potential to improve the efficiency of the model by impinging overtopping waves to a degree. For the purpose of this paper, we focus on the results of the fixed model, as the results of the floating WEC will be reported elsewhere. The fixed test article was constructed using clear acrylic and PVC and can be seen in
Figure 2.
To vary PTO damping, a set of orifice plates were used with different opening ratios,
, or
. Each
was tested with a
of 0 degrees. The set of acrylic orifice plates were professionally manufactured in accordance to ISO standard 5167-2 (Retrieved from
https://www.iso.org/standard/79180.html (accessed on 9 October 2020) [
26]. Each orifice plate was sealed to the top surface of the OWC chamber using a silicone gasket adhesive, which was removed and reapplied each time an orifice plate was installed. To avoid slamming events during testing, the total freeboard of the OWC chamber and orifice is fixed at 20 cm.
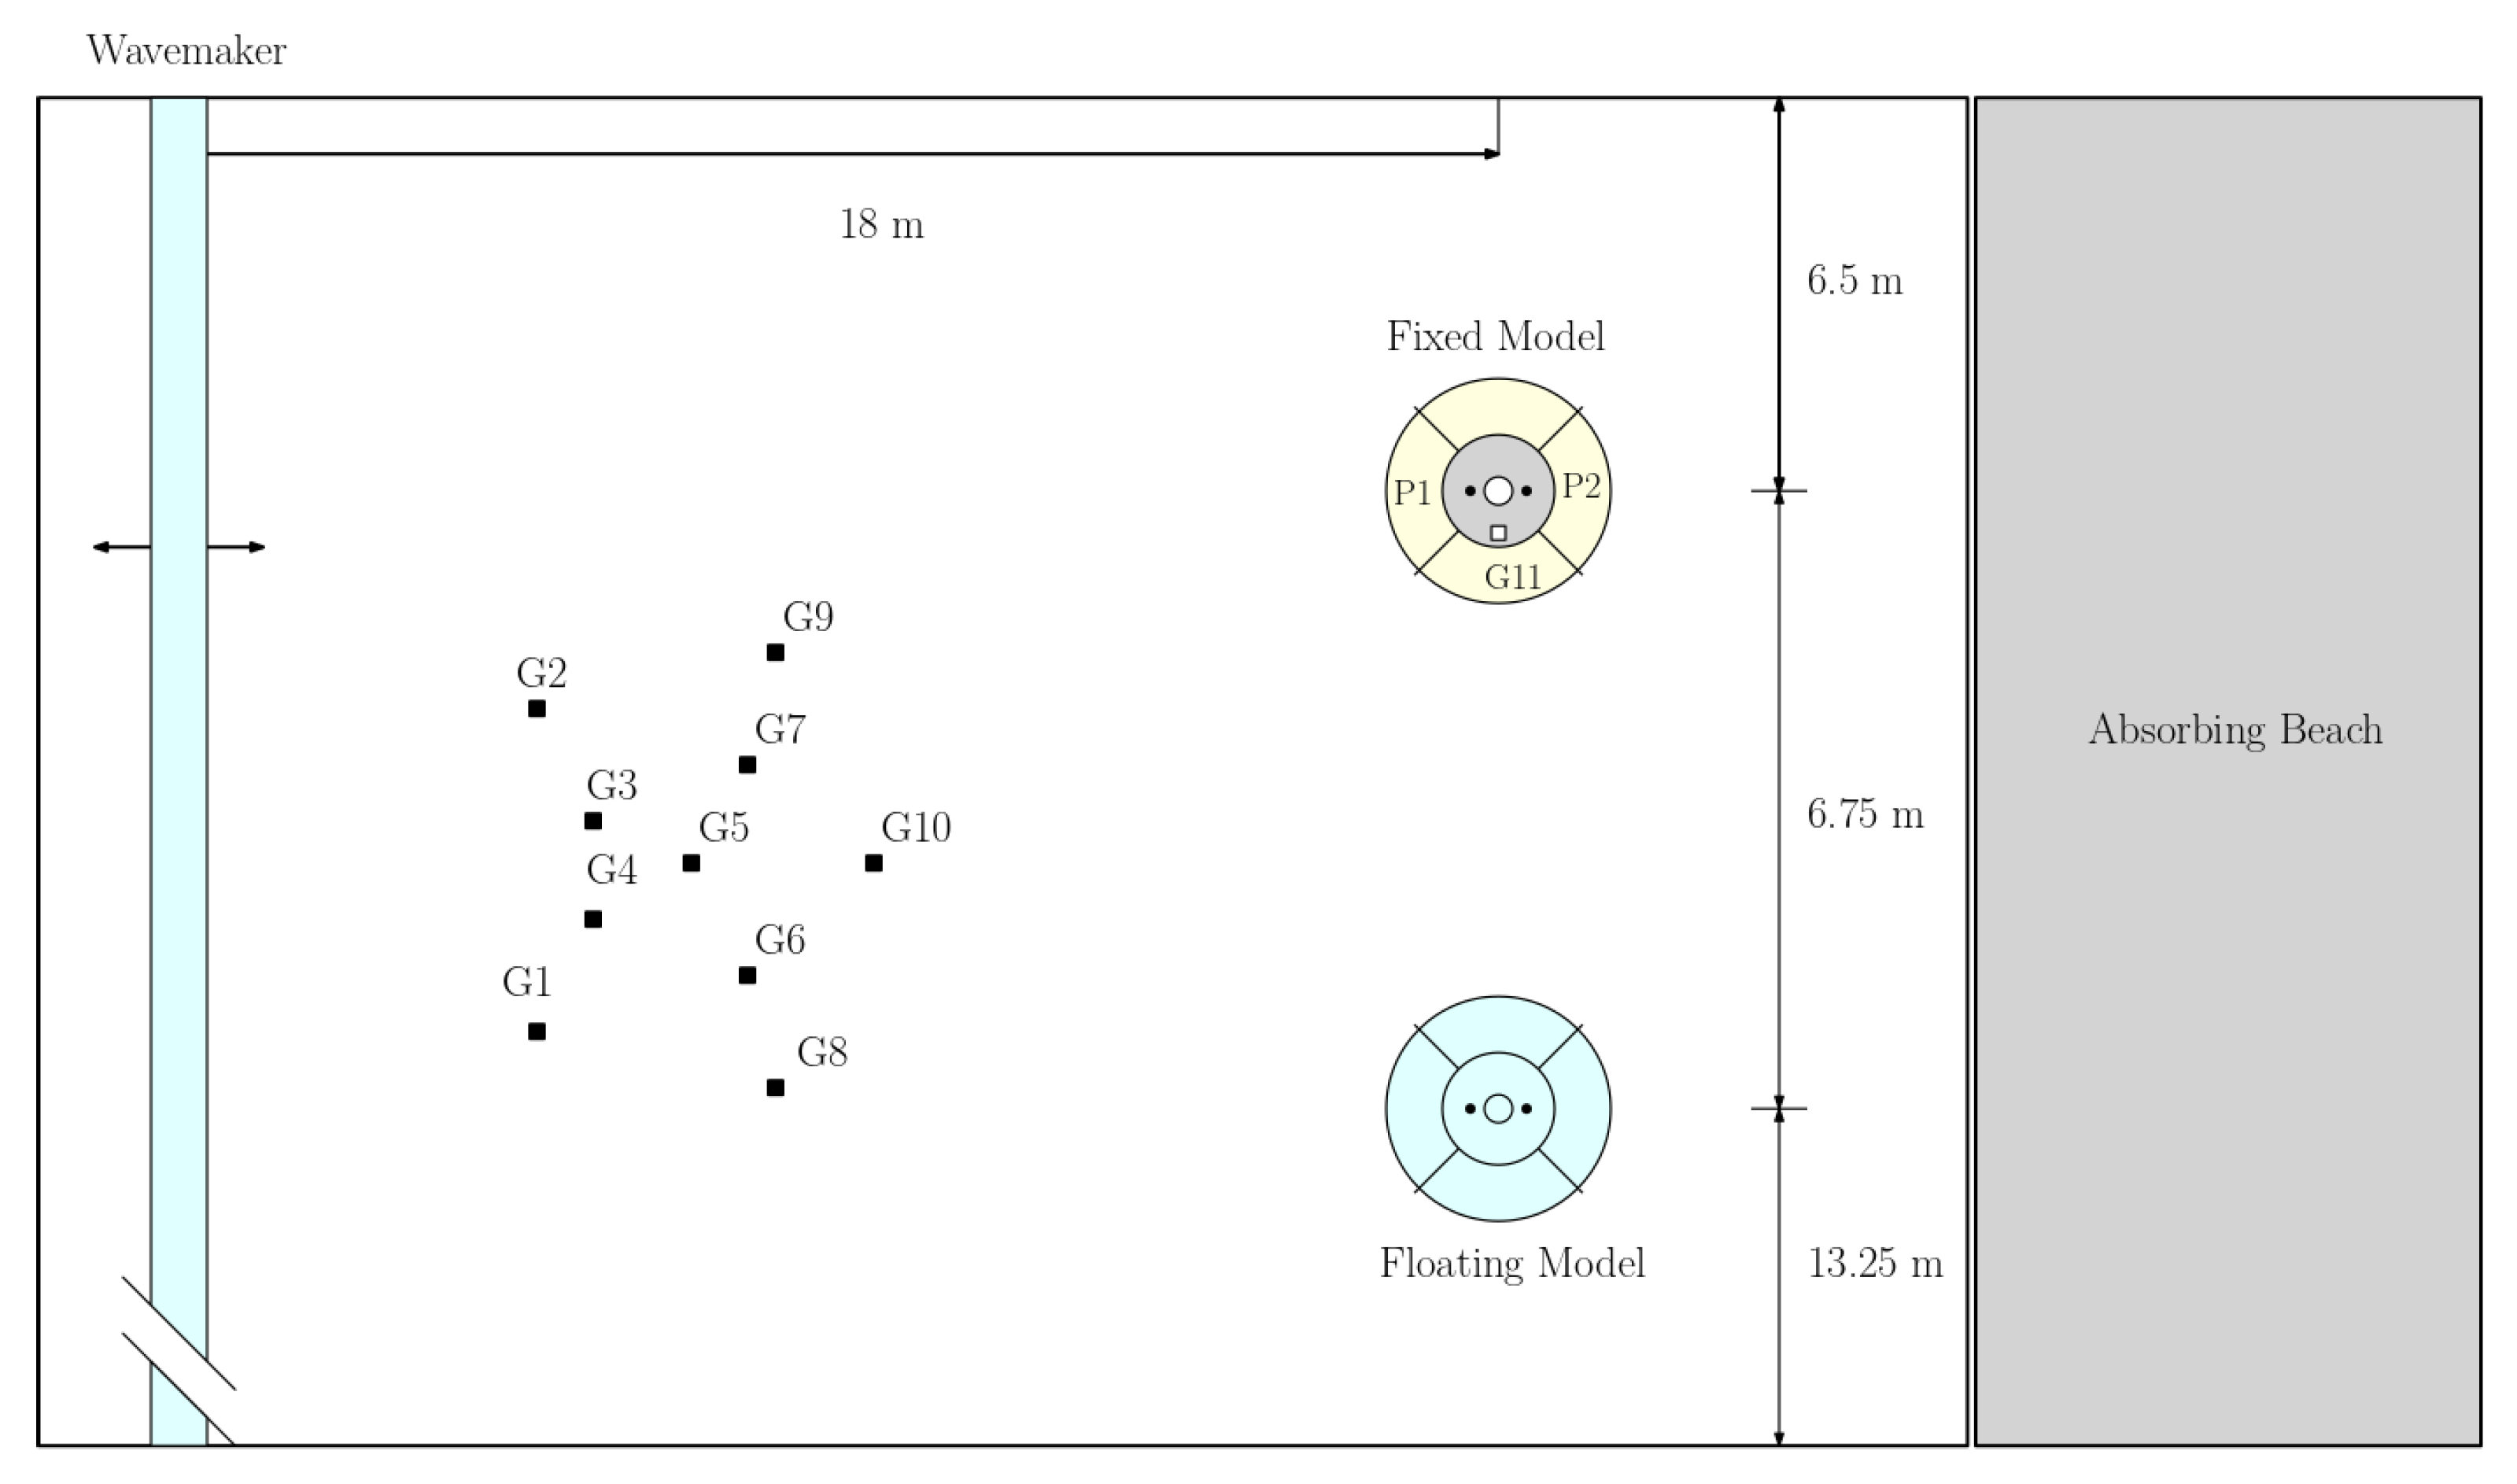
2.2. Experimental Setup
The fixed test article was tested at the O.H. Hinsdale Wave Research Laboratory (HWRL) in the Directional Wave Basin. The basin is 48.8 m long and 26.5 m wide, with a sloping beach at one end to absorb incident waves. The wavemaker for the Directional Wave Basin is a 30-channel piston-type belt-driven servomotor system. It consists of a segmented vertical wall, referred to as the wavemaker piston. The wavemaker is capable of producing waves with an incident angle of ±30 degrees. To produce directional waves, the wave generator has to be divided in segments that are controlled individually. Simple directional wave generation is achieved by projecting the paddle displacement along the wavemaker boards and applying a phase time-shift [
27]. To avoid interference with the model from the lateral walls, the device is located in the basin such that it is close enough to the wavemaker to avoid the reflections but far enough to avoid the effect of the evanescent modes in wave generation. A technique known as the “corner reflection method” is applied, so a portion of the wavemaker produces waves in one direction and the other portion in a mirror direction, creating an extended area of waves without the effect of reflection from the sides [
27]. Reflected waves from the sidewalls will then be dissipated from the wave absorber. The Directional Wave Basin was filled to its maximum depth of 1.36 m. The model installed in the basin can be seen in
Figure 3. The fixed test article, seen in
Figure 3, was tested concurrently with a quasi-free-floating model. The fixed model was placed offset of the floating model in line with the zero-degree incident wave crest. The floating model was placed in the middle of the basin where the motion tracking system was located.
In this experiment, a number of parameters were measured. These include OWC chamber differential pressure
, water surface elevation inside the OWC chamber
, and water surface elevation at various points in the basin
. The OWC chamber differential pressures are represented in
Figure 4 as
and
. The OWC chamber surface elevation is represented by point
.
–
are arranged in a wave gauge rosette, which is designed to resolve directional waves in the basin [
28].
Wave height
H, period
T, and incident angle
are inputs provided to the wavemaker. During testing, these values are verified by using an array of 10 custom resistive self-calibrating wave gauges with 1 mm accuracy, arranged in a rosette. See
Figure 4 for arrangement of wave gauges, represented by
. Goda and Suzuki two-point wave separation was used to determine the presence of multiple wave frequencies for the zero-degree incident direction [
29]. This allows us to properly sample the measured time series for a set of 10 waves where the incident wave regime has stabilized and only the design wave period is present. The wave gauge rosette placement, shown in in
Figure 4, was chosen to analyze results from directional irregular wave testing that was conducted. The results of the irregular wave testing are forthcoming. The directional wave gauge array outlined has been presented in the previous literature to assess directional wave spectra [
28].
Differential pressure is measured using two Setra 265 very low-differential pressure transducers (Setra Systems, Boxborough, MA, USA), where the pressure differential is measured between the inside the OWC chamber and the ambient atmospheric pressure. The pressure range of the sensors is ±2488 pascals, with an accuracy of 0.25% FS. Pressure sensors were chosen to be in line with the direction of wave propagation. This is to observe if phase lag in the two pressure signals occurred, which could indicate issues related to compressibility. The phases of the two differential pressure readings are compared with one another to verify that compressibility can be neglected.
The OWC chamber surface elevation is measured using a single custom resistive self-calibrating gauge with 1 mm accuracy. The wave gauge was placed inside the OWC chamber, in line with the zero-degree incident wave crest tested. It was suspected in the experimental design that the direction of the wave propagation would be the most likely direction of resonant seiching inside the OWC chamber, if seiching did occur. Without the ability to use multiple wave gauges inside the OWC chamber, we sought to reduce the influence of seiching for the most likely occurrence. A GoPro camera (GoPro, San Mateo, CA, USA) and gradation tape were used to verify that the surface elevation did not have significant higher-order seiching occurring within the OWC chamber.
All measurements were time-synchronized using a DAQ module at Oregon State University. The HWRL uses a National Instruments computer architecture with LabView v2019. The analog readings were sampled at a rate of 100 Hz on a NI PXI-6259 M-series 16-bit multifunction DAQ module (National Instruments, Austin, TX, USA). The DAQ module communicates via the PXI/SCXI backplane to SCXI-1143 Butterworth antialiasing filter modules in its containing PXI-1052 chassis. Each filter module is fronted with SCXI 1305 terminal blocks that take ±5 V differential inputs from analog channels via 50 coaxial cable with BNC connectors. The SCXI-1143 Butterworth antialiasing filters are set with cutoff frequency at ¼ the sampling rate.
2.3. Test Conditions
Water depth was fixed at h = m. The wave conditions tested at HWRL were based on Froude-scaled conditions expected in future ocean tests on the south shore of Oahu. Using a scaling factor of 1:10, we Froude-scaled the wave periods and wave heights based on collected wave data at the Kilo Nalu Observatory on the south shore of Oahu. The test article was tested in directional second-order Stokes waves, representative of expected ocean conditions.
As we are seeking to understand the capture length for this model, the test conditions for the second-order Stokes waves were determined using key dimensionless parameters, mentioned in the next section. Wave periods ranging from 1.25 s to 4 s were tested (which correspond to a wavelength of 2.435 m to 9.842 m for the given m), with wave heights ranging from 5 cm to 14 cm. The directional variability was considered and included in testing. A range of 0-to-25-degree incident waves were tested for the regular waves. Since the model is axisymmetric, we assume that performance for the incident wave is symmetric as well. Thus, we are able to observe the performance of the model for ±25 degrees.
Based on the design conditions, we chose the appropriate regular wave test conditions to characterize performance. Wave periods of 1.25, 1.5, 1.75, 2, 2.25, 2.5, 3, and 4 s were tested with a fixed wave height of 8 cm. In addition to frequency testing, we tested wave heights of 5, 6.5, 8, 9.5, 11, and 14 cm, where the period was fixed at 2 s. The incident angle of each test previously mentioned was fixed at the zero-degree incident wave. Additional tests were conducted with a of 15 and 25 degrees. For these tests, the wave height was fixed at 8 cm and the wave period at 2 s. It was determined that all regular waves tested were 2nd-order Stokes waves. Repeated wave condition tests were conducted on an of 0.5%, 0.7%, and 1.0%, where was 0, 15, and 25 degrees.
2.4. Orifice Characterization
In order to quantify the power output of an OWC system, the effects of a pneumatic power take-off must be represented during physical model testing. The previous literature has established that dealing with real PTO systems at smaller scales can prove problematic when scaling the system [
11]. In place of a turbine, it has been established that the nonlinear damping effects can be parameterized with a quadratic damper in the form of an orifice plate [
13]. For most small-scale models, the air inside the OWC chamber can be assumed to be incompressible [
30]. Given that the OWC chamber is a cylindrical tube, the damping effect can be represented as that of a round orifice plate in pipe flow, which has been well studied by Johansen [
17] for incompressible fluids. In high Reynolds flow, the inertial term can be neglected. In terms of the cross-sectional average velocity of the air–water interface inside the OWC chamber,
, the following expression can be employed to characterize the relationship between pressure drop
and
for incompressible air [
16,
17,
31]:
where the quadratic loss coefficient
is a function of a Reynolds number
and the opening ratio
for steady flows or long waves. Mei et al. [
31] derived the following semitheoretical expression for the quadratic loss coefficient
for long waves:
where
is a flow contraction coefficient.
For an orifice used as a power take-off simulator of a circular OWC, the flow is not steady. Very often, the orifice is made out of a circular opening on a plate of a finite thickness. In this case, the contraction coefficient
should be a function of diameter of the OWC
D, the diameter of the circular opening
, the thickness of the plate
, kinematic velocity
, and wave period
T, which is the cross-seasonal average of the height of an air–water interface displacement
, which is the magnitude of
and the gravitational acceleration
g because of the presence of the air–water interface. A dimensional analysis can show that
should depend on the following dimensionless parameters
where
is a frequency parameter [
8] and
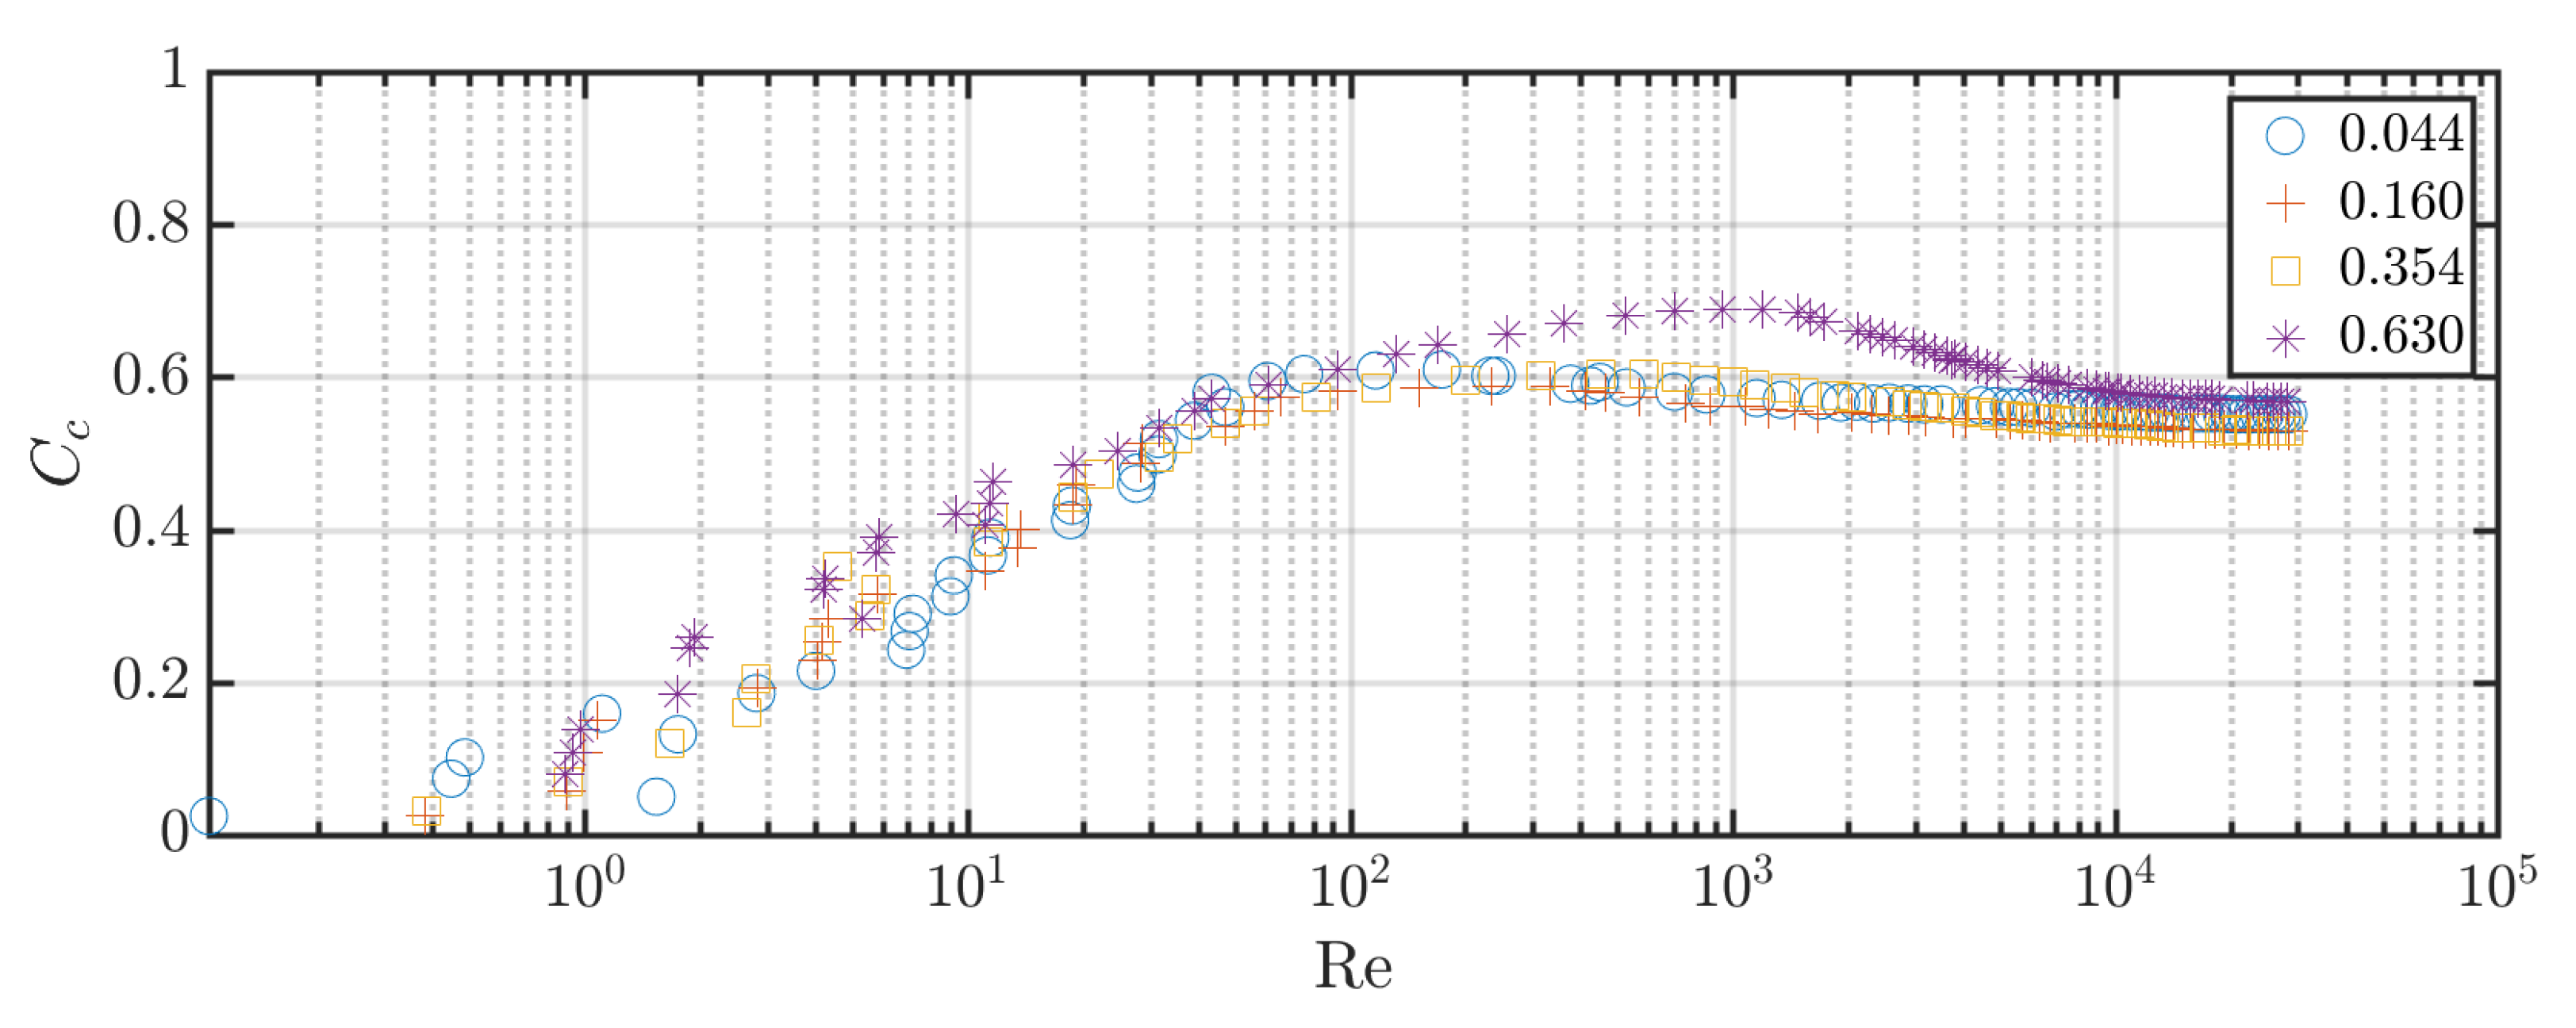
is the opening ratio of the orifice. According to Fossa and Guglielmini [
32], an orifice with
can be regarded as a sharp-edged orifice, and thus
should be independent of
. Since
is the cross-sectional average of the up-and-down motion of the water surface,
is the orifice Reynolds number
. Johansen [
17]’s data suggest that
should be independent of the orifice Reynolds number when
(see
Appendix B). For most orifices in OWC applications,
is satisfied. For incompressible air,
physically represents the maximum excursion distance of air particles flowing through the orifice. According to Mei et al. [
31], flow separation will occur when
In the present problem and is not less than , resulting in an value of much larger than , i.e., the dynamics of the flow are similar to the dynamics of a steady flow, and thus the frequency parameter should not be important. In summary, for an orifice used as a power take-off simulator of an OWC device, should be a function of the opening ratio alone if it can be determined properly in the experiment.
Several expressions for
exist in the literature for steady flows. The following expression for sharp-edged orifices was proposed by Fossa and Guglielmini [
32] for steady flows through a pipe orifice,
He and Huang [
13] confirmed the validity of Equation (
5) for its applications in OWC studies.
Both the method for fabricating an orifice and the method used to determine
may introduce systematic errors or bias in the determined values of
(or
). This is unfortunately unavoidable for circular OWCs where the surface elevation inside the OWC can only be measured using a limited number of wave gauges and a wave separation analysis as conducted by He and Huang [
13] is not possible.
In order to determine
using Equation (
1), both the air pressure inside the chamber
and the cross-sectional average surface velocity
need to be calculated.
In the present study, the measurement of
was achieved by measuring the up-and-down motion of the water surface
at a single point
inside the OWC chamber. The cross-sectional average surface velocity
is then approximated by
. This approximation may introduce a systematic error in the determined value of
and thus the determined value of
based on Equation (
2).
From the measured
, a model function is fitted using the nlinfit tool in Matlab. The Matlab nlinfit function is a nonlinear least squares regression tool. Using this method, a model function is expressed as the summation of sinusoidal curves up to the 5th harmonic frequency:
where
and
are the amplitude of the corresponding harmonic and
is the wave frequency. The result of the nonlinear least squares regression is a set of harmonic amplitudes and a zero shift based on the mean drift of the signal. As the modeled function is the summation of basic sinusoidal functions using the harmonic amplitudes, the derivative of Equation (
6) is easily found to calculate
:
Applying the same Matlab nlinfit function to Equation (
1) and the resultant surface velocity found from Equation (
7), we can determine the
for each wave condition. The average value for each orifice is used to calculate a
using Equation (
2). Using the nlinfit function, the calculated values of
from Equation (
2) are used as inputs in Equation (
5) to determine a fitting parameter
. In Equation (
5),
is 0.639. A new fitting parameter is used to calculate new values of
, which is then used to calculate new values of
.
2.5. Power Analysis
In order to characterize the performance of the geometry for a given orifice, we evaluate the average power extracted by the OWC per wave period:
where
is the reference time and
A is the cross-sectional area of the OWC chamber.
In order to calculate the power extracted via Equation (
8),
is used to fit a mean surface velocity. It is known that using single-point measurement to evaluate the mean surface velocity inside an OWC chamber can induce a relative bias [
13]. This relative bias may be remedied by comparing the results of the single-point method to that of power estimation calculated solely from using internal OWC chamber pressure. Using Equations (
1) and (
8), the power extracted can be expressed a function of the measured pressure alone:
where Equation (
1) is rewritten such that
is a function of
and
[
16]. Inversely, the same expression of
can be rewritten to be expressed as a function of surface velocity:
In the literature, the power extracted is quantified via what is known as the capture length. The capture length,
, is defined as the ratio of the power extraction by an OWC to the incident wave power per unit wave crest:
where
is the incident wave power per meter wave crest.
is characterized as the following:
where
is the wave energy density per unit area of incident waves and
is the wave group velocity.
To compare the resultant power estimations, we can apply Equations (
8) and (
9) to calculate a dimensionless extraction efficiency parameter,
. The extraction efficiency is the ratio of the period-averaged extracted pneumatic energy of the oscillating water column and the incident wave energy normalized for the width of the OWC chamber. This is expressed as follows:
2.6. Coefficient of Pressure and Coefficient of Amplification
The peak values of
and
can be quantified as dimensionless coefficients, which are useful as indicators for understanding the behavior of the OWC moonpool and thus driving mechanisms for power performance. We can express each peak value as a normalized parameter, where each coefficient is normalized via
H. We first look at the amplification of the internal water surface of the OWC chamber, which the previous literature has normalized relative to the incident wave height [
13]. We express this relationship as the coefficient of amplification,
:
where
represents the difference between the minimum and maximum values of
.
is a useful metric to understand the behavior of the OWC chamber moonpool, as it demonstrates the relative change in volume of air inside the OWC chamber. If
is more than one for specific wave frequencies, it implies that the wetted geometry induces a relative amplification of the incident wave height inside the OWC chamber. Assuming that the internal water surface oscillation frequency is locked to the wave frequency, an increase in the overall range of oscillation would imply an increase in pneumatic power via Equation (
8). If this occurs at a specific set of wave frequencies, this could be used as an indicator of moonpool resonant frequencies.
In calculating
, the period-averaged range is used instead of individual peak amplitudes to reduce the influence of higher-order effects on the value. Although care was taken to ensure sloshing was not a dominant mode within the chamber, higher-order effects do not always induce large spatial variability in the internal amplification relative to wave height [
16]. It is important to note that
in its current presentation is a phase-invariant indicator. As such, it may not reliably reflect the peak extraction efficiency, as the moonpool pool response could be out of phase with the incident wave. This can be a result of the phase response of the air pressure fluctuation.
The pressure fluctuation inside the OWC chamber induces a radiated wave, such that the interaction with the incident wave may result in amplification without proportional pressure accumulation.
As the OWC chamber surface amplification is not the only contributing variable to power performance, it is important to assess the pressure drop across the orifice, which the previous literature normalizes relative to the hydrostatic pressure of the incident wave [
13]. We express this as a dimensionless coefficient of pressure,
.
where
represents the difference between the minimum and maximum values of pressure in the OWC chamber. One benefit of
is that it can mitigate the potential influence of higher-order effects in the internal water surface. Just as
is an important indicator of the natural frequency of the moonpool surface,
is a useful metric in evaluating how the incident wave translates to resonance in the induced pressure fluctuation. By observing how
changes via frequency and induced damping through changes in
, we can develop a relationship describing the damped natural frequency of OWC power output.
2.7. Dimensional Analysis of Extraction Efficiency, Coefficient of Pressure, and Coefficient of Amplification
Using the capture length, OWC chamber pressure range, and OWC chamber surface displacement range as the characteristic parameters to assess the performance of the geometry, we can express
,
, and
as a function of the geometric characteristic lengths and the test conditions. Thus, the parameters are expressed in the following function:
where
is the density of air,
is the density of water,
is the dynamic viscosity of water,
is the dynamic viscosity of air,
g is the acceleration due to gravity,
is the angle of incidence of the waves,
D is the diameter of the tube,
is the diameter of the orifice,
is the thickness of the wall,
h is the water depth, and
is all other dimensions defining the shape of the WEC, which includes the length and thickness of the wings, the dimensions of the ring, the dimensions of the bottom plate, and the dimensions of the openings between the tube and the bottom plate.
To perform a dimensional analysis, we chose
D,
, and
g as independent variables. A dimensionless relationship can be found using the Buckingham
theorem. Although the geometric parameters impact the capture length, since they are fixed in this experiment, we can exclude them from the following dimensionless relationship to simplify it as
Applying the terms
and
to
,
, and
, the expression can be rewritten as
In Equation (
18),
squared is the opening ratio of the orifice
,
is a parameter related to the classification of the orifice, and
is a parameter related to the Keulegan–Carpenter number
for the tube [
31], which controls the vortex shedding from the tube;
is a dimensionless water depth,
is a parameter related to the ratio of the wave length to the chamber width
,
is the density ratio, and
is the rest of the dimensions of the WEC normalized by the diameter of the tube.
In our experiments,
so that the orifices can be regarded as sharp-edged orifices.
and
, thus
so that vortex shedding is mainly from the edges of the thin wall, and thus, the effects of the vortex shedding are localized and the effects of vortex shedding on the capture efficiency, pressure range, and surface amplification are minor [
16]. Therefore, the most important dimensionless parameters for this problem are:
,
,
, and
so that the dimensionless parameters can be formally written as
which can be rewritten in terms of
,
, and
As
,
, and
do not change significantly under room temperature, we assume a minimal impact in conducting our analysis. Since wavelength
L is dependent on the wave period, we can use the given water depth to express the term
as
. We can further express the ratio of the orifice diameter to OWC chamber diameter as the opening ratio,
.
All the results are presented using the dimensionless parameters identified in Equation (
21) in this study.
2.8. Relationships among , , and
As expressed previously,
,
, and
are dependent on the same parameters. As such, it is expected that a relationship between the three indicators can be expressed. This is particularly useful when seeking to predict the peak values of
. In order to express this relationship analytically, we can make some assumptions to solve for
in both Equations (
9) and (
10). We first assume that for a regular incident wave, the resultant surface velocity follows a cosine function in order to integrate over a wave cycle.
where
H is the incident wave height and
. This allows us to express Equation (
10) as a function of
.
For given
,
is a function of
. Therefore, we have
where
is a function of
,
and
given by
with
Note that
can be written as
. A full derivation of Equation (
24) can be found in
Appendix A.
Similarly for pressure, we assume the resultant pressure signal can be expressed as the following cosine function:
Using Equation (
26) in Equation (
9) to express the efficiency in terms of
gives
where
is a function of
,
, and
given by
with
being given by Equation (
25). A full derivation of Equation (
28) can be found in
Appendix A.
4. Discussion
After removing effects of spatial nonuniformity, Xu and Huang [
16] found that
should be nearly independent of wave conditions. Both He and Huang [
13] and the values predicted by the well-accepted empirical formula, Equation (
5), suggest that
should be not sensitive to the changes in opening ratio
when
< 2%. However, the values of
in our tests are only slightly affected by wave conditions and are larger than the the values given in Xu and Huang [
16]. The difference increases as the opening ratio is reduced from 2% to 0.5%. The results of the present study show that the averaged value of
in this study is about 0.75, which is about 7% larger than that given in Xu and Huang [
16] and about 8.5% larger than that in He and Huang [
13].
In assessing the difference in our values, we look to a number of factors that could contribute to an overestimation. For example, the effects of the air compressibility could contribute to an overestimated
value. The previous literature suggests to compare the mass flow rate through the orifice with the mass flow rate of the water surface,
[
30]. As our values of
, air compressibility is not of concern.
A primary difference between the results of the present study and those of Xu and Huang [
16] and He and Huang [
13] is that the deviation of data points is larger in the present study. One main reason that the values found in He and Huang [
13] are consistent is due to the ability of the previous study to minimize the effects of spatial variability. As the previous study investigated a rectangular cross-section OWC chamber, wave separation was possible to establish a more accurate mean water surface displacement in time. In Xu and Huang [
16], it was demonstrated through CFD simulation that the effects of spatial variability can contribute significantly to an overestimation of
. This is seen in the difference between the overestimated values of the experiment when compared with the simulation results for
.
A major difference between our model and the models studied by Xu et al. [
33], Xu and Huang [
16] and He and Huang [
13] is that we have the addition of four wings. When long-crested waves propagate between two of the wings, they will be reflected by the two wings, with some of the reflected waves also propagating toward the OWC chamber. Therefore, the waves received by the OWC chamber are the waves resulting from the complicated interaction between the incident waves and the reflected wave. As a result, the influence of the spatial nonuniformity in this study might be more significant than in Xu and Huang [
16], who found that the spatial nonuniformity of the surface velocity inside the OWC chamber can result in a noticeable bias in the value of
or
, obtained using velocity measured using one wave gauge. Our hypothesis is that the larger values of
found in this study are due to the enhanced spatial nonuniformity caused by the presence of the four wings. However, this hypothesis can only be proved by using CFD simulations, which can provide a detailed spatial distribution of the vertical velocity on the air–water interface inside the OWC chamber.
It is stressed here that since the measured pressure is not affected by spatial nonuniformity, using the values of
given in this study to calculate the wave power output using Equation (
9) tends to underestimate the wave power output. Therefore, the power output or extraction efficiency presented in this study is on the conservative side.
When evaluating the power performance of an OWC geometry, the aforementioned performance indicators are informative tools to assess the underlying physics of the device and in identifying the key design parameters. As the device tested is intended as an energy converter, it is often desired to design a system to be as efficient as possible. Although minimizing energy loss in the conversion process is crucial, it is also important to note that increased efficiency may not translate to a meaningful increase in power extracted. For example, we can compare the power extracted in
Figure 13 with the
found in
Figure 10. In this comparison, we can see that although the extraction efficiency is near double that of lower-frequency waves, the power extracted is near equivalent.
This highlights the importance of the appropriate application of performance indicators to identify key design parameters and conduct design choices. In the case of blue economy application devices, the power objective may not require optimal efficiency but rather a sufficient target power requirement. Let us look at the two trends observed in
Figure 11. In the case of the smallest PTO damping tested, significant frequency-dependent extraction efficiency can be achieved. This could be beneficial in applications where the incident wave frequencies are narrow-banded or where specific wave frequencies are more common year round.
We can compare this performance with the more damped cases, where peak energy extraction becomes mildly dependent on frequency within the observed band. In this implementation, the OWC geometry would operate at a lower but would be capable of extracting energy from a broader band of wave conditions. This is beneficial in areas that may have seasonal variability, making it desirable to have a range of extraction frequencies for more consistent power production capabilities. In each case, and function as practical indicators to understand the behavior of the moonpool of the OWC chamber and thus make inferences on how the OWC geometry extracts power.
In the case of amplification,
has been shown to disagree with the trend and peak of
. This is not to imply that
is irrelevant to energy extraction. The previous literature discusses the implication of
on energy extraction and asserts that it is a useful indicator of incident wave energy flux [
13]. When comparing the trend of
with the incident wave power
, one might infer that similarity exists for the smallest value
.
This views
outside of an analytical framework that directly relates to
, which may lead developers to incomplete conclusions. The
and
can be used to calculate an extraction efficiency via the analytical framework presented in
Appendix A.
Figure 11 presents how the calculated values of
compare with the measured values for each orifice relative to changes in wave frequency. It can be seen that there is fair agreement in both trend and peak values of
for both methods, with the largest disagreement occurring at the shortest period waves. It is worth noting that there is better agreement for longer wave periods and larger disagreement for shorter period waves. This may be due to seiching occurring in the OWC chamber induced from vortex shedding at higher-frequency waves [
16]. A result of employing a fitted
is that we have better agreement for the conditions closest to the fitted value. This happens to coincide with longer-period wave conditions.
outside of an analytical framework may not always reflect extraction efficiency, yet the indicator is still a useful tool in general OWC design when considering loading. The previous literature describes a number of different uses for OWC systems, such as coastal protection in the form of breakwaters [
16]. As slamming events on the OWC lid could be detrimental to fixed coastal structures, it is desirable to design the freeboard of an OWC to avoid these events in extreme conditions. As demonstrated in the previous literature, cross-chamber seiching does not induce significant spatial variability, such that
can be used as a safety factor for the appropriate freeboard height of the PTO in order to survive expected extreme events [
16]. The minimum freeboard height can be used to set a minimum boundary when optimizing the freeboard height of the OWC. An optimization of the freeboard height could be conducted where the algorithm balances the probability of slamming events with reductions in performance due to the effects of compressibility.
Likewise to
,
can function as a useful tool in OWC design, functioning as an indicator of peak extraction efficiency and as a safety factor when considering design loading. Aside from its application in predicting efficiency,
can broadly be used as a predictor of cyclical fatigue on the structure, as it relates the hydrostatic pressure of an incident wave to a lifting force. This is useful when designing the foundation of the structure for cyclical fatigue loading under operational conditions. It can be seen that the peak wavelength values for
and
align well across all values of
, implying that it could function as a peak extraction frequency indicator as well. If we consider that
can be calculated based on pressure without surface elevation, it would stand to reason that
would function well as an indicator of energy extracted. Furthermore, when viewing
under an analytical framework, we can see from
Figure 11 that there is good agreement in predicting the
frequency dependence. The use of
broadly overestimates the efficiency but within the bounds of uncertainty, indicating that it functions well.
It can be seen that for both methods of calculating via and that there is good agreement. The largest observed agreement occurs once the wave conditions become higher in frequency but within expected uncertainty. This implies that under the assumed regular wave conditions, that the analytical framework functions well to predict each of the performance indicators. If an OWC developer has a system whose performance reflects this behavior, a single measurement can be used to estimate the expected value of the other two performance indicators. This is extremely useful in the context of analyzing performance when space limitations impede the ability of affixing multiple sensors. As is less sensitive to the influences of higher-order effects inside the OWC chamber, it is recommended that pressure be used as required in a single measurement case.
Although it might be the desire of developers to design based solely on efficiency, this may not translate to a functional ocean observing OWC system, as it will not produce the desired power capture. As previously mentioned, the total difference in extracted power between the 0.7% and 2.0% opening ratios is relatively small. The focus in this case should be on designing PTO damping to match energy requirements from prevalent wave conditions. We can view this relative to a scaled application. As previously mentioned, comparing the performance of pneumatic PTOs is nontrivial and must be applied to assuming specific scaling similarity. The previous literature has establish that when
, it can be assumed that a Froude power-scaling law can be applied. A comparison of the orifice used relative to the previous literature can be found in
Appendix B. It can be shown that the flow conditions meet the requirements expressed in the previous literature and thus Froude scaling can be applied for power and incident wave conditions. Assuming that the model is a 1:10 scale model, Froude scaling the period and energy extracted to full scale would yield a range of periods, from 3.9 to 9.4 s, with a power output on the order of kilowatts.
If we were to design the PTO to function at its highest efficiency, this would mean targeting wave periods that are consistent with short-period wind waves in a narrow band of higher wave frequencies. These conditions may not align with the objectives of the deployed application and may result in poor power performance overall. If the design of the PTO is instead based on the prevalent conditions and power requirements, a developer might elect to apply larger PTO damping. This would result in a wider range of capture frequencies, which could be beneficial when trying to capture short-period waves. When targeting these conditions, the OWC could yield over 5 kW of power in mild seas (0.8 m wave height, 6.3 s period). Based on the output requirements outlined in the U.S. Department of Energy’s Powering the Blue Economy report, this would be more than sufficient to provide power to a range of ocean observing activities [
1].
In the case of the largest PTO damping, the OWC would extract optimally from 6 to 9 s when fully scaled. This implies that the device would be well-suited to target regionally generated wind waves, such as the waves generated by trade winds around the island of Oahu. These wave conditions are fairly common across the global oceans, and as such, the potential of the design as an at-sea power generation platform should not be ignored.
The results from a fixed device can provide insight to how the geometry interacts with the entrained water column, independent of floating body fluid interaction. The fundamental principle of how oscillating water-column-type wave energy converters function is defined as the relative motion between the WEC body and the entrained mass of water inside the OWC chamber. Given the interest in at-sea power, understanding the fundamental principles of how this geometry behaves as a free-floating system is of great interest and should be investigated further. With both fixed and floating configurations thoroughly investigated, the total underlying physics of the device can be described.
As the tests presented are confined to regular wave conditions, a comprehensive characterization of the geometry’s power performance is not yet complete. Site-specific conditions should be tested to characterize performance in irregular conditions and compare performance in irregular conditions to that of the characterized regular wave tests. Additional tests for irregular wave tests, as well as a floating configuration, have been completed. The results are forthcoming.


