Article

Experimental and DEM Simulation Study on the Mechanical Characteristic and Strain Energy Evolution of Longmaxi Shale under a Confining Pressure Unloading Path

1
State Key Laboratory of Intelligent Construction and Healthy Operation and Maintenance of Deep Underground Engineering, China University of Mining and Technology, Xuzhou 221116, China
2
School of Mechanics and Civil Engineering, China University of Mining and Technology, Xuzhou 221116, China
*
Author to whom correspondence should be addressed.
Energies 2023, 16(16), 5960; https://doi.org/10.3390/en16165960
Submission received: 7 July 2023 / Revised: 4 August 2023 / Accepted: 5 August 2023 / Published: 12 August 2023
(This article belongs to the Section H: Geo-Energy)

Abstract

:
Drilling vertical and horizontal wellbores in the shale reservoir may trigger the in-situ stress release around the wellbore walls and change the original stress equilibrium state, leading the wellbores to instability. This stress change in the wellbore corresponds to the stress paths of confining pressure unloading and axial stress loading under laboratory conditions. In this paper, according to the conventional triaxial compression test results, laboratory experiments and DEM simulations by PFC2D were conducted to deeply study the strength, failure, strain energy evolution, and micro-crack damage mechanism of shale specimens under confining pressure unloading conditions. The shale specimens at different bedding inclinations were tested under different initial axial stress levels and confining pressure unloading rates, with fixed initial unloading confining pressure. This research revealed that confining pressure unloading induces greater plastic deformation, more micro-crack damage and strain energy dissipation, and a more complex failure pattern. The strain energy dissipation and dilatation under confining pressure unloading conditions are mainly induced by the generation and accumulation of tensile cracks. Moreover, the unloading rate has a significant effect on the mechanical properties, and the high unloading rate enhances the failure strength and induces more strain energy dissipation and micro tensile cracks. For the wellbore drilling in shale formations, when the buried depth and vertical stress are fixed, the lower the lateral stress is, the easier it is to form tensile failure around the wellbore wall in the drilling process, and the more induced fractures will be generated in the formation around the wellbore.

1. Introduction

Shale gas, as a new energy source rising around the world, has become a key research topic in the last decade. To obtain more gas out of the shale reservoir, one of the key techniques is conducting hydraulic fracturing to achieve a wide range of fracture networks by drilling vertical and horizontal wellbores into the shale reservoir. Drilling shale gas wellbores in shale formations has been a technology bottleneck for developing shale gas in a safe and efficient way [1,2]. Previous studies have shown that shale gas rocks have strong brittleness [3,4,5,6,7,8]; that is, failure occurs with small or no plastic flow. The strong brittleness and anisotropic mechanical behavior of shale rock create shale formations as multiple strata leading to wall caving and collapse, especially the hard, brittle shale strata in long horizontal wellbore sections.
At present, shale gas exploitation has entered the deep underground, more than 3500 m, and has to face high in-situ stress conditions. In the process of wellbore drilling under high in situ stress, it is easy to induce stress unloading cracks in brittle shale rock due to drilling stress disturbance and unloading, which causes the destruction of the shale rock structure around the wellbore [9,10]. After the formation is drilled, the drilling fluid replaces the original rock to support the wellbore wall, which will lead to a decrease in the principal stress around it, and the unloading occurs [11,12]. As shown in Figure 1, the unloading state around the wellbore leads to damage and cracks in the wellbore wall, which can interact with the hydraulic fractures and affect the safety and stability of the wellbore. In addition, in the process of tunnel excavation, the rock mass is under a state of confined pressure unloading, and the mechanical properties of a rock mass under unloading conditions are different from those under conventional loading conditions. Therefore, the conventional triaxial test cannot completely describe the unloading mechanical characteristics of underground rock, and the mechanical and deformation characteristics of rock obtained from unloading tests are more consistent with the real situation of shale rock around the wellbore [13,14].
As a strong anisotropic and brittle rock material, the mechanical properties of shale rock under different loading conditions have been widely studied by many researchers [5,7,8,15,16,17,18,19,20,21,22,23]. These investigations revealed the distinct anisotropic mechanical behaviors of shale specimens under compression conditions and indicated that the deformation and failure characteristics of shale rock are significantly affected by weak bedding planes. Moreover, the brittleness of shale rock plays an important role in shale reservoir evaluation and contributes to the generation and expansion of hydraulic fractures. For the wellbore instability induced by stress release (unloading) in a shale reservoir, Guo et al. [24] studied the effect of the bedding angle and mineral composition on mechanical properties and the fracture behavior of phyllite under unloading confining pressures, and the results show that the bedding angle has the greatest influence on the failure mode of phyllite, followed by the mineral composition and finally the mechanical environment.
The mechanical behaviors, including failure surface, strain-stress curve, triaxial compressive strength, and triaxial shear strength of rock specimen under unloading conditions, are more likely different from that obtained by the conventional triaxial conditions, and the triaxial compressive strength, angle of internal friction, and angle of shearing resistance obtained from the unloading tests are greater [25]. The other research observed that the unloading path induces distinct strength reduction compared with conventional triaxial compression [26]. In addition, for the fractured rock under confining pressure unloading conditions, crack propagation shows intermittent behavior, and the failure mode is determined by the inclination angle of the original crack [27]. In particular, crack coalescence happens earlier and has more high-energy AE events in the failure process and more significant brittle failure characteristics [28]. The unloading parameters, including initial confining pressure and unloading rate, are the key points that affect the unloading failure behavior. In addition, the mechanical properties, energy conversion characteristics, and damage evolution under unloading conditions are affected by these unloading parameters [29,30,31,32,33]. This research reveals that brittle rocks are easily damaged under unloading conditions, specimens are more easily destroyed under higher unloading rates, and the mechanical properties and energy conversion characteristics are highly affected by the initial confining pressure.
The essence of rock failure Is an unstable state driven by energy [34]. It is more consistent with the essence of rock failure to study the deformation and failure behavior of rock from the perspective of energy. It is also important and effective to study the failure process of rock from the perspective of strain energy evolution. Huang and Li [29] conducted triaxial unloading tests on marble under different initial confining pressures and unloading rates, and the results show that the strain energy conversion is different between the conventional triaxial unloading and compression tests. Zhang et al. [35] also analyzed the energy dissipation of marble under different confining pressure unloading rates, and the results indicate that the unloading process increases dissipated energy, and the geo-stress state of the engineering rock mass determines the level of energy released in failure. Zhao et al. [36] investigated the strain energy conversion of granitic rock specimens under different unloading paths, and the results revealed that the effect of the initial confining pressure on the conversion rate of strain energy is related to the unloading paths. Li et al. [37] investigated the energy evolution characteristics of granite specimens in the triaxial deformation and failure processes under different loading and unloading paths. Yang et al. [38] explored the energy evolution during the processing of sandstone specimens under different loading and unloading paths, and the results show that the higher the initial unloading confining pressure, the more the energy released when the sandstone specimen fails, resulting in more severe damage. This research indicates that confining pressure unloading likely induces distinct strain energy conversion and release, highly affected by the unloading pressure level and rate.
To further study the unloading failure behavior at the mesoscopic level, numerical simulations under unloading conditions were conducted. Discrete element simulations with particle flow code (PFC) were employed [9,39] to investigate the unloading-induced failure characteristics of brittle rock, including the deformation, failure pattern, and strain energy evolution. In addition, the influence mechanism of the unloading rate of the confining pressure, initial unloading stress, and confining pressure on the failure characteristics and crack propagation were further studied, and the results indicate that the micro-cracks formed in the unloading process of confining pressure are dominated by tension cracks, accompanied by shear cracks [40,41,42].
From the above literature review, it can be concluded that more studies need to be conducted on the wellbore stability in shale reservoirs under unloading conditions. As (1) conventional triaxial tests cannot fully reflect the mechanical behavior of rock under unloading conditions, and (2) Ie conventional triaxial strength analysis cannot accurately evaluate the rock failure conditions under unloading conditions nor fully reflect the nature of rock failure. In this research, according to the conventional triaxial compression test results, confining pressure unloading tests on shale under different bedding inclinations were conducted. The deformation and failure characteristics under the unloading conditions were obtained. Based on the laboratory test, the discrete element numerical model of shale was established, and the unloading simulation test was conducted to reveal the failure mechanism under the unloading conditions from the perspectives of mesoscale crack evolution and energy evolution and dissipation. The research results can provide scientific and reasonable theoretical support for wellbore drilling engineering in shale reservoirs so as to effectively solve the problem of wellbore instability and ensure the safe, economical, and efficient development of shale gas.

2. Experimental Methodology and Procedures

2.1. Specimen Preparation and Description

As shown in Figure 2, the shale specimens tested in this research were sampled from the Changning area at the southern edge of the Sichuan Basin, China, and the shale specimens belonged to the Paleozoic lower Silurian Longmaxi formation of the middle and upper Yangtze regions. The shale blocks sampled from the outcrop were processed into cylindrical specimens with a diameter of 50 mm and a height of 100 mm under different bedding inclinations. The bedding inclination β in this research is defined as the angle between the bedding plane and the end face of the cylindrical specimen. An X-ray diffraction (XRD) test was conducted before the compression test, and the result shows that the mineral composition and proportion of the shale specimens were mainly quartz (36.3%), calcite (27.6%), Fe-muscovite (18.7%), and clay (14.1%), and other minerals such as plagioclase (1.6%), potash feldspar (0.4%), and pyrite (1.4%) were present in very small amounts [8]. According to the XRD test results, the content of brittle minerals (quartz, calcite, muscovite, and feldspar) in the specimens was high, which indicates that the shale specimen could show strong brittleness under the compression test. To investigate the mechanical response of the shale specimens comprehensively, laboratory compression tests under different loading paths were conducted. The conventional triaxial compression test [8] shows distinct anisotropy and strong brittleness for the shale specimens.

2.2. Experimental Program

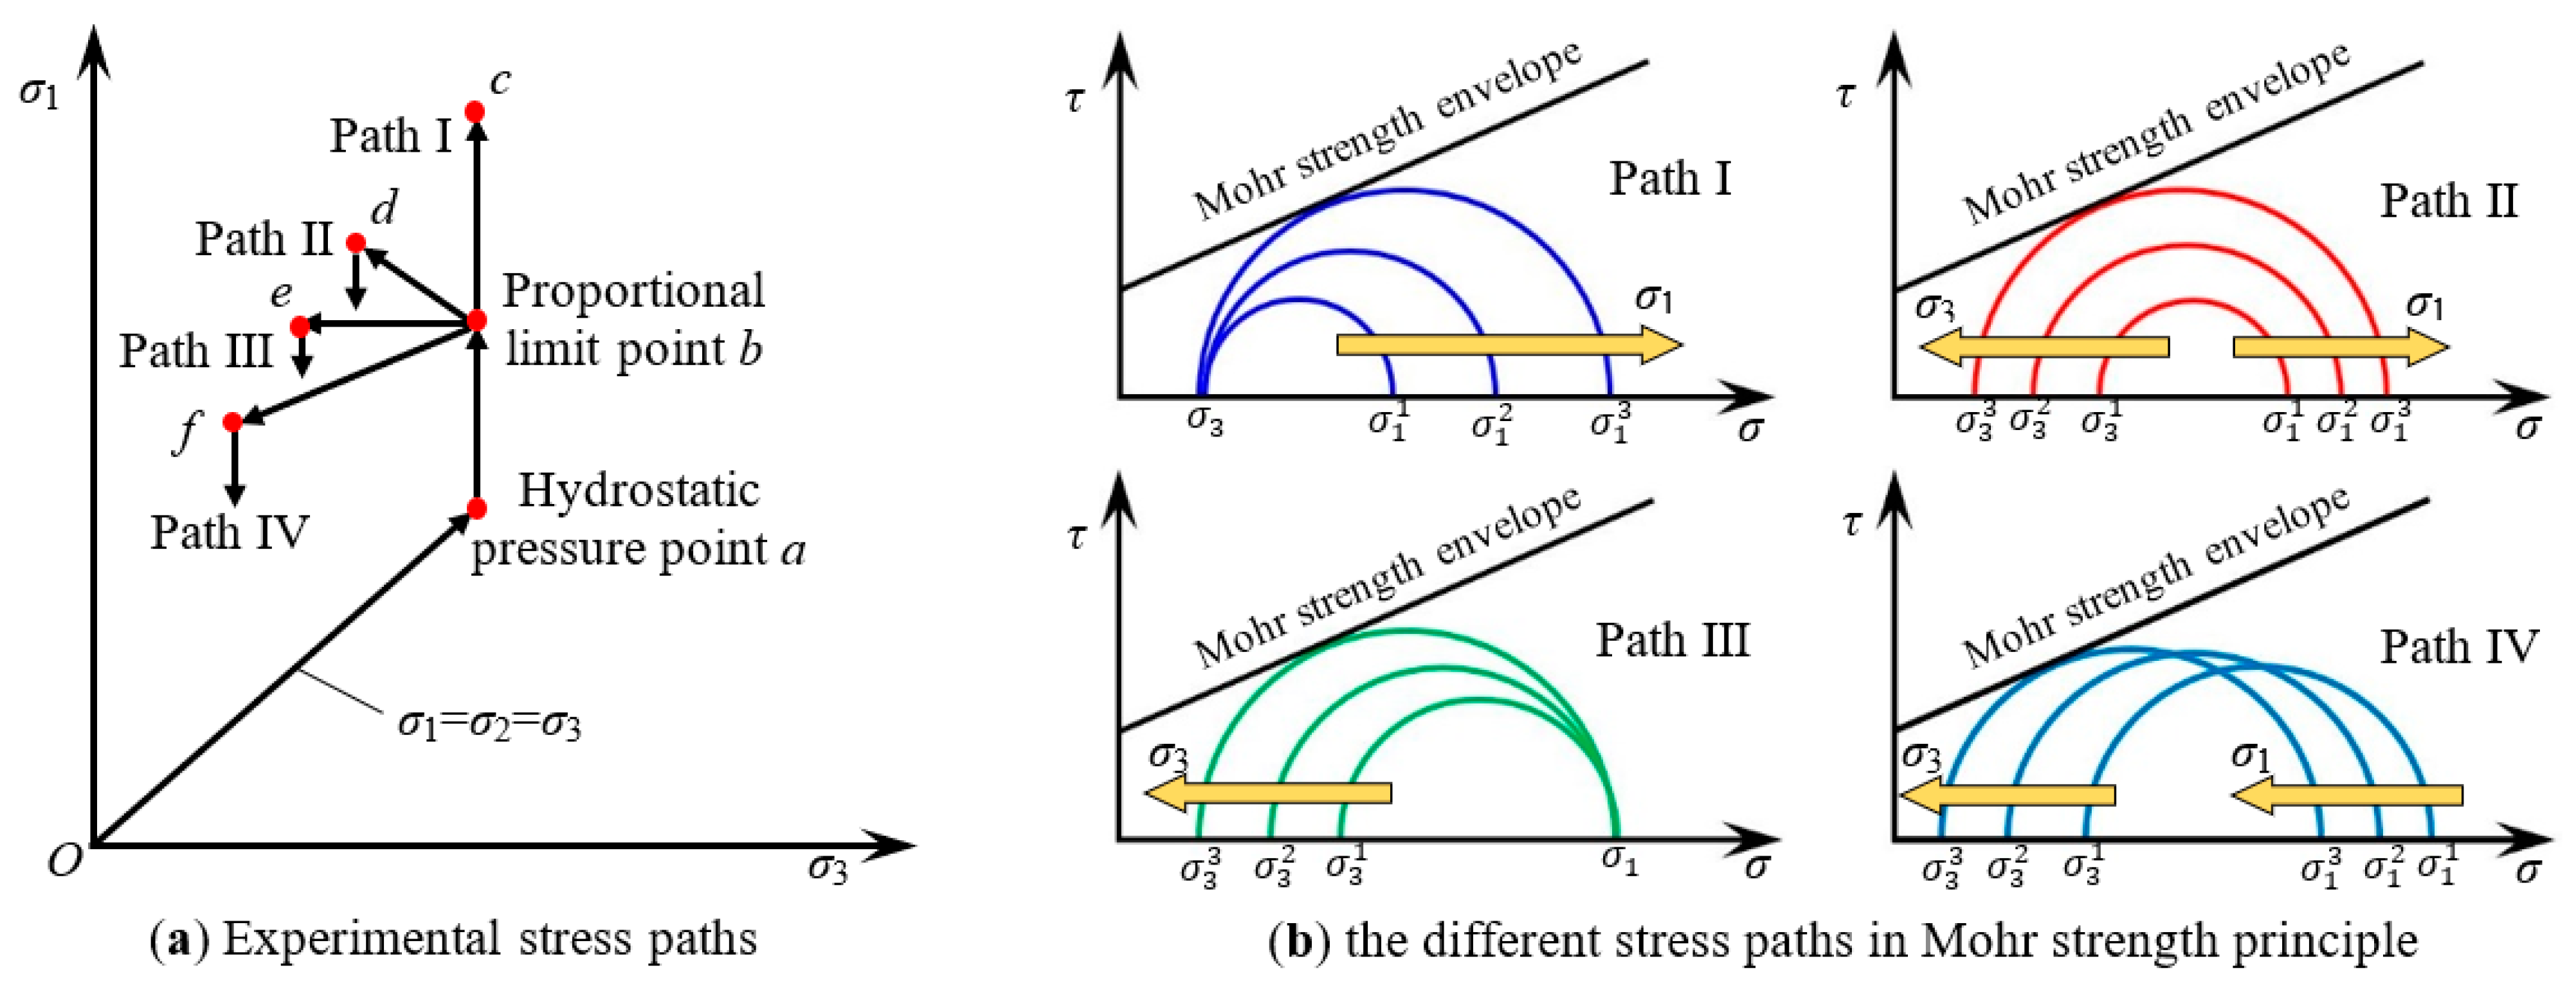
Generally speaking, different unloading test schemes can be selected according to different research objectives. The stress unloading paths commonly used in laboratory tests of rock mechanics can be divided into three categories: unloading confining pressure with constant axial pressure, unloading confining pressure with increasing axial pressure, and unloading confining pressure with decreasing axial pressure. These stress paths are depicted and shown in Figure 3. Figure 3a shows how the stress is loaded or unloaded in experimental implementation, and Figure 3b depicts the failure process of the Mohr strength principle under different loading paths. According to Figure 3a, the four loading paths can be illustrated following:
(1) path I: conventional triaxial compression loading (o~a~b~c). This loading path is used the most in laboratory tests. To perform this loading path, the confining pressure, σ3, increases from point o to point a (hydrostatic pressure) first; then, keeping the confining pressure constant, the maximum principal stress increases from point a to point b (proportional limit point) and continues to increase to point c (failure point).
(2) path II: increasing axial stress and decreasing confining pressure (o~a~b~d). In this loading process, the confining pressure, σ3, is applied from point o to point a first; next, keeping the confining pressure constant, the maximum principal stress is applied and increased to the proportional limit point b. Then the confining pressure begins to be unloaded, and at the same time, the maximum principal stress continues to increase to point d (the specimen fails).
(3) path III: constant axial pressure and decreasing confining pressure (o~a~b~e). In this loading process, the confining pressure, σ3, is applied from point o to point a first; next, keeping the confining pressure constant, the maximum principal stress is applied and increased to the proportional limit point b. Then keeping the maximum principal stress constant and unloading the confining pressure, loading is finished up to point e (the specimen fails).
(4) path IV: increasing axial stress and decreasing confining pressure (o~a~b~f). In the first step, the confining pressure, σ3, is applied from point o to point a. Next, the confining pressure is kept constant; meanwhile, the maximum principal stress is applied and increased to the proportional limit point b. Then the confining pressure, σ3, and maximum principal stress, σ1, begin to be unloaded simultaneously (points b to f). During the unloading process of the confining pressure and maximum principal stress in this path, the unloading rate of the maximum principal stress ( V U σ 1 ) can be less than, greater than, or equal to that of the confining pressure ( V U σ 3 ). When V U σ 1 < V U σ 3 , the deviatoric stress increases gradually until the specimen fails; when V U σ 1 = V U σ 3 , the deviatoric stress remains constant; when V U σ 1 > V U σ 3 , failure may occur, depending on the stress level at the unloading point and the unloading rate difference between the maximum principal stress and the confining pressure.
In this research, the unloading program is aimed to simulate the stress adjustment process in which the tangential stress (σ1) increases and the radial stress (σ3) decreases during the unloading process of the surrounding rock of the horizontal well excavation in a shale gas reservoir. Therefore, the loading scheme of path II was adopted in this test. On the other hand, in the process of wellbore drilling, the drilling speed in the stratum can be different. From the view of rock mechanics, the difference in the drilling speed is manifested as the disturbance of the stress and the unloading rate of the stratum rock on the wellbore wall. The faster the drilling speed, the faster the stress is unloaded from the wall rock. Therefore, to realize the influence of drilling rate on the stress disturbance and stress unloading of borehole wall formation, the unloading rate effect on shale failure needed to be studied. The default confining pressure loading rate under conventional triaxial compression is 4 MPa/min. In the unloading confining pressure test, different unloading rates around the default value of the loading system were considered; in addition, an excessive unloading rate led to the rapid failure of the specimen. Thus, the maximum unloading rate in this experiment was set to 6 MPa/min.
Shale specimens under bedding inclinations of 0°, 60°, and 90° were tested in this research. The 0° and 90° shale specimens simulated the surrounding rock of the horizontal well and vertical well, respectively, and the 60° shale specimen was the comparison to these°. The initial unloading confining pressure was 20 MPa, and the axial stress was 85% of the conventional triaxial compression strength (TCS) when unloading started. The basic strength parameters of shale specimens with bedding inclinations of 0°, 60°, and 90° under conventional triaxial compression test are listed in Table 1. In addition, four unloading rates, 0.5 MPa/min, 2 MPa/min, 4 MPa/min, and 6 MPa/min, were considered in this test. The test procedure was as follows:
(1) Start the test system; put the shale specimen into the triaxial pressure chamber and set up the axial and circumferential displacement sensors. Close the triaxial pressure chamber and fill it with hydraulic oil.
(2) Apply the confining pressure of 20 MPa; the loading rate of confining pressure was 8 MPa/min.
(3) Apply the axial deviatoric stress. The displacement loading mode is employed, and the loading rate is 0.05 mm/min.
(4) When the axial deviatoric stress is loaded to 85% of the peak stress of conventional triaxial compression, the confining pressure starts to unload. The unload rates are 0.5 MPa/min, 2 MPa/min, 4 MPa/min, and 6 MPa/min; meanwhile, the axial deviational stress continues to load at the original rate.
(5) When the specimen fails and reaches the residual strength or completely loses the bearing capacity, loading stops, and the experiment is finished. Take out the specimen and save the data.

3. Experimental Results of Confining Pressure Unloading Tests on Shale

3.1. Analysis of Strength and Deformation Parameters

Table 2 lists the main parameters and results of the triaxial unloading confining pressure tests for three groups of shale specimens under different bedding inclinations. The confining pressure unloading rate VU, the axial deviatoric stress when unloading starts σU, the axial deviatoric stress σ1σ3, confining pressure when specimen fails σ3`, and maximum principal stress when specimen fails σ1, the confining pressure reduction ∆σ3, and confining pressure reduction rate during failure ∆σ3/σ3, are all listed in Table 2. From Table 2, it can be seen that the greater the confining pressure unloading rate VU is, the greater the confining pressure reduction ∆σ3 is, and the smaller the failure maximum principal stress σ1 is.
Figure 4 depicts the stress-strain curves of shale specimens under different bedding inclinations and confining pressure unloading rates. The initial unloading confining pressure is indicated in the curves; the solid and dashed curves represent the deviatoric stress, σ1σ3, and confining pressure, σ3, variation, respectively, with respect to the axial strain, ε1. It can be seen from Figure 4 that under the condition of the same bedding inclination, the stress-strain curves before unloading are similar since the specimens are under the same stress-loading conditions. When the confining pressure unloading starts, the four unloading rate curves begin to diverge. The plastic deformation becomes greater with the unloading of confining pressure and increases in axial stress. When the specimens fail, it can be found that the higher unloading leads to a lower failure strength. Corresponding to the variation in confining pressure (σ3), it can be seen that a lower failure strength corresponds to a lower failure confining pressure. It should be noted that in Figure 4b, a distinct stress drop occurs before the unloading starts in the specimen at an unloading rate of 6 MPa/min; it indicates that major damage has occurred in the specimen when unloading starts. Therefore, the specimen fails shortly after the confining pressure unloading, resulting in low strength and a high failure confining pressure compared to the specimens under other unloading rates.
On the other hand, by observing the variation curve of the confining pressure, σ3, in Figure 4, it can be found that the confining pressure decreases at the predetermined unloading rate after unloading begins; however, when the specimen fails, the confining pressure suddenly increases and keeps a slowly increasing trend after the peak. At this time, the test program still executed the command of releasing the confining pressure. This seemingly contradictory phenomenon indicates that dilatancy occurred when the specimen failed, and its volume increased greatly, and the trend of volume increase continued after the peak. The volume-increasing specimen acts as a “piston” in the triaxial chamber, which continuously compresses the hydraulic oil in the triaxial chamber, resulting in an increase in the oil pressure. In particular, the shale specimens in this experiment showed strong brittle characteristics, and the volume of the specimen abruptly increased to a larger value, leading to the rapid increase in oil pressure at the moment of failure. The increasing rate of oil pressure tends to be greater than the set decreasing rate of unloading confining pressure; therefore, the test system delayed lowering the confining pressure, which led to the increase of the confining pressure.
To further investigate the strength characteristic under confining pressure unloading conditions, the relationship between failure strength and failure confining pressure under conventional triaxial compression and confining pressure unloading tests is depicted in Figure 5. In Figure 5, the black dots and dashed line represent the failure strength and linear fitting line, respectively, under conventional triaxial compression. As can be seen from Figure 5, the failure strength points of the confining pressure unloading specimen are scattered near the envelope of triaxial compression strength, and there is no specific difference between the distribution of the triaxial compression strength points. In Figure 5a, the unloading confining pressure strength points of the specimens under bedding inclination 0° are all below the triaxial compression strength envelope, while the unloading confining pressure strength points of the specimens in Figure 5b, c appear on both sides of the triaxial compression strength envelope. The results in Figure 5 indicate that there is little difference between the strength characteristics of shale specimens under unloading confining pressure and those under conventional triaxial compression.
The secant modulus reflects the deformation capacity of the specimen to a certain extent. To better comprehend the deformation features of shale specimens under confining pressure unloading conditions, the secant modulus was investigated, and its variation with the confining pressure unloading is depicted in Figure 6. Herein, the secant modulus was the slope of the line between a point on the stress-strain curve and the origin. In the process of confining pressure unloading, as the confining pressure decreases, the deformation capacity of the specimen will be affected. Is shown in Figure 6, when the confining pressure decreases, the secant modulus of the specimen also decreases. Under the condition of reducing the same confining pressure, the secant modulus decreases more slowly with an increase in the unloading rate. This is because the time required to reduce the same confining pressure with the increased unloading rate is shorter, and the decrease of the secant modulus in a short time is relatively small.

3.2. Analysis of the Failure Mode

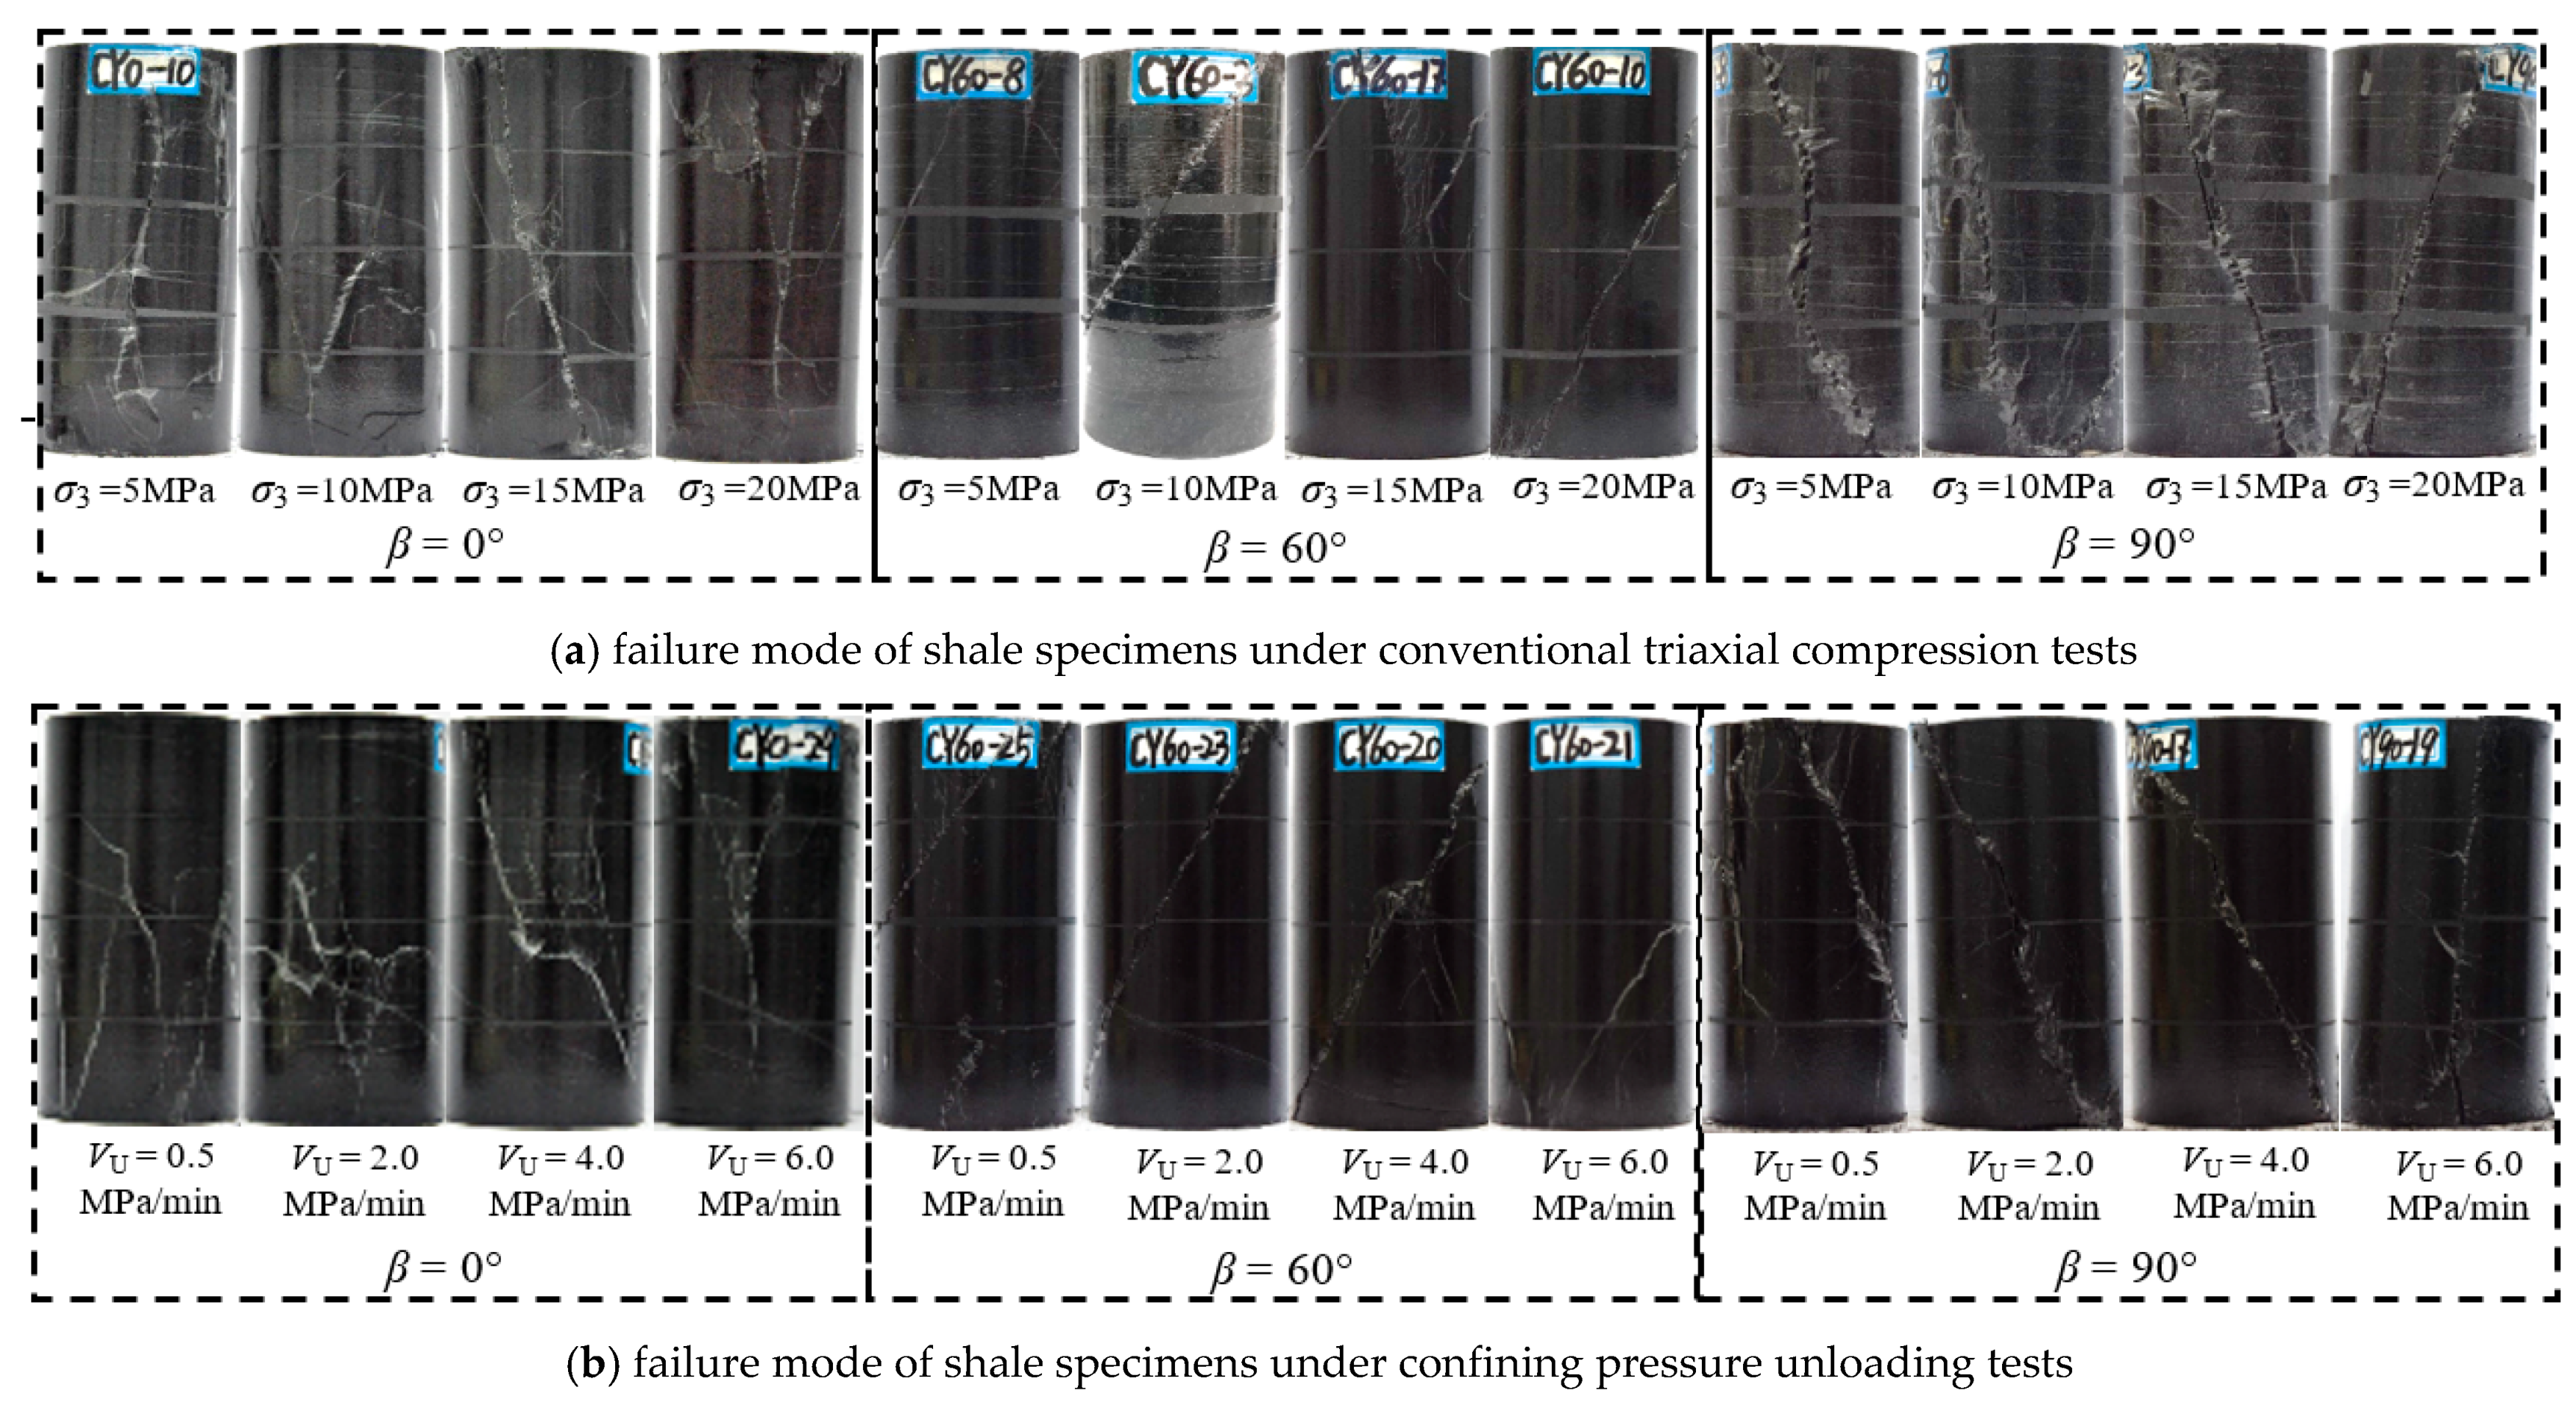
Figure 7 shows the failure mode of shale specimens at different bedding inclinations under conventional triaxial compression and confining pressure unloading tests. Figure 7a presents the failure mode of the shale specimen under the conventional triaxial compression test [8]. For the specimens under bedding inclinations of 0° and 90°, when the confining pressure increases, the shear fracture becomes more and more distinct. It can be seen that the fracture plane extends along the axial direction when at the low confining pressure of 5 MPa, and when the confining pressure increases to 20 MPa, a diagonal shear fracture occurs through the specimen. For the specimens under a bedding inclination of 60°, a shear fracture occurs along the bedding plane under every confining pressure from 5 to 20 MPa. Figure 7b shows the failure mode of a shale specimen under a confining pressure unloading test. It can be observed from Figure 7b that the failure mode of a shale specimen at a bedding inclination of 0° shows differences under the four unloading rates. At low unloading rates (0.5 MPa/min and 2 MPa/min), the failure confining pressure is high, and the specimens have more fractures. At high unloading rates (4 MPa/min and 6 MPa/min), the failure confining pressure is relatively low, and fewer fractures occur in the specimens. The images in the middle of Figure 7b shows the failure mode of a shale specimen at a bedding inclination of 60°. It can be seen that the 60° bedding inclination shale specimens all present a shear fracture along the bedding plane under four unloading rates, indicating that the bedding plane plays a dominant role in the failure of shale specimens at a bedding inclination of 60°, even if the confining pressure unloading rate is changing. The images in the right of Figure 7b shows the failure mode of a shale specimen at a bedding inclination of 90°. Under the unloading rate of 0.5 MPa/min, 2 MPa/min, and 4 MPa/min, the failure confining pressure of the specimens is high, and the specimens are in shear failure. For the specimen under a high unloading rate of 6 MPa/min, the failure confining pressure is lower than that under a low unloading rate, and the shear fracture plane is in a large inclination and almost parallel to the direction of the maximum principal stress.

4. DEM Simulation of Confining Pressure Unloading Tests on Shale

4.1. DEM Simulation Model and Procedure

To comprehensively analyze the effects of damage evolution, failure processes, and unloading rates on the mechanical properties of shale specimens under confining pressure unloading conditions, the DEM numerical model [43,44] of the shale specimen was established by Particle Flow Code 2D (PFC2D). The PFC model simulates the movement and interaction of many finite-sized particles. The particles are rigid bodies with finite mass that move independently of one another and can both translate and rotate. Particles interact at pair-wise contacts through an internal force and moment. Contact mechanics are embodied in particle-interaction laws that update the internal forces and moments. The time evolution of this system was computed via the DEM, which provides an explicit dynamic solution to Newton’s laws of motion [45]. Figure 8a shows the shale specimen at a bedding inclination of 60°, and the bedding planes can be observed on the surface. Figure 8b presents the established numerical model of a shale specimen in PFC2D. In the model, the parallel bond (PB) model and smooth joint (SJ) model were employed to establish the particle contact in the shale matrix and bedding plane, respectively. In the PFC model shown in Figure 8b, a parallel bond can be envisioned as a set of elastic springs with constant normal and shear stiffnesses, uniformly distributed over a cross-section lying on the contact plane and centered at the contact point, and the parallel bonds can transmit both force and moment between the pieces. As depicted in Figure 8c, the smooth-joint model simulates the behavior of a planar interface with dilation regardless of the local particle contact orientations along the interface. The behavior of a frictional or bonded joint can be modeled by assigning smooth-joint models to all contacts between particles that lie on opposite sides of the joint. By this DEM model of a shale specimen in PFC2D, the mesomechanical characteristics and damage evolution during the confining pressure unloading process can be analyzed and revealed in-depth.
The micro-parameter calibration of the shale model in PFC2D was according to the results of the conventional triaxial compression test in Yang’s research [8]. The “trial and error” method was applied to calibrate the micro-parameters. In the calibration process, the simulated results of every calibration test were compared with the experimental results and the ones that could mostly reflect the experimental results of the set of mesoscopic parameters, namely for the model specimen calibration parameters in the end. By using the “trial and error” method for micro parameters calibration, a group of micro parameters for the shale numerical model was determined, and the main micro parameters are listed in Table 2. To illustrate the good agreement of the calibration results with the experimental results, Figure 9 presents the calibrated failure mode of the shale model under conventional triaxial compression conditions by PFC2D. In the simulation results of Figure 9, the micro-crack band forms a macro-fracture. Compared to the experimental failure mode shown in Figure 7a, it can be seen that the macro-fractures in the specimens of 0°, 60°, and 90° are similar to the tensile and shear fractures in Figure 7a. The simulated failure modes of the shale specimens under different bedding inclinations and confining pressures show good agreement with the experimental results. The determined micro-parameters in Table 3 reflect the mechanical properties of the shale specimens in laboratory test results under different conditions.
After the micro-parameter calibration of the shale model, the confining pressure unloading simulation can be conducted. Table 4 lists the simulation scheme of the confining pressure unloading test. From Table 4, it can be seen that the simulation designs test the conditions more than the laboratory test. Compared with the laboratory test, the simulation model under six bedding inclinations, four initial unloading stresses, and two unloading rates was added to the test. On the other hand, once the PFC2D model had been established, the numerical specimen had almost no discreteness, and the computational efficiency was high compared to the experimental study; therefore, more variable factors of the mechanical properties under the confining pressure unloading condition can be studied.
In Table 4, the stress loading mode was adopted for confining pressure unloading. The displacement loading mode was employed for axial stress loading, and the loading rate was 0.05 m/s. The loading rate in PFC was completely different from those in the actual physical world. In PFC modeling, since the calculation logic in PFC is fundamentally based on the dynamic mode governed by Newton’s second law, the time step (Δt) in each calculation cycle was chosen to be an infinitely small value, especially for static analysis. For instance, the loading rate of 0.05 m/s used for the confining pressure unloading simulation in this paper could be translated to 2.1 × 10⁻⁶ mm/step, which implies it requires more than 200,000 steps to move a loading plate 1 mm. Hence, while physically, a 0.1 m/s loading rate is unreasonably high, this rate was slow enough in the PFC simulation [46]. To compare the two loading modes, the axial stress loading rate value should be converted to the stress loading mode. In the PFC simulation, the loading rate of 0.05 m/s could be translated to 2.1 × 10⁻⁶ mm/step. According to the result of the conventional triaxial compression test [8], the average elasticity modulus value of the shale specimen under confining pressure 20 MPa was 31.5 GPa; thus, the axial loading rate of 2.1 × 10⁻⁶ mm/step could be converted to 0.06615 MPa/100 steps (calculated by linear stress-strain relationship). Therefore, the ratios of the confining pressure unloading rate to the axial stress loading rate were 0.38, 0.76, 1.13, 1.51, 3.78, and 7.56, respectively, and it can be seen that the ratios of the confining pressure unloading rate to the axial stress loading rate were in the range of 0.3~8, covering a variety of test conditions from low to high. Hereby, this simulation scheme is reasonable.

4.2. Results Comparison of the DEM Simulation with Laboratory Tests

In laboratory tests, the strength and deformation parameters and failure modes of shale specimens at 0°, 60°, and 90° bedding inclinations under different confining pressure unloading rates were obtained. In this PFC2D simulation research, a variety of tests under different confining pressure unloading rates were conducted; however, the logic of the loading rate in the PFC procedure was different from that in the physical world, and the two could not be connected directly. Therefore, the reliability of simulation results cannot be verified by comparing the laboratory test results from the specific conditions of one-to-one correspondence analysis. Hereby, the reliability of the simulation test results was verified by comparing the strength envelope of the shale specimens under confining pressure unloading. However, the failure mode could not be compared with the laboratory test due to the differences in the unloading rate and stress state at the failure point.
Figure 10 presents the failure strength envelope comparison of shale specimens at inclination inclinations of 0°, 60°, and 90° under confining pressure unloading and conventional triaxial compression tests in a simulation test and a laboratory test. The simulation results and laboratory test results in Figure 10 include conventional triaxial compression strength (TCS) and confining pressure unloading strength (CUS). It can be seen from Figure 10a, b that the simulation results of the specimens at 0° and 60° bedding inclinations are in good agreement with the laboratory test results, and the confining pressure unloading strength (CUS) points obtained from the simulation test are scattered near the envelope of conventional triaxial compression strength (TCS) in the laboratory test. In addition, all the TCS points in the simulation test also fall within the dispersion range of the TCS points obtained in the experiment. It can be concluded that the simulation test of confining pressure unloading in this research reflects well the laboratory test results. At the same time, it also can be seen that the simulated CUS points are more centralized, have less difference from the simulated TCS envelope, and the TCS and CUS values in laboratory tests show large discreteness. Therefore, it can be seen that the numerical simulation results show less discreteness and can better reflect the effect of single variable factors on the test results. In addition, as can be seen from Figure 10c, for the specimen at a bedding inclination of 90°, although there is a great difference between the simulated strength and the laboratory test strength, the linear fitting slope of the simulated strength is close to the laboratory test result, and the variation of the two is highly consistent.
On the other hand, by observing the simulated CUS values, it can be seen that the CUS values under different axial stress unloading points (σU) have different distribution regions. When the σU increased from 50%σP to 95%σP, the CUS value changed from a high confining pressure region to a low confining pressure region. As seen in Figure 10, the failure confining pressure corresponding to the CUS under σU distribution ranges of 50%σP, 70%σP, 85%σP, and 95%σP are about 20~15 MPa, 15~10 MPa, 10~5 MPa, and 5~0 MPa, respectively. This is because the greater σU is, the greater the failure strength is, and the corresponding confining pressure on the strength envelope is larger. In addition, it also can be seen from Figure 10 that the CUS value of the same σU value decreases with an increasing confining pressure unloading rate, VU, as shown by the arrows of different colors in Figure 10. The arrows indicate the variation paths of CUS values with the VU increase. This is because the greater the confining pressure unloading rate, the greater the reduction of confining pressure in the same period of time, while the increase of axial pressure in this period of time is relatively small; thus, the failure strength will be lower.

4.3. DEM Simulation Results of Unloading Confining Pressure Tests on Shale

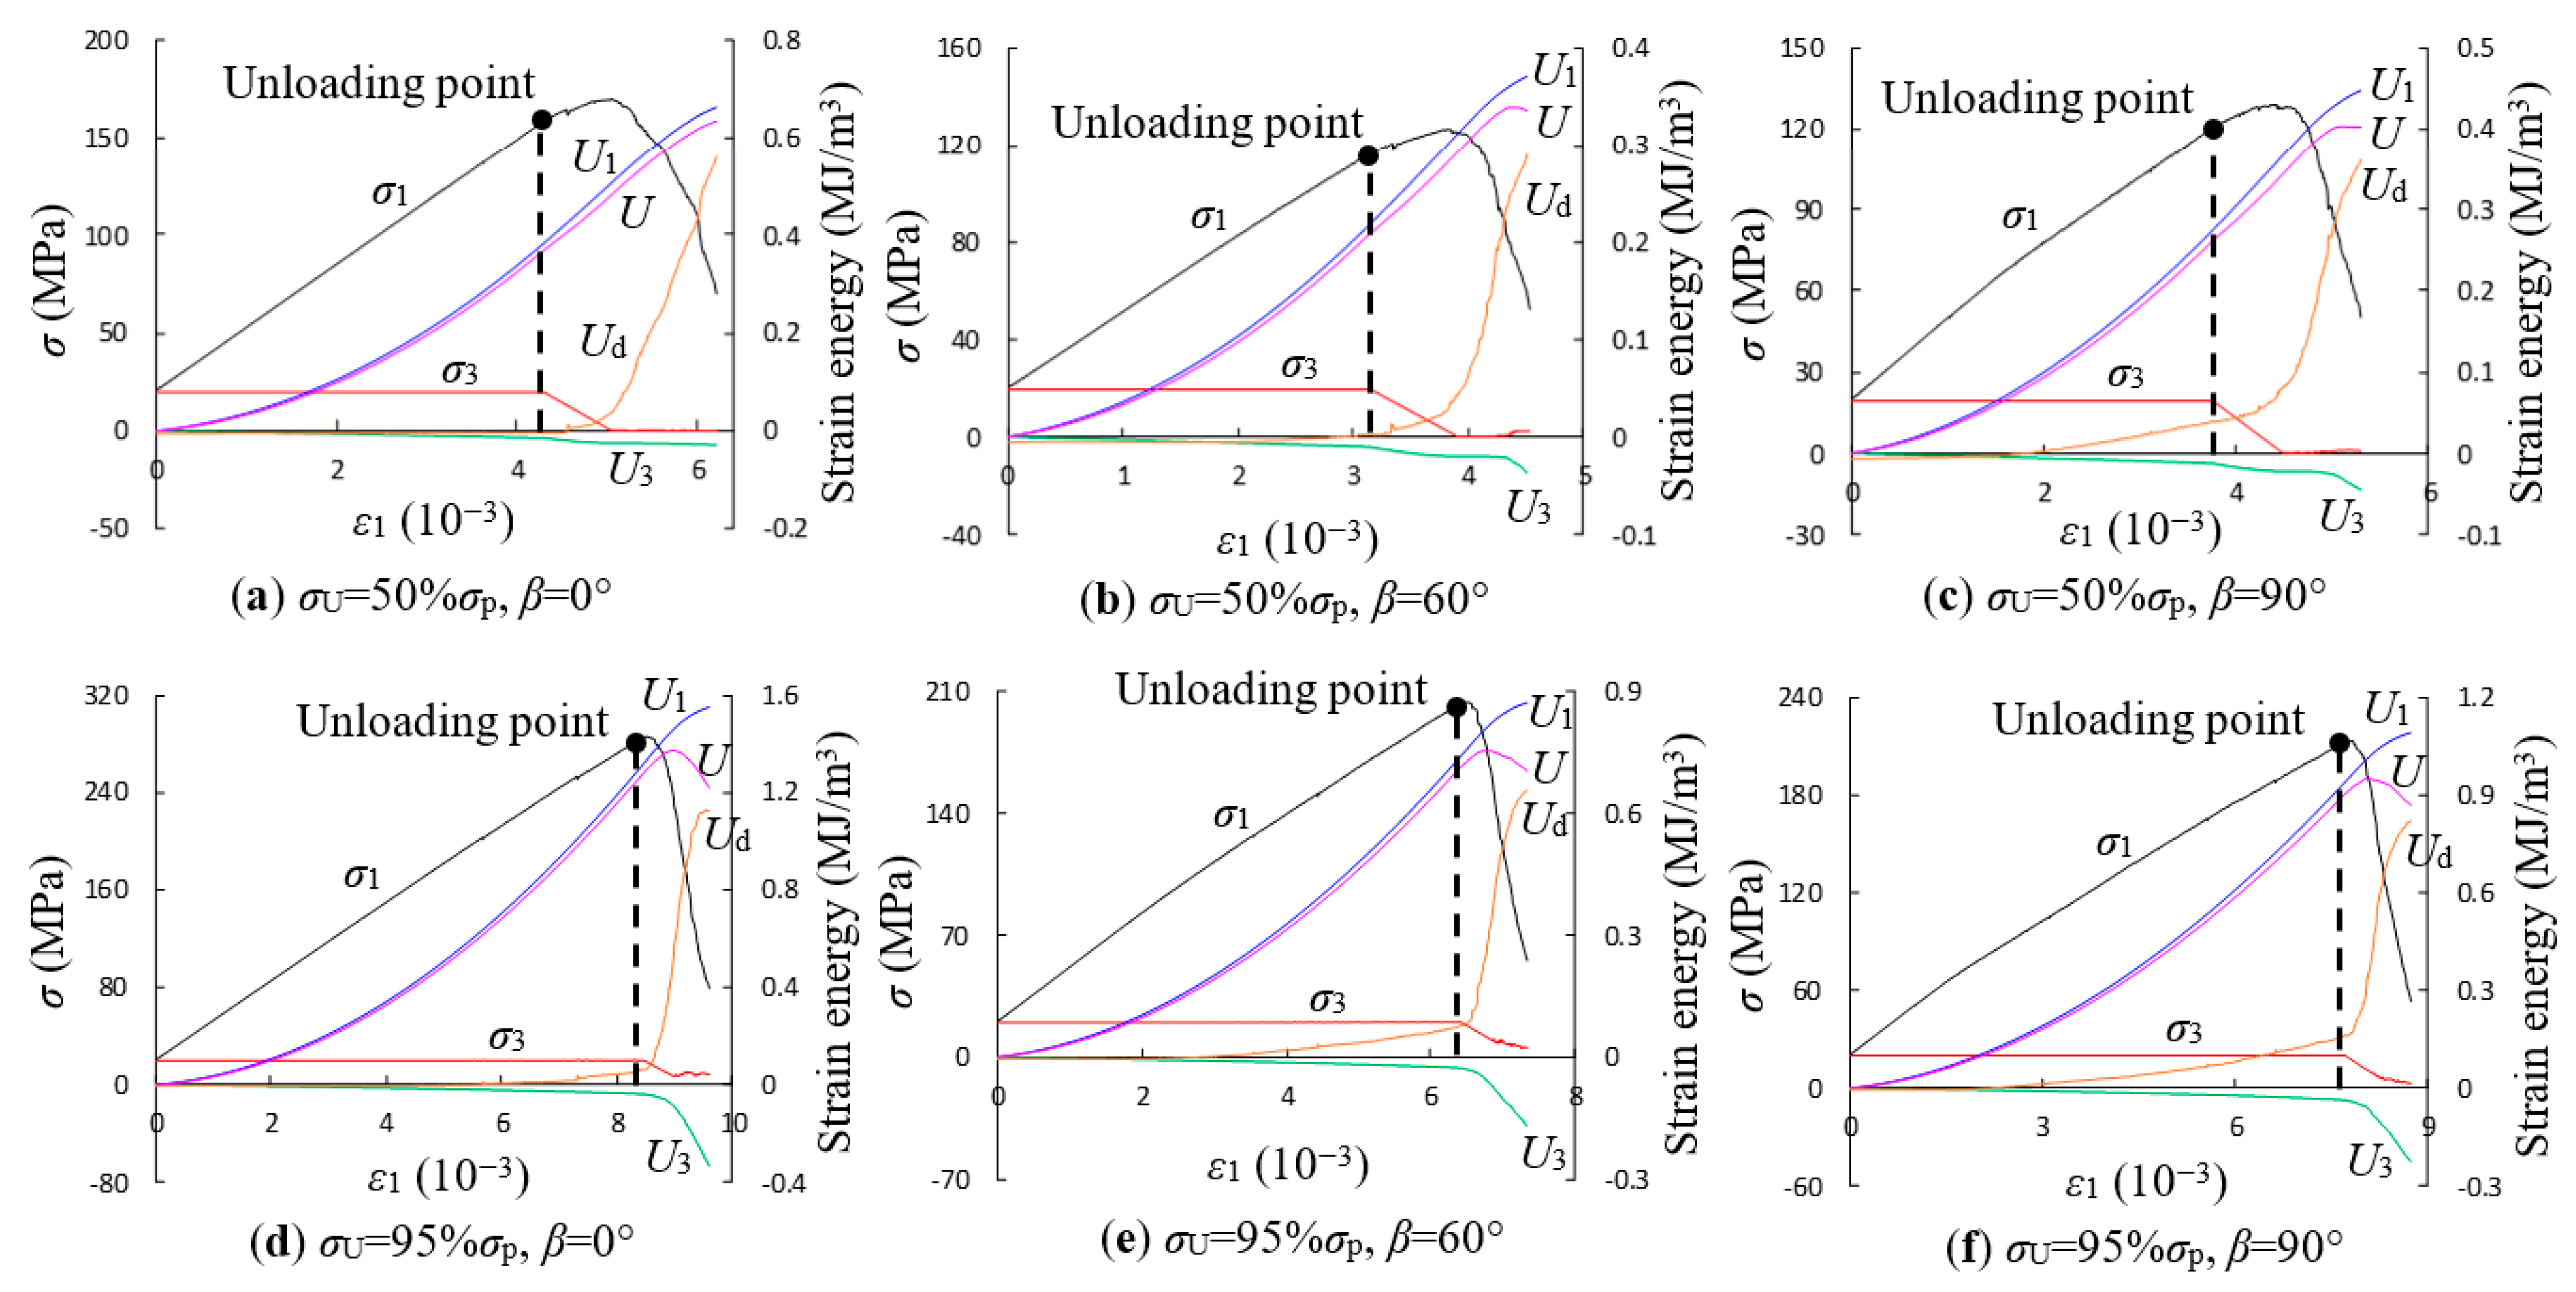
Figure 11 shows the stress-strain curves under different unloading rates in the confining pressure unloading simulation tests. Due to a large number of simulation test conditions and limited space, only shale specimens at bedding inclinations of 0°, 60°, and 90° and under unloading stresses σU of 50% σp and 95% σP are shown in Figure 11. As can be seen from Figure 11, the failure strength and failure confining pressure of the specimen at an unloading stress σU of 50% σp are lower than those at 95% σP, which corresponds to the results shown in Figure 10. On the other hand, it can be seen from Figure 11 that the confining pressure unloading rate has a significant effect on the mechanical properties: the greater the confining pressure unloading rate of the shale specimen, the greater the loading rate of deviatoric stress. Specifically, it can be seen from the stress-strain curves that the slope of the deviatoric stress curve increases after unloading, and the higher the unloading rate, the greater the slope of the deviatoric stress curve. The increase in the confining pressure unloading rate accelerates the increasing rate of deviating stress and also accelerates the decreasing rate of confining pressure. Therefore, the confining pressure drops to a low level rapidly in a short time, resulting in a decrease in the failure strength of the shale specimen.
In addition, it can be concluded that the low unloading stress level leads to a large effect of the confining pressure unloading rate on the mechanical properties; when the unloading stress level is close to the strength under monotonic loading conditions, the effect of the confining pressure unloading rate on the mechanical properties become weak. This is because the high unloading stress level decreases the time that the specimen takes to reach the failure strength. Meanwhile, the confining pressure unloading makes the specimen fail more easily; however, the effect of the unloading rate cannot be shown in such a short time.
In Figure 10, the comparison of the confining pressure unloading strength envelope between the simulation test and the laboratory test of specimens at bedding inclinations of 0°, 60°, and 90° is presented. To comprehensively analyze the confining pressure unloading strength characteristics of specimens at different bedding inclinations in the simulated test, Figure 12 shows the confining pressure unloading strength envelope of the other four groups of shale specimens at bedding inclinations of 15°, 30°, 45°, and 75° obtained by simulation. From Figure 12, as a whole, the confining pressure unloading strength (CUS) points under different unloading stress levels and unloading rates are scattered on both sides of the envelope of conventional triaxial compression strength (TCS). However, it can be found from the observation of the CUS distribution at different loading rates that with the confining pressure unloading rate increases, CUS points will be distributed more above the TCS envelope (as shown in the blue oval dotted box in Figure 12), which means the strength of the shale specimen increases as the confining pressure unloading rate increases. By observing the distribution of all the CUS points, it can be found that the CUS values are higher than the TCS values on the whole, which indicates that the loading path of the unloading confining pressure and increasing axial pressure enhances the failure strength of shale specimens to a certain extent. This phenomenon can be analyzed from another point of view. The loading path of confining pressure unloading and increased axial pressure substantially increase the loading rate of the shale specimens. Numerous current studies have confirmed that the higher the loading rate is, the stronger the specimen is.
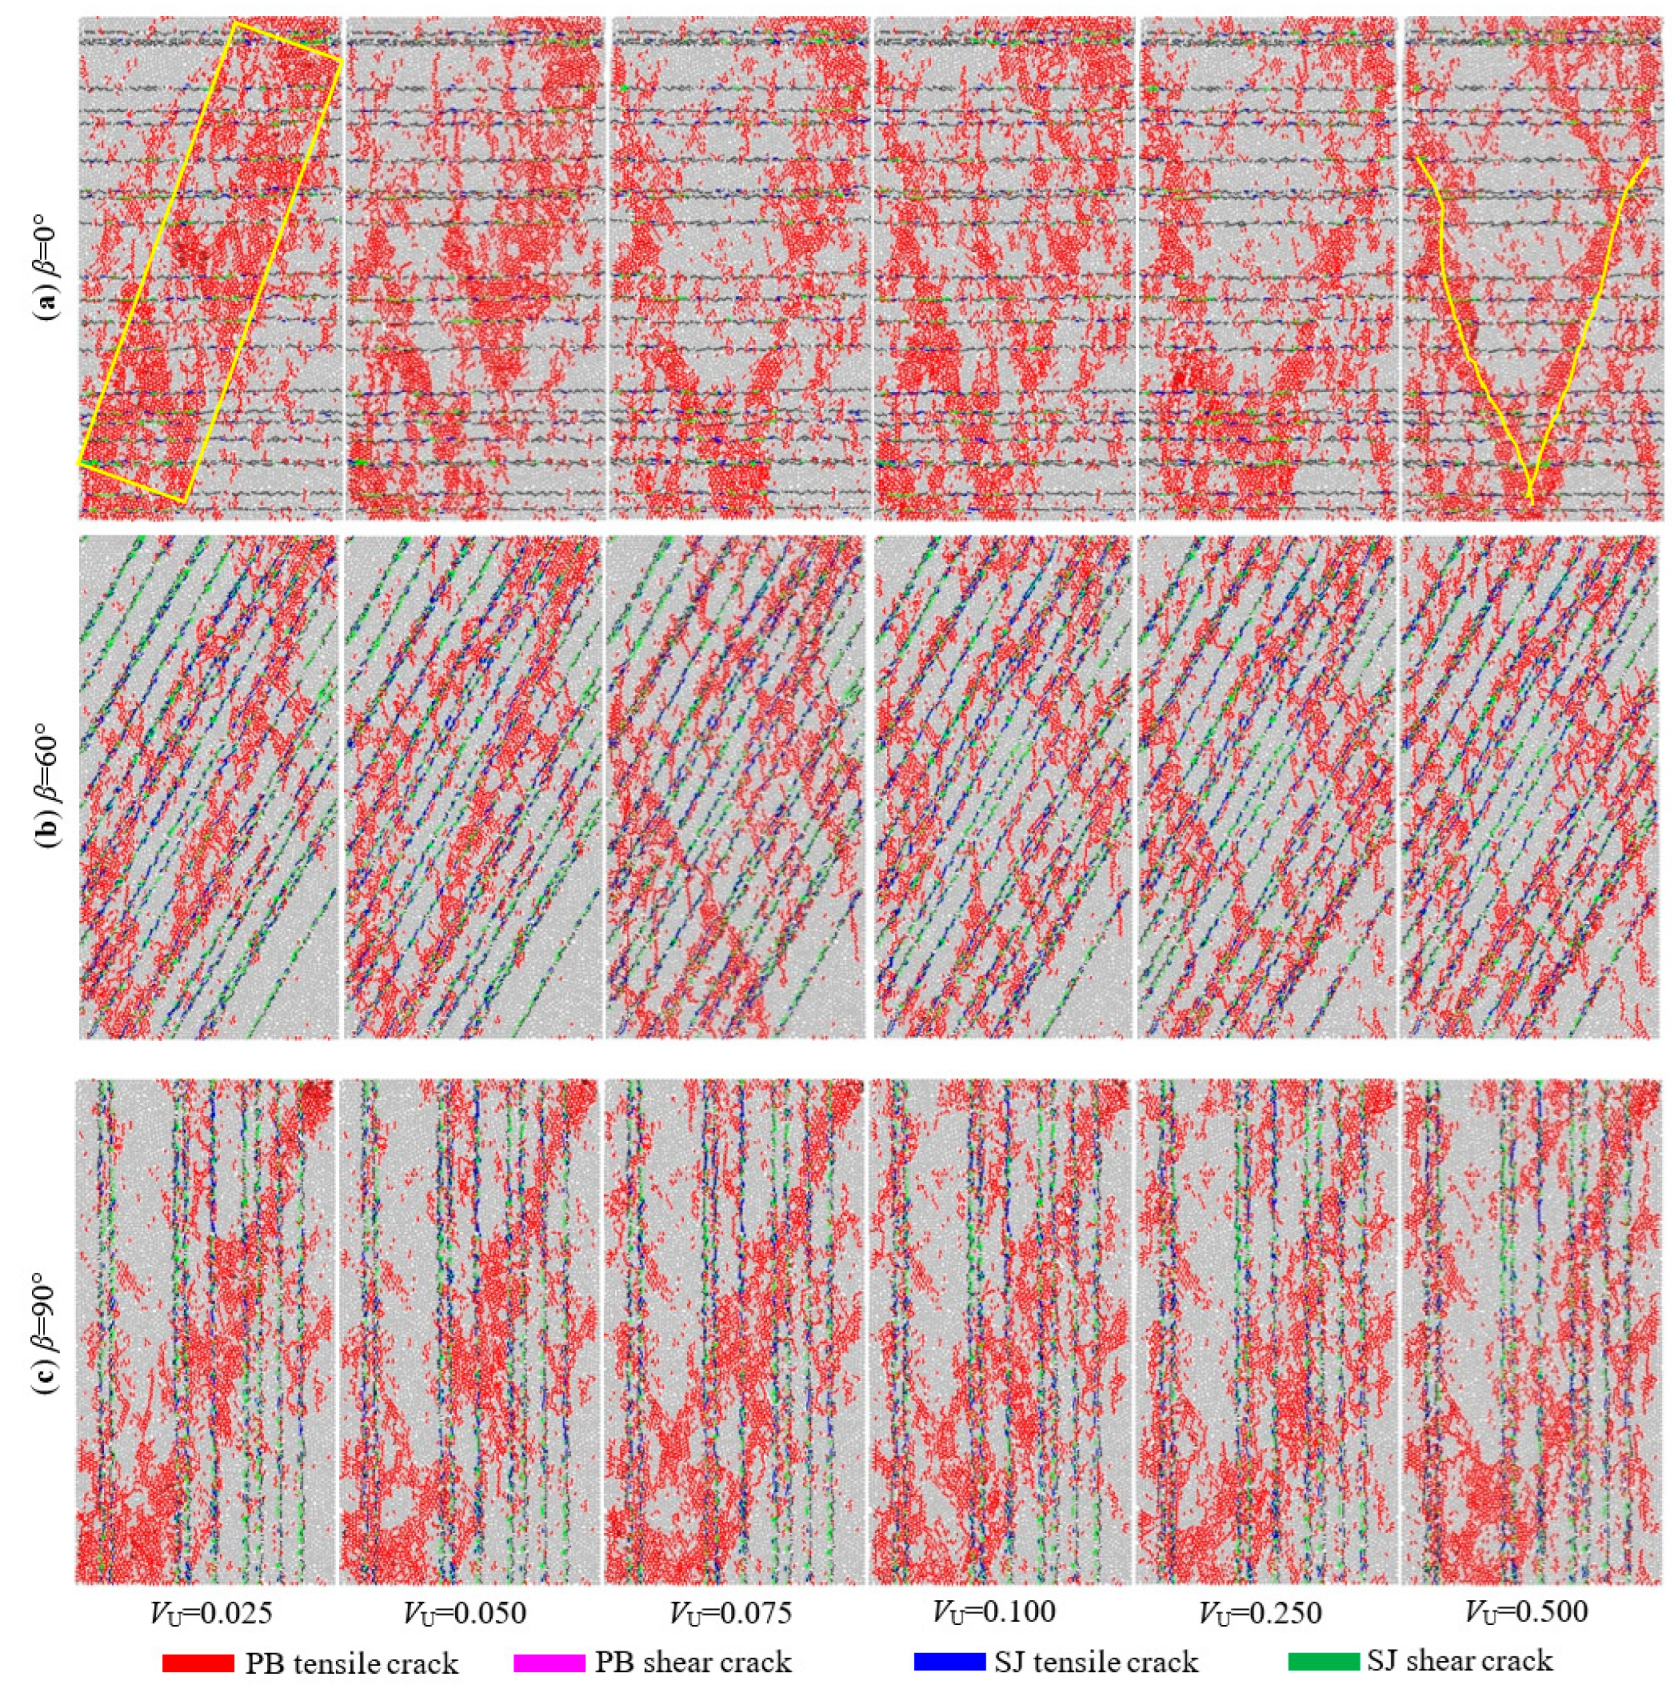
Figure 13 shows the failure modes of shale specimens at bedding inclinations of 0°, 60°, and 90° under different confining pressure unloading rates when the unloading axial stress σU is 50% σP. It can be seen from Figure 11 that the overall failure modes of shale specimens at the same bedding inclination are similar under different confining pressure unloading rates. The specimens at a bedding inclination of 0° in Figure 13a mainly failed by V-shaped shear fractures, while the specimens at a bedding inclination of 60° in Figure 13b mainly failed by shear fractures along the bedding plane, and the specimens at a bedding inclination of 90° in Figure 13c are dominated by an oblique single shear fracture plane. In particular, from Figure 13, it can be further observed that the failure mode of simulated specimens under the lowest confining pressure unloading rate (VU = 0.025 MPa/100 steps) is different from those at the high confining pressure unloading rate (VU = 0.500 MPa/100 steps). In Figure 13a, the shale specimen at a bedding inclination of 0° has two narrow “V-shaped” crack bands, and the distribution of microcracks is concentrated when VU = 0.025 MPa/100 steps, however, when VU increases to 0.500 MPa/100 steps the two “V-shaped” crack bands become wide. Moreover, the distribution of microcracks is scattered, and a small number of fine axial crack bands are also distributed. In Figure 13b, the shale specimen at a bedding inclination of 60° has two main crack bands along the bedding plane (as the yellow line indicates in the first image of Figure 13b) at VU = 0.025 MPa/100 steps and other small local crack clusters are also dispersed. However, when the VU increases to 0.500 MPa/100 steps, the micro-cracks are mainly distributed beside the two bedding planes and accompanied by several fine crack zones propagated along the axial stress. In addition, as shown in Figure 13c, the shale specimen at a bedding inclination of 90° has a wide oblique crack zone and relatively dispersed crack distribution at VU = 0.025 MPa/100 steps, while the shale specimen has a narrow oblique crack zone and concentrated crack distribution at VU = 0.500 MPa/100 steps.
Figure 14 shows the failure modes of shale specimens at bedding inclinations of 0°, 60°, and 90°under different confining pressure unloading rates when the unloading axial stress σU is 95% σP. It can also be seen from Figure 14 that the overall failure modes of shale specimens with the same bedding inclination are similar under different confining pressure unloading rates. The shale specimens at a 0° bedding inclination in Figure 14a mainly present V-shaped shear fracture planes, while the specimens at a 60° bedding inclination in Figure 14b are mainly shear fracture planes along the bedding plane, and the specimens at a 90° bedding inclination in Figure 14c are dominated by an oblique single shear fracture plane. From Figure 14, it can be further observed that the failure modes of the numerical specimens at the lowest unloading rate (VU = 0.025 MPa/100 steps) are different from those at the highest unloading rate (VU = 0.500 MPa/100 steps). In Figure 14a, the shale specimen at a 0° bedding inclination has only one wide oblique crack zone (indicated by the yellow wireframe in the first image) when VU = 0.025 MPa/100 steps, while there are two fine “V” shaped crack zones (indicated by the yellow lines in the last image) when VU = 0.500 MPa/100 steps. The shale specimen at the 60° bedding inclination in Figure 14b has two fine crack zones at VU = 0.025 MPa/100 steps, one along the bedding plane and the other through the bedding plane. However, when at VU = 0.500 MPa/100 steps, the cracks are distributed near multiple bedding planes, and no single crack zone is concentrated or significant. As shown in Figure 14c, the crack distribution of the shale specimen at a 90° bedding inclination is concentrated, and the oblique crack zone is significant at VU = 0.025 MPa/100 steps, while the crack distribution is dispersed at VU = 0.500 MPa/100 steps.
By comparing the failure modes at the low unloading stress level shown in Figure 13 and the high unloading stress level shown in Figure 14, it can be found that when compared with the low unloading stress level (Figure 13, σU = 50% σP), the failure shale specimens under the high unloading stress level (Figure 14, σU = 95% σP) have wider crack bands and more microcracks, which are more widely distributed. This is because the shale specimen under a high unloading stress level has a higher stress level when it fails, and the specimen has more damage accumulation and more fully developed cracks, resulting in its crack zone and the crack distribution range being wider. On the other hand, by comparing the unloading confining pressure failure mode shown in Figure 13 and Figure 14 to the conventional triaxial compression failure mode shown in Figure 9, it can be found that the micro-cracks in a failure specimen under conventional triaxial compression are more concentrated and more distinct, and the shale specimen fails due to oblique shear fracture under high confining pressure. When under confining pressure unloading test, the micro-crack in the failure specimen is dispersive, and the crack band is not distinct; in particular, there are several thin and narrow tensile crack bands extending along the axial stress direction, which indicates that the specimen will be a tensile failure under the confining pressure unloading.

4.4. Discussion on the Failure Mechanism of Unloading Confining Pressure Tests on Shale

(1) Analysis of micro-crack evolution during the confining pressure unloading process.
Figure 13 and Figure 14 are unlike conventional triaxial compression failure, which only produces oblique shear crack bands; the confining pressure unloading leads to many fine axial tensile crack bands in the specimen, which indicates that the failure mechanism of shale specimens under confining pressure unloading conditions is different from that under conventional triaxial compression. Therefore, Figure 15 shows the micro-crack evolution of the shale specimen during the confining pressure unloading simulation test. Similarly, due to space limitations, only shale specimens at bedding inclinations of 0°, 60°, and 90°, under unloading stresses (σU) of 50% σp and 95% σp, and unloading rates (VU) of 0.025, 0.100, and 0.500 MPa/100 steps are presented in Figure 15. In addition, it should be noted that for the shale specimens under the same bedding inclination and unloading stress, the stress-strain curves before the start of confining pressure unloading are consistent; therefore, to clearly show the details of stress and micro-crack variation after confining pressure unloading start, the curves before unloading starts are deleted, and only the curves after the confining pressure unloading are depicted in Figure 15.
As shown in Figure 15, there is a difference in the number of microcracks between the specimens under the two unloading stress levels because the higher the unloading stress level is, the more damage accumulation and more microcracks are generated. The number of microcracks begins to increase rapidly after confining pressure unloading starts, which indicates that confining pressure unloading will strengthen the damage accumulation of shale specimens. For the shale specimens under different bedding inclinations, PB tensile cracks are mainly generated in specimens under a 0° bedding inclination, SJ shear micro-cracks are mainly generated in specimens under a 60° bedding inclination before failure, and PB tensile cracks and SJ tensile cracks increase rapidly after failure. The micro-crack evolution of specimens under a 90° bedding inclination is similar to those under a 60° bedding inclination.
To further observe the micro-crack evolution curves before and after confining pressure unloading in Figure 15, it can be found that after the start of confining pressure unloading, the number of PB tensile micro-crack and SJ tensile micro-crack increases rapidly, and the increasing rate of the SJ shear micro-crack is stable, which indicates that the confining pressure unloading mainly produces tensile damage. At the same time, seen from the micro-crack evolution curves under different confining pressure unloading rates, it can be further concluded that the confining pressure unloading leads to more tensile damage, as the red and blue curves depict in Figure 15, with the increase in the confining pressure unloading rate, the rate of PB tensile cracks and SJ tensile crack increases, which reveals that the greater the confining pressure unloading rate, the more serious the tensile failure is. This is in line with the micro-crack destruction patterns shown in Figure 13 and Figure 14.
(2) Analysis of strain energy evolution during the confining pressure unloading process.
The failure process of the rock material is essentially a process of transformation and release of various energies; in particular, the evolution of strain energy can reflect the internal mechanisms of rock failure to a certain extent. When the rock specimen is under conventional triaxial compression (σ1 > σ2 = σ3), the total strain energy, U, of the rock element is contributed to via the axial stress, which does positive work, U1, and the confining pressure, which does negative work, U3; thus, the total strain energy U of the rock element in the whole process of triaxial compression can be expressed as:
U = U 1 + U 3
where U1 and U3 are the axial strain energy and radial strain energy, respectively. U1 and U3 can be obtained by integration of the stress-strain curve and are normally calculated by the area summation of tiny trapezoids, according to the definition of integral calculation. The calculation equations are as follows:
U 1 = 0 ε 1 σ 1 d ε 1 = i = 1 n 1 2 ( σ 1 i + σ 1 i + 1 ) ( ε 1 i + 1 ε 1 i )
U 3 = 2 0 ε 3 σ 3 d ε 3 = i = 1 n ( σ 3 i + σ 3 i + 1 ) ( ε 3 i + 1 ε 3 i )
where ε1 and ε3 are the axial and radial strain, respectively, n is the total number of trapezoids of the stress-strain curve, and i is the segmentation points.
In addition, the total strain energy U of the rock element can be divided into two parts, the elastic strain energy Ue, which is stored in the specimen and can be released by unloading, and the dissipated energy Ud, which leads to plastic deformation and crack propagation in the rock specimen [47].
U = U e + U d
The releasable strain energy stored in the element Ue is related to the unloading elastic modulus, E, and Poisson’s ratio, μ, after the rock element damage, and the elastic strain energy, Ue, can be calculated by using the following equation [47].
U e = 1 2 E [ σ 1 2 + 2 σ 3 2 2 μ 2 σ 1 σ 3 + σ 3 2 ]
It should be noted that although the form of Equation (5) is the same as the strain energy calculation formula in linear elasticity mechanics, it is aimed at the linear unloading process in the nonlinear process of a rock element. With the damage aggravation of the rock element under external action, the strength gradually decays. When the releasable elastic strain energy of a rock element reaches the surface energy required for failure, the element will fail and be released in the form of elastic surface energy.
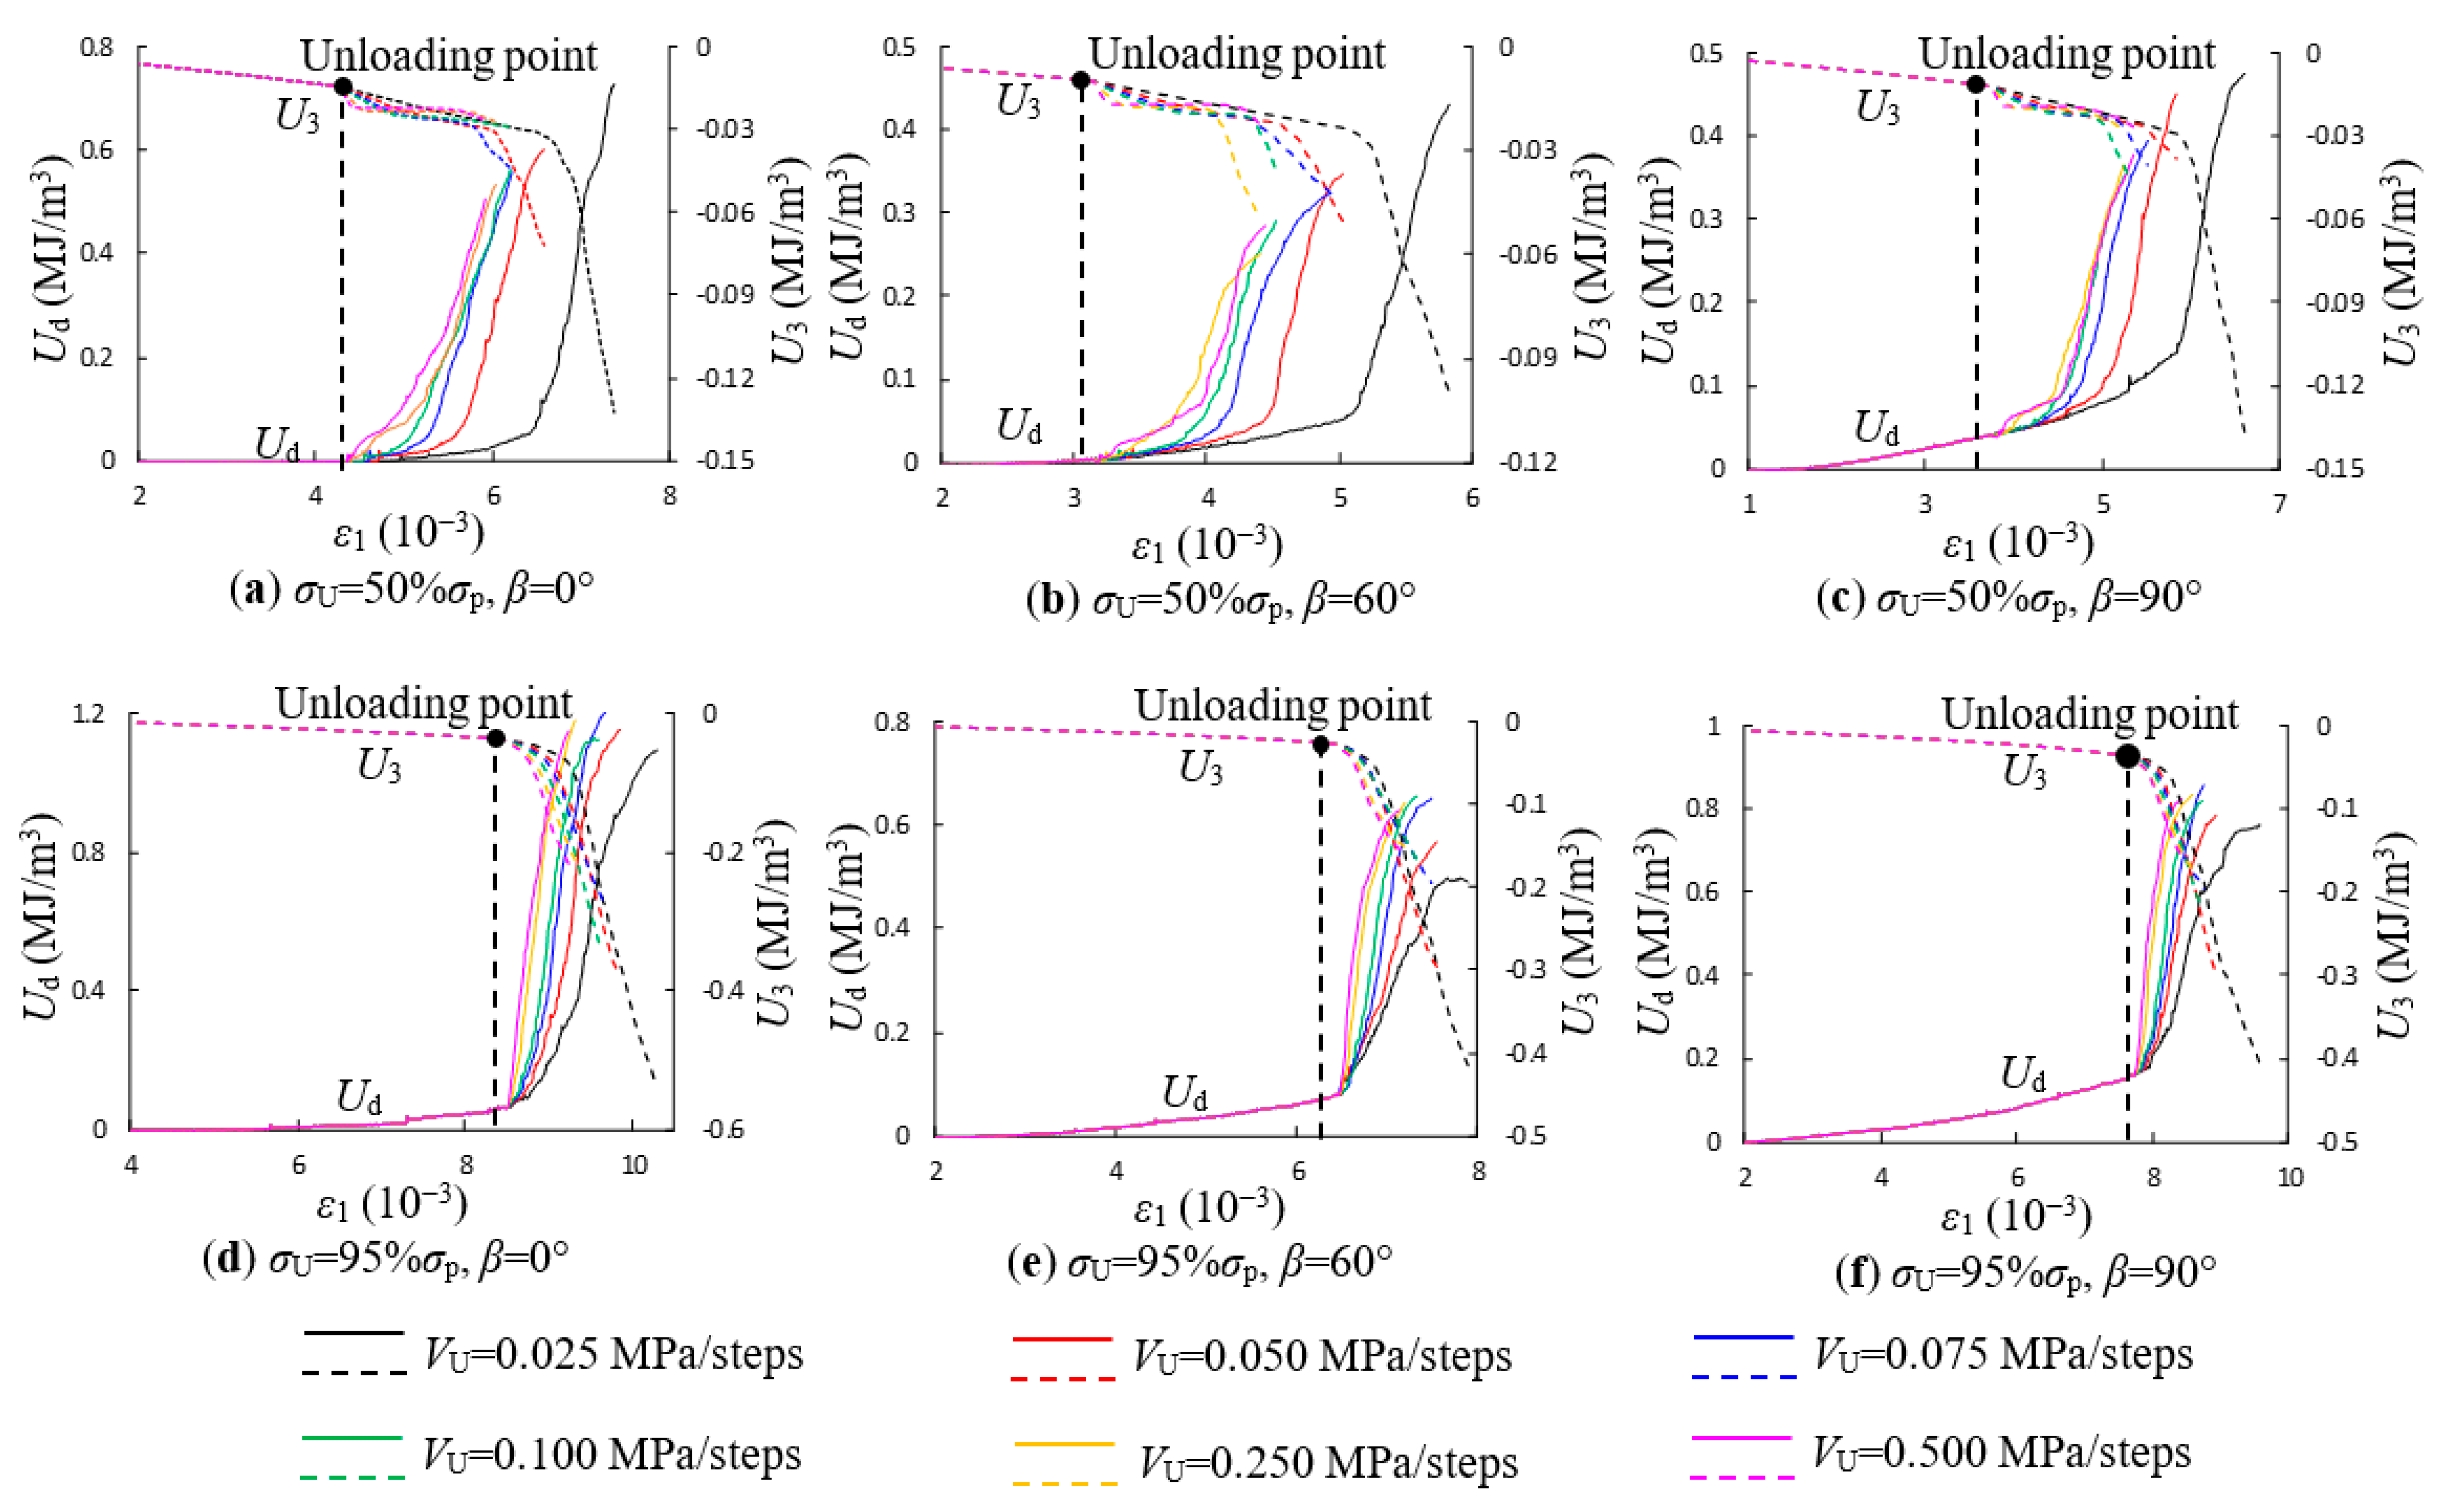
To further study the failure mechanism of the shale specimen in the process of confining pressure unloading, the strain energy evolution curves of the shale specimen under the confining pressure unloading simulation test are depicted in Figure 16; in particular, the evolution curves of lateral strain energy and dissipation energy are shown in Figure 17.
Due to the space limitation, Figure 16 only presents the results of specimens at bedding inclinations of 0°, 60°, and 90°, under unloading stresses σU of 50% σp and 95% σp, and a confining pressure unloading rate of 0.100 MPa/100 steps. As can be seen from Figure 16, before the confining pressure unloading starts, the lateral strain energy, U3, increases very slowly and remains at a very low level. In this period, the confining pressure is constant, and the low-level energy dissipation is mainly caused by the small lateral deformation of the specimen and almost all the work performed by the axial stress is converted into strain energy inside the specimen. Therefore, the U1 and U curves in Figure 16 almost coincide before the unloading point. However, after the start of confining pressure unloading, the U3 curve changes significantly and increases rapidly, indicating that the released lateral energy of the specimen begins to increase at this time. This is due to a decrease in the confining pressure, which leads to the increase of lateral deformation and results in the increase of lateral energy release. At the same time, the growth rate of the total dissipation energy, Ud, also increases, indicating that the strain energy stored inside the specimen begins to accelerate its release. Therefore, the U1 and U curves in Figure 16 begin to separate significantly after the unloading point, and the gap between them becomes larger and larger. By observing the strain energy evolution curves under the different conditions in Figure 16, it can be concluded that although the specimens are under different bedding inclinations and unloading stress levels, the strain energy evolution law after the confining pressure unloading is similar, and the increase of dissipation energy is caused by the increase of lateral strain energy release, corresponding to the intensification of the internal crack damage in Figure 15.
To further study the evolution of lateral strain energy U3 and the total dissipated energy Ud of the shale specimen during the confining pressure unloading process, the curves of U3 and Ud under different confining pressure unloading rates are depicted in Figure 17. Due to the space limitation, only the results of specimens at bedding inclinations of 0°, 60°, and 90° and under unloading stresses (σU) of 50% σp and 95% σp are presented in Figure 17.
As can be seen from the overall variation of U3 and Ud in Figure 17, the energy release curves under different unloading rates are concentrated under the high unloading stress point (95% σp) and dispersed under the low unloading stress point (50% σp). This is because the accumulated strain energy in the specimen is very large under a high unloading stress level. At this time, the specimen approaches the critical point of energy release and failure, leading to the energy dissipation rate being similar under different confining pressure unloading rates. By comparing the specimens under different bedding inclinations, it can be seen that the energy dissipation of specimens at a 0° bedding inclination has a slow rate and low magnitude before the confining pressure unloading starts, while the energy dissipation of specimens at a 90° bedding inclination is distinct before the confining pressure unloading starts. In addition, by comparing the evolution curves of U3 and Ud under different confining pressure unloading rates, it can be found that the higher the confining pressure unloading rate is, the higher the increase rate of U3 and Ud, and the faster the energy dissipation. The results further reveal that the confining pressure unloading results in the increase of lateral strain energy release and the acceleration of total dissipated energy release, which is the internal mechanism driving the specimen to failure during the confining pressure unloading process.
Based on the above analysis of micro-cracks and strain energy evolution of the shale specimens during confining pressure unloading, it can be concluded that during the process of confining pressure unloading, the continuous decrease of confining pressure weakens the lateral constraint of the specimen and changes in the internal stress state, leading to the increase of tensile micro-cracks and damage, and resulting in a large number of thin tensile crack bands extend along the axial direction in the specimen. Moreover, the increase in tensile micro-crack damage causes the energy dissipation to increase rapidly, which leads the specimen to the final failure.

5. Conclusions

The unloading effect induced by the in-situ stress release during the wellbore drilling process in shale reservoirs plays an important role in the wellbore safety and stability for shale gas exploitation. In this paper, laboratory experiments and DEM simulations by PFC2D were conducted to further study the strength, failure, strain energy evolution, and micro-crack damage mechanism of shale rock under confining pressure unloading conditions. The shale specimens at different bedding inclinations were tested under different initial axial stress levels and confining pressure unloading rates, with an initial unloading confining pressure of 20 MPa. From the tested and simulated results, the strength and failure characteristics were analyzed, the strain energy conversion and evolution during unloading were discussed, and the damage mechanism was revealed at a micro level. The relevant conclusions can be summarized as follows.
(1) The confining pressure unloading induces greater plastic deformation and strain energy dissipation, indicating that the major damage easily occurs when stress is released. The shale specimen tested in this research more likely breaks quickly after the unloading starts. The unloading rate has a significant effect on the mechanical properties. When the confining pressure unloading rate increases, the failure strength lowers, and more micro-cracks and damage occur. From the view of the strength envelope, the higher unloading rate enhances the failure strength, and a reasonable explanation is that the path of confining pressure unloading and axial pressure loading substantially increases the loading rate of deviatoric stress. In addition, a higher initial axial stress level leads to more damage when the specimen fails; as a result, more strain energy is stored in the specimen and released rapidly when unloading starts.
(2) According to the experimental and simulated failure modes and crack distribution of shale specimens under confining pressure unloading conditions, the brittle shale rock under a certain stress state (a high stress that approaches the peak stress when the damage starts to accumulate, which can be regarded as the damage threshold) can suffer serious damage due to unloading of the confining pressure. During the confining pressure unloading process, the axial strain, radial strain, and dissipation energy increase gradually, and the increasing of radial strain and radial strain energy is more distinct, indicating that the shale specimen has been in a state of dilatation. The shale rock dilatation under confining pressure unloading conditions is mainly induced by the generation and accumulation of tensile splitting crack; due to that, the constraint effect of confining pressure on circumferential deformation becomes weaker as the confining pressure decreases.
(3) The failure pattern of the shale specimen is more complex under confining pressure unloading conditions. More tensile cracks occur in the shale specimen in the unloading process, and splitting failure also occurs even under high confining pressure (when the specimen fails). The failure of shale specimens under low confining pressure is controlled by the confining pressure, and it is more sensitive to the unloading of the confining pressure and more prone to splitting failure. Similarly to the failure mode under the conventional triaxial compression test, shear fractures along the bedding planes dominate the failure pattern of shale specimens at high bedding inclinations (45° to 75°), which indicates that a weak bedding plane can have a significant effect on the failure behavior of wellbore drilling in shale formations. For the wellbore drilling in shale formations, when the buried depth and vertical stress are fixed, the lower the lateral stress, the easier it is to form tensile failure around the wellbore in the drilling process, and more induced fractures will be generated in the formation around the wellbore.

Author Contributions

Conceptualization, P.Y. and S.Y.; methodology, P.Y., S.Y. and W.T.; investigation, P.Y. and W.T.; writing—original draft preparation, P.Y.; writing—review and editing, S.Y. and F.G.; supervision, S.Y. and F.G.; funding acquisition, P.Y. and S.Y. All authors have read and agreed to the published version of the manuscript.

Funding

This research was supported by the National Natural Science Foundation of China (Nos. 42077231, 42202300), the Basic Research Program of Jiangsu Province (Natural Science Foundation) for Youth Foundation (No. BK20221150), and the Fundamental Research Funds for the Central Universities-Special Funds for the State Key Laboratory (No. Z21003).

Data Availability Statement

Not applicable.

Conflicts of Interest

The authors declare no conflict of interest.

Nomenclature

DEMdiscrete element method
PFCparticle flow code
XRDX-ray diffraction
TCStriaxial compression strength
CUSconfining pressure unloading strength
PBParallel bond model
SJSmooth joint model
βbedding inclination of shale specimen, °
σ3confining pressure, MPa
σppeak stress, MPa
Eelasticity modulus, GPa
vPoisson’s ratio
Ccohesion, MPa
φfriction angle, °
VUconfining pressure unloading rate, MPa/min
σUUnloading initial point, MPa
σ3confining pressure reduction, MPa
U1axial strain energy, MJ/m3
U3radial strain energy, MJ/m3
Ueelastic strain energy, MJ/m3
Uddissipated energy, MJ/m3

References

  1. Yu, M. Chemical and Thermal Effects on Wellbore Stability of Shale Formations. Ph.D. Dissertation, The University of Texas at Austin, Austin, TX, USA, 2002. [Google Scholar]
  2. Liu, X.; Zeng, W.; Liang, L.; Lei, M. Wellbore stability analysis for horizontal wells in shale formations. J. Nat. Gas Sci. Eng. 2016, 31, 1–8. [Google Scholar] [CrossRef]
  3. Jin, X.; Shah, S.N.; Roegiers, J.C.; Zhang, B. Fracability evaluation in shale reservoirs-an integrated petrophysics and geomechanics approach. In Proceedings of the SPE Hydraulic Fracturing Technology Conference, Society of Petroleum Engineers, The Woodlands, TX, USA, 4–6 February 2014. [Google Scholar]
  4. Jin, X.; Shah, S.N.; Truax, J.A.; Roegiers, J.C. A Practical petrophysical approach for brittleness prediction from porosity and sonic logging in shale reservoirs. In Proceedings of the SPE Annual Technical Conference And Exhibition, Society of Petroleum Engineers, Amsterdam, The Netherlands, 27–29 October 2014. [Google Scholar]
  5. Rybacki, E.; Meier, T.; Dresen, G. What controls the mechanical properties of shale rocks?—Part II: Brittleness. J. Pet. Sci. Eng. 2016, 144, 39–58. [Google Scholar] [CrossRef] [Green Version]
  6. Zhang, D.C.; Ranjith, P.G.; Perera, M.S.A. The brittleness indices used in rock mechanics and their application in shale hydraulic fracturing: A review. J. Pet. Sci. Eng. 2016, 143, 158–170. [Google Scholar] [CrossRef]
  7. Kivi, I.R.; Ameri, M.; Molladavoodi, H. Shale brittleness evaluation based on energy balance analysis of stress-strain curves. J. Pet. Sci. Eng. 2018, 167, 1–19. [Google Scholar] [CrossRef]
  8. Yang, S.Q.; Yin, P.F.; Ranjith, P.G. Experimental study on mechanical behavior and brittleness characteristics of Longmaxi formation shale in Changning, Sichuan Basin, China. Rock Mech. Rock Eng. 2020, 53, 2461–2483. [Google Scholar] [CrossRef]
  9. Duan, K.; Ji, Y.L.; Wu, W.; Kwok, C.Y. Unloading-induced failure of brittle rock and implications for excavation-induced strain burst. Tunn. Undergr. Space Technol. 2019, 84, 495–506. [Google Scholar] [CrossRef]
  10. Ren, F.Q.; Chang, Y.; He, M.C. A systematic analysis method for rock failure mechanism under stress unloading conditions: A case of rock burst. Environ. Earth Sci. 2020, 79, 370. [Google Scholar] [CrossRef]
  11. Dokhani, V.; Yu, M.; Bloys, B. A wellbore stability model for shale formations: Accounting for strength anisotropy and fluid induced instability. J. Nat. Gas Sci. Eng. 2016, 32, 174–184. [Google Scholar] [CrossRef]
  12. Ma, T.S.; Chen, P.; Zhang, Q.B.; Zhao, J. A novel collapse pressure model with mechanical-chemical coupling in shale gas formations with multi-weakness planes. J. Nat. Gas Sci. Eng. 2016, 36, 1151–1177. [Google Scholar] [CrossRef]
  13. Chen, J.; Jiang, D.Y.; Ren, S.; Yang, C.H. Comparison of the characteristics of rock salt exposed to loading and unloading of confining pressures. Acta Geotech. 2016, 11, 221–230. [Google Scholar] [CrossRef]
  14. Liang, Y.P.; Li, Q.M.; Gu, Y.L.; Zou, Q.L. Mechanical and acoustic emission characteristics of rock: Effect of loading and unloading confining pressure at the postpeak stage. J. Nat. Gas Sci. Eng. 2017, 44, 54–64. [Google Scholar] [CrossRef]
  15. Niandou, H.; Shao, J.F.; Henry, J.P.; Fourmaintraux, D. Laboratory investigation of the mechanical behavior of Tournemire shale. Int. J. Rock Mech. Min. Sci. 1997, 34, 3–16. [Google Scholar] [CrossRef]
  16. Kuila, U.; Dewhurst, D.N.; Siggins, A.F.; Raven, M.D. Stress anisotropy and velocity anisotropy in low porosity shale. Tectonophysics 2011, 503, 34–44. [Google Scholar] [CrossRef]
  17. Masri, M.; Sibai, M.; Shao, J.F.; Mainguy, M. Experimental investigation of the effect of temperature on the mechanical behavior of Tournemire shale. Int. J. Rock Mech. Min. Sci. 2014, 70, 185–191. [Google Scholar] [CrossRef]
  18. Rybacki, E.; Reinicke, A.; Meier, T.; Makasi, M.; Dresen, G. What controls the mechanical properties of shale rocks?—Part I: Strength and young’s modulus. J. Pet. Sci. Eng. 2015, 135, 702–722. [Google Scholar] [CrossRef]
  19. Heng, S.; Guo, Y.; Yang, C.; Daemen, J.J.K.; Li, Z. Experimental and theoretical study of the anisotropic properties of shale. Int. J. Rock Mech. Min. Sci. 2015, 74, 58–68. [Google Scholar] [CrossRef]
  20. Yang, S.Q.; Yin, P.F.; Huang, Y.H. Experiment and discrete element modelling on strength, deformation and failure behaviour of shale under Brazilian compression. Rock Mech. Rock Eng. 2019, 52, 4339–4359. [Google Scholar] [CrossRef]
  21. Yang, S.Q.; Yin, P.F.; Li, B.; Yang, D.S. Behavior of transversely isotropic shale observed in triaxial tests and Brazilian disc tests. Int. J. Rock Mech. Min. Sci. 2020, 133, 104435. [Google Scholar] [CrossRef]
  22. Gui, J.C.; Guo, J.C.; Sang, Y.; Chen, Y.X.; Ma, T.S.; Ranjith, P.G. Evaluation on the anisotropic brittleness index of shale rock using geophysical logging. Petroleum 2022, in press. [CrossRef]
  23. Zhai, M.Y.; Xue, L.; Bu, F.C.; Yang, B.C.; Huang, X.L.; Liang, N.; Ding, H. Effects of bedding planes on progressive failure of shales under uniaxial compression: Insights from acoustic emission characteristics. Theor. Appl. Fract. Mech. 2022, 119, 103343. [Google Scholar] [CrossRef]
  24. Guo, X.L.; Tan, Z.S.; Wang, X.; Li, A.; Ma, Z.J.; Wu, Y.S. Effect of bedding angle and mineral composition on mechanical properties and fracture behavior of phyllite under unloading confining pressures. Geotech. Geol. Eng. 2020, 38, 3611–3621. [Google Scholar] [CrossRef]
  25. Wang, J.J.; Liu, M.N.; Jian, F.X.; Chai, H.J. Mechanical behaviors of a sandstone and mudstone under loading and unloading conditions. Environ. Earth Sci. 2019, 78, 30. [Google Scholar] [CrossRef]
  26. Liu, Q.Q.; Cheng, Y.P.; Jin, K.; Tu, Q.G.; Zhao, W.; Zhang, R. Effect of confining pressure unloading on strength reduction of soft coal in borehole stability analysis. Environ. Earth Sci. 2017, 76, 173. [Google Scholar] [CrossRef]
  27. Huang, R.Q.; Huang, D. Evolution of rock cracks under unloading condition. Rock Mech. Rock Eng. 2014, 47, 453–466. [Google Scholar] [CrossRef]
  28. Gong, H.L.; Luo, Y.; Xu, K.; Huang, J.H.; Wang, G.; Li, X.P. Failure behaviors of fractured granite during loading and unloading under high confining pressure based on acoustic emission multi-parameter analysis. Theor. Appl. Fract. Mech. 2022, 121, 103442. [Google Scholar] [CrossRef]
  29. Huang, D.; Li, Y.R. Conversion of strain energy in triaxial unloading tests on marble. Int. J. Rock Mech. Min. Sci. 2014, 66, 160–168. [Google Scholar] [CrossRef]
  30. Dai, B.; Zhao, G.Y.; Dong, L.J.; Yang, C. Mechanical characteristics for rocks under different paths and unloading rates under confining pressures. Shock Vib. 2015, 2015, 578748. [Google Scholar] [CrossRef]
  31. Zhang, L.M.; Cong, Y.; Meng, F.Z.; Wang, Z.Q.; Zhang, P.; Gao, S. Energy evolution analysis and failure criteria for rock under different stress paths. Acta Geotech. 2020, 16, 569–580. [Google Scholar] [CrossRef]
  32. Zhang, Y.; Yang, Y.J.; Ma, D.P. Mechanical characteristics of coal samples under triaxial unloading pressure with different test paths. Shock Vib. 2020, 2020, 8870821. [Google Scholar] [CrossRef]
  33. Hou, Z.Y.; Hao, C.B.; Xiao, F.K.; Liu, G. Research on energy conversion and damage features of unloading instability of sandstone under high stress. Adv. Civ. Eng. 2021, 3, 6655968. [Google Scholar] [CrossRef]
  34. Xie, H.P.; Peng, R.D.; Ju, Y. Energy dissipation of rock deformation and fracture. Chin. J. Rock Mech. Eng. 2004, 23, 3565–3570. [Google Scholar]
  35. Zhang, L.M.; Gao, S.; Wang, Z.Q.; Ren, M.Y. Analysis on deformation characteristics and energy dissipation of marble under different unloading rates. Teh. Vjesn.—Tech. Gaz. 2014, 21, 987–993. [Google Scholar]
  36. Zhao, G.Y.; Dai, B.; Dong, L.J.; Yang, C. Energy conversion of rocks in process of unloading confining pressure under different unloading paths. Trans. Nonferrous Met. Soc. China 2015, 25, 1626–1632. [Google Scholar] [CrossRef]
  37. Li, D.Y.; Sun, Z.; Xie, T.; Li, X.B.; Ranjith, P.G. Energy evolution characteristics of hard rock during triaxial failure with different loading and unloading paths. Eng. Geol. 2017, 228, 270–281. [Google Scholar] [CrossRef]
  38. Yang, R.; Ma, D.P.; Yang, Y.J. Experimental Investigation of Energy Evolution in Sandstone Failure during Triaxial Unloading Confining Pressure Tests. Adv. Civ. Eng. 2019, 2019, 7419752. [Google Scholar] [CrossRef] [Green Version]
  39. Sun, L.N.; Zhang, L.M.; Cong, Y.; Song, Y.D.; He, K.Q. The meso-fracturing mechanism of marble under unloading confining pressure paths and constant axial stress. Sci. Rep. 2021, 11, 17835. [Google Scholar] [CrossRef]
  40. Hao, X.J.; Yuan, L.; Sun, Z.W.; Zhao, W.P.; Ren, B.; Zhao, D.F.; Xue, J.H.; Zhang, X.Y.; Yu, G.F.; Zhang, Q. An integrated study of physical and numerical modelling on the stability of underground tunnel influenced by unloading rate. Tunn. Undergr. Space Technol. Inc. Trenchless Technol. Res. 2022, 129, 104602. [Google Scholar] [CrossRef]
  41. Sun, B.W.; Yang, S.Q.; Xu, J.; Yin, P.F. Discrete element simulation on failure mechanical behavior of transversely isotropic shale under two kinds of unloading paths. Theor. Appl. Fract. Mech. 2022, 121, 103466. [Google Scholar] [CrossRef]
  42. Yin, Q.; Wu, S.S.; Wu, J.Y.; Jing, H.W.; Zhang, J.; Zhang, Y.C. Experiment and particle flow simulation of unloading induced shearing properties for jointed sandstone materials. Case Stud. Constr. Mater. 2023, 18, e02012. [Google Scholar] [CrossRef]
  43. Cundall, P.A. A Computer Model for Simulating Progressive Large Scale Movements in Blocky Rock Systems. In Proceedings of the Symposium of the International Society of Rock Mechanics, Nancy, France, 4–6 October 1971; Volume 1. Paper No. II-8. [Google Scholar]
  44. Cundall, P.A.; Strack, O.D.L. A Discrete Numerical Model for Granular Assemblies. Geotechnique 1979, 29, 47–65. [Google Scholar] [CrossRef]
  45. Itasca Consulting Group, Inc. PFC 5.0 Documentation; Itasca Consulting Group, Inc.: Minneapolis, MN, USA, 2018. [Google Scholar]
  46. Cho, N.; Martin, C.D.; Sego, D.C. A clumped particle model for rock. Int. J. Rock Mech. Min. Sci. 2007, 44, 997–1010. [Google Scholar] [CrossRef]
  47. Xie, H.P.; Ju, Y.; Li, L.Y. Criteria for strength and structural failure of rocks based on energy dissipation and energy release principles. Chin. J. Rock Mech. Eng. 2005, 24, 3003–3010. [Google Scholar]
Figure 1. Unloading effect on wellbore excavation in shale reservoir.
Energies 16 05960 g001
Figure 2. Shale specimens tested in this research; from left to right, the bedding inclinations are 0°, 60°, and 90°, respectively.
Energies 16 05960 g002
Figure 3. Schematic of some different loading paths.
Energies 16 05960 g003
Figure 4. Stress-strain curves of shale specimens under triaxial unloading confining pressure tests.
Energies 16 05960 g004
Figure 5. Strength comparison of shale specimens between unloading confining pressure test and triaxial compression test.
Energies 16 05960 g005
Figure 6. Secant modulus variation with respect to confining pressure during confining pressure unloading.
Energies 16 05960 g006
Figure 7. Failure mode comparison of shale specimens between conventional triaxial compression and confining pressure unloading tests.
Energies 16 05960 g007
Figure 8. PFC2D model of shale specimen in this research.
Energies 16 05960 g008
Figure 9. Failure modes of shale specimens under conventional triaxial compression by PFC2D simulation.
Energies 16 05960 g009
Figure 10. Comparison of strength envelopes between simulation and experiment.
Energies 16 05960 g010
Figure 11. Stress-strain curves under confining pressure unloading simulation tests.
Energies 16 05960 g011aEnergies 16 05960 g011b
Figure 12. Strength envelopes under confining pressure unloading simulation of specimens at β = 15°, 30°, 45°, and 75°.
Energies 16 05960 g012
Figure 13. Failure modes of simulation specimens under different confining pressure unloading rates, σU = 50%σp; the unit of confining pressure unloading rate is “MPa/100 steps”.
Energies 16 05960 g013
Figure 14. Failure modes of simulation specimen under different confining pressure unloading rate, σU = 95%σp, the unit of confining pressure unloading rate is “MPa/100 steps”.
Energies 16 05960 g014
Figure 15. Micro-crack evolution during confining pressure unloading simulation tests.
Energies 16 05960 g015
Figure 16. Strain energy evolution during confining pressure unloading process; under confining pressure unloading rate is 0.100 MPa/100 steps.
Energies 16 05960 g016
Figure 17. Lateral strain energy and dissipated energy evolution during confining pressure unloading process.
Energies 16 05960 g017
Table 1. Basic strength parameters of shale specimens with bedding inclinations of 0°, 60°, and 90° under conventional triaxial compression test.
βσ3/MPaσ1/MPaE/GPavC/MPaφ
0146.4125.090.11128.8852.3°
5257.4332.700.212
10220.9826.810.204
15320.0735.310.193
20329.4234.370.158
60°0100.5223.790.11323.9641.7°
5128.9823.720.115
10173.4526.750.108
15180.5626.560.121
20198.9926.550.109
90°0229.3337.350.13653.3545.6°
5325.2037.910.135
10308.7836.790.103
15365.9937.710.127
20369.0337.550.136
Table 2. Main test parameters and results of shale specimen under triaxial unloading confining pressure test.
βVU
(MPa/min)
σU
(MPa)
σ1σ3
(MPa)
σ3`
(MPa)
σ1
(MPa)
σ3
(MPa)
σ3/σ3
(%)
0.5239.1244.119.64263.70.361.80
2240.8241.919.57261.50.432.15
4232.8239.815.53255.34.4722.35
6230.9236.414.26250.75.7428.70
60°0.5150.4219.817.37237.22.6313.15
2163.5204.813.69218.56.3131.55
4153.5188.29.34197.510.6653.30
6151.2157.716.53174.23.4717.35
90°0.5283.4318.218.03336.21.979.85
2289.8337.913.56351.56.4432.20
4282.6302.214.18316.45.8229.10
6289.2315.47.25322.712.7563.75
Table 3. PFC2D micro-parameters of shale specimen model after calibration.
Parallel BondSmooth Joint
ParametersValueParametersValue
Particle minimum radius, Rmin (mm)0.8SJ normal stiffness, sj_kn (GPa)100,000
Particle radius ratio, Rrat1.25SJ shear stiffness, sj_ks (GPa)50,000
Particle density, ρ (Kg/m3)2500SJ friction coefficient, sj_fric2.0
PB friction coefficient, pb_fric0.7SJ tensile strength, sj_ten (MPa)42
PB radius multiplier1.0SJ cohesion, sj_coh (MPa)100
PB effective modulus, pb_emod (GPa)16.5Loading rate (m/s)0.05
PB normal-to-shear stiffness ratio, pb_krat2
PB tensile strength, pb_ten (MPa)50
PB cohesion, pb_coh (MPa)250
Table 4. The scheme of the confining pressure unloading simulation test.
Loading PathInitial Confining Pressure (MPa)Bedding InclinationUnloading Point σUUnloading Rate VU (MPa/100 Steps)Loading Rate
Increase axial stress and decrease confining pressure200°, 15°, 30°, 45°, 60°, 75°, 90°50% σp, 70% σp, 85% σp, 95% σp0.025, 0.05, 0.075, 0.1, 0.25, 0.50.05 m/s
Disclaimer/Publisher’s Note: The statements, opinions and data contained in all publications are solely those of the individual author(s) and contributor(s) and not of MDPI and/or the editor(s). MDPI and/or the editor(s) disclaim responsibility for any injury to people or property resulting from any ideas, methods, instructions or products referred to in the content.