Article

Physical and Numerical Simulation of Tight Gas Flow at the Microscale

1
University of Chinese Academy of Sciences, Beijing 101408, China
2
Institute of Porous Flow & Fluid Mechanics, Chinese Academy of Sciences, Langfang 065007, China
3
Research Institute of Petroleum Exploration and Development, Beijing 100083, China
*
Author to whom correspondence should be addressed.
Energies 2023, 16(16), 5937; https://doi.org/10.3390/en16165937
Submission received: 13 July 2023 / Revised: 4 August 2023 / Accepted: 5 August 2023 / Published: 11 August 2023
(This article belongs to the Section H: Geo-Energy)

Abstract

:
The porous media in tight reservoirs are mainly composed of micro- and nanopores, gas seepage through which is complex, making it difficult to study. Physical simulation using micron tubes is an intuitive and effective method to study the seepage mechanism of tight gas. The lattice Boltzmann method (LBM) is the most effective method for the tight gas seepage simulation, and it has been widely used. Microscale gas seepage simulation experiments and LBM simulations of micron tubes with different inner diameters were performed. The results showed that in micron tubes, the gas flow increases nonlinearly with an increasing pressure gradient. Influenced by compression and rarefaction effects, the degree of the nonlinearity of pressure distribution in series micron tubes increases with inlet pressure. The existence of a connecting channel between parallel micron tubes breaks the linear distribution of pressure in the original micron tubes, and the gas forms a raised relative high-pressure area at the connection of the two micron tubes; the wider the channel, the greater the bulge. The average gas flow rate in the whole micron tube increases with the channel width, and the seepage capacity increases instead of decreases. The diameter change of one micron tube has no effect on the gas flow in the other micron tube. Although the two micron tubes are connected, they are still relatively independent individuals. These research results lay a foundation for the correct understanding of the characteristics and laws of tight gas seepage in the pores of reservoirs at the micro- and nanoscales, and they have important theoretical significance for the study of seepage mechanisms in tight gas reservoirs.

1. Introduction

Tight reservoir media contain a large number of micro- and nanopores, and physical simulation based on micron tube seepage is the most intuitive and effective method to study the gas seepage mechanism. Research on microscale gas flow began as early as the 1970s, and, since then, many researchers have made great contributions to this field. For example, Pfafle et al. [1] studied the gas flow in pipes with inner diameters of 0.5–50 µm, and reported that the friction coefficient (f) is related to the Reynolds number (Re), and f decreases with Re under the influence of the rarefaction effect at small Re. Choi et al. [2] conducted nitrogen flow experiments on 3.0–81.2 µm round tubes, and the results showed that f·Re was 50.2–53.9 when the pipe diameter was <10 µm and Re < 400. In a microscale experiment carried out by Fenghua et al. [3], micron tubes with lengths ranging from 10 to 70 mm and inner diameters of 17.9 and 17.6 µm were adopted. The Ma number range of the experiment was 0.003–0.03, and compressibility was still readily observed. Dongxing et al. [4] conducted gas flow experiments using micron tubes with diameter × length dimensions of 84.7 µm × 13.56 mm, 144.4 µm × 22.3 mm, and 534.0 µm × 228.5 mm.
The lattice Boltzmann method (LBM) is a numerical simulation method that improved on the lattice gas automata (LGA) [5,6,7,8]. This algorithm shows unique advantages in dealing with multiphase flow interface problems and complex boundary conditions and has achieved great success. The LBM starts directly from a discrete model, applies the laws of conservation of mass, momentum, and energy, builds a bridge between macro- and microscales, continuous and discrete, on the basis of molecular motion theory and statistical mechanics, and interprets the essence of fluid motion from a brand-new perspective [9,10]. Compared with the traditional computational fluid method, the LBM has advantages such as its simple algorithm, ability to handle complex boundary conditions, direct solution of pressure, and direct simulation of connected domain flow fields with complex geometric boundaries [11].
At present, the seepage mechanism for tight gas reservoirs is typically simulated and studied according to numerical simulation or experimental methods [12,13,14,15], but neither traditional numerical simulation methods nor macroscopic experimental means capture the microscale gas seepage characteristics in a tight reservoir. The microscopic nature and medium characteristics of the LBM provide a feasible framework for studying microscopic seepage of tight gas and overcome the limitations of macroscopic methods. In recent years, many domestic and foreign scholars have performed extensive research on the application of LBM to the microscale seepage mechanism of unconventional natural gas, such as tight sandstone gas, shale gas, and coalbed methane. For instance, Wu Zisen et al. [16] studied the microscale behavior of tight gas by using the LBGK-D2Q9 model combined with the four-parameter random growth method. Zhang Liehui et al. [17] established a tight gas seepage model based on the LBGK-D2Q9 model considering the influence of microscale and slippage effects, and they discussed the influence of pore-throat structure on the microscale seepage characteristics of tight gas. Fathi et al. [18] used LBM to simulate the two-dimensional Poiseuille flow and modified the Klinkenberg slip theory. Rasoul et al. [19] simulated gas flow in nanoscale single tubes based on a double relaxation time LBM model and studied the influence of different boundary conditions and the tangential momentum regulation coefficient. On this basis, the simulation results of gas flow in a single channel and a simplified porous medium (pore-throat structure) were compared with the experimental data for three shale samples.
In this study, the flow pattern of tight gas and the applicability of the LBM to simulate gas flow in tight gas reservoirs were analyzed based on the characteristic pore-throat size of tight gas reservoirs. Then, based on the LBGK-D2Q9 model, a tight gas flow model was established. Then, microscale gas seepage experiments using micron tubes with different inner diameters were performed to analyze the change of gas flow under different pressure gradients and compare it with the flow rate simulated by the LBM. Then, the pressure distribution for gas seepage inside the micron tubes was determined. Finally, based on the LBM model, the influences of channel width and micron tube pore size ratio on tight gas flow and flow capacity in interconnected parallel micron tubes were simulated. These research results lay a foundation for the correct understanding of the characteristics and laws of tight gas seepage in reservoir pores at the micro- or nanoscale and have significance for the study of the seepage mechanism in tight gas reservoirs.

2. Models and Methods

2.1. Basic Methods and Principles of the LBM

2.1.1. Basic Theory of the LBM

Among all the current LBM models, lattice BGK (LBGK) models are most widely used, among which the DnQm model proposed by Qian et al. [20] in 1992 is the most representative. Taking D2Q9 (Figure 1) as an example, without considering the applied force, the evolution equation of this model is shown in Equation (1).
f i x + e i Δ t , t + Δ t f i x , t = 1 τ f i e q x , t f i x , t
where Δ t is the time step, e i is the discrete velocity of the particle, f i is the distribution function corresponding to the discrete velocity, the superscript eq represents the equilibrium state, and τ is the dimensionless relaxation time.
In the LBGK-D2Q9 model, the expression of the equilibrium distribution function is
f i e q = ω i ρ 1 + e i u c s 2 + e i u 2 2 c s 2 u 2 2 c s 2 , i = 0 , 1 8
where ω i is the weight coefficient, ρ is the lattice macroscopic density, u is the lattice macroscopic velocity, and c s is the lattice sound velocity.
Here, ω 0 = 4 9 , ω 1 , 2 , 3 , 4 = 1 9 , ω 5 , 6 , 7 , 8 = 1 36 , c s 2 = c 2 3 ,   c = Δ x Δ t = 1 .
The macro density ρ and macro velocity u can be calculated by the discrete distribution function f i :
i = 0 8 f i = ρ , i = 0 8 f i e i = ρ u
The lattice kinematic viscosity ν can be calculated from the dimensionless relaxation time τ :
ν = c s 2 τ 1 2 Δ t
Meanwhile, the relationship between pressure and density in lattice space is as follows:
p = c s 2 ρ

2.1.2. Boundary Conditions

The boundary conditions are an important part of the LBM model and directly related to the accuracy of the calculation results and efficiency. Among the boundary conditions, the standard rebound boundary condition is the most common [21]. This method lets the particles (distribution functions) that overflow the boundary bounce along the original path (Figure 2).
After a time step, the distribution function f 8 , f 4 , f 7 of the points (i − 1,2), (i,2), (i + 1,2), will migrate to (i,1). Hence:
f 8 i 1 , 2 = f 8 i , 1 , f 4 i , 2 = f 4 i , 1 , f 7 i + 1 , 2 = f 7 i , 1
For rebound treatment after contact with the solid wall boundary:
f 2 , 5 , 6 i , 1 = f 4 , 7 , 8 i , 1
When studying the flow of fluid driven by pressure difference or with slip at the boundary, Zou and He [22] proposed pressure boundary conditions in 1997 on the basis of the non-equilibrium rebound principle. The boundary conditions assume that the pressure (or density) along a fluid boundary is determined in the y-direction, and uy is also determined (such as at the inlet of a channel flow u y = 0 ). For the inlet (Figure 3), f 2 , 3 , 4 , 6 , 7 is determined after the flow, in addition to ρ = ρ i n ,   u y = 0 , and f 1 , 5 , 8 and u y are unknown and to be solved. According to Equation (3) and the non-equilibrium rebound principle, it can be determined that:
f 1 + f 5 + f 8 = ρ i n f 0 + f 2 + f 3 + f 4 + f 6 + f 7 f 1 + f 5 + f 8 = ρ i n u x + f 3 + f 6 + f 7 f 5 f 8 = f 2 + f 4 f 6 + f 7 f 1 = f 3 + 2 3 ρ i n u x
By solving the equations, we can obtain:
u x = 1 f 0 + f 2 + f 4 + 2 f 3 + f 6 + f 7 ρ i n f 1 = f 3 + 2 3 ρ i n u x f 5 = f 7 1 2 f 2 f 4 + 1 6 ρ i n u x f 8 = f 6 + 1 2 f 2 f 4 + 1 6 ρ i n u x
The above boundary conditions have been proved by practice, and they ensure the conservation of mass and momentum.

2.1.3. Model Validation

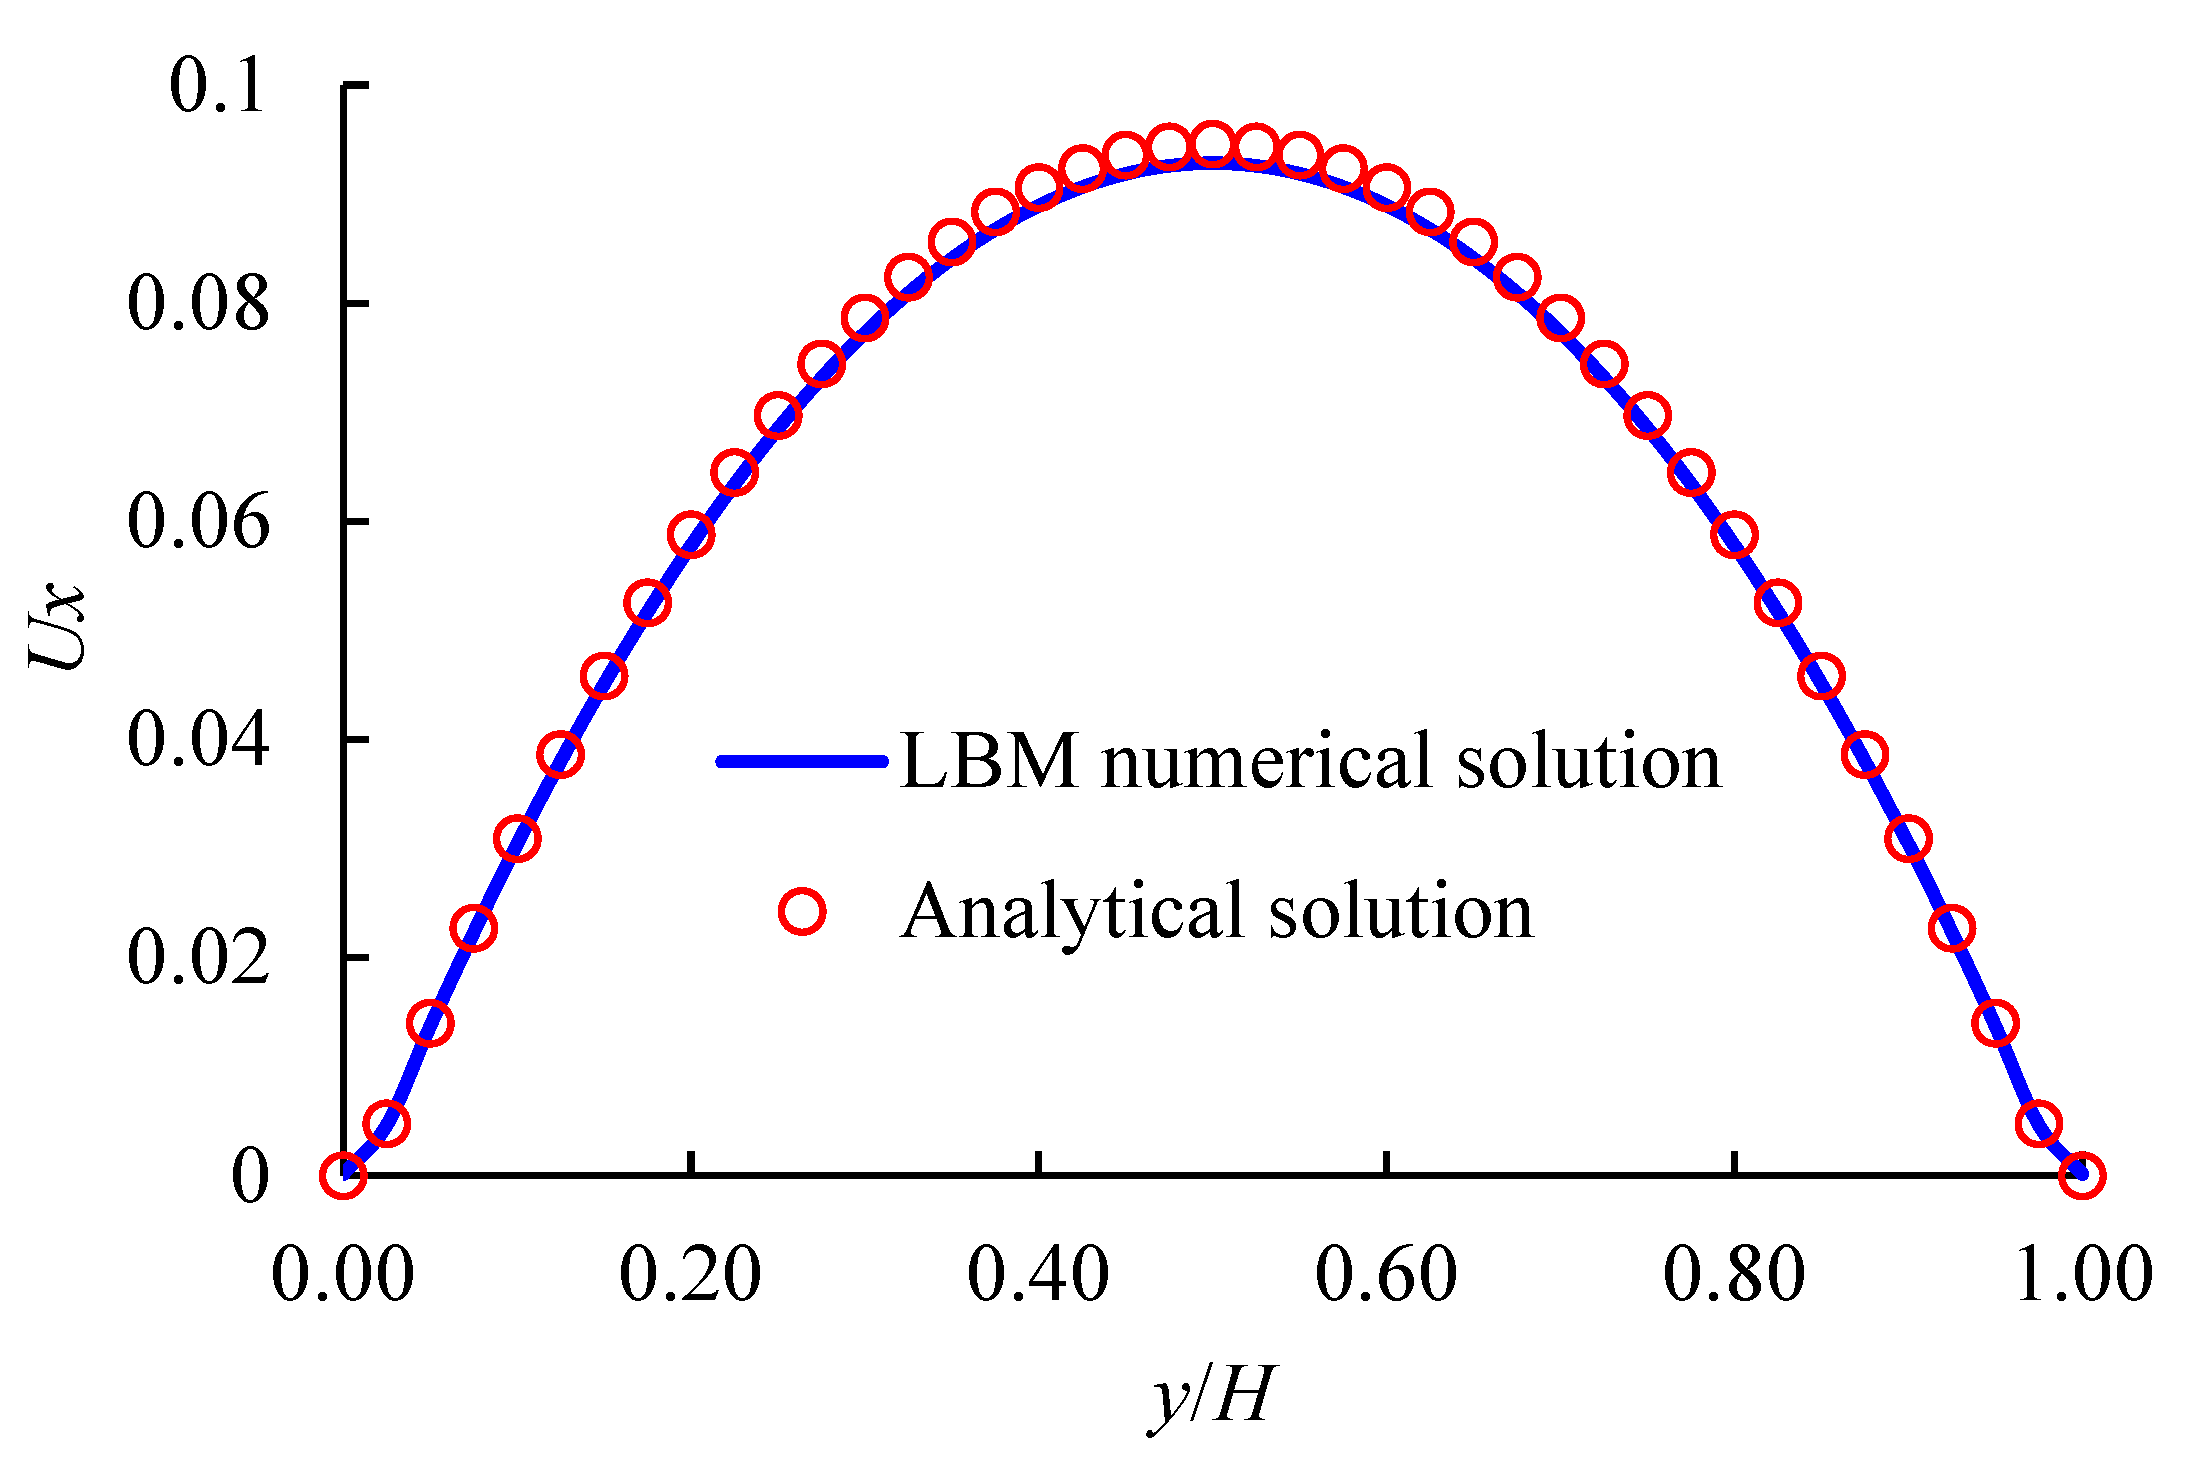
To simulate the two-dimensional Poiseuille flow, the densities at the inlet and outlet were set as 1.01 and 1.00. The dimensionless relaxation time was 0.6, and the grid was divided as 200 × 40. Compared the obtained results with the analytical solutions [23] (Equation (10)), the results show that the two are basically consistent (Figure 4), indicating that the model is correct and reliable.
u x y = p i n p o u t l x 1 2 ρ 0 v h 2 2 y l y + 1 2 2

2.1.4. Applicability of the LBM Model

The pore-throat diameter of tight sandstone reservoirs ranges from 30 nm to 2000 nm [24,25,26], which belong to the micro- and nanoscale. The Knudsen number (Kn) is a parameter describing gas flow at the micro- and nanoscale of gas flow. It is the ratio of the molecular mean free path to the characteristic size [27,28]. In general, the larger Kn, the greater the mean free path of molecular motion, the less likely the gas molecules will collide with the tube wall, and the rarer the gas.
K n = λ H
λ = K T 2 π d 2 p
where λ is the molecular mean free path (m); H is the characteristic length of the micron tubes, and the inner diameter of micron tubes is taken (m); K is the Boltzmann constant (J/K), which is 1.38 × 10⁻²³; T is the temperature (K); d is the molecular diameter (m). Since methane gas represents tight gas in simulation, the value of d is 0.414 × 10⁻⁹; p is the pressure (Pa).
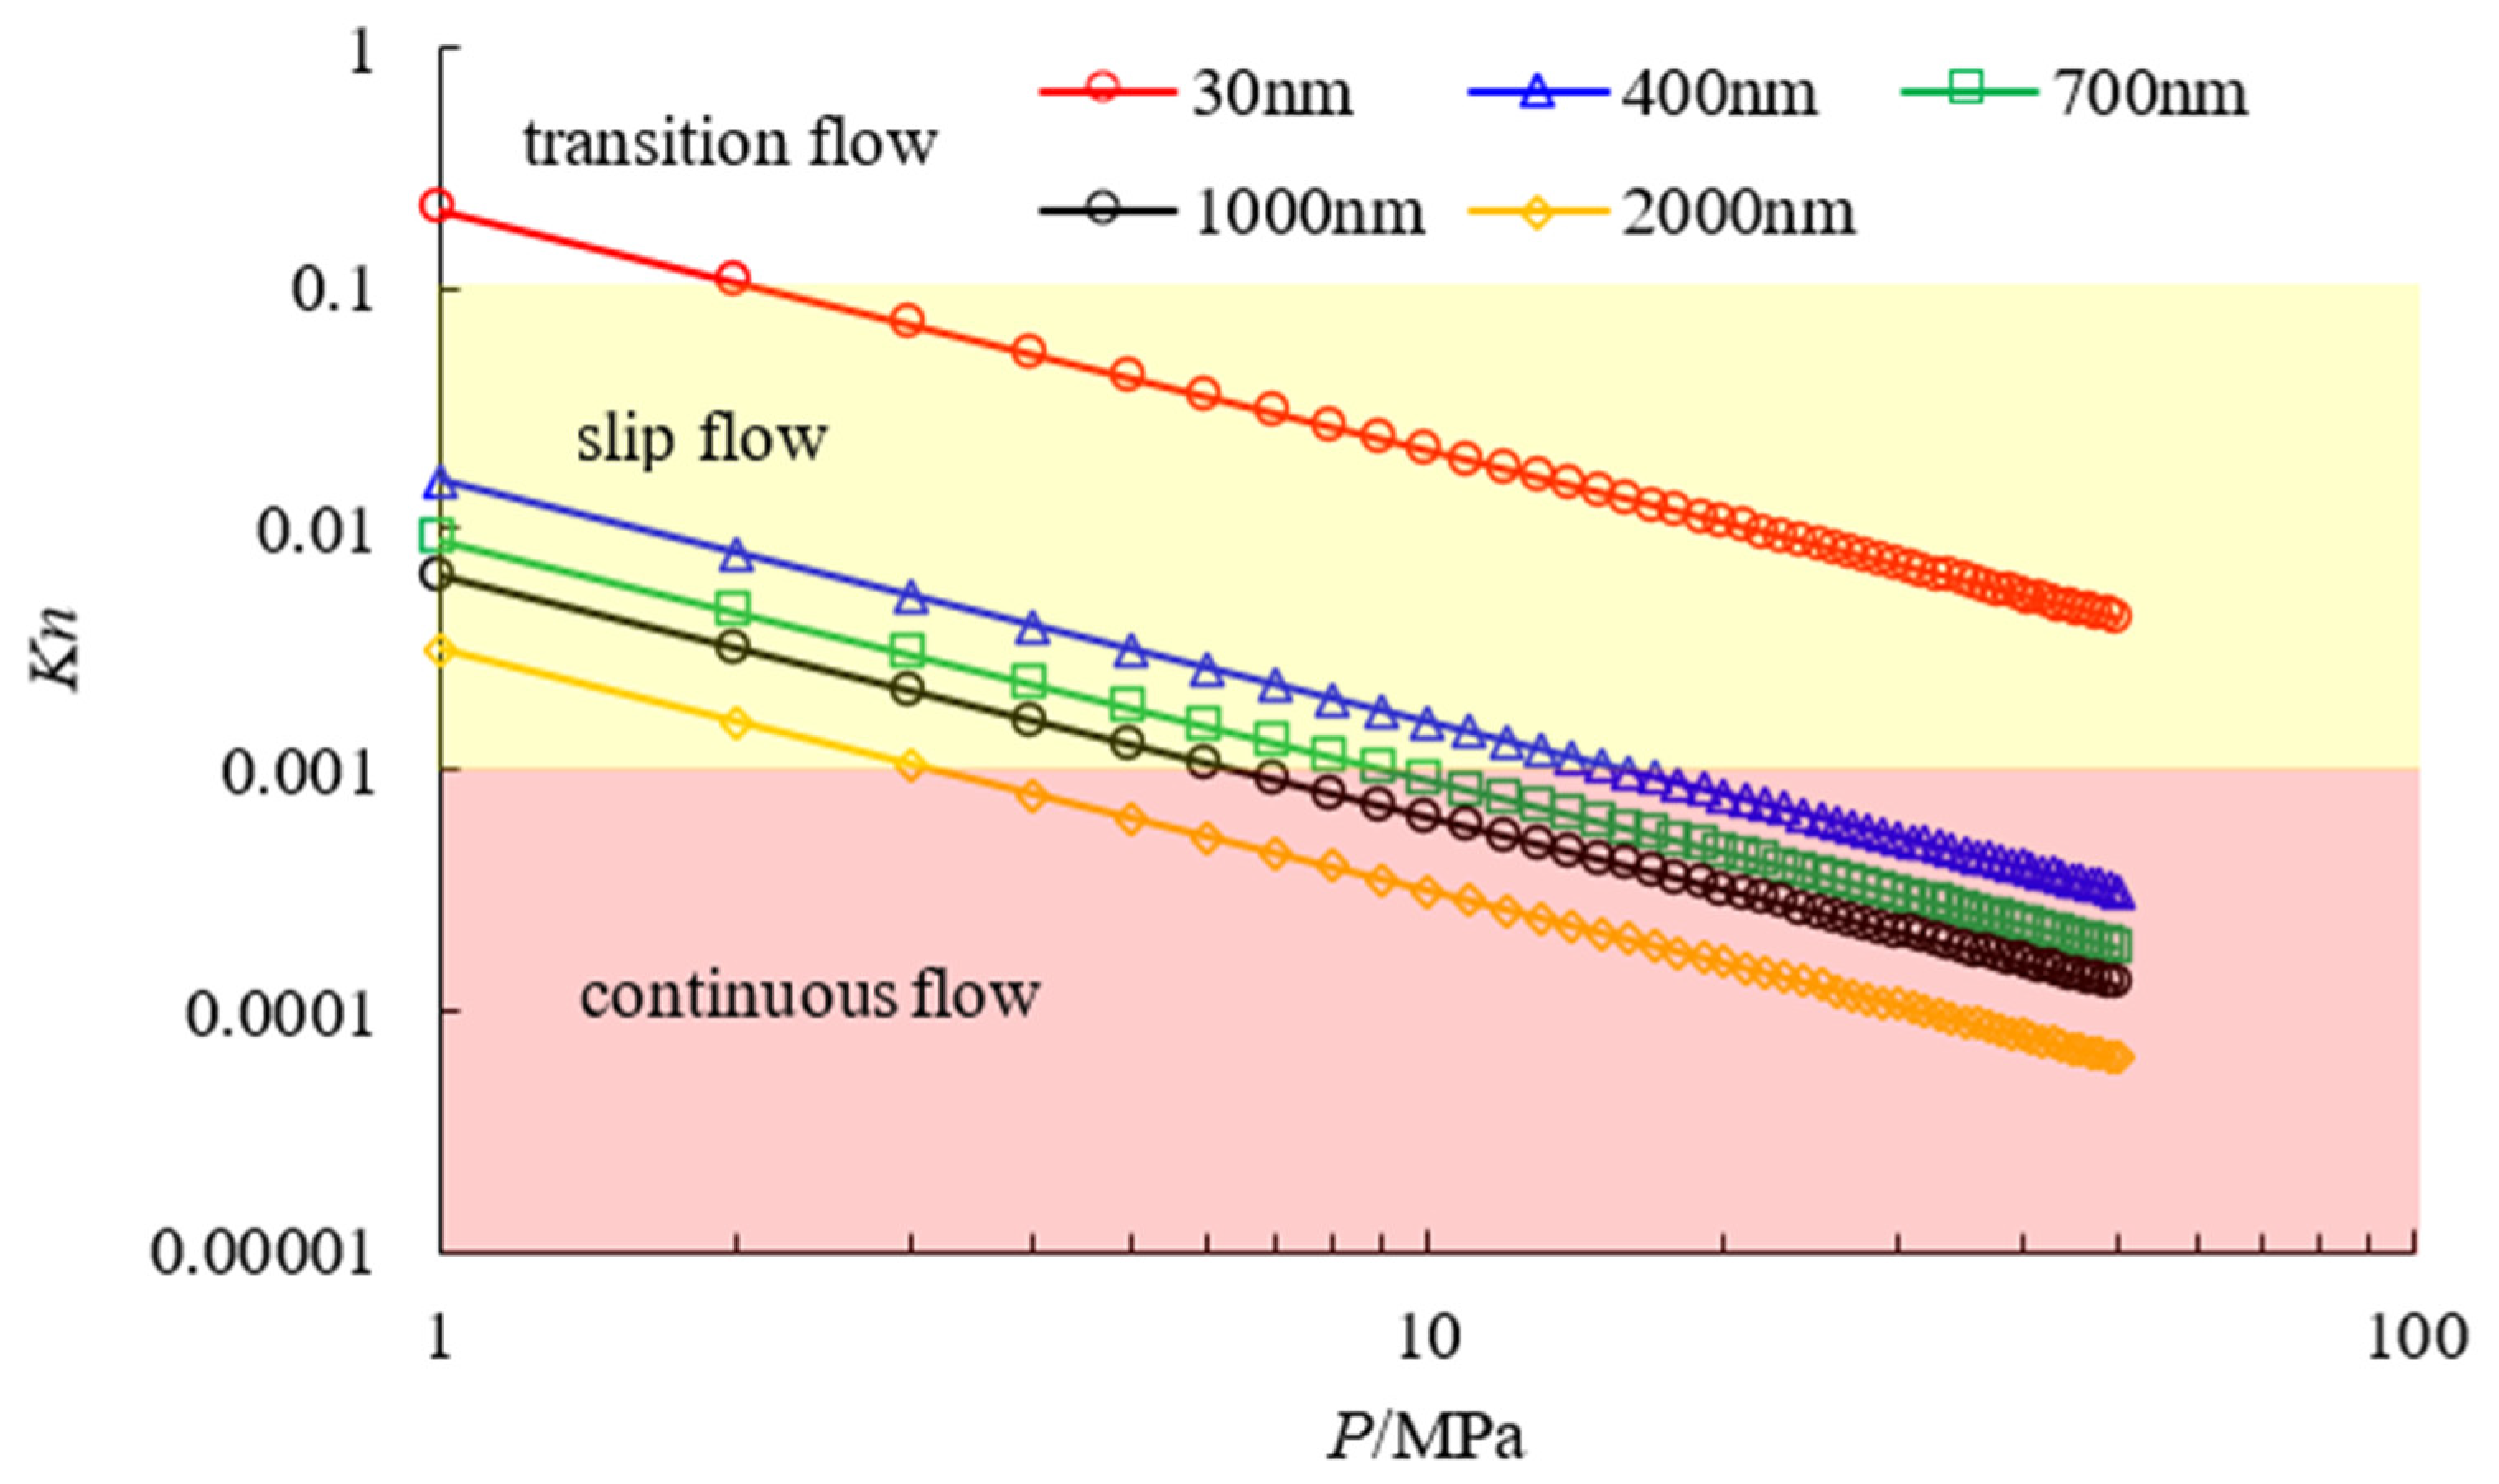
Generally, Kn as a benchmark can indicate one of four types of gas flow [29]: Kn ≤ 0.001 for continuous flow, where the medium is continuous; 0.001 ≤ Kn ≤ 0.1 for slip flow, where the medium can still be regarded as continuous, but the molecular free path and speed slip need to be considered. When the flow state is continuous flow or slip flow, the flow follows the Navier–Stokes equation. Transition flow is indicated by 0.1 ≤ Kn ≤ 1000, and Kn ≥ 1000 is molecular free flow. The continuum hypothesis is no longer valid for transition flow and molecular free flow.
In order to clarify the flow pattern of tight gas in reservoir pore throats and judge the applicability of the LBM for simulating tight gas flow in reservoir pore throats, the Kn variation curve for tight gas at high temperature (348.15 K) under different pressures (1–50 MPa) and reservoir pore-throat diameters (30, 400, 700, 1000, and 2000 nm) was plotted (Figure 5). It can be seen from Figure 5 that Kn is less than 0.1 in the range of pressure greater than 2 MPa, indicating that the gas flow state in the reservoir pore throats is continuous flow and slippage flow, and the probability of transition flow is very low. Therefore, LBM, as a numerical solution of the Navier–Stokes equation, is feasible and effective to simulate the flow of methane gas (tight gas) in micro and nano channels.

2.2. Microscale Gas Seepage Experiments

The percolation of fluid in the porous medium of a gas reservoir is a macroscopic manifestation, which can be regarded as the synthesis of percolation in the throats of numerous micro- and nanopores. The study of gas seepage in a single micron tube is beneficial for revealing the seepage mechanism and improving understanding of macroscopic seepage. The gas seepage in micron tubes with inner diameters of 2, 5, and 10 µm was simulated using a new high-pressure seepage experimental technology.
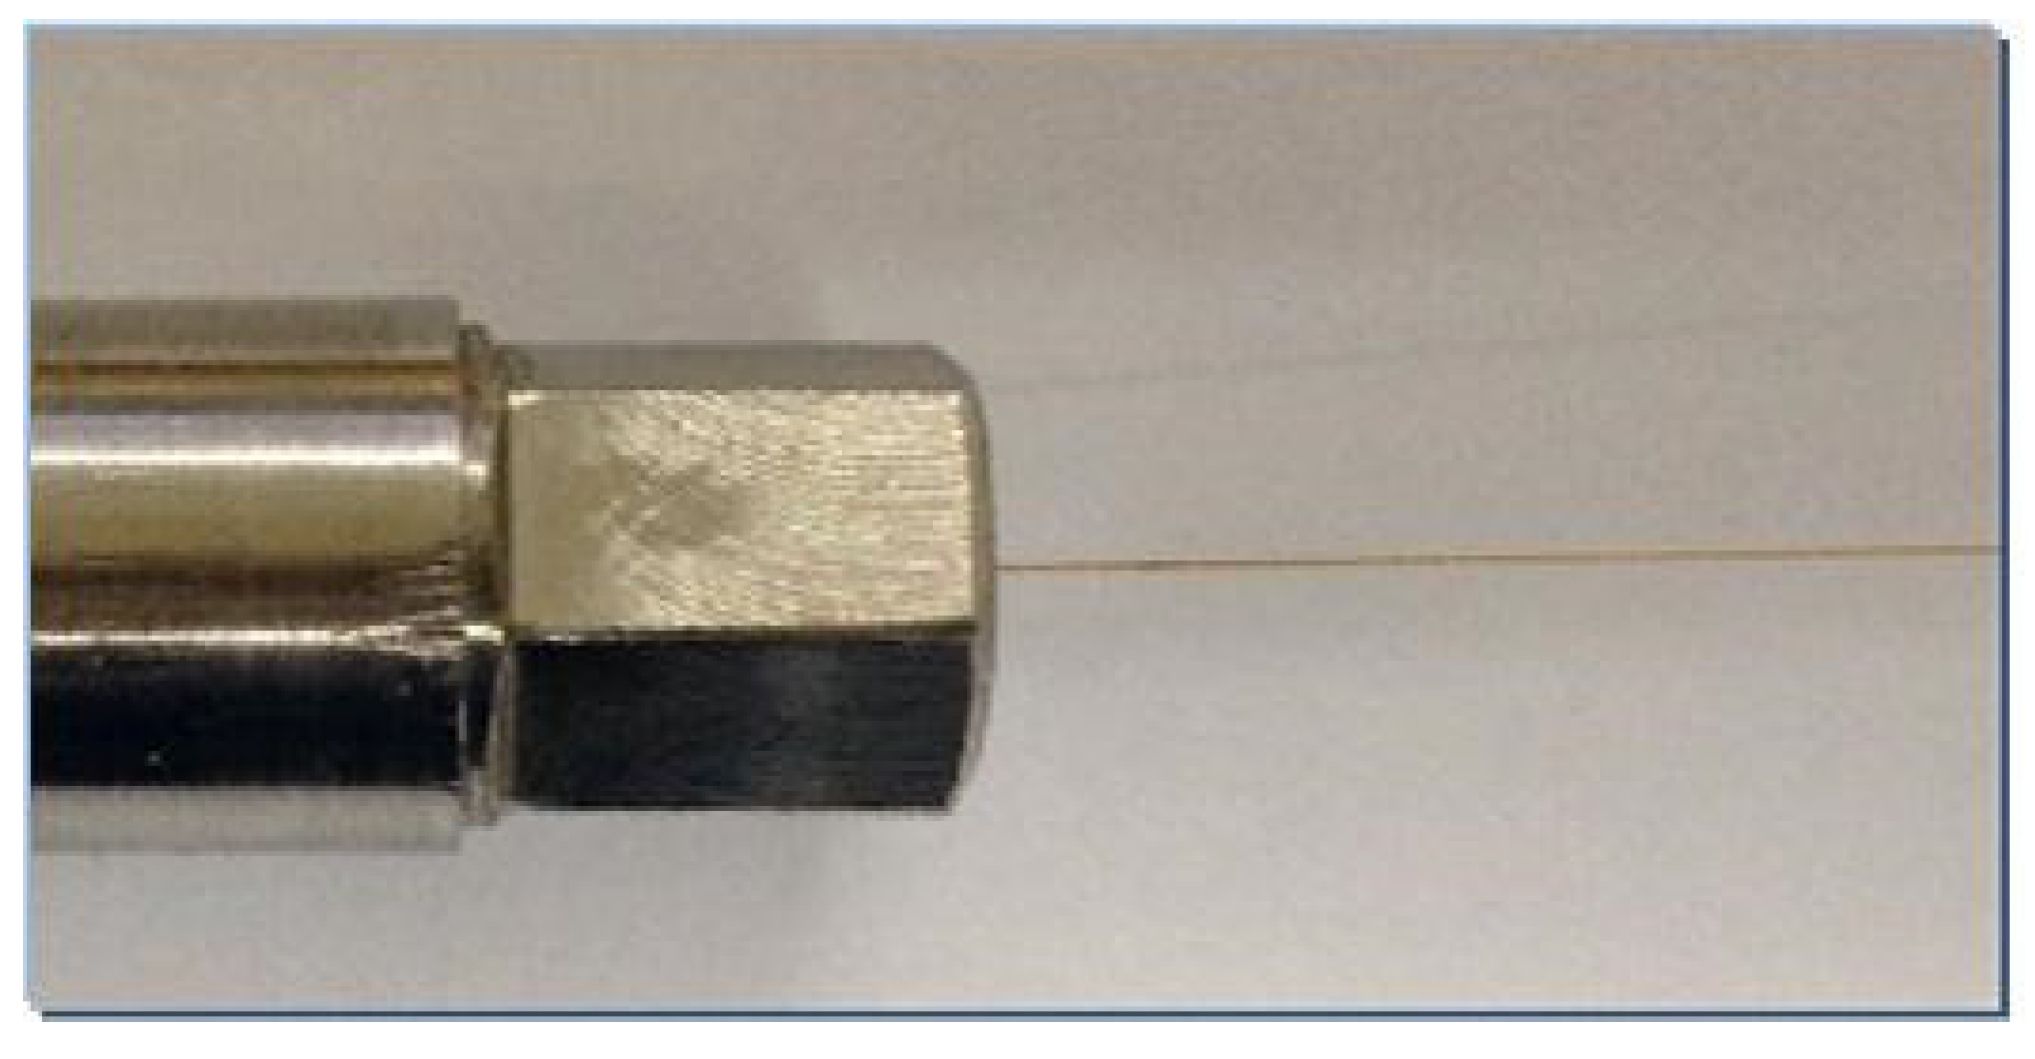
The experimental flow of micron tube gas seepage is shown in Figure 6. The pressure was provided by a displacement pump, so the high-pressure pure nitrogen passes through the gas storage tank and enters the pressure-reducing valve. The pressure-reducing valve reduces the pressure to that required and ensures stable flow before entering the micron tube. The gas flow rate was measured many times by the drainage method [30], and the pressure change at the inlet of the micron tube was recorded in real time by a pressure sensor. The whole experiment process was carried out in an incubator to eliminate the influence of temperature on the results. The microcircular tube used in this experiment was made of fused quartz capillary series products made by PolyMicro Company, the outer wall of which is coated with a polyimide coating [31], ensuring that the microcircular tube has good flexibility and sufficient strength. A high-pressure (30 MPa) micron tube gripper [32], independently designed and developed by the Institute of Porous Flow & Fluid Mechanics, Chinese Academy of Sciences, realized the cross-scale connection between the micron tube and the conventional experimental setup (Figure 7).

3. Results and Discussion

3.1. Experimental Results and Analysis

Gas seepage simulation experiments using micron tubes with inner diameters of 2, 5, and 10 µm and a length of 4 cm were carried out to explore the relationship between gas flow and pressure gradient (Figure 8). With an increasing pressure gradient, the flow rate presents a nonlinear increase, and the larger the inner diameter, the greater the flow rate. At low pressure gradients, the flow rate increases gently, and as the pressure gradient increases gradually, the flow rate increases more rapidly.
The gas flow in micron tubes with different inner diameters calculated by LBM simulation were compared with the experimental results obtained above (Figure 8). Irrespective of the inner diameter of the micron tube, when the pressure gradient is lower than 500 MPa/m, the results obtained by LBM simulation are basically consistent with the experimental data. In the microtube with an inner diameter of 2 µm, the deviation at some points is relatively large, and such deviation is within the acceptable range due to the nonlinear influence of high-pressure gas and the limitation of experimental measurement technology.
In order to compare with the classic Hagen–Poiseuille equation [33] in fluid mechanics, gas flow rates corresponding to micron tubes with different diameters under pressures of 5, 10, 15, 20, 25, and 30 MPa were selected respectively, and Origin drawing analysis software was used to fit the data. The results are shown in Figure 9, and the correlation coefficients of the fitted curves are all above 0.97, indicating that the gas flow rate is proportional to the fourth power of the pipe diameter, which is consistent with the Hagen–Poiseuille equation.
Because the experimental data for a single micron tube only reflect the macroscopic seepage state of the whole micron tube, they cannot reflect the seepage characteristics of the gas inside the micron tube. In order to analyze the characteristics of gas flow in different positions of micron tubes, series experiments were designed and performed. Five micron tubes with the same inner diameter were connected in series to study their pressure distribution characteristics (Figure 10). With increasing inlet pressure, the degree of nonlinear pressure distribution along the path becomes stronger. The nonlinearity of pressure distribution is mainly related to compression and rarefication effects [20]. The compression effect makes the pressure distribution appear nonlinear, while rarefication has the opposite effect. The compression effect is related to the Ma number, and the rarefication effect is related to the Kn number. The lower the inlet pressure, the lower the Ma number, which weakens the compression effect, and the higher the Kn number, which enhances the rarefication effect, making the rarefication effect more significant relative to the compression effect. Conversely, a higher inlet pressure increases the Ma number, strengthening the compression effect, and reduces the Kn number, weakening the rarefication effect, so the compression effect becomes more significant than the rarefication effect. Therefore, when the outlet pressure remains unchanged, a low inlet pressure weakens the nonlinearity of the pressure distribution, whereas a high inlet pressure increases the nonlinearity of the pressure distribution.

3.2. LBM Simulation of Gas Seepage in Parallel Micron Tubes

The pore throats of tight reservoirs can be regarded as consisting of a large number of micro/nanotubules with different diameters. Adjacent micron tubes are either disconnected or interconnected. In this study, the LBM model was used to analyze the gas seepage for both disconnected and interconnected micron tubes.

3.2.1. Disconnected Micron Tubes

Taking three micron tubes in parallel as an example, LBM simulation of micron tubes with equal diameters and micron tubes with unequal diameters was performed. The grid divisions used in the simulation were N x × N y = 200 × 32 and N x × N y = 200 × 44 . As shown in Figure 11, the red parts represent the solid walls and the blue parts represent the micron tubes. The wall thickness was 4 grids, the diameter of the equal-diameter micron tubes was 8 grids, and the diameters of the unequal-diameter micron tubes were 8, 12, and 16 grids, respectively. The density at the inlet ρ i n was set to be 1.01, and the density at the outlet ρ o u t was set to be 1.00. The non-dimensional relaxation times were set to 0.505 and 0.51. The non-slip LBGK-D2Q9 model was adopted to simulate gas seepage without considering the influence of a boundary Knudsen layer.
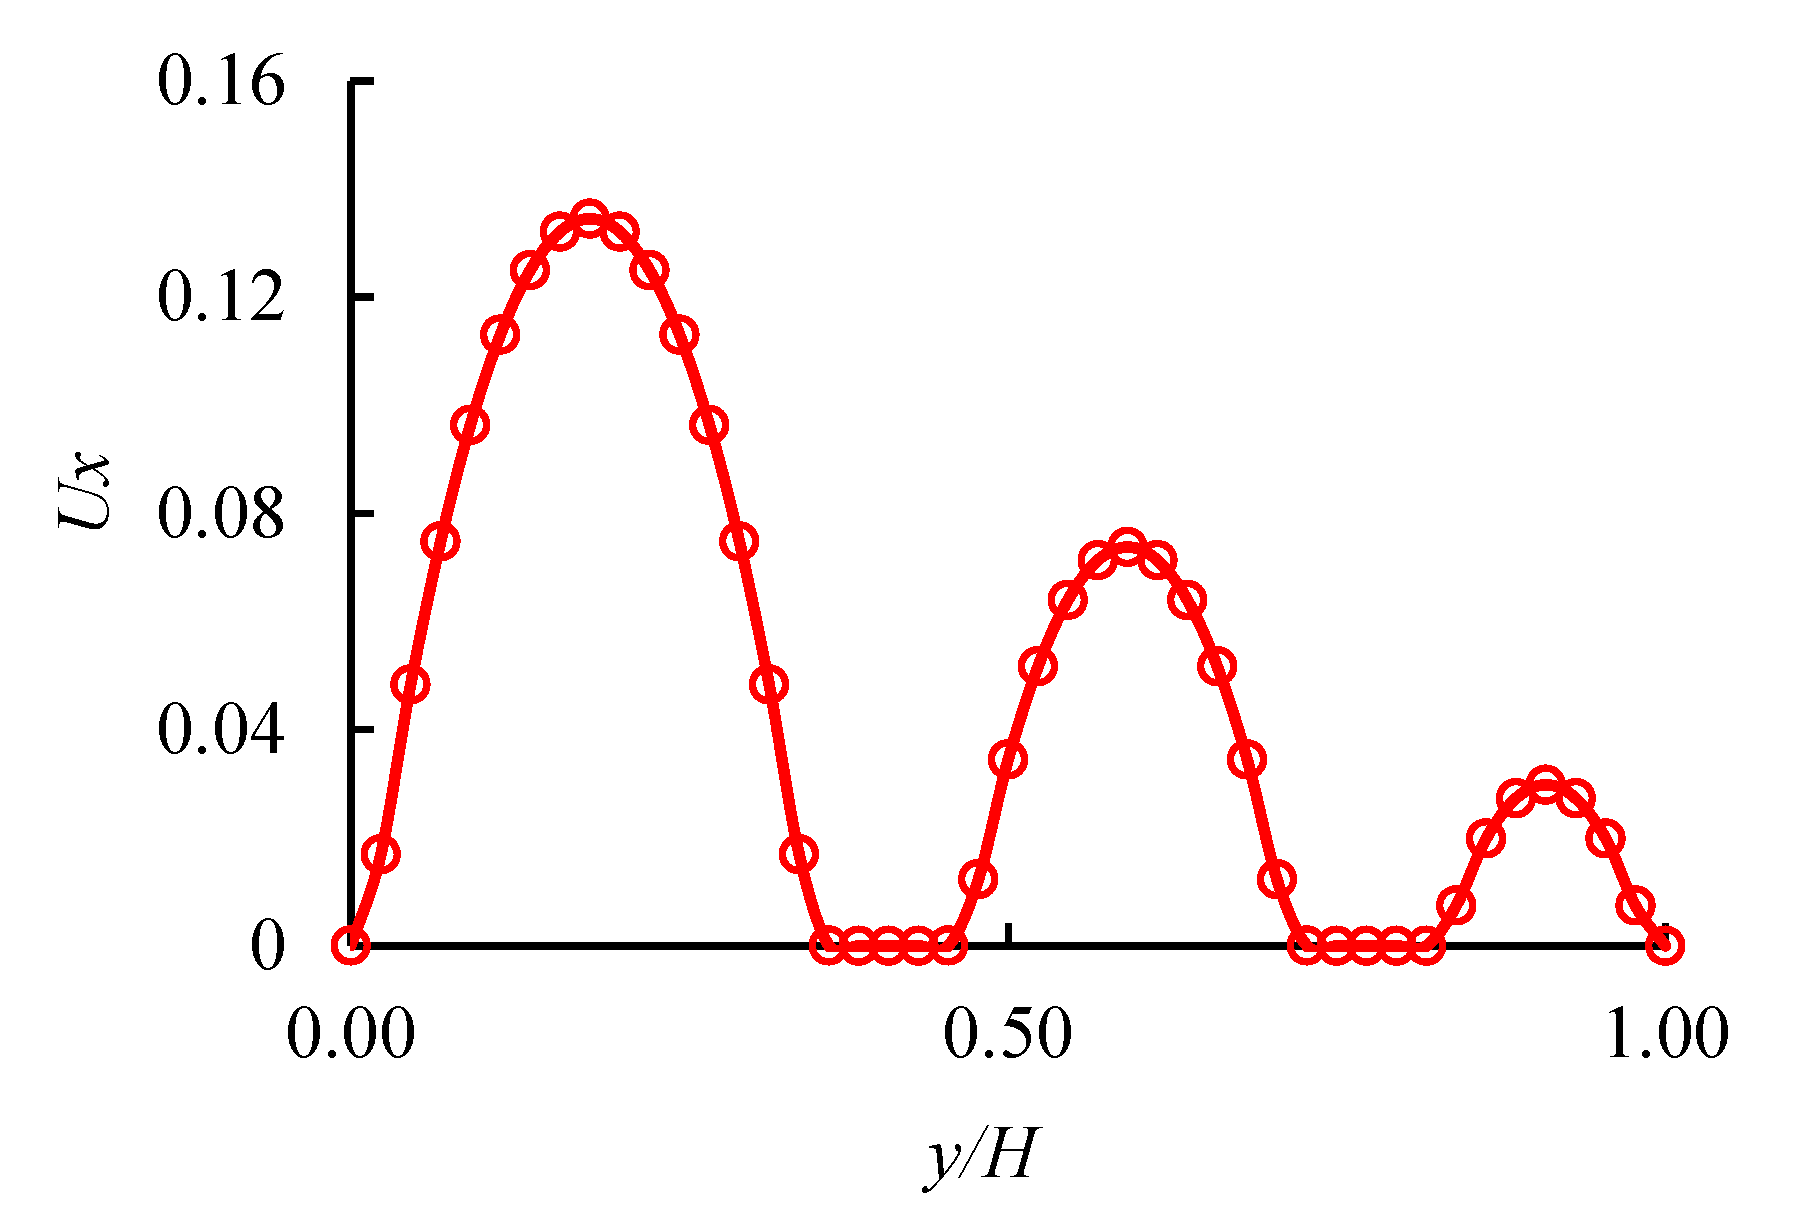
The simulations were performed over 60,000 time steps to ensure that the seepage reached a stable state. The seepage state at 1000 steps was selected for analysis (Figure 12). The larger the micron tube diameter, the faster the fluid flow velocity, and the stabilized flow velocity also increases with an increase in micron tube diameter (Figure 13). This phenomenon is also consistent with the fact that fluid preferentially passes through large micron tubes in a reservoir. In order to quantitatively analyze the relationship between gas velocity and pipe diameter, the velocity at the center of each micron tube was selected, and the curve for the relationship between velocity and pipe diameter was fitted (Figure 14). There is an exponential relationship between gas velocity in the micron tube and the diameter of the tube, and the exponent is ~2, which is also consistent with the analytical solution of Equation (12).

3.2.2. Interconnecting Parallel Micron Tubes

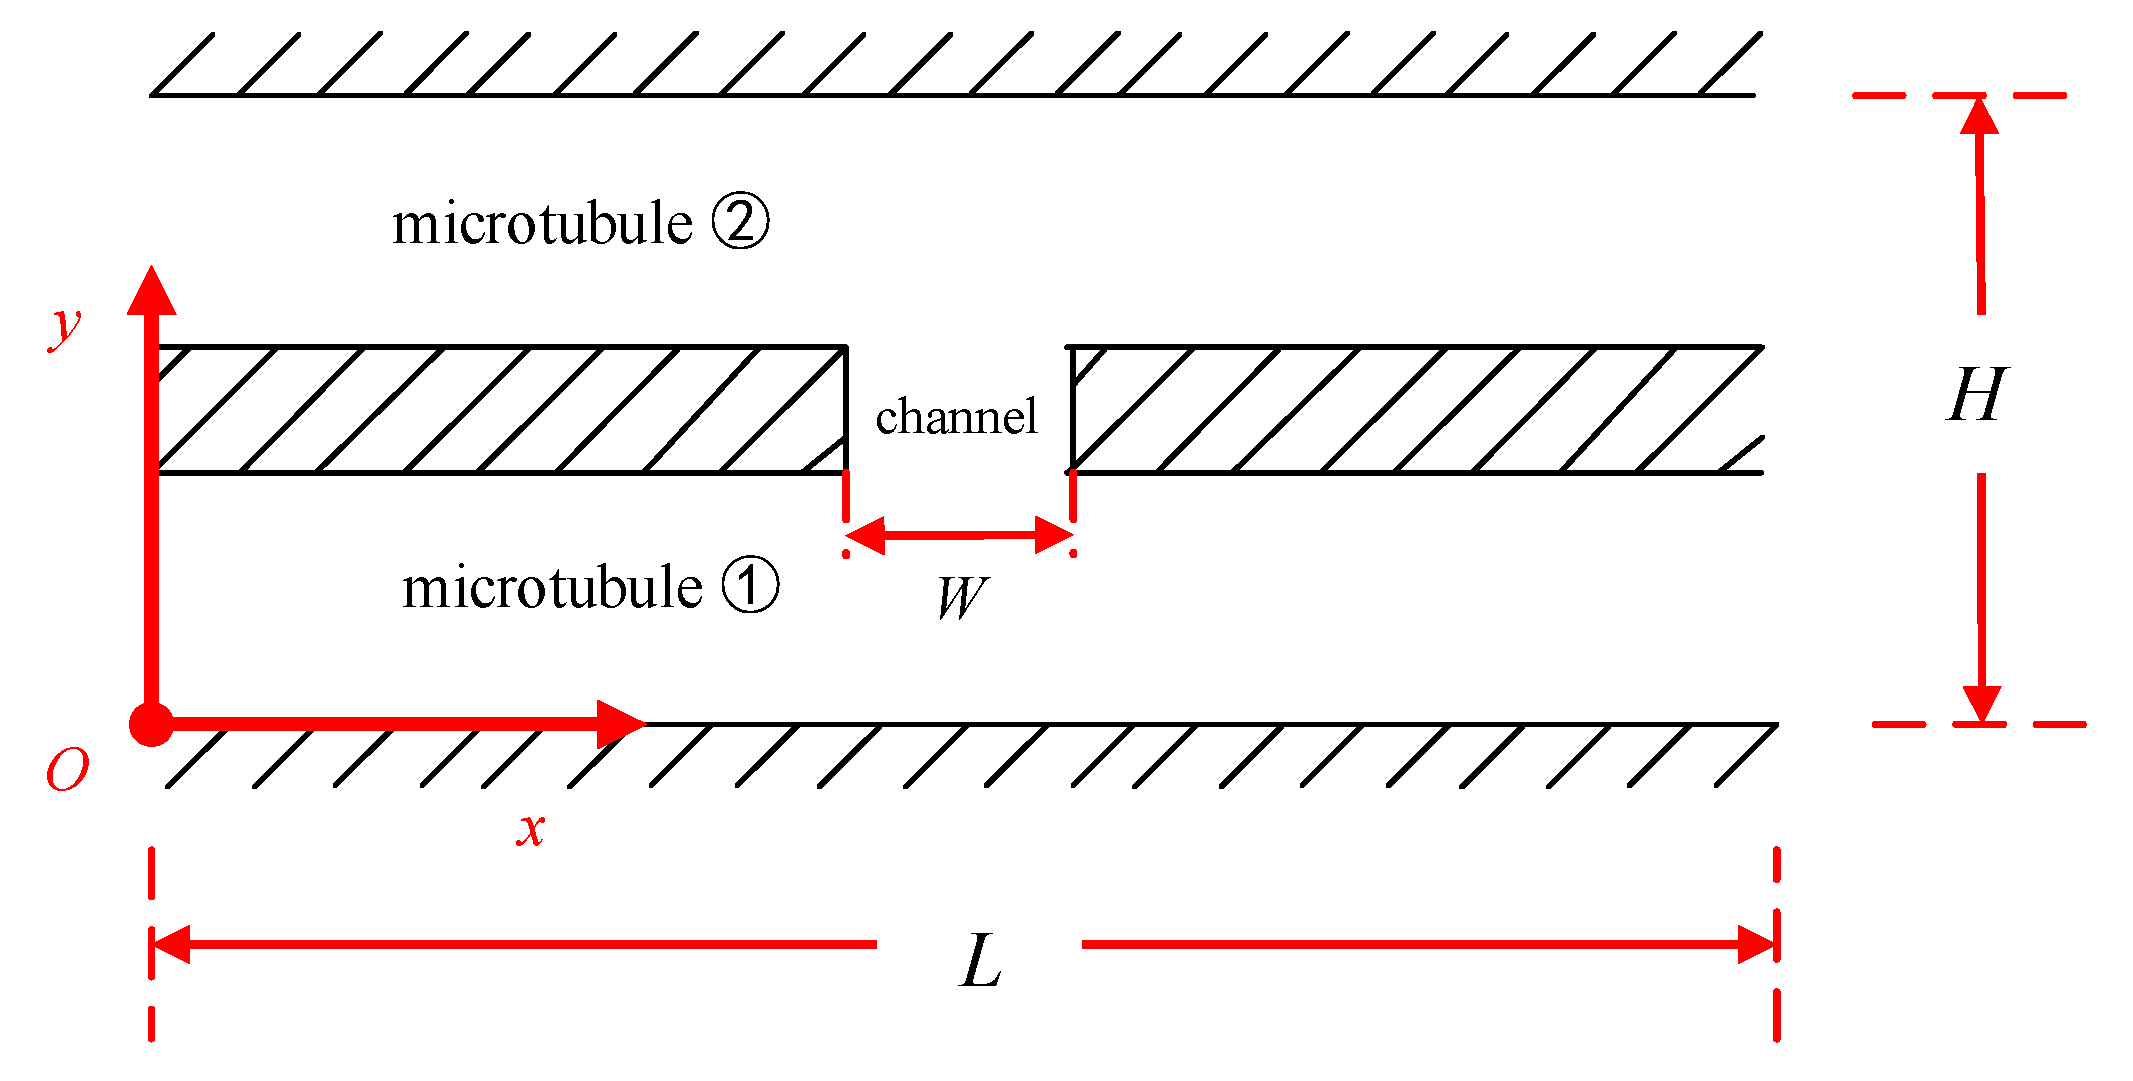
In order to facilitate the study of the influence of connected channels on tight gas flow in interconnected parallel micron tubes, the following LBM model was established, where a connecting channel between two micron tubes was established in the middle position, as shown in Figure 15.

Influence of Channel Width on Seepage

A differential pressure drive was adopted, where the density at the inlet ρ i n was set to 1.01, the density at the outlet ρ o u t was set to 1.00, the non-dimensional relaxation time was set to 0.51, and the number of simulation time steps was set to 20,000, which was sufficient to ensure the stability of seepage flow. The grid was divided into N x × N y = 100 × 20 . The pressure and velocity distribution for unconnected parallel micron tubes (corresponding channel width W = 0) and channel widths of 10, 20, 30, 40, and 50 were analyzed.
As shown in Figure 16, when W = 0, the gas pressure presents a linear distribution along the x-direction. When there is a channel, the linear distribution law is no longer maintained. The gas forms an area of relatively high pressure at the location of the channel, and the pressure increases along the x-direction instead of decreasing. Furthermore, the wider the channel width, the higher the pressure. At the end of the channel, the pressure drops and rapidly approaches the pressure distribution curve of the unconnected parallel micron tubes. As the width of the channel increases, the gas pressure drops faster before it reaches the channel. Due to the existence of the channel, the pressure increases instead of decreases and the degree of nonlinear distribution increases the resistance to gas seepage at the channel to a certain extent, slowing the gas seepage at this position.
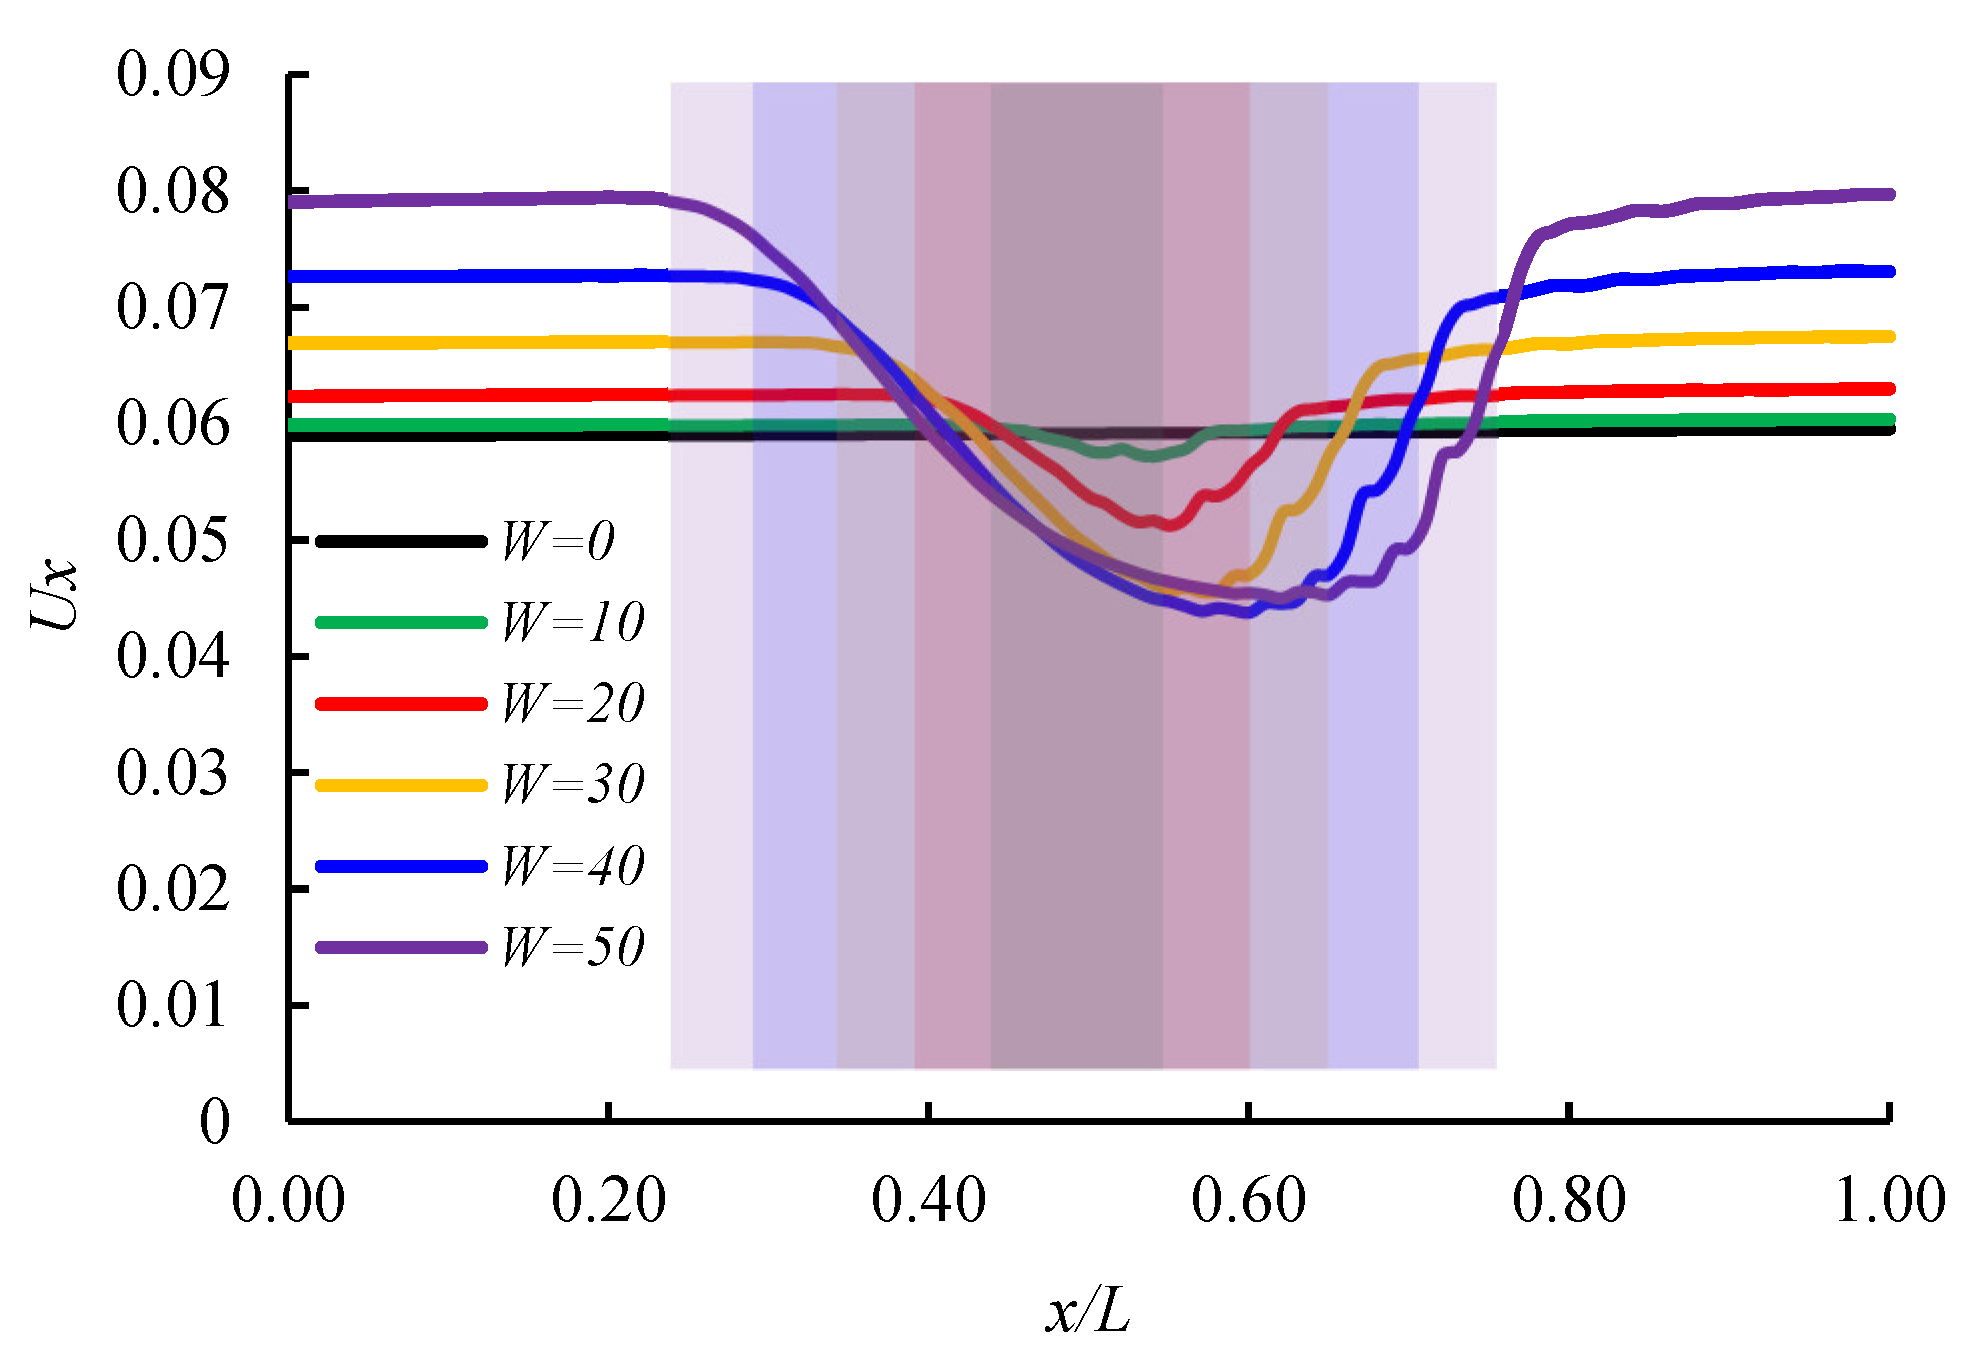
The x-direction velocity (Ux) in unconnected parallel micron tubes has the same magnitude at every position in the x-direction (Figure 17). When there is a channel between two micron tubes, Ux no longer maintains a fixed value and decreases at the channel. With increasing channel width, the degree of this drop increases. In addition, the velocity on each side of the channel no longer maintains its original value, gradually increasing with the increasing width of the channel. In order to quantitatively analyze the influence of channel width on gas flow velocity in interconnecting parallel micron tubes, the velocity Ux at the outlet of the micron tube and the percentage of velocity decline at the center of the micron tube with channel width were plotted (Table 1, Figure 18). Due to the existence of the channel, the gas from the inlet and the gas from the channel interfere with each other, and the speed decreases. When W = 50, the speed falls to 43.45%. Meanwhile, the velocity on each side of the channel increases from 0.06 when W = 0 to 0.08 when W = 50.
After the distribution law for Ux along the x-direction was defined, a profile of Ux along the y-direction at the center of the channel (x/L = 0.5) was drawn in order to study its distribution along the y-direction (Figure 19). With increasing channel width, the gas seepage velocity peaks in the upper and lower micron tubes at the center of the channel gradually move closer to the middle. In addition, increasing the width of the channel also results in increased Ux in the channel range. It is believed that with the widening of the channel, the gas interaction and confluence trend of the upper and lower micron tubes become more pronounced, and more gas enters the channel, which eventually leads to the gas flow rate at the channel increasing, while the peak flow rate at both sides moves closer to the center.
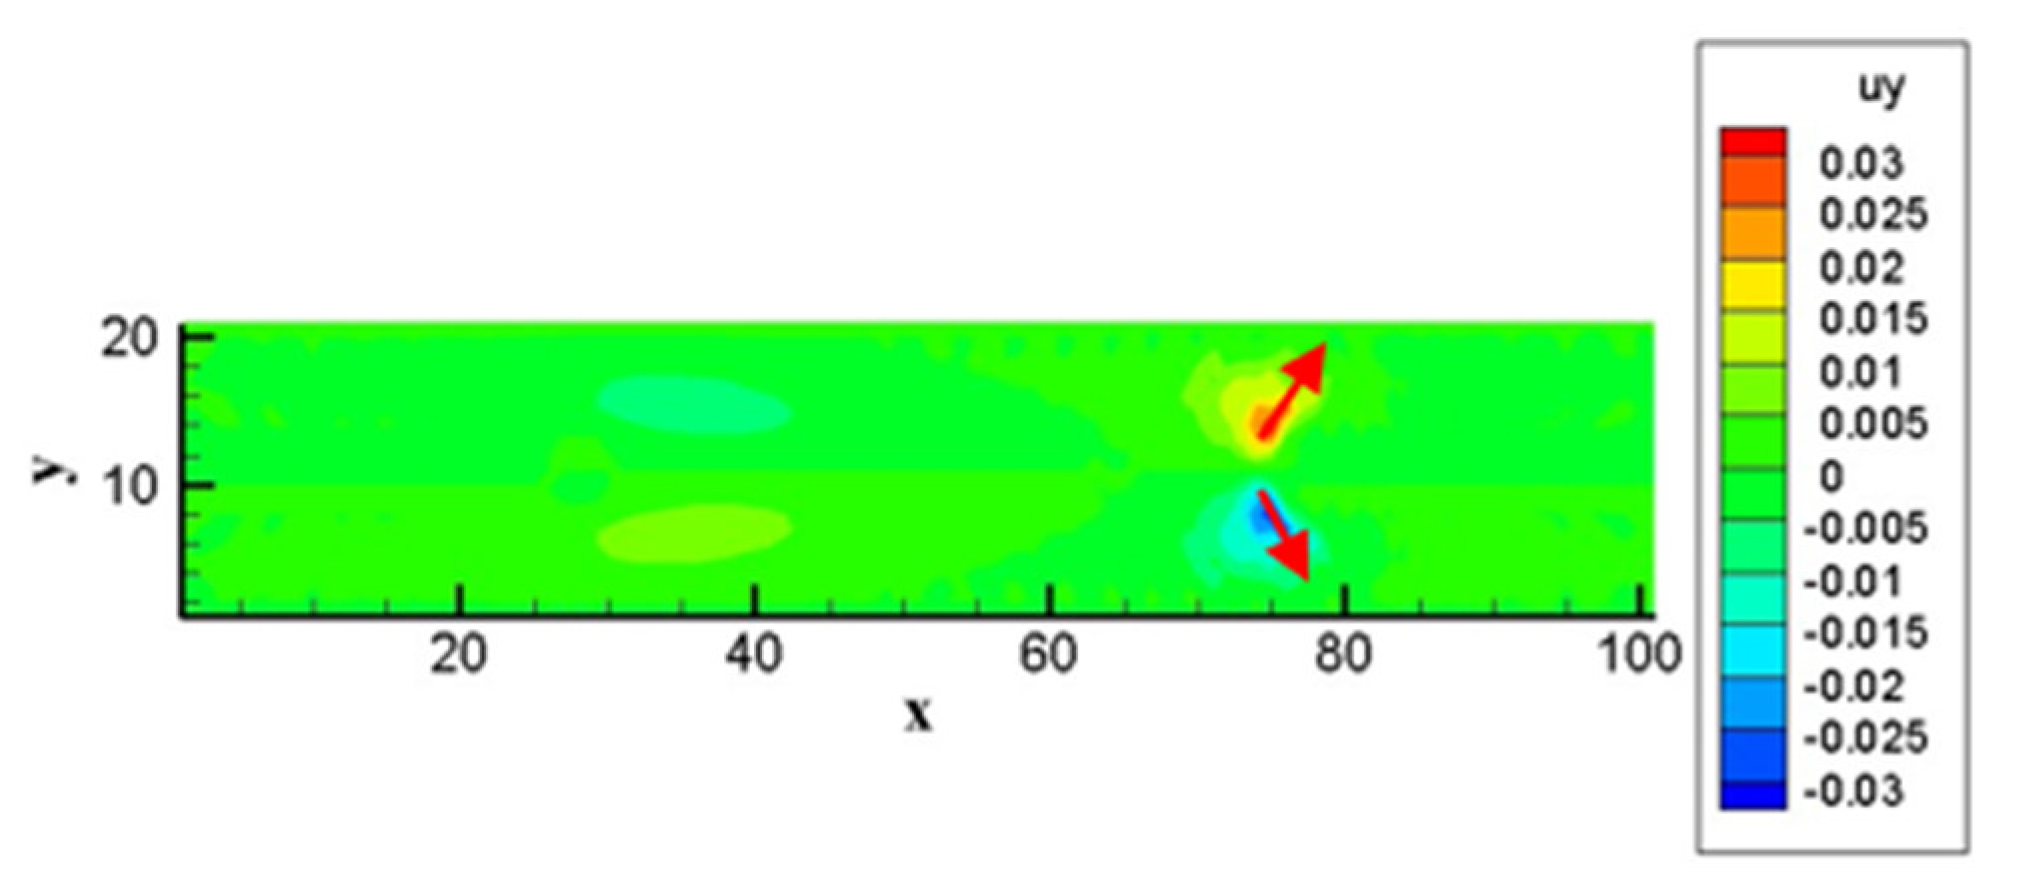
Due to the existence of the channel, velocity (Uy) in the y-direction becomes inevitable. Figure 20 shows the Uy distribution for the entire parallel micron tube after the seepage reaches a stable state for a channel with W = 50. It can be seen that Uy is mainly concentrated at the end of the channel, and the gas seepage from the channel to the micron tubes on both sides forms a high y-direction velocity. In order to better study the distribution law of Uy, the Uy velocity profiles for the end of the channel under different channel widths were drawn (Figure 21). There is no y-direction flow rate in the disconnected micron tubes. When there is a channel, the gas will first confluence and then diverge, resulting in the formation of two Uy high-speed regions at the ends of the channel. As the channel widens, the gas diverts to both sides of the micron tubes more quickly.
In order to better evaluate the influence of the channel and its width on the seepage capacity of gas in parallel micron tubes, the inlet end, the outlet end, and two places in the channel were selected to calculate the gas flow, and the gas flow for different widths was compared with the gas flow for the disconnected micron tube. Based on the gas flow in the disconnected micron tube, the percentage change of flow rate under different channel widths was calculated (Table 1, Figure 22). With increasing channel width, the average gas flow rate in the interconnected parallel micron tubes increases, and the wider the channel is, the more obvious the growth potential is. When W = 50, the flow rate is increased by 39.57% compared with the unconnected micron tubes. Although the existence of the channel leads to a decrease in flow velocity at the channel, it also increases the seepage area in a disguised way. Therefore, the flow rate increases, and the gas seepage capacity increases instead of decreases.

Influence of Pore Size Ratio on Seepage

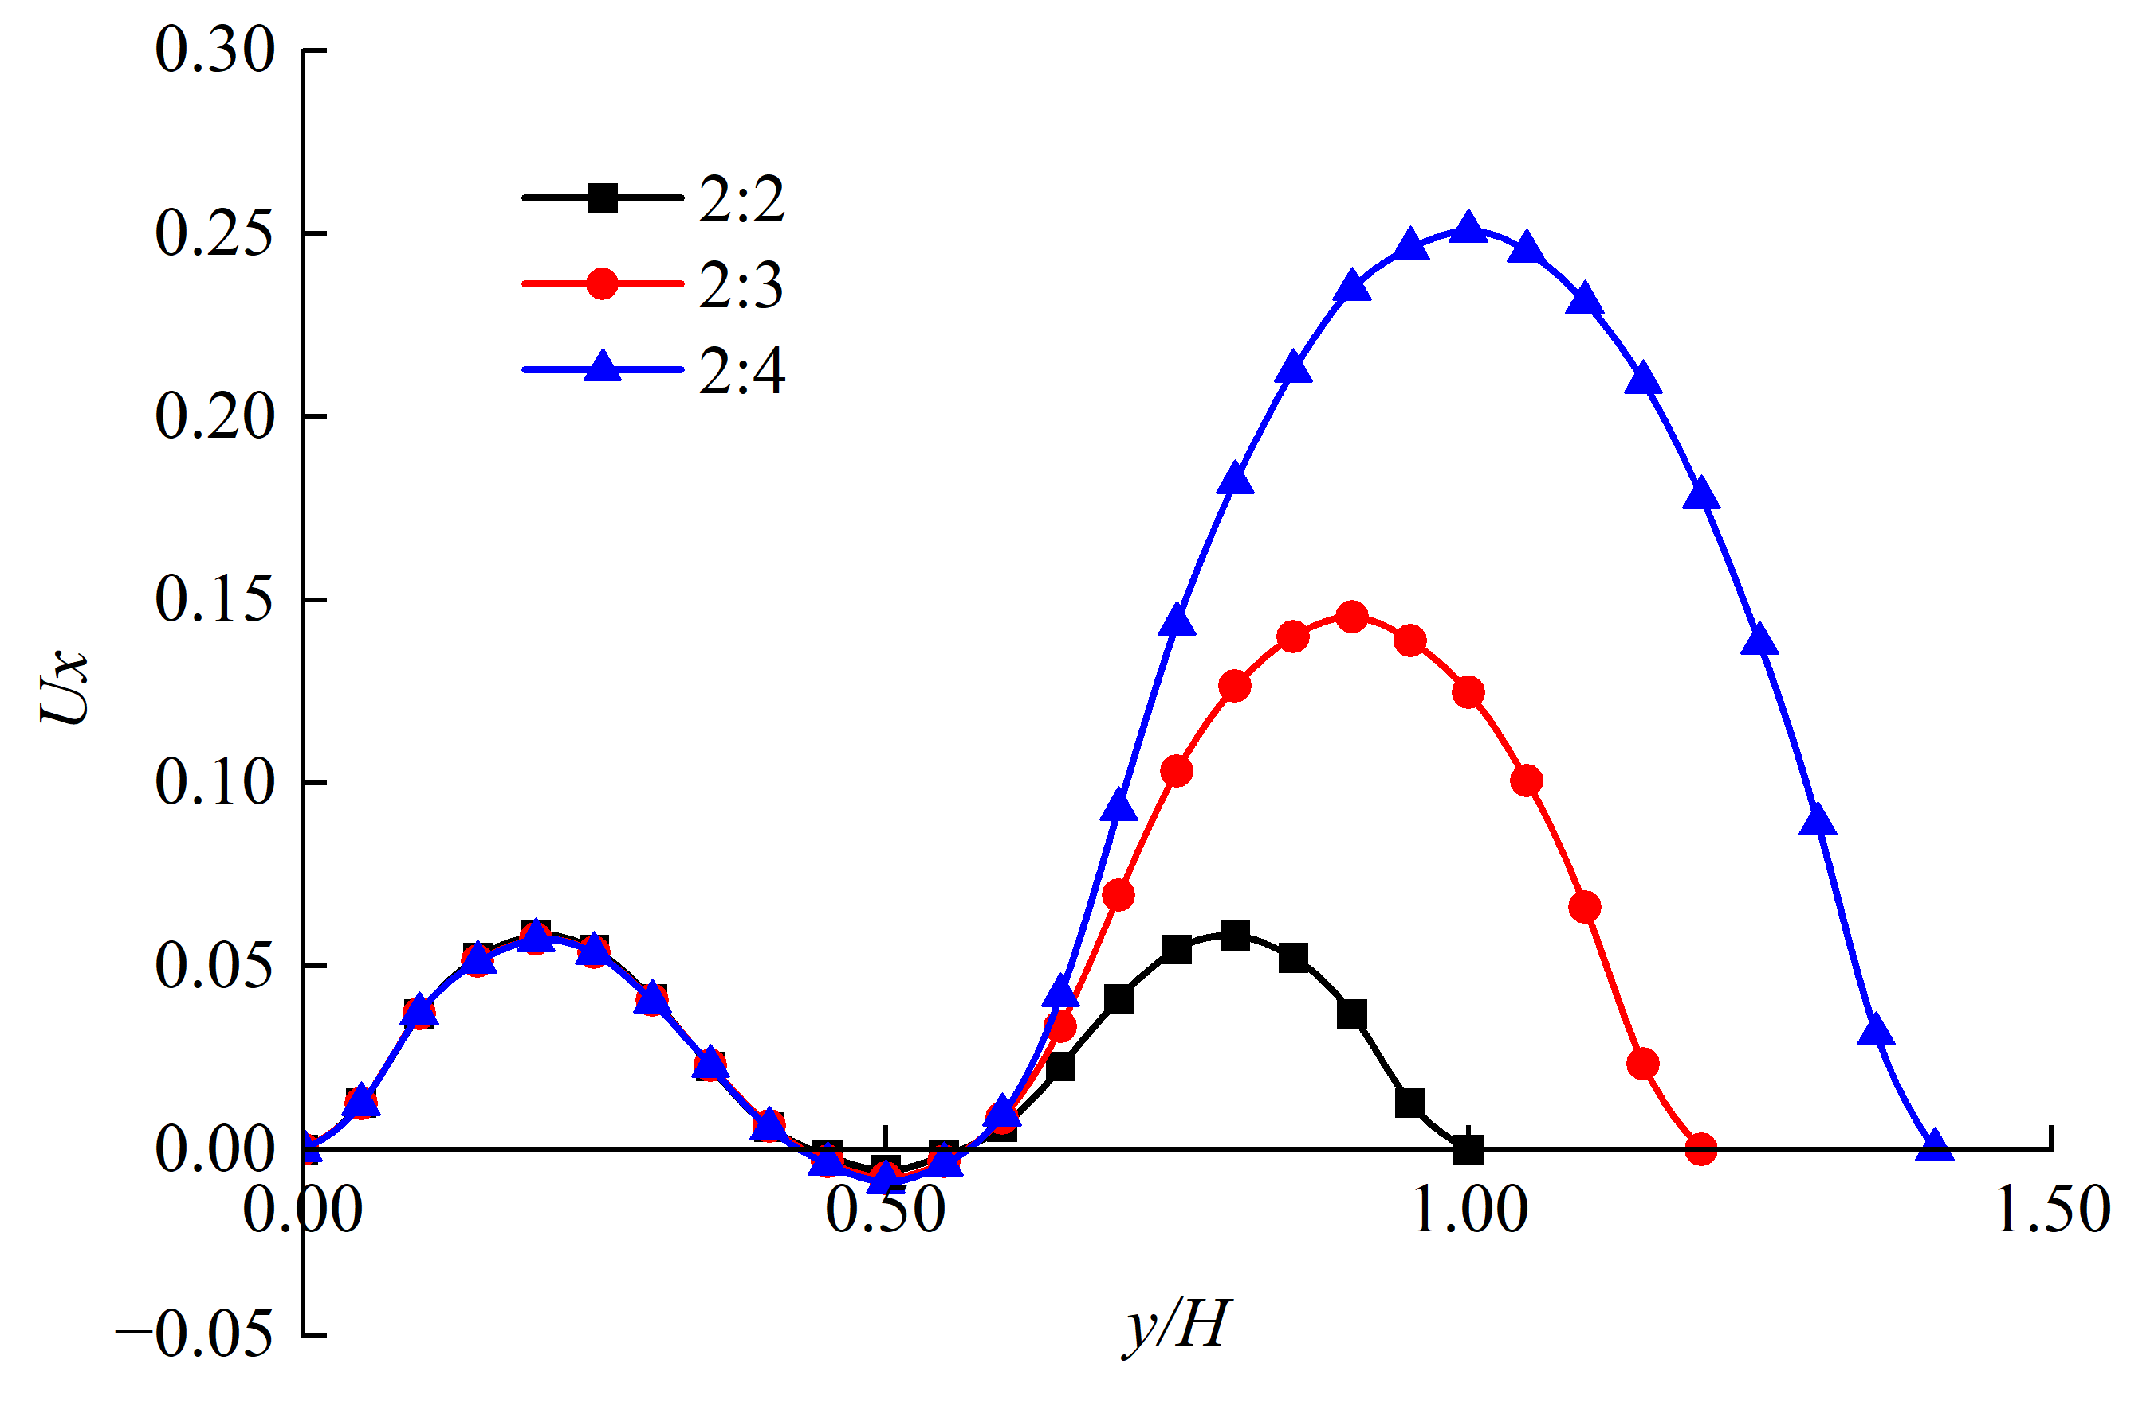
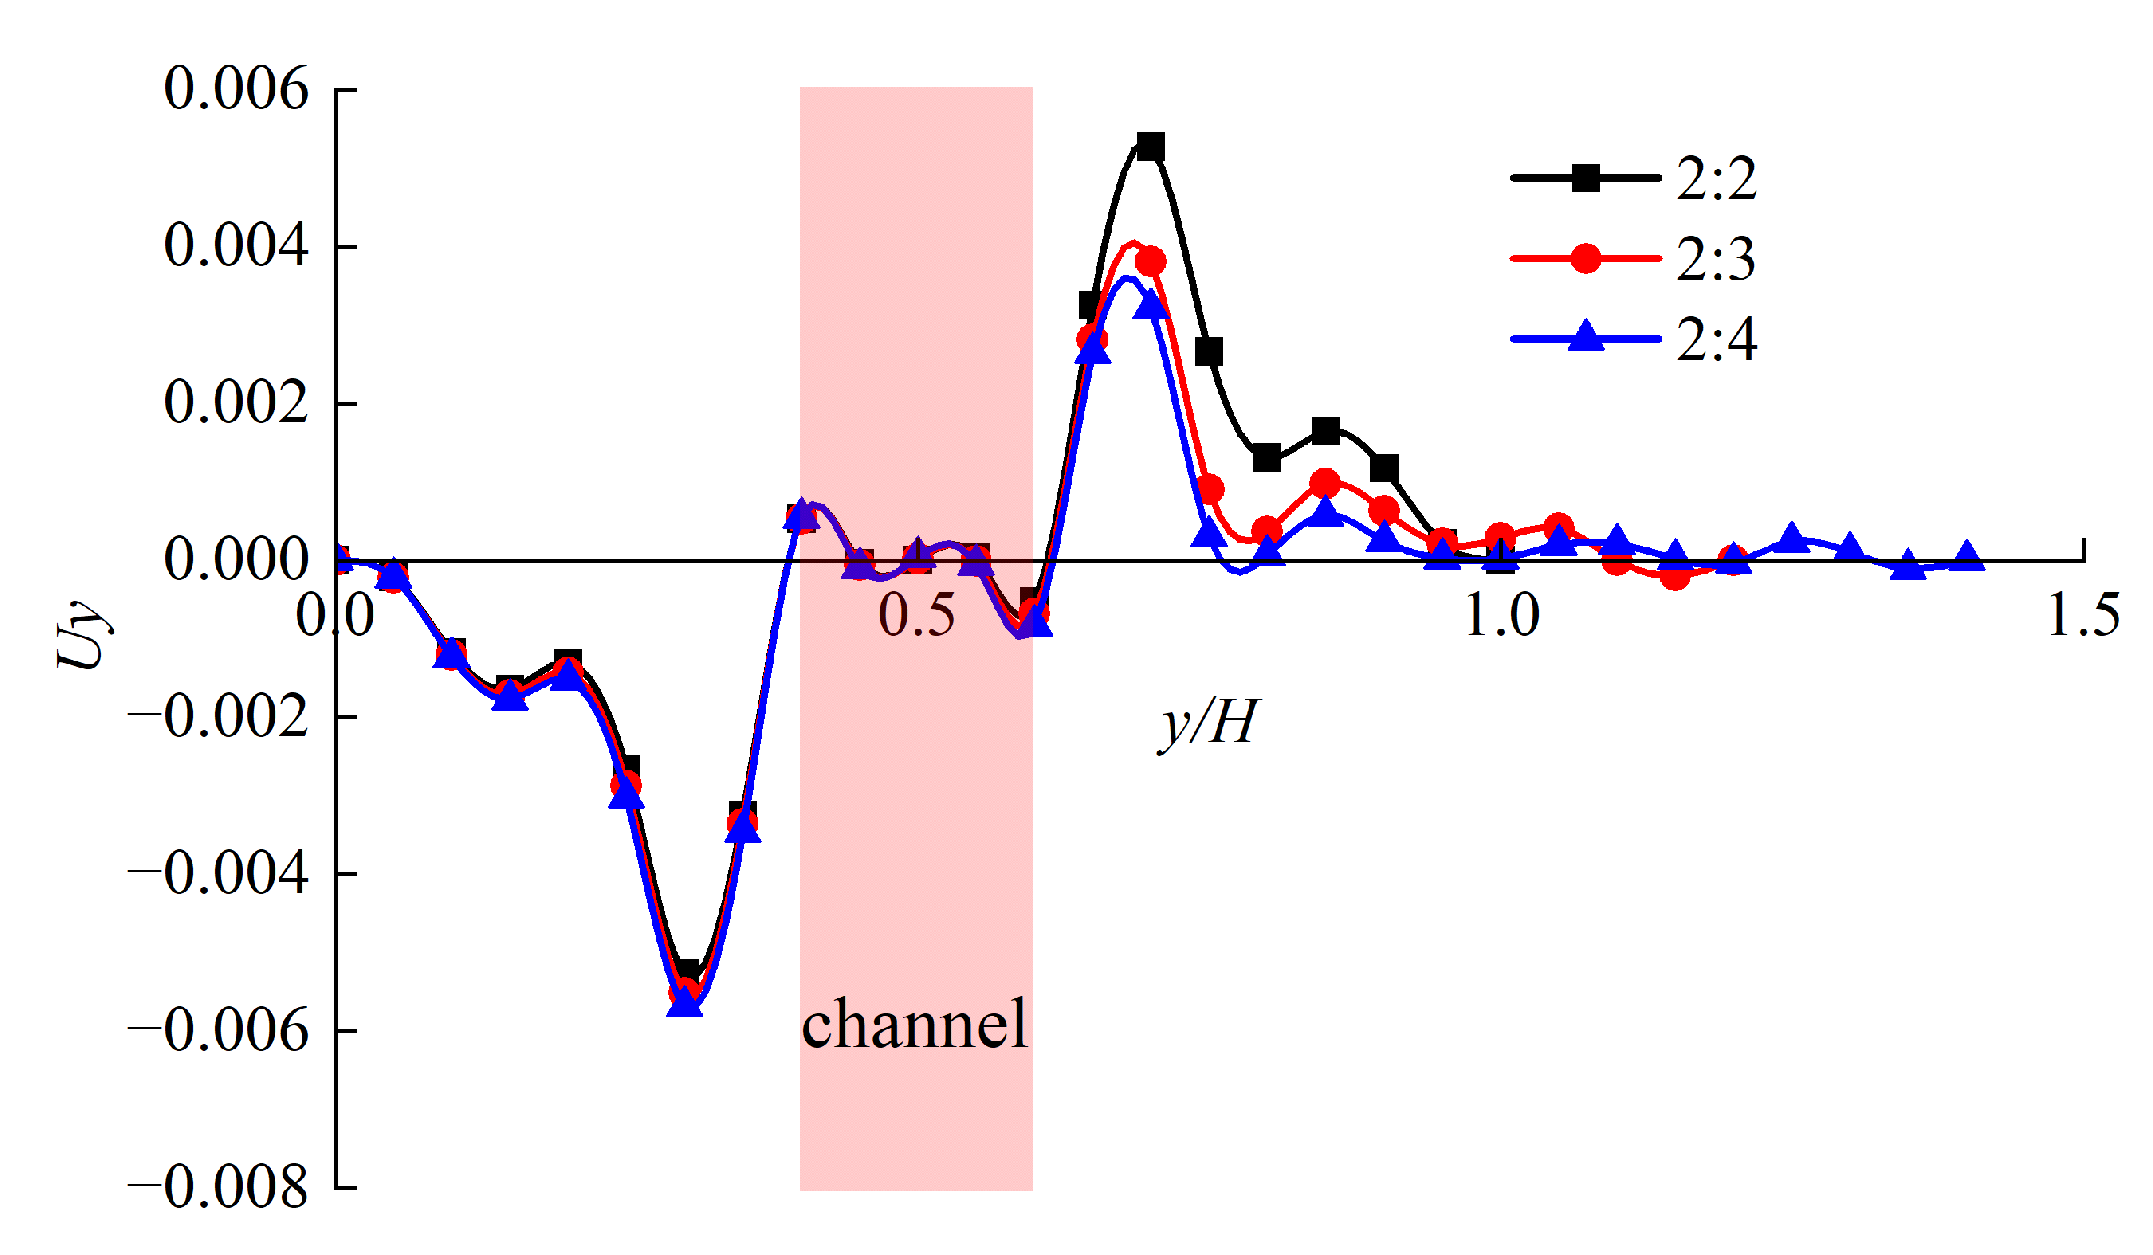
A differential pressure drive was again adopted. The density at the inlet ρ i n was set to 1.01 and the density at the outlet ρ o u t was set to 1.00. The dimensionless relaxation time was set to 0.51, and the number of simulation time steps was 40,000 to ensure the stability of seepage flow. While keeping the diameter of micron tube ① unchanged (8 grids), the diameter of micron tube ② (8 grids, 12 grids, or 16 grids) was changed to achieve different pore size ratios (2:2, 2:3, 2:4), and the corresponding mesh numbers were N x × N y = 100 × 20 , 100 × 24 , 100 × 28 . The effect of different pore size ratios on gas flow in parallel micron tubes was analyzed.
As in the previous section, profiles of Ux and Uy at the center and end of the channel were plotted (Figure 23 and Figure 24). With decreasing pore size ratio, the diameter of micron tube ② increases, and the axial velocity Ux gradually increases, while the tangential velocity Uy decreases. The axial velocity Ux and tangential velocity Uy in micron tube ① are basically unchanged. This shows that when the channel is unchanged, even though the micron tubes on both sides are connected, the influence on each other is small and relatively independent, and the changes in micron tube ② will not have a big impact on micron tube ①.

4. Conclusions

(1) The Kn number for the pore throats of tight reservoirs is less than 0.1 in the range of pressure greater than 2 MPa, and the gas flow occurs as continuous flow and slippage flow. It is feasible to use the LBM to simulate tight gas seepage in the pore throats of reservoirs at the micro- or nanoscale.
(2) The simulation results for the LBM model in this study are basically in agreement with the analytical solution for the two-dimensional flat Poiseuille flow, which proves that the model is correct and reliable.
(3) In microscale gas seepage experiments, with the increase of the pressure gradient, the flow rate presents nonlinear growth, and the gas flow rate is proportional to the fourth power of the pipe diameter. The gas flow rates simulated by the LBM are also consistent with the experimental values. In series micron tubes, with the increase of inlet pressure, the nonlinear degree of pressure distribution along the micron tube increases due to compression and rarefaction effects.
(4) The presence of a connecting channel between parallel micron tubes disrupts the linear distribution of pressure in the micron tube, and the gas forms a relatively high-pressure area at the location of the channel, where the wider the channel, the more irregular the pressure distribution curve “bulge”. When distributed along the x-direction, the axial velocity Ux decreases at the channel but increases on both sides of the channel. With the increase of channel width, the degree of decrease increases, and the velocity on both sides increases. Compared with that of unconnected micron tubes, the gas seepage capacity of interconnected micron tubes increases rather than decreases, and it increases with increasing channel width.
(5) For Ux in the y-direction, as the channel width increases, the gas flow velocity peaks at the center of the channel gradually moves closer to the middle in the upper and lower micron tubes, and Ux in the channel increases with channel width. Tangential velocity Uy is mainly concentrated at the end of the channel, and, with the widening of the channel, the gas diverts to both sides of the micron tubes more rapidly. In the interconnecting and parallel micron tubes, the widening of one micron tube has little effect on the gas flow in the other micron tube, and the two micron tubes connected by the channel are relatively independent.

Author Contributions

Conceptualization, S.G.; Methodology, H.L.; Software, W.Z.; Formal analysis, W.X.; Investigation, W.X.; Resources, L.Y.; Data curation, J.Z. and H.L.; Writing—original draft, J.Z.; Writing—review & editing, J.Z. and S.G.; Visualization, Y.M. and W.N.; Supervision, W.Z.; Project administration, L.Y. All authors have read and agreed to the published version of the manuscript.

Funding

This research received no external funding.

Data Availability Statement

The data presented in this study are available on request from the corresponding author. The data are not publicly available due to privacy.

Conflicts of Interest

The authors declare no conflict of interest.

References

  1. Pfahler, J.N.; Harley, J.; Bau, H.; Zemel, J. Gas and Liquid Flow in Small Channels. ASMEDSC 1991, 32, 49–60. [Google Scholar]
  2. Choi, S.B.; Barrori, R.F.; Warrington, R.O. Fluid Flow and Heat Transfer in Micron tubes. ASMEDSC 1991, 32, 123–134. [Google Scholar]
  3. Qin, F.H.; Yao, J.C.; Sun, D.J.; Cai, Y. Experimental Measurement of Gas Flow in a Microscale Circular Tube. Exp. Mech. 2001, 16, 119–126. [Google Scholar]
  4. Du, D.X. Effects of Compressibility and Roughness on Flow and Heat Transfer Characteristics in Micron Tubes; Tsinghua University: Beijing, China, 2000. [Google Scholar]
  5. Huang, H.; Thorne, D.T.; Schaap, M.G.; Sukop, M.C. Proposed Approximation for Contact Angles in Shan-and-Chen-type Multicomponent Multiphase Lattice Boltzmann Models. Phys. Rev. E 2007, 76, 066701. [Google Scholar] [CrossRef] [Green Version]
  6. Liu, H.; Kang, Q.; Leonardi, C.R.; Schmieschek, S.; Narváez, A.; Jones, B.D.; Williams, J.R.; Valocchi, A.J.; Harting, J. Multiphase Lattice Boltzmann Simulations for Porous Media Applications. Comput. Geosci. 2016, 20, 777–805. [Google Scholar] [CrossRef] [Green Version]
  7. Yang, J.H.; Boek, E.S. A Comparsion Study of Multi-component Lattice Boltzmann Models for Flow in Porous Media Applications. Comput. Math. Appl. 2015, 65, 882–890. [Google Scholar]
  8. Huang, H.B.; Wang, L.; Lu, X.Y. Evaluation of Three Lattice Boltzmann Models for Multiphase Flows in Porous Media. Comput. Math. Appl. 2011, 61, 3606–3617. [Google Scholar] [CrossRef] [Green Version]
  9. Rashidi, M.M.; Hosseini, A.; Pop, I.; Kumar, S.; Freidoonimehr, N. Comparative Numerical Study of Single and two-phase Models of Nanofluid Heat Transfer in Wavy Channel. Appl. Math. Mech. 2014, 35, 831–848. [Google Scholar] [CrossRef]
  10. Sohail, A.; Wajid, H.A.; Rashidi, M.M. Numerical Modeling of Capillary-gravity Waves Using the Phase Field Method. Surf. Rev. Lett. 2014, 21, 1450036. [Google Scholar] [CrossRef]
  11. Boek, E.S.; Venturoli, M. Lattice Boltzmann Studies of Fluid Flow in Porous Media with Realistic Rock Geometries. Comput. Math. Appl. 2010, 59, 2305–2314. [Google Scholar] [CrossRef] [Green Version]
  12. Xue, W.D.; Wang, Y.; Chen, Z.; Liu, H. An integrated model with stable numerical methods for fractured underground gas storage. J. Clean. Prod. 2023, 393, 136268. [Google Scholar] [CrossRef]
  13. Yasin, Q.; Sohail, G.M.; Liu, K.Y.; Du, Q.Z.; Boateng, C.D. Study on brittleness templates for shale gas reservoirs—A case study of Longmaxi shale in Sichuan Basin, southern China. Pet. Sci. 2021, 18, 1370–1389. [Google Scholar] [CrossRef]
  14. Li, W.H.; Yang, E.Q.; Wang, M.; Huang, Y.R. Pore and fracture characteristics of Cretaceous tight reservoir and its control effect on hydrocarbon accumulation in the Liuhe Basin. Pet. Sci. 2022, 19, 1939–1949. [Google Scholar] [CrossRef]
  15. Nie, R.S.; Fan, X.; Li, M.; Chen, Z.; Deng, Q.; Lu, C.; Zhou, Z.L.; Jiang, D.W.; Zhan, J. Modeling transient flow behavior with the high velocity non-Darcy effect in composite naturally fractured-homogeneous gas reservoirs. J. Nat. Gas Sci. Eng. 2021, 96, 104269. [Google Scholar] [CrossRef]
  16. Wu, Z.S.; Dong, P.C.; Yuan, Z.C.; Zhang, X.J.; Cao, N.; Yang, S. Study on Microscale Effect of Tight Gas Reservoir Based on Lattice Boltzmann Method. Fault Block Oil Field 2016, 23, 793–796. [Google Scholar]
  17. Zhang, L.; Liu, X.; Zhao, Y.; Zhou, Y.; Shan, B. Influence of Pore Throat Structure on Microscale Seepage Characteristics of Tight Gas. Nat. Gas Ind. 2019, 39, 50–57. [Google Scholar]
  18. Fathi, E.; Tinni, A.; Akkutlu, I.Y. Correction to Klinkenberg Slip Theory for Gas Flow in Nano-capillaries. Int. J. Coal Geol. 2012, 103, 51–59. [Google Scholar] [CrossRef]
  19. Rasoul, N.M.; Mahmoud, J. Study of Slip Flow in Shale and Tight Gas Reservoir Rocks Using Lattice Boltzmann Method. In Proceedings of the 79th EAGE Conference and Exhibition, Paris, France, 12–15 June 2017. Paper SPE-185807. [Google Scholar]
  20. Qian, Y.H.; d’Humieres, D.; Lallemand, P. Lattice BGK models for Navier-Stokes equation. Eurphys. Lett. 1992, 17, 479–484. [Google Scholar] [CrossRef]
  21. Guo, Z.L.; Zhen, C.G. The Principle and Application of Lattice Boltzmann Method; Science Press: Beijing, China, 2009. [Google Scholar]
  22. Zou, Q.S.; He, X.Y. On Pressure and Velocity Boundary Conditions for The Lattice Boltzmann BGK Model. Phys. Fluid 1997, 9, 1591. [Google Scholar] [CrossRef] [Green Version]
  23. Qin, F.H. Study on Microscale Gas Flow Characteristics; University of Science and Technology of China: Hefei, China, 2005. [Google Scholar]
  24. Nelson, P.H. Pore-throat Sizes in Sandstones, Tight Sandstones, and Shales. AAPG Bull. 2009, 93, 329–340. [Google Scholar] [CrossRef]
  25. Zou, C.N.; Zhu, R.K.; Wu, S.T.; Yang, Z.; Tao, S.; Yuan, X.; Hou, L.; Yang, H.; Xu, C.; Li, D.; et al. Types, Characteristics, Genesis and Prospects of Conventional and Unconventional Hydrocarbon Accumulations: Taking Tight Oil and Tight Gas in China as An Instance. Acta Pet. Sin. 2012, 33, 173–187. [Google Scholar]
  26. Yang, Z.; Zou, C.N.; Wu, S.T.; Tao, S.Z.; Hou, L.H.; Zhu, R.K.; Yuan, X.J. Characteristics of Nano-Sized Pore-throat in Unconventional Tight Reservoir Rocks and Its Scientific Value. J. Shenzhen Univ. Sci. Eng. 2015, 32, 257–265. [Google Scholar] [CrossRef]
  27. Zhao, Q.M.; Yue, X.G.; Wang, F.; Sun, K.; Zhang, Y. Flow Characteristics of High Pressure Gas in Microcircular Tube. J. China Univ. Pet. Nat. Sci. Ed. 2012, 36, 129–133. [Google Scholar]
  28. Zhao, H.Z. Rarefaction Effect and Compressibility Effect of Gas Flow in Micro Circular Tube. J. Huazhong Univ. Sci. Technol. Nat. Sci. Ed. 2001, 29, 96–98. [Google Scholar]
  29. Luo, J.B.; Xu, B.; Xue, H.; Wu, J. Analysis of Rarefied Gas Flow Characteristics and Research Status. J. Henan Univ. Sci. Technol. Nat. Sci. Ed. 2005, 26, 22–26. [Google Scholar]
  30. Cao, Z.C.; Fei, L.S. Small Flow Gas Flow Measurement Method and Application. Rocket. Propuls. 2009, 35, 34–37. [Google Scholar]
  31. Xiong, G. Preparation and Properties of Flexible Silica Aerogel; Beijing University of Chemical Technology: Beijing, China, 2011. [Google Scholar]
  32. Hu, Z.M.; Gao, S.S.; Xue, H.; Ye, L.Y.; Liu, H.X.; Shen, R.; Zhu, W.Q. Micron Tube Gripper. Beijing CN104533398B, 7 July 2017. [Google Scholar]
  33. Song, F.Q.; Hu, X. Characteristics of Fluid Flow in Nanotubes. In Abstract Collection of the 10th National Conference on Fluid Mechanics; Chinese Society of Mechanics: Hangzhou, China, 2018; pp. 218–219. [Google Scholar]
Figure 1. The D2Q9 model.
Energies 16 05937 g001
Figure 2. Schematic diagram of rebound boundary conditions.
Energies 16 05937 g002
Figure 3. Schematic of pressure boundary conditions.
Energies 16 05937 g003
Figure 4. Comparison of velocity profiles calculated by numerical and analytical solutions.
Energies 16 05937 g004
Figure 5. Kn vs. pressure for different pore-throat diameters.
Energies 16 05937 g005
Figure 6. Flowchart of the micron tube gas seepage experiment.
Energies 16 05937 g006
Figure 7. Cross-scale connection of micron tube to conventional experimental setup.
Energies 16 05937 g007
Figure 8. Comparison between the microscale gas seepage experiment results and LBM simulation results with different inner diameter. (a) 2 µm; (b) 5 µm; (c) 10 µm.
Energies 16 05937 g008
Figure 9. Relationships between flow rate and pipe diameter in microscale gas seepage experiments.
Energies 16 05937 g009
Figure 10. Gas pressure distribution in series micron tubes under different inlet pressures.
Energies 16 05937 g010
Figure 11. Schematic of the disconnected micron tubes in the LBM model.
Energies 16 05937 g011
Figure 12. Velocity profile of disconnected micron tubes (1000 steps). (red represents solid walls, blue represents fluid, and green represents microtubules).
Energies 16 05937 g012
Figure 13. Velocity profile of micron tubes with unequal diameters along the y-direction (x = 100).
Energies 16 05937 g013
Figure 14. Relationship between gas velocity and pipe diameter.
Energies 16 05937 g014
Figure 15. Schematic diagram of interconnecting parallel micron tubes in the LBM model.
Energies 16 05937 g015
Figure 16. Variation of pressure in the central position of micron tubes along the x-direction for different widths.
Energies 16 05937 g016
Figure 17. Changes in the velocity (Ux) at the center of micron tubes along the x-direction for different widths.
Energies 16 05937 g017
Figure 18. Velocity (Ux) at the outlet and percentage velocity drop at the center vs. channel width.
Energies 16 05937 g018
Figure 19. Velocity (Ux) profiles at the center of the channel with four different channel widths.
Energies 16 05937 g019
Figure 20. Velocity (Uy) distribution in interconnecting parallel micron tubes (W = 50). (the arrow represents the direction of velocity).
Energies 16 05937 g020
Figure 21. Uy profiles for the end of the channel under different channel widths.
Energies 16 05937 g021
Figure 22. Histogram showing percentage variations in micron tube flow rate under different channel widths.
Energies 16 05937 g022
Figure 23. Velocity (Ux) changes along the y-direction at the center of the channel for different pore size ratios.
Energies 16 05937 g023
Figure 24. Velocity (Uy) at the end of the channel along the y-direction for different pore size ratios.
Energies 16 05937 g024
Table 1. Changes of velocity and flow rate under different channel widths.
Width of Channel WVelocity Ux at the OutletPercentage Velocity Drop at the Center/%Flow RatePercentage Change of Flow Rate/%
00.059502.42250
100.06045.122.50753.51
200.063018.492.64609.23
300.067532.392.846717.51
400.073239.953.091827.63
500.079743.453.381239.57
Disclaimer/Publisher’s Note: The statements, opinions and data contained in all publications are solely those of the individual author(s) and contributor(s) and not of MDPI and/or the editor(s). MDPI and/or the editor(s) disclaim responsibility for any injury to people or property resulting from any ideas, methods, instructions or products referred to in the content.