Communication

Performance Investigation on a Double-Slope Passive Solar Desalination System Targeting towards Sustainable Development of Oman

by
Ganesh Radhakrishnan
1,
Daniel Breaz
2,*,
Khalid Abdul Aziz Al Riyami
1,
Wahab Sulaiman Al Nadabi
1,
Talal Yahya Al Nadabi
1 and
Kadhavoor R. Karthikeyan
3,*
1
Mechanical Engineering, College of Engineering and Technology, University of Technology and Applied Sciences, Nizwa P.O. Box 477, Oman
2
Department of Mathematics, “1 Decembrie 1918” University of Alba Iulia, 510009 Alba Iulia, Romania
3
Department of Applied Mathematics and Science, National University of Science & Technology, Muscat P.O. Box 620, Oman
*
Authors to whom correspondence should be addressed.
Energies 2023, 16(16), 5917; https://doi.org/10.3390/en16165917
Submission received: 18 June 2023 / Revised: 4 August 2023 / Accepted: 7 August 2023 / Published: 10 August 2023
(This article belongs to the Section A: Sustainable Energy)

Abstract

:
In recent times, academicians and scientists have developed many methods for purifying saline water into pure water that is suitable for drinking, as well as other suitable applications. Fortunately, solar desalination has been a very popular technique, which uses eco-friendly solar energy. In this work, a passive-type double-slope solar still was designed and fabricated according to the Global Positioning System (GPS) coordinates of Nizwa city in Oman. Economically and readily available materials, such as acrylic, glass, and foam insulation materials, were used in the construction of the double-slope solar still in addition to the conventional materials used for the supporting structure of the solar still. The climatic factors (such as the solar radiation and ambient temperature), design factors (such as the exposure surface area, inclination, insulation material and thickness, and glazing material), and operating parameters (such as the glass temperature, feed water temperature and yield) obtained were considered in the study to estimate the performance of the solar still. DHT 11 sensors with Arduino programming were used in the experiment to record the temperatures at specific locations on the solar still daily with regular time intervals for a period of 3 to 4 weeks. The solar still was designed to operate from February to March 2023. The temperatures were recorded every two hours daily, whereas the yield was recorded at the end of the day of operation. The quality of the yield was estimated through the measurement of pH and TDS (Total Dissolved Solids) values. The energy and exergy analysis of the desalination unit was carried out to estimate the thermal performance of the system. A significant effect of solar intensity and ambient temperature was observed on the thermal performance of the system and on the quality of the drinking water. An energy efficiency ranging between 30 to 45% and exergy efficiency ranging between 2 to 3.5% was obtained in the system, which was reasonably better for a thermal system involving a renewable source of energy.

1. Introduction

According to the US Energy Information Administration (EIA), global energy consumption will increase by approximately 50% in the next 30 years [1]. Renewable energy sources, such as solar and wind, will have a remarkable growth, equal to that of petroleum and other fossil fuels. Rapid development in technologies worldwide and the global population growth significantly increase the demand for potable water [2]. Providing clean drinking water essentially requires a huge quantity of energy, which is supplied through non-renewable fossil fuels to a larger extent than renewable energy sources. This fact accelerated the development of technologies based on renewable energy sources in order to efficiently produce drinking water from saline water [3]. The motivation for this study is that a larger quantity of water is available as unusable water in the seas and that the conversion of saline water to potable water is a vital solution to this issue. Desalination technology is one of the promising and sustainable development processes accepted globally for the conversion of sea water to drinking water. The desalination process with the aid of renewable energy sources, such as solar energy, is widely accepted and particularly suitable in remote rural areas, which suffer from water scarcity. A small-scale water desalination set-up might be more suitable in remote regions to cope with the scarcity of drinking water because the availability of solar radiation intensity is abundant in these regions [4,5,6]. One of the challenges of renewable sources of energy, particularly solar energy, is the variation of intensity of solar radiation. In Oman, the solar radiation intensity varies between 5000–6000 Wh/m2/day during summer and 2500–3000 Wh/m2/day during winter, which is one of the highest solar densities in the world. For a long time, many researchers and scientists have investigated this desalination technology within different perspectives. This includes considering solar stills, such as single-slope, double-slope, pyramid, steeped, hemispherical ones, etc., the material used in the solar still, such as glass, acrylic and nano-materials; additionally, in some cases, special absorbents, phase change materials, etc., are also used in the desalination system to improve its performance. Vinayak et al. [7] constructed a portable desalination plant with a boiler, solar parabolic reflector, heat exchanger and pump, which proved to be a successful plant suitable for small applications, with an economical price. Veera and Nagamany [8] developed a sustainable desalination system with a phase change process utilizing solar energy as the only source. By maintaining vacuum conditions, evaporation was achieved at ambient temperature with minimum thermal energy. The system produced a maximum of 12 L per day per m2 of evaporator surface area with a system thermal efficiency ranging between 70% and 90%. The inlet’s hot water temperature and flow rate have an important effect on the productivity, efficiency, productivity rate, and gained output ratio of the desalination unit, as proven by Agouz et al. [9]. The maximum yield obtained by them was 9 L/m2 of solar collector area. Muhammad et al. [10] analyzed a methodology in which electrical conductivity was the main criterium to evaluate the water fitness for drinking water. They succeeded by significantly removing toxic salts. Sivakumar et al. [11] made a detailed exergy analysis on a conventional and copper-finned acrylic solar still. The daily yields produced from the acrylic solar still without fins and with fins were 3.75 and 5.08 kg, respectively, and the maximum hourly thermal and exergy efficiencies of the acrylic solar still without fins were about 60.23 and 4.73%, and with fins about 68.46 and 7.7%, respectively. Two types of single-effect double-slope solar systems were developed by Wissam et al. [12]. The first was still a double-slope conventional solar still, while the second solar was still modified from the conventional solar still. They found that the daily yield of a conventional solar still can be enhanced by lifting the basin of the solar still. The improvement in the performance of the elevated basin solar still is inferred to be between 37.0% and 47.0% over a conventional solar still. Subbarama et al. [13] used naturally available fiber, ridge gourd, which was kept in the absorber basin to increase both the evaporation rate of water due to its porous nature and then the productivity of the desalination set-up. It was concluded from the study that there was no great influence of ridge gourd on the performance of the desalination set-up, and hence the use of ridge gourd fiber was insignificant during desalination as a means of obtaining a better efficiency. Savithiri et al. [14] examined a modified hemispherical solar still (MHSS) using rubber and wick materials at the basin of the HSS. The use of black rubber and wick materials in a conventional hemispherical solar still (CHSS) increased productivity. The black rubber absorbs and releases the heat energy faster than the wick materials. The summary from the literature review included the following. The inlet temperature of the saline water and its flow rate have an important effect on the productivity and efficiency of the desalination unit. The solar still consisting of an elevated basin seems to have a higher freshwater productivity than a conventional solar still, which may be because of a decrease in the heat loss from the bottom and side walls of the solar still. Using extended surfaces or fins increased freshwater production. The use of wick materials in the solar desalination system increased productivity.
In this study, a double-slope passive-type solar desalination system was thus designed and fabricated, along with DHT 11 sensors controlled through the Arduino program, and we investigated its performance. The attempt was made to conduct a basic study with the readily available materials along with standard insulation material to avoid thermal losses. The temperatures recorded by the sensors are used to estimate the thermal performance of the desalination system. Natural flow is maintained in the system, and no stimulators are used to enhance the evaporation rate. The fundamental laws of fluid flow and heat transfer across the desalination system were considered during the thermal performance estimation. Unlike the present investigation, Abhimanyu, and Kavitha [15] used heat-absorbing materials, such as sand and paraffin wax, in their investigation in specific quantities to increase the heat-storage capacity of the solar still and further increase the thermal performance of the system. On the other hand, another research group, Abdullah et al. [16], have created turbulence in basin water to break the thermal boundary layer between the still surface and the basin water. This in turn increased the evaporation rate and improved the thermal efficiency of the system. These kinds of stimulators or attachments that enhance the desalination process were not used in the present study, and the detailed experimentation is explained in the next section.

2. Experimental Section

The schematic diagram of the experimental set-up and the corresponding fabricated set-up are shown in Figure 1 and Figure 2, respectively. A double-slope solar still was constructed using acrylic and glass with appropriate insulation using glass wool with a thickness of 20 mm provided on all sides of the still except the portion exposed to receive the solar radiation. The insulation was conducted following the standard procedures followed during the construction of a passive solar still. The inner bottom side of the basin, where the saline water was placed, was coated with black paint to have the maximum absorptivity of solar radiation [17]. The entire solar still assembly was placed on top of a metallic frame with four legs to avoid disturbances from any external sources. This elevation also helped it to have a good receptivity of solar radiation without any interruptions. The DHT 11 sensor, shown in Figure 3, was used to measure the temperature at specific locations. The sensor displays both the temperature and relative humidity at the location. Since relative humidity was not within the scope of this study, it was ignored. The output of the sensors was interfaced with an Arduino board for processing, and the recordings were displayed through an LED display. The quality of water before and after desalination was tested for its pH value and TDS (Total Dissolved Solids) [18]. In general, good drinking water should have a pH value of 6.5 to 8.5 and TDS level of 50 to 150 ppm (Ref.: https://www.safewater.org/fact-sheets-1/2017/1/23/tds-and-ph, accessed on 25/05/2023). The various components used in the solar desalination system, its material and specifications are presented in Table 1.
The experimental set-up, shown in Figure 4 was placed in open land where enough solar radiation fell on the collector plate. DHT 11 sensors were attached in four different locations on the desalination unit, as follows: outer glass surface, inner glass surface, inner basin and outside basin surface. An Arduino board with an LED display was attached in the set-up to note down the temperatures every hour. A collecting tank was placed at the bottom to collect the yielded drinking water. The troughs were placed, separately, one on each side of the slope in the solar still. Hence, two containers were placed to collect the distillate. The yield obtained was measured as a sum of the yields in the two collecting tanks. The solar radiation intensity was recorded online using the link, https://en.tutiempo.net/solar-radiation/nizwa.html, (accessed on 20/04/2023). A total of 250 mL of sample yield was used for pH and TDS testing. pH was measured using a pH meter according to ASTM D1293. TDS was measured using a TDS meter according to ASTM D5907-18 [19]. The thermal efficiency or energy efficiency of the desalination system was estimated using Equation (1), which includes the quantity of energy received by the system from the sun and energy utilized by the system to convert saline water into drinking water by means of evaporation. The exergy analysis of the entire desalination system was studied using Equations (2)–(5) in order to estimate the maximum useful capacity of the system to produce drinking water while overcoming all types of energy losses. Exergy analysis was carried out for the whole desalination unit and not for individual components within it. Both the energy and exergy analysis of the desalination system were done based on recordings collected on a daily basis.

3. Results and Discussions

The observations on the temperatures at various locations on the desalination system and the solar intensity were recorded periodically. The hourly variation of ambient temperature and solar radiation intensity are shown in Figure 5a,b. Most days, the peak ambient temperature was observed for 13 to 14 h. A significant drop in ambient temperature was noticed from 14 to 16 h. The solar radiation intensity was at a maximum during 12 h for all days. A significant drop in solar intensity was noticed after 12 h to 16 h. The daily hourly variation of other temperatures is shown in Figure 6a–d. The outer glass temperature increased with an increase in time every day and had a downwards trend after 13 h on some days and after 14 h on some other days. The trend of this temperature was dependent on the solar intensity. The trend of the inner glass temperature was similar to that of the outer glass temperature. However, the peak temperature that was attained every day was around 50 to 60 °C, except on day 1. A drastic drop was not observed due to energy storage. The inner basin temperature had a steady rising trend. A marginal drop was observed after 14 h, due to the accumulated and stored heat energy in the water. The observation complemented the observation of the inner glass temperature. In the case of the outer basin temperature, a constant difference of 3 to 5 °C was observed between the inner and outer basin temperatures. The inner temperature was the fluid temperature, whereas the outer temperature was the surface temperature. This was due to the thermal conductivity of the basin material. (Mild steel—45 W/mK) [20].
The cumulative water yield measured daily is shown in Figure 7a. An appreciable rise in the cumulative water yield was observed after 12 h. The maximum condensation was noted after 13 h, which increased the yield significantly. The maximum yield was observed on day 9 and the minimum on day 3, as complemented by the observation of the solar radiation intensity. To test the quality of the drinking water, pH and TDS values are computed using standard procedures for the yield obtained on all the days. A total of 250 mL of sample yield was used for pH and TDS testing. pH was measured using a pH meter according to ASTM D1293. TDS was measured using a TDS meter according to ASTM D5907-18. The pH and TDS value of the yielded drinking water shown in Figure 7b was found to be well within the permissible limits. Safe and pure drinking water was obtained every day of the experimentation. TDS was in the range of 100–200 on most days except for very few, which was insignificant. This was important evidence of the production of safe drinking water at an economical price in rural regions.
The energy analysis and exergy analysis were conducted for the desalination unit to accurately and precisely estimate the performance of the system. The details of the analysis are shown in Figure 8 and Figure 9. The complete unit was considered for the analysis. The sun temperature is the photosphere temperature, and this energy source is called standard solar energy and is considered to be the highest temperature observed on the sun. The energy efficiency of the solar desalination system, shown in Figure 9a, ranges between 30% to 45% on average. The maximum efficiency, ranging between 40 and 47%, was observed during days 6 to 10. This may be attributed to the fact that days 6 to 10 are almost full sunny days with abundant solar intensity. The trend of energy and efficiency complemented the trend of solar intensity observed these days. On day 3, due to the least solar radiation intensity, energies and energy efficiency were also observed to be the lowest.
In the case of the exergy analysis of the system, the day (ambient temperature and solar intensity) had a significant effect on the input and output exergy of the system. The maximum output exergy of 5.18 J was observed during the 9th day, which also had the highest energy efficiency. The energy potential of the system also significantly influenced the exergy of the system. The exergy destruction of the complete system and exergy efficiency are shown in Figure 9b. The measurement of exergy destruction aims to increase the exergy efficiency by addressing the issues of losses in the system. Proper insulation, with materials that had a higher conductivity around the desalination unit, reduced the losses. The lowest exergy destruction was observed on day 1, whereas it was the highest on day 6. It was evident from Figure 9 that the trend of the energy and exergy analysis of the system was appreciably affected by the intensity of solar radiation, because the solar radiation intensity directly influenced the heat storage capacity of the desalination unit, which in turn led to the maximum yield on that day. The longer the duration of the heat potential in the system, the higher the evaporation and condensation rates, which in turn increased the maximum utilization of available energy in the system.
η thermal   = Yield   in   kg   latent   heat   of   evaporation   in   J / kg 3600 Basin   area   in   m 2 ×   Average   solar   intensity   per   day   in   W / m 2
Exergy   in =   A s   ×   I avg   1 4 3 T 5 + 273 T s + 1 3 T 5 + 273 T s 4
Exergy   out =   Yield   ×   L . H   1 T 5 + 273 T 3 + 273
Exergy destruction = Exergy (in) − Exergy (out)
Exergy   Efficiency   = Exergy   out Exergy   in
where,
Basin surface area, As = 0.225 m2
Latent heat of evaporation, L.H = 2.26 × 10⁶ J/kg
Sun temperature, Ts = 5770 K

4. Conclusions

The following conclusions are drawn from the study:
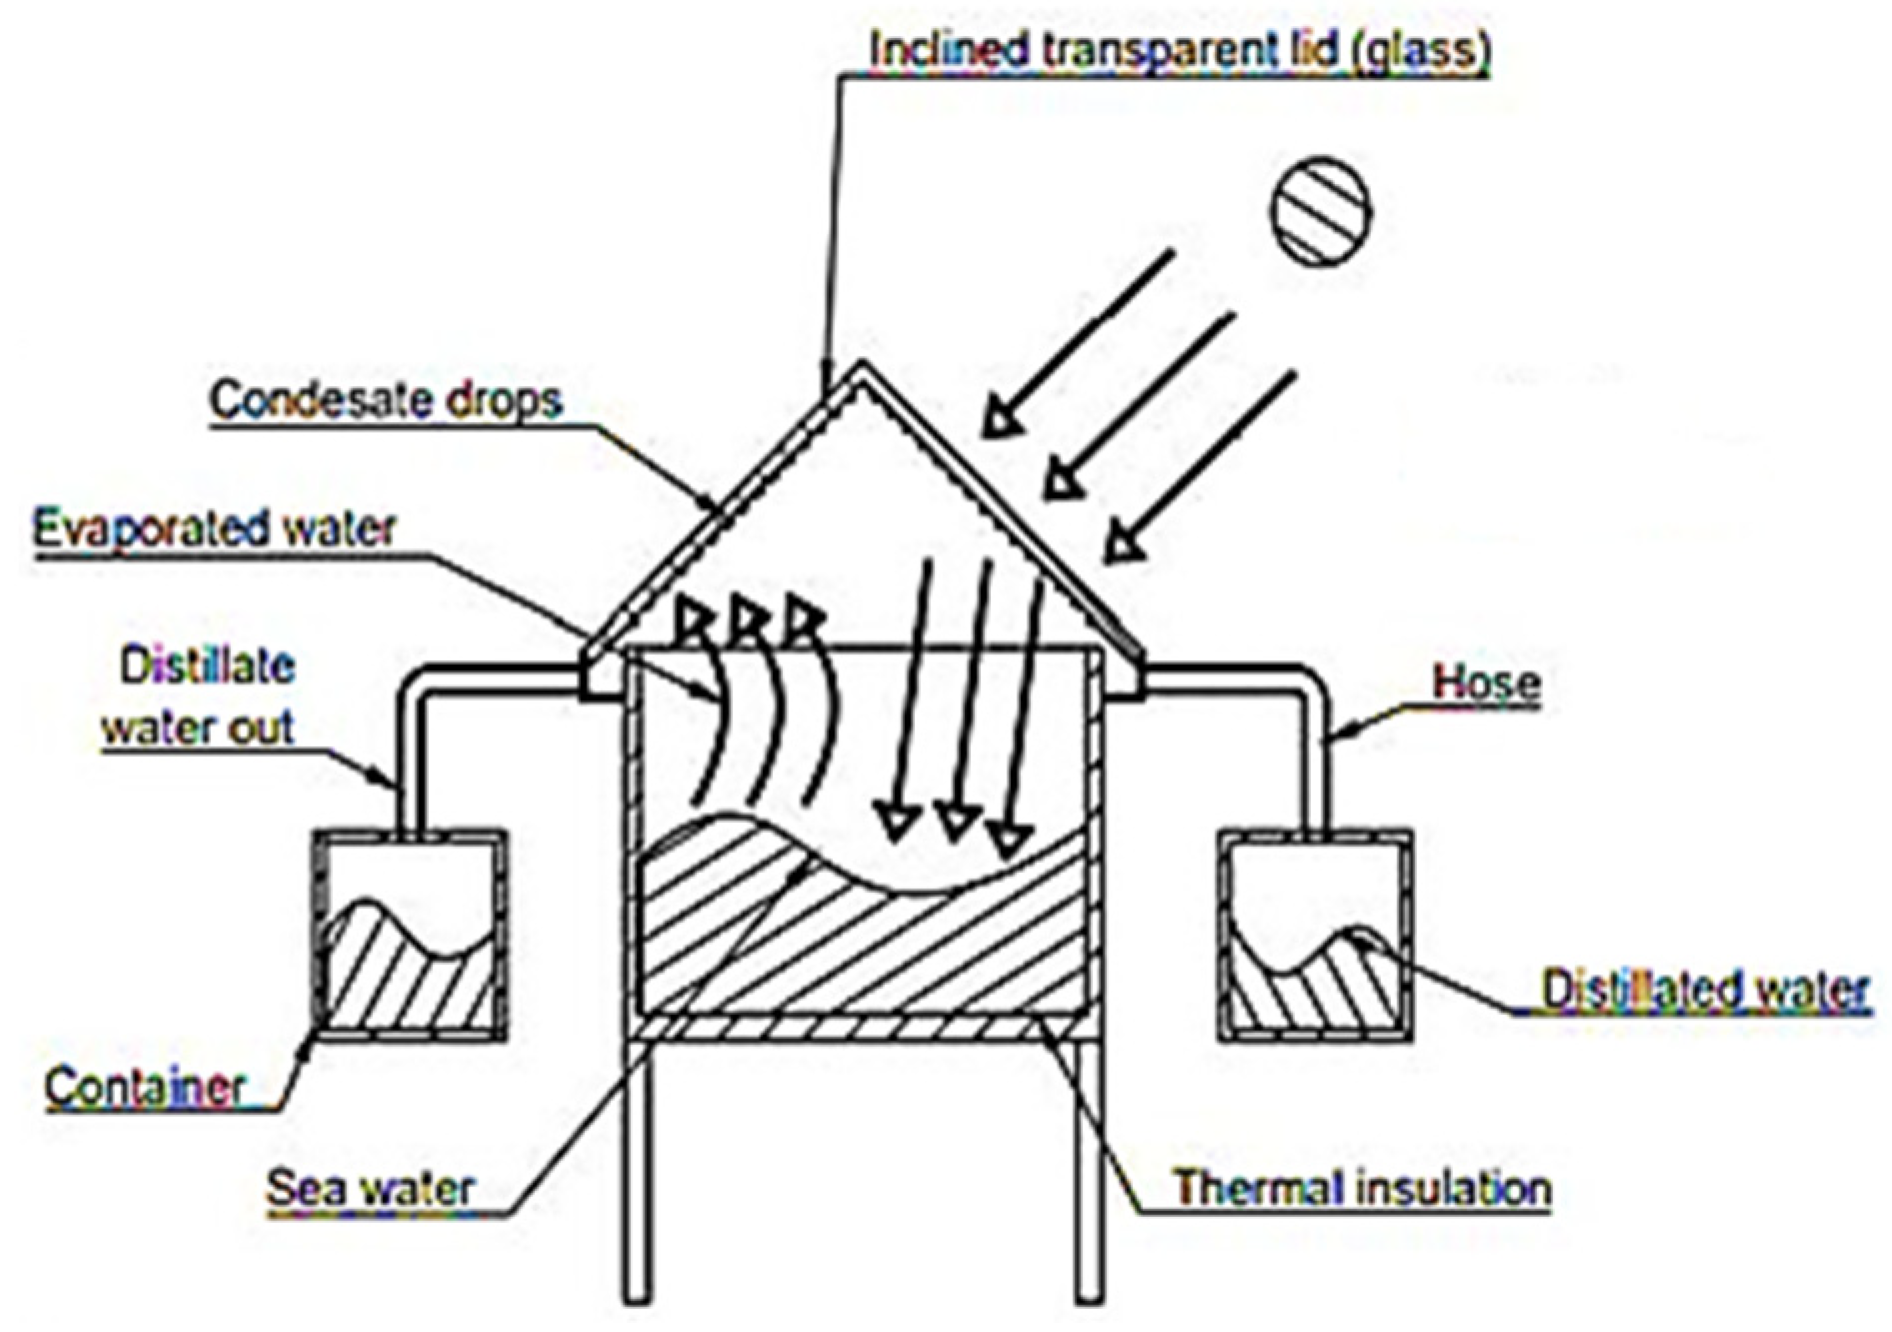
  • In this study, a double-slope solar still was successfully fabricated for a solar desalination system according to the geographical and climatic conditions of Nizwa city in Oman.
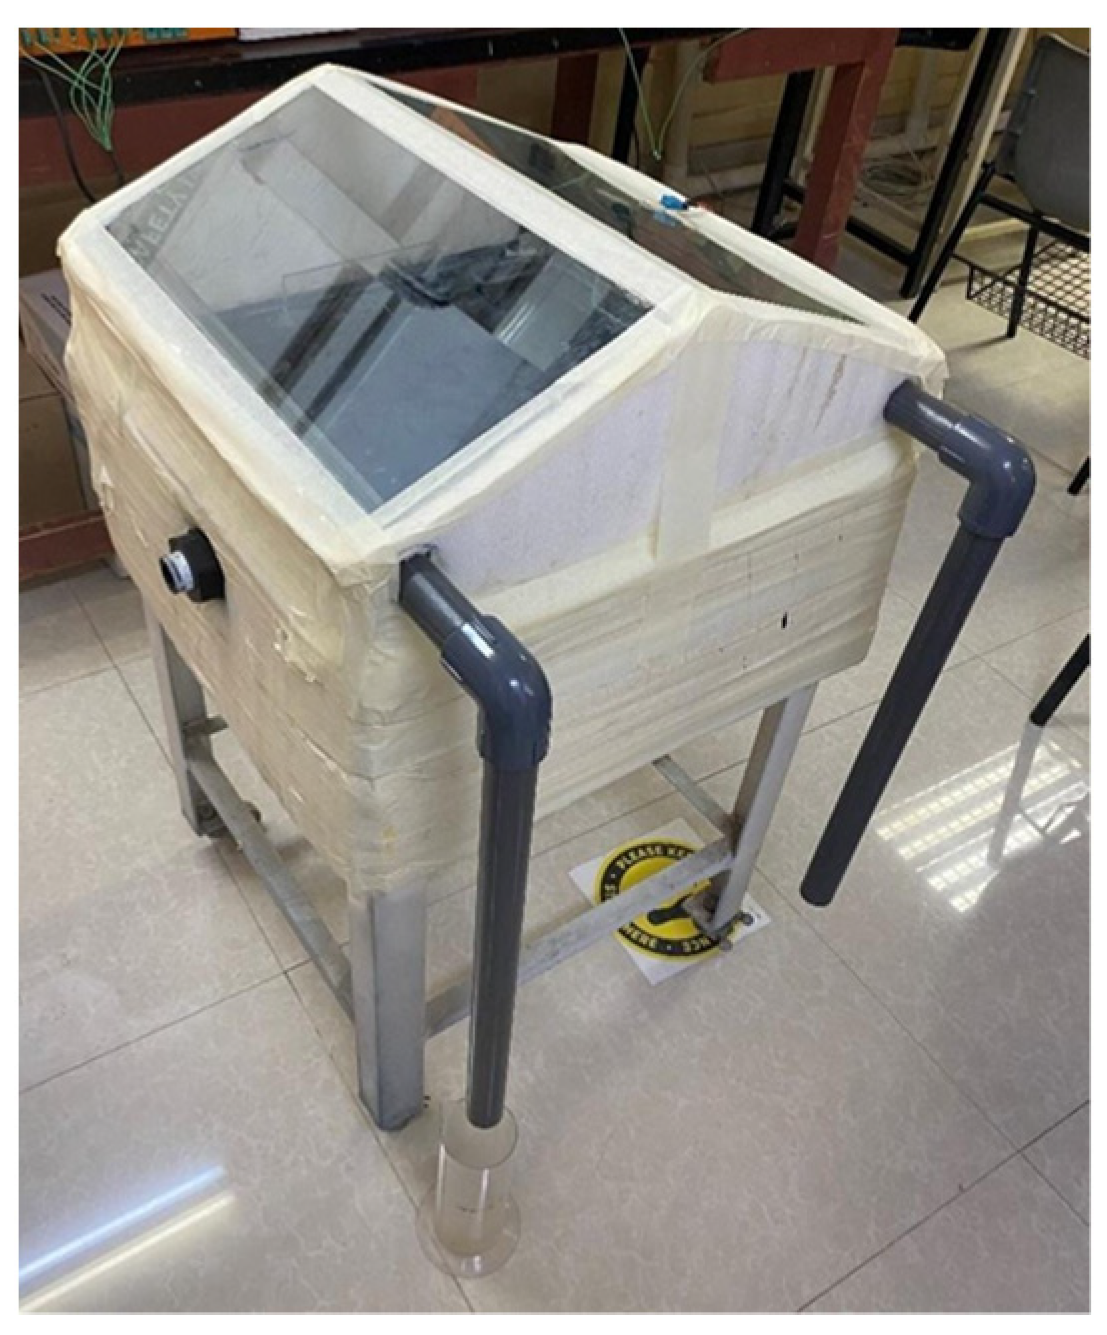
  • The fabrication of the solar desalination system was done using readily available materials in the market at a very low cost suitable for domestic applications and, of course, for low-scale industries.
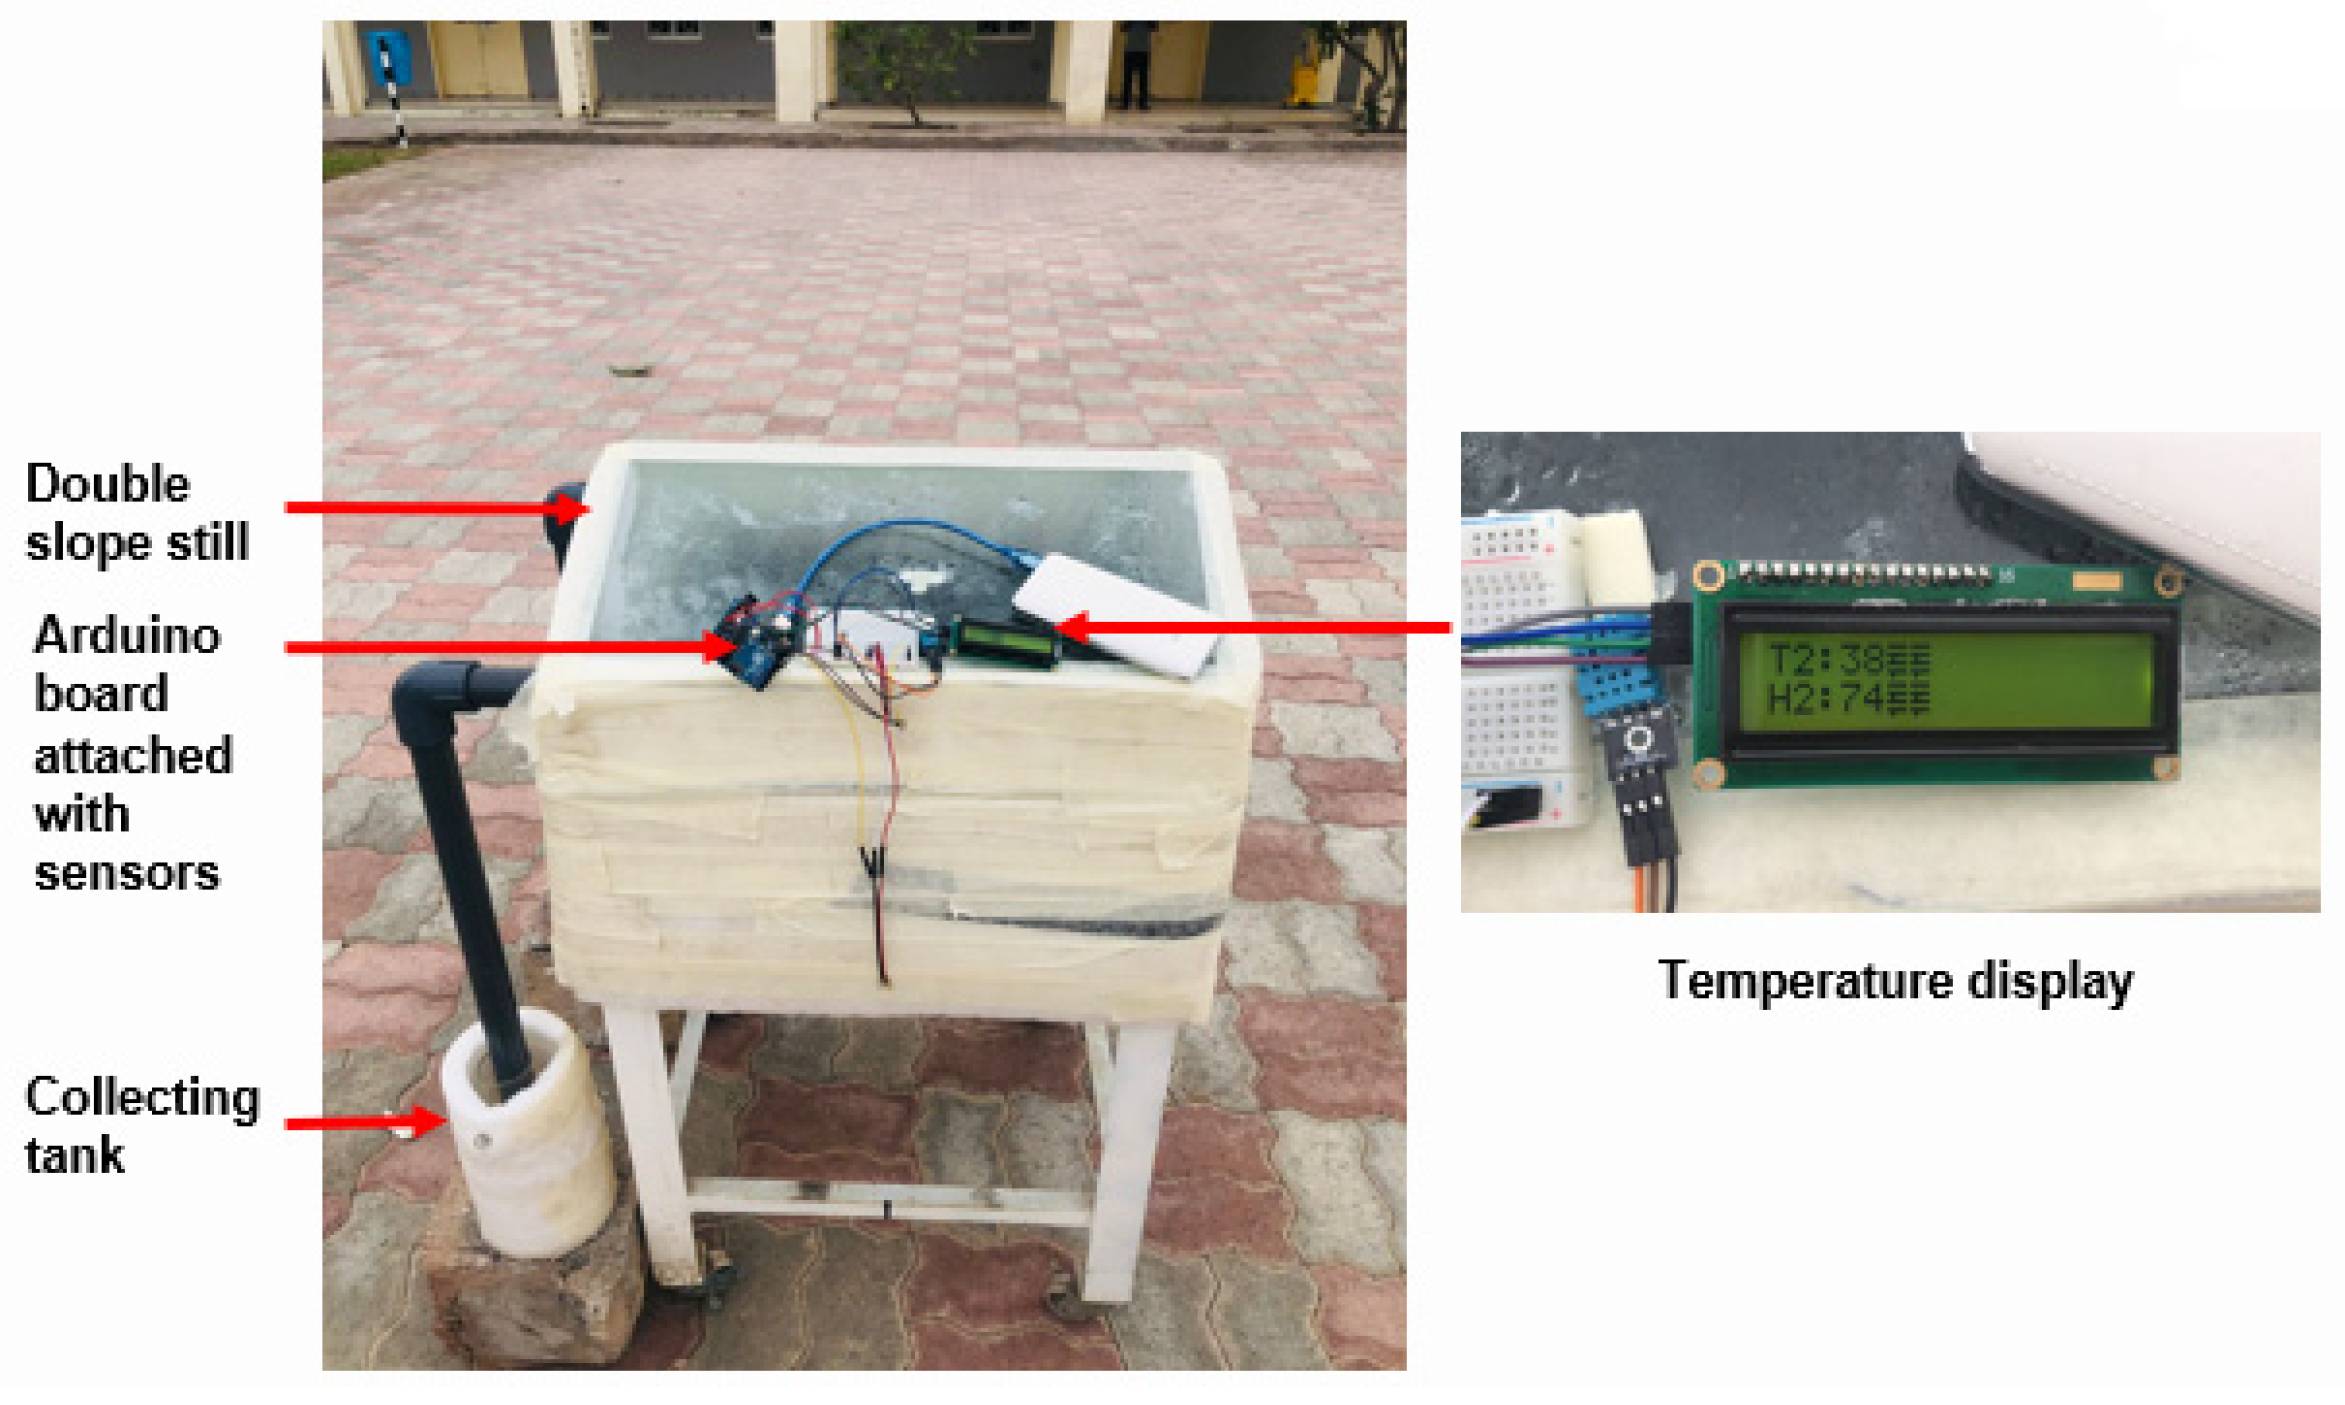
  • We planned to measure the temperature at specific locations on the solar still and quantity of distillate obtained per day. Arduino programming with the Arduino UNO interface board was used in the study to record and display the temperatures at various locations on the solar still. This made the estimation of the thermal performance of the solar still effective due to the dynamic measurement of the temperature with respect to time daily.
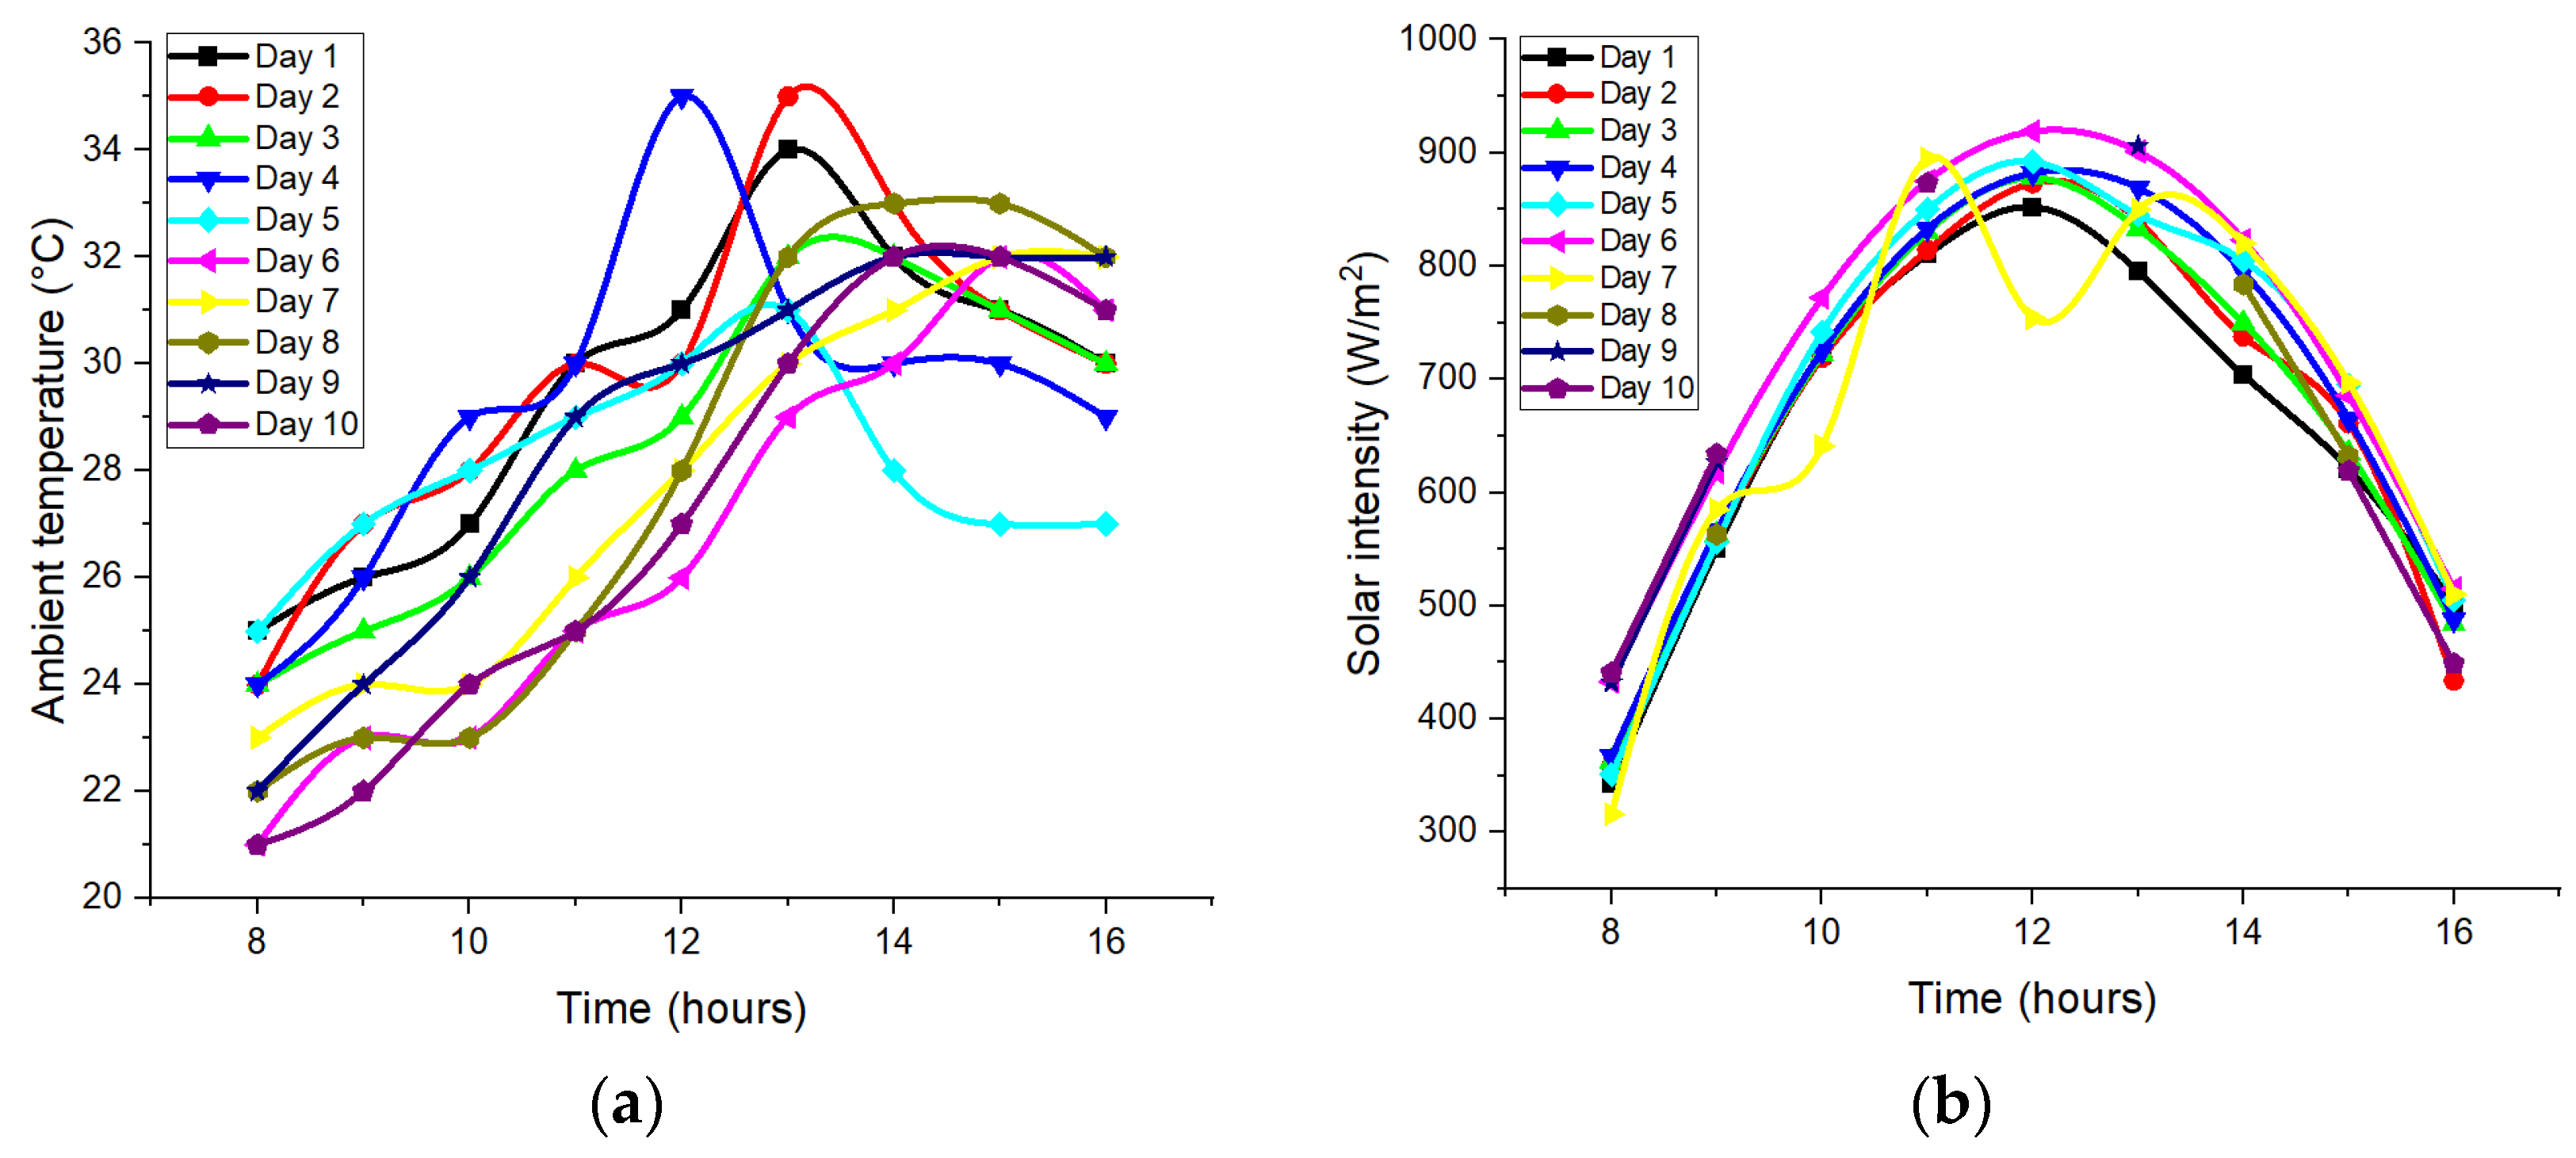
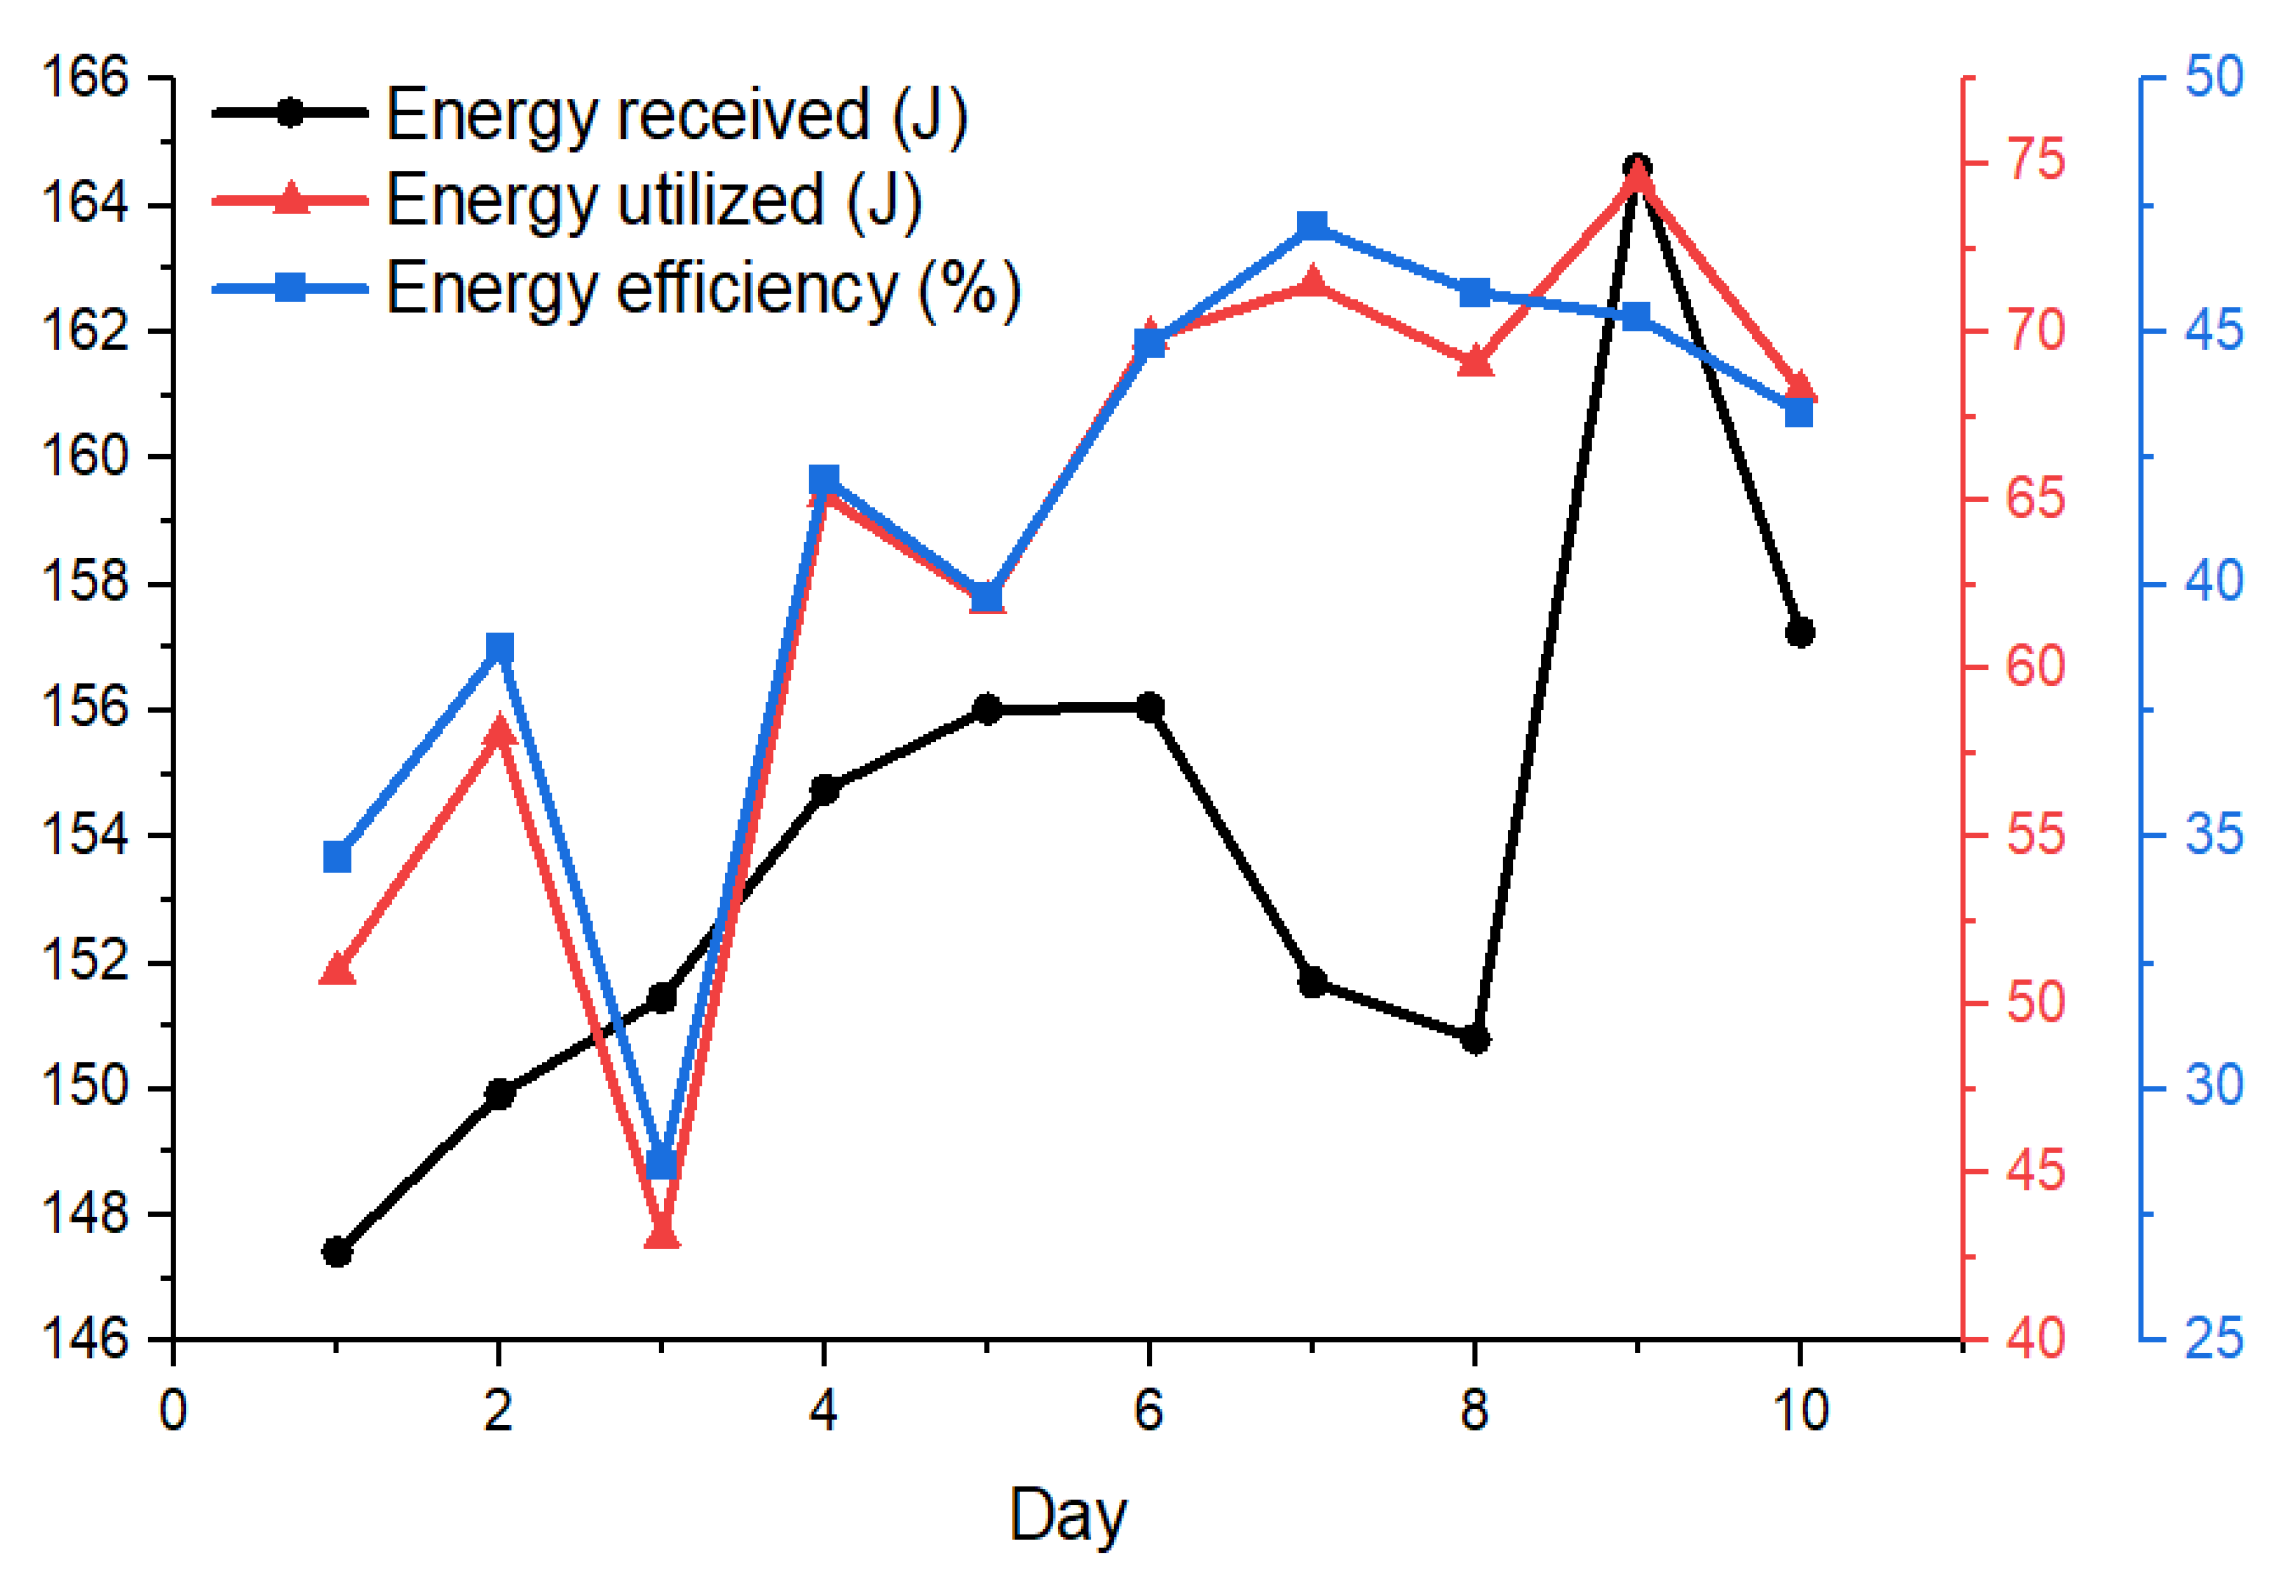
  • The intensity of solar radiation and ambient temperature significantly affected the performance of the desalination system, as subsequently it significantly influenced the heat absorption rate, evaporation, and condensation rates.
  • An appreciable rise in cumulative water yield was observed after 12 h due to enough condensation occurring after 12 h, attributed to the heat absorption capacity of the system.
  • The maximum condensation was noted after 13 h, which increased the yield significantly, the heat storage potential lasting for a longer period in the solar still.
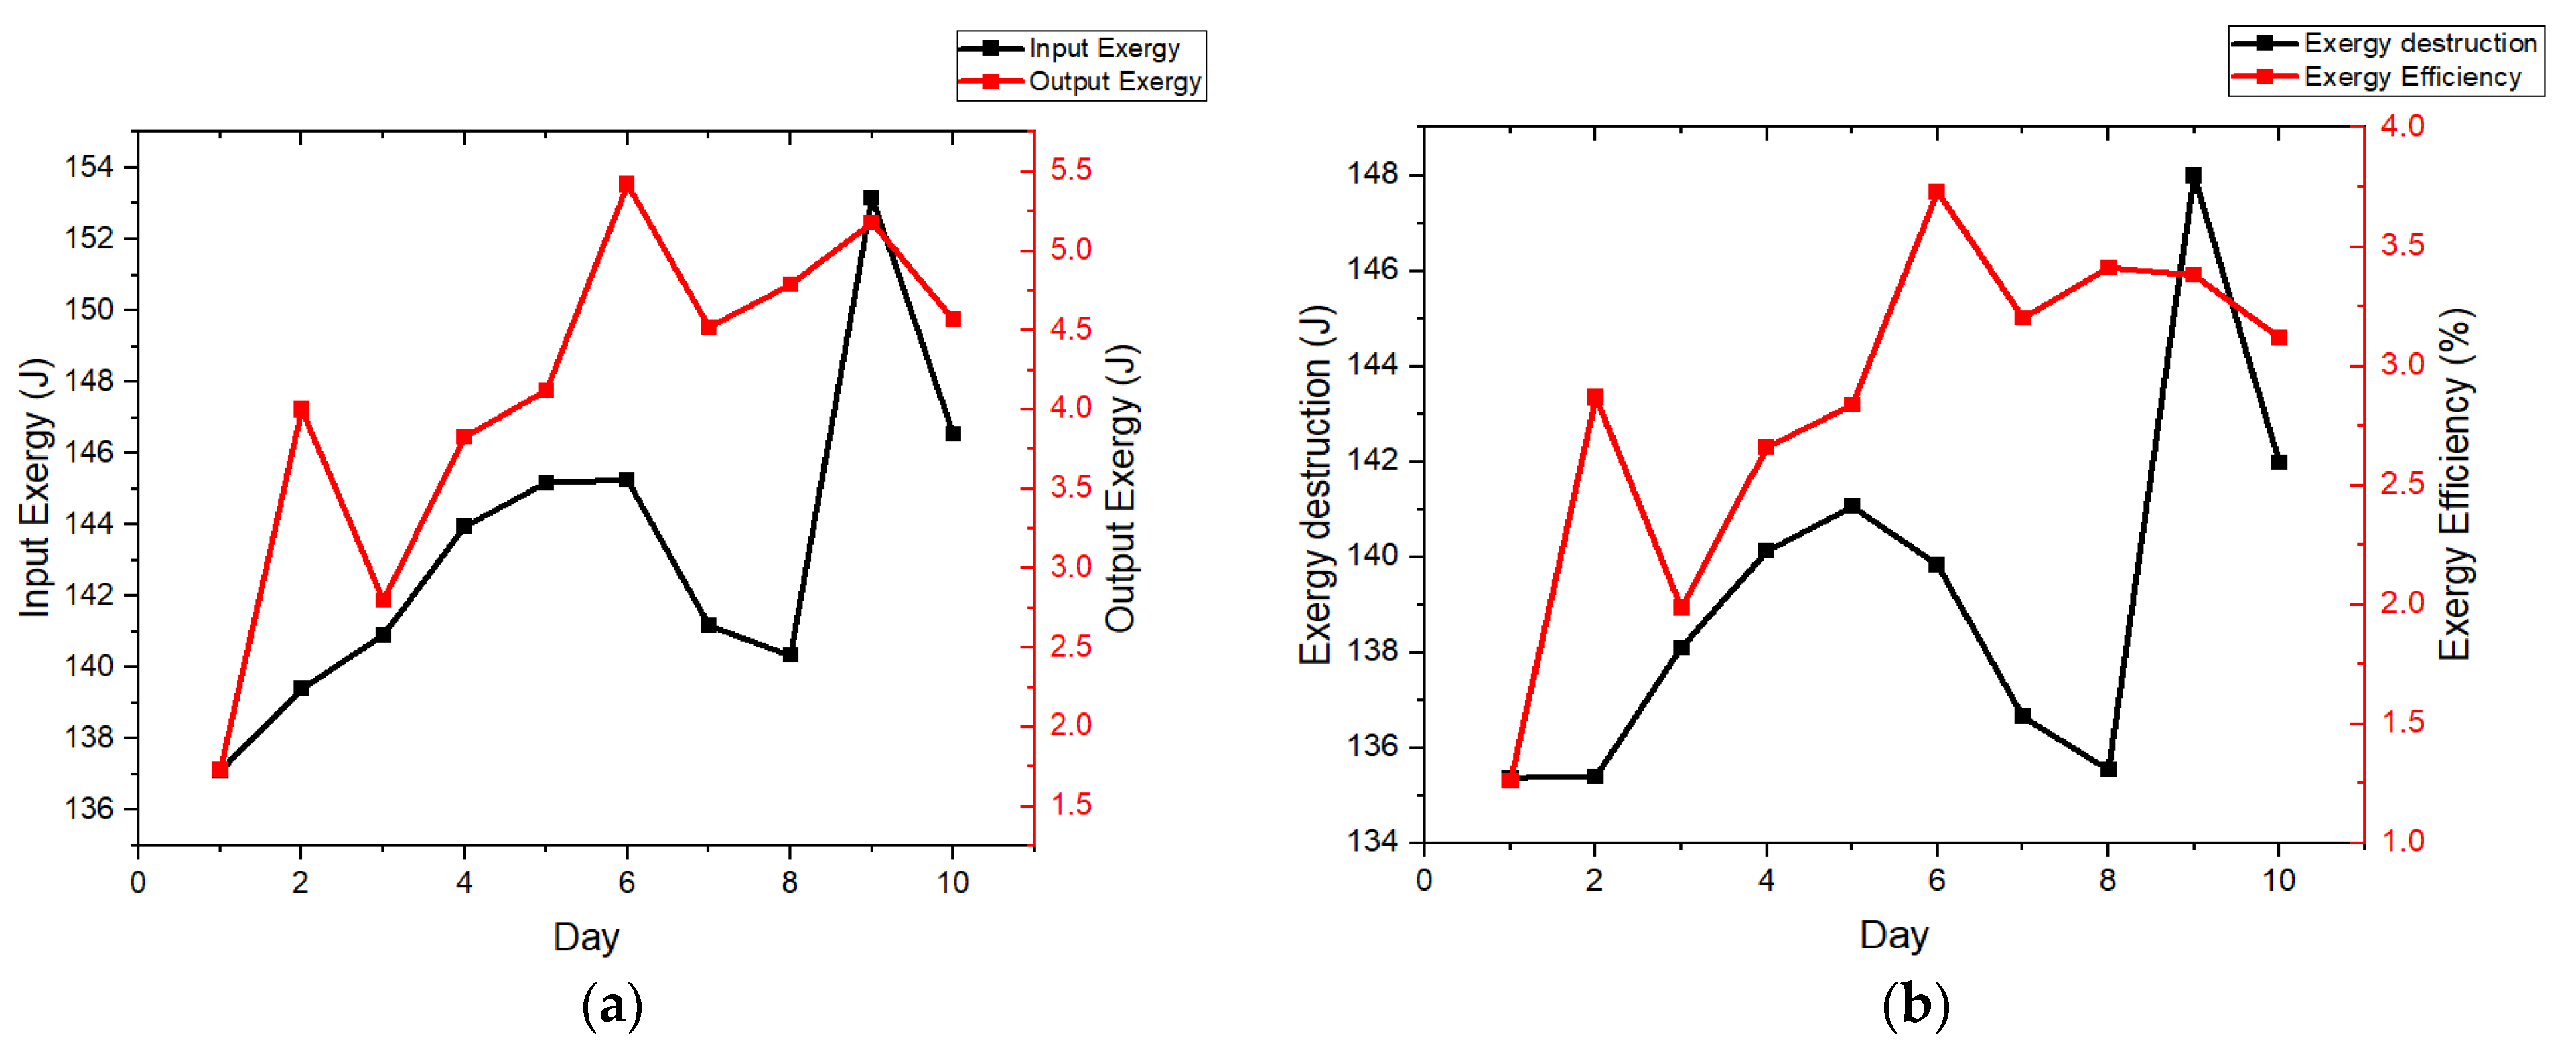
  • An energy efficiency ranging between 30 and 45% and exergy efficiency ranging between 2 and 3.5% were obtained in the system, which was reasonably better in a thermal system. This may be attributed to the fact that the thermal analysis was carried out for the entire system and not for the individual components in the desalination unit. The effect of exergy on the individual components of the solar was still ignored.

Author Contributions

Conceptualization, G.R. and D.B.; methodology, K.A.A.A.R. and T.Y.A.N.; software, W.S.A.N.; validation, G.R., D.B. and K.R.K.; formal analysis, D.B.; investigation, G.R.; resources, K.A.A.A.R. and T.Y.A.N.; software, W.S.A.N.; data curation, K.A.A.A.R. and T.Y.A.N.; software, W.S.A.N.; writing—original draft preparation, G.R.; writing—review and editing, K.R.K.; visualization, K.R.K.; supervision, K.R.K.; project administration, G.R. All authors have read and agreed to the published version of the manuscript.

Funding

This research received no external funding.

Data Availability Statement

The data that support the findings of this study are available within the article.

Conflicts of Interest

The authors declare no conflict of interest.

Nomenclature and Abbreviations

T1Outer glass surface temperature in °C
T2Outer glass surface temperature in °C
T3Inner basin temperature in °C
T4Outer basin surface temperature in °C
T5Ambient temperature in °C
IavgAverage solar intensity per day in W/m2
TsSun temperature in K
AsBasin surface area in m2
IAverage solar radiation intensity in W/m2
L.HLatent heat
TDSTotal dissolved solids
pHPotential of hydrogen
GPSGlobal positioning system
DHTDigital sensor for sensing temperature and humidity
HSSHemispherical solar still
CHSSConventional hemispherical solar still
MHSSModified hemispherical solar still
ppmParts per million
ASTMAmerican society for testing and materials
LEDLight-emitting diode
VVolts
mAMilli-amperes
CCentigrade

References

  1. Compain, P. Solar Energy for water desalination. Procedia Eng. 2012, 46, 220–227. [Google Scholar] [CrossRef] [Green Version]
  2. Tarawneh, M.S.K. Effect of Water Depth on the Performance Evaluation of Solar Still. Jordan J. Mech. Ind. Eng. 2007, 1, 23–29. [Google Scholar]
  3. Hafs, H.; Zaaoumi, A.; Bouramdane, Z.; Ansari, O.; Bah, A.; Asbik, M.; Malha, M. A Performance Analysis Study of a Single Slope Solar Still with Integrating Fins and Nanofluid for Productivity Enhancement. In Proceedings of the 1st International Conference of Computer Science and Renewable Energies (ICCSRE 2018), Ouarzazate, Morocco, 22–24 November 2018; pp. 342–348. [Google Scholar]
  4. Al Shabibi, A.M.; Tahat, M. Thermal Performance of a Single Slope Solar Water Still with Enhanced Solar Heating System. Proc. Int. Conf. Renew. Energy Power Qual. 2015, 1, 585–590. [Google Scholar] [CrossRef]
  5. El-Maaty, A.E.A.; Awad, M.M.; Sultan, G.I.; Hamed, A.M. Solar powered fog desalination system. Desalination 2019, 472, 114130. [Google Scholar] [CrossRef]
  6. Rai, V.; Tambat, M.; Shaikh, M.; Shah, S.; Mehta, S. Portable solar desalination Plant. Viva-Tech Int. J. Res. Innov. 2020, 1, 1–5. [Google Scholar]
  7. Gude, V.G.; Nirmalakhandan, N. Sustainable desalination using solar energy. Energy Convers. Manag. 2010, 51, 2245–2251. [Google Scholar] [CrossRef]
  8. El-Agouz, S.A.; El-Aziz, G.B.A.; Awad, A.M. Solar desalination system using spray evaporation. Energy 2014, 76, 276–283. [Google Scholar] [CrossRef]
  9. Ullah, M.A.; Ali, A.; Aslam, M.; Hayat Khan, K. Brackish Water Desalination Using Solar Desalination Panel. Curr. Investig. Agric. Curr. Res. 2018, 3, 1–5. [Google Scholar]
  10. Vaithilingam, S.; Muthu, V.; Athikesavan, M.M.; Afzal, A.; Sathyamurthy, R. Energy and exergy analysis of conventional acrylic solar still with and without copper fins. Environ. Sci. Pollut. Res. 2022, 29, 6194–6204. [Google Scholar] [CrossRef] [PubMed]
  11. Alawee, W.H.; Mohammed, S.A.; Dhahad, H.A.; Essa, F.A.; Omara, Z.M.; Abdullah, A.S. Performance analysis of a double-slope solar still with elevated basin—Comprehensive study. Desalination Water Treat. 2021, 223, 13–25. [Google Scholar] [CrossRef]
  12. Suraparaju, S.K.; Natarajan, S.K. Performance analysis of single slope solar desalination setup with natural fiber. Desalination Water Treat. 2020, 193, 64–71. [Google Scholar] [CrossRef]
  13. Gude, V.G.; Nirmalakhandan, N.; Deng, S. Desalination using solar energy: Towards sustainability. Energy 2010, 36, 78–85. [Google Scholar] [CrossRef]
  14. Savithiri, V.; El Hadi Attia, M.; Kabeel, A.E.; Vaithilingam, S.; Radhakrishnan, G. Enhancing the productivity of hemispherical solar distillation by using energy storage (rubber) and wick materials at different thickness. Sol. Energy Mater. Sol. Cells 2022, 248, 112006. [Google Scholar] [CrossRef]
  15. Krishna, A.R.; Kavitha, D. Influence of heat absorber materials sand, soil, and paraffin wax in solar still on sustainable water distillation. Case Stud. Chem. Environ. Eng. 2023, 8, 100365. [Google Scholar] [CrossRef]
  16. Abdullah, A.S.; Panchal, H.; Alawee, W.H.; Omara, Z.M. Methods used to improve solar still performance with generated turbulence for water desalination—Detailed review. Results Eng. 2023, 19, 101251. [Google Scholar] [CrossRef]
  17. Hawlader, M.N.A.; Dey, P.K.; Diab, S.; Chung, C.Y. Solar assisted heat pump desalination system. Desalination 2004, 168, 49–54. [Google Scholar] [CrossRef]
  18. Sivakumar, V.; Sundaram, E.G. Experimental studies on quality of desalinated water derived from single slope passive solar still. Desalination Water Treat. 2016, 57, 27458–27468. [Google Scholar] [CrossRef]
  19. Chen, Q.; Alrowais, R.; Burhan, M.; Ybyraiymkul, D.; Shahzad, M.W.; Li, Y.; Ng, K.C. A self-sustainable solar desalination system using direct spray technology. Energy 2020, 205, 118037. [Google Scholar] [CrossRef]
  20. Burhan, M.; Jin, Y.; Ybyraiymkul, D.; Ja, M.K.; Al Rowais, R.; Shahzad, M.W.; Chen, Q.; Ng, K.C. Long term rating (LTR) and energy efficacy of solar driven desalination systems in KSA using a common energy platform of standard solar energy (SSE). Sol. Compass 2023, 6, 100044. [Google Scholar] [CrossRef]
Figure 1. Schematic sketch of double-slope passive solar desalination system.
Energies 16 05917 g001
Figure 2. Fabricated model of double-slope passive solar desalination system.
Energies 16 05917 g002
Figure 3. DHT 11 sensor with Arduino interface board.
Energies 16 05917 g003
Figure 4. Experimental set-up with temperature display.
Energies 16 05917 g004
Figure 5. Daily hourly variation of (a) ambient temperature and (b) solar intensity.
Energies 16 05917 g005
Figure 6. Daily hourly variation of (a) outer glass temperature, (b) inner glass temperature, (c) inner basin temperature and (d) outer basin temperature.
Energies 16 05917 g006
Figure 7. Daily (a) cumulative water yield and (b) quality of water yield.
Energies 16 05917 g007
Figure 8. Daily energy analysis of the desalination system.
Energies 16 05917 g008
Figure 9. Daily (a) exergy in and out of the system and (b) exergy efficiency and exergy destruction of the system.
Energies 16 05917 g009
Table 1. List of components and their specifications.
S.No.ComponentMaterialSpecifications
1BasinMild steel48.5 × 46.5 × 8 cm (or) 18 L
capacity
2Solar collectorGlass48.5 × 26 × 0.6 cm—2 nos.
3InsulationGlass wool20 mm thick for required length
4Collection troughAcrylic48.5 × 3 × 0.6 cm—2 nos.
5Distillate tankPlastic5 L capacity—2 nos.
6Temperature sensorDHT 11Voltage: 3.5 V to 5.5 V
Operating current: 0.3 mA, Temperature: 0 °C to 50 °C, Humidity: 20% to 90%
Accuracy: ±1 °C and ±1%
Disclaimer/Publisher’s Note: The statements, opinions and data contained in all publications are solely those of the individual author(s) and contributor(s) and not of MDPI and/or the editor(s). MDPI and/or the editor(s) disclaim responsibility for any injury to people or property resulting from any ideas, methods, instructions or products referred to in the content.

