Article

Challenges and Opportunities for Lithium Extraction from Geothermal Systems in Germany—Part 3: The Return of the Extraction Brine

1
Chair for Geothermal Energy and Reservoir Technology, Institute of Applied Geosciences, Karlsruhe Institute of Technology, Adenauerring 20b, 76131 Karlsruhe, Germany
2
Andean Geothermal Center of Excellence (CEGA), Department of Geology, Facultad de Ciencias físicas y Matemáticas, Universidad de Chile, Santiago 8370450, Chile
3
Energy and Environment Science and Technology Directorate, Idaho National Laboratory, Idaho Falls, ID 83415, USA
4
Department of Civil and Environmental Engineering, Environmental Engineering, Bochum University of Applied Sciences, Am Hochschulcampus 1, 44801 Bochum, Germany
*
Author to whom correspondence should be addressed.
Energies 2023, 16(16), 5899; https://doi.org/10.3390/en16165899
Submission received: 6 June 2023 / Revised: 16 July 2023 / Accepted: 6 August 2023 / Published: 9 August 2023

Abstract

:
Lithium (Li) is considered a crucial element for energy transition due to its current irreplaceability in Li-ion batteries, particularly in electric vehicles. Market analysis indicates that Germany’s future automotive sector and planned battery cell production will necessitate significant quantities of global lithium production. At the same time, only 1% of the world’s Li production is currently sourced from Europe. Recently, geothermal brines in Germany have gained attention as a potential local raw material source. These brines exhibit elevated Li concentrations and substantial flow rates in geothermal plants, suggesting the possibility of viable local production. However, a comprehensive full-scale Li extraction process from geothermal brines is yet to be established, and uncertainties persist regarding its long-term behavior. To address this, a generic model based on the geothermal settings of the Upper Rhine Graben was developed, simulating a 30-year operational period for Li extraction. The simulation revealed a 40% depletion of lithium during the observation period, while heat production remained constant. Nonetheless, the model also demonstrated a mean Li production of 231 t per year (equivalent to 1230 t per year of lithium carbonate equivalent), which could significantly enhance the economic prospects of a geothermal power plant and, if applied to multiple plants, reduce Germany’s dependence on global lithium imports. The primary factor influencing productivity is the achievable flow rate, as it directly impacts access to the raw material, hence, emphasizing the importance of detailed reservoir exploration and development in optimizing future lithium production from geothermal brines.

1. Introduction

The importance of lithium (Li) has tremendously increased in the past years. Formerly mostly used in the ceramic industry or lubricants, Li is the main component of today’s state-of-the-art rechargeable lithium-ion batteries (LIB) and therefore one of the key materials of the energy transition. In total, 67% of the global Li demand in 2020 was used for batteries, mostly for battery electric vehicles [1,2]. This sector also represents the most important and very rapidly growing market [3,4]. Recent sharp rises in Li market prices are projections of a near-future worldwide Li shortfall even within optimistic market scenarios [5]. The EU plans foresee the decarbonization of individual transport and light cargo transport by banning the sale of combustion engine vehicles after 2035 [6]. With this, Li-batteries and their raw materials become a crucial and critical aspect of the climate goals. At the same time, Li is defined as a critical raw material in the EU since 2020 [7].
The situation becomes even more challenging since Europe’s and especially Germany’s battery sector is in a transition. Today, Li commodities, in particular batteries, are mainly imported from China as ready-manufactured products [2]. To become more independent and remain competitive, a transformation of the battery value chain is being pursued by establishing local Li conversion and battery cell production facilities [8]. This foresees importing fewer battery cells but manufacturing Li products in Germany. The associated necessity for imports of Li as a raw material leads to new dependencies upon global suppliers. Relying widely on one of the largest automotive sectors in the world, an undisrupted and sufficient Li supply is essential for local supply chains and the entire German economy. Therefore, domestic Li resources dissolved in deep geothermal brines have come more and more into focus recently.
In Germany, numerous research studies and industrial development projects are working on improving, implementing, and upscaling the technology called direct Li extraction (DLE) from geothermal brines [2,5,9,10,11,12]. The first scenario analyses have shown that the currently existing geothermal power plants in Germany could already theoretically cover up to 13% (880 T Li) of the Li demand caused by the planned local battery cell production. This would substantially contribute to partial supply independence [5].
However, besides the technical challenges associated with the extraction process itself, key questions of reservoir management are still unsolved. In particular, so far, no study exists clarifying the long-term Li concentration development during production. Therefore, it is not clear if a geothermal reservoir can be managed sustainably over the typical periods geothermal reservoirs are operated. It is known that the thermal signal of the injection well can reach the production well in a so-called thermal breakthrough after several years of operations [13]. We propose the hypothesis that a similar effect can occur in a chemical breakthrough of the reinjected Li-depleted brine returning to the production well. This will be a crucial factor for the economics of a planned combined energy and raw material use of geothermal reservoirs, which has not been addressed in scientific reservoir models before. In terms of reservoir and resource characterization, conventional mining assessment is not sufficient, but it requires the methods of hydraulic transport modeling known from geothermal energy. For quantifying this transient process and its sensitive parameters for the first time, a numerical modeling study is conducted using a generic geological model based on the geology of the Upper Rhine Graben (URG) for different operation scenarios. The URG is a hotspot for geothermal energy as well as the developments of geothermal Li extraction in central Europe [11,14,15] and was thus targeted for this case study.

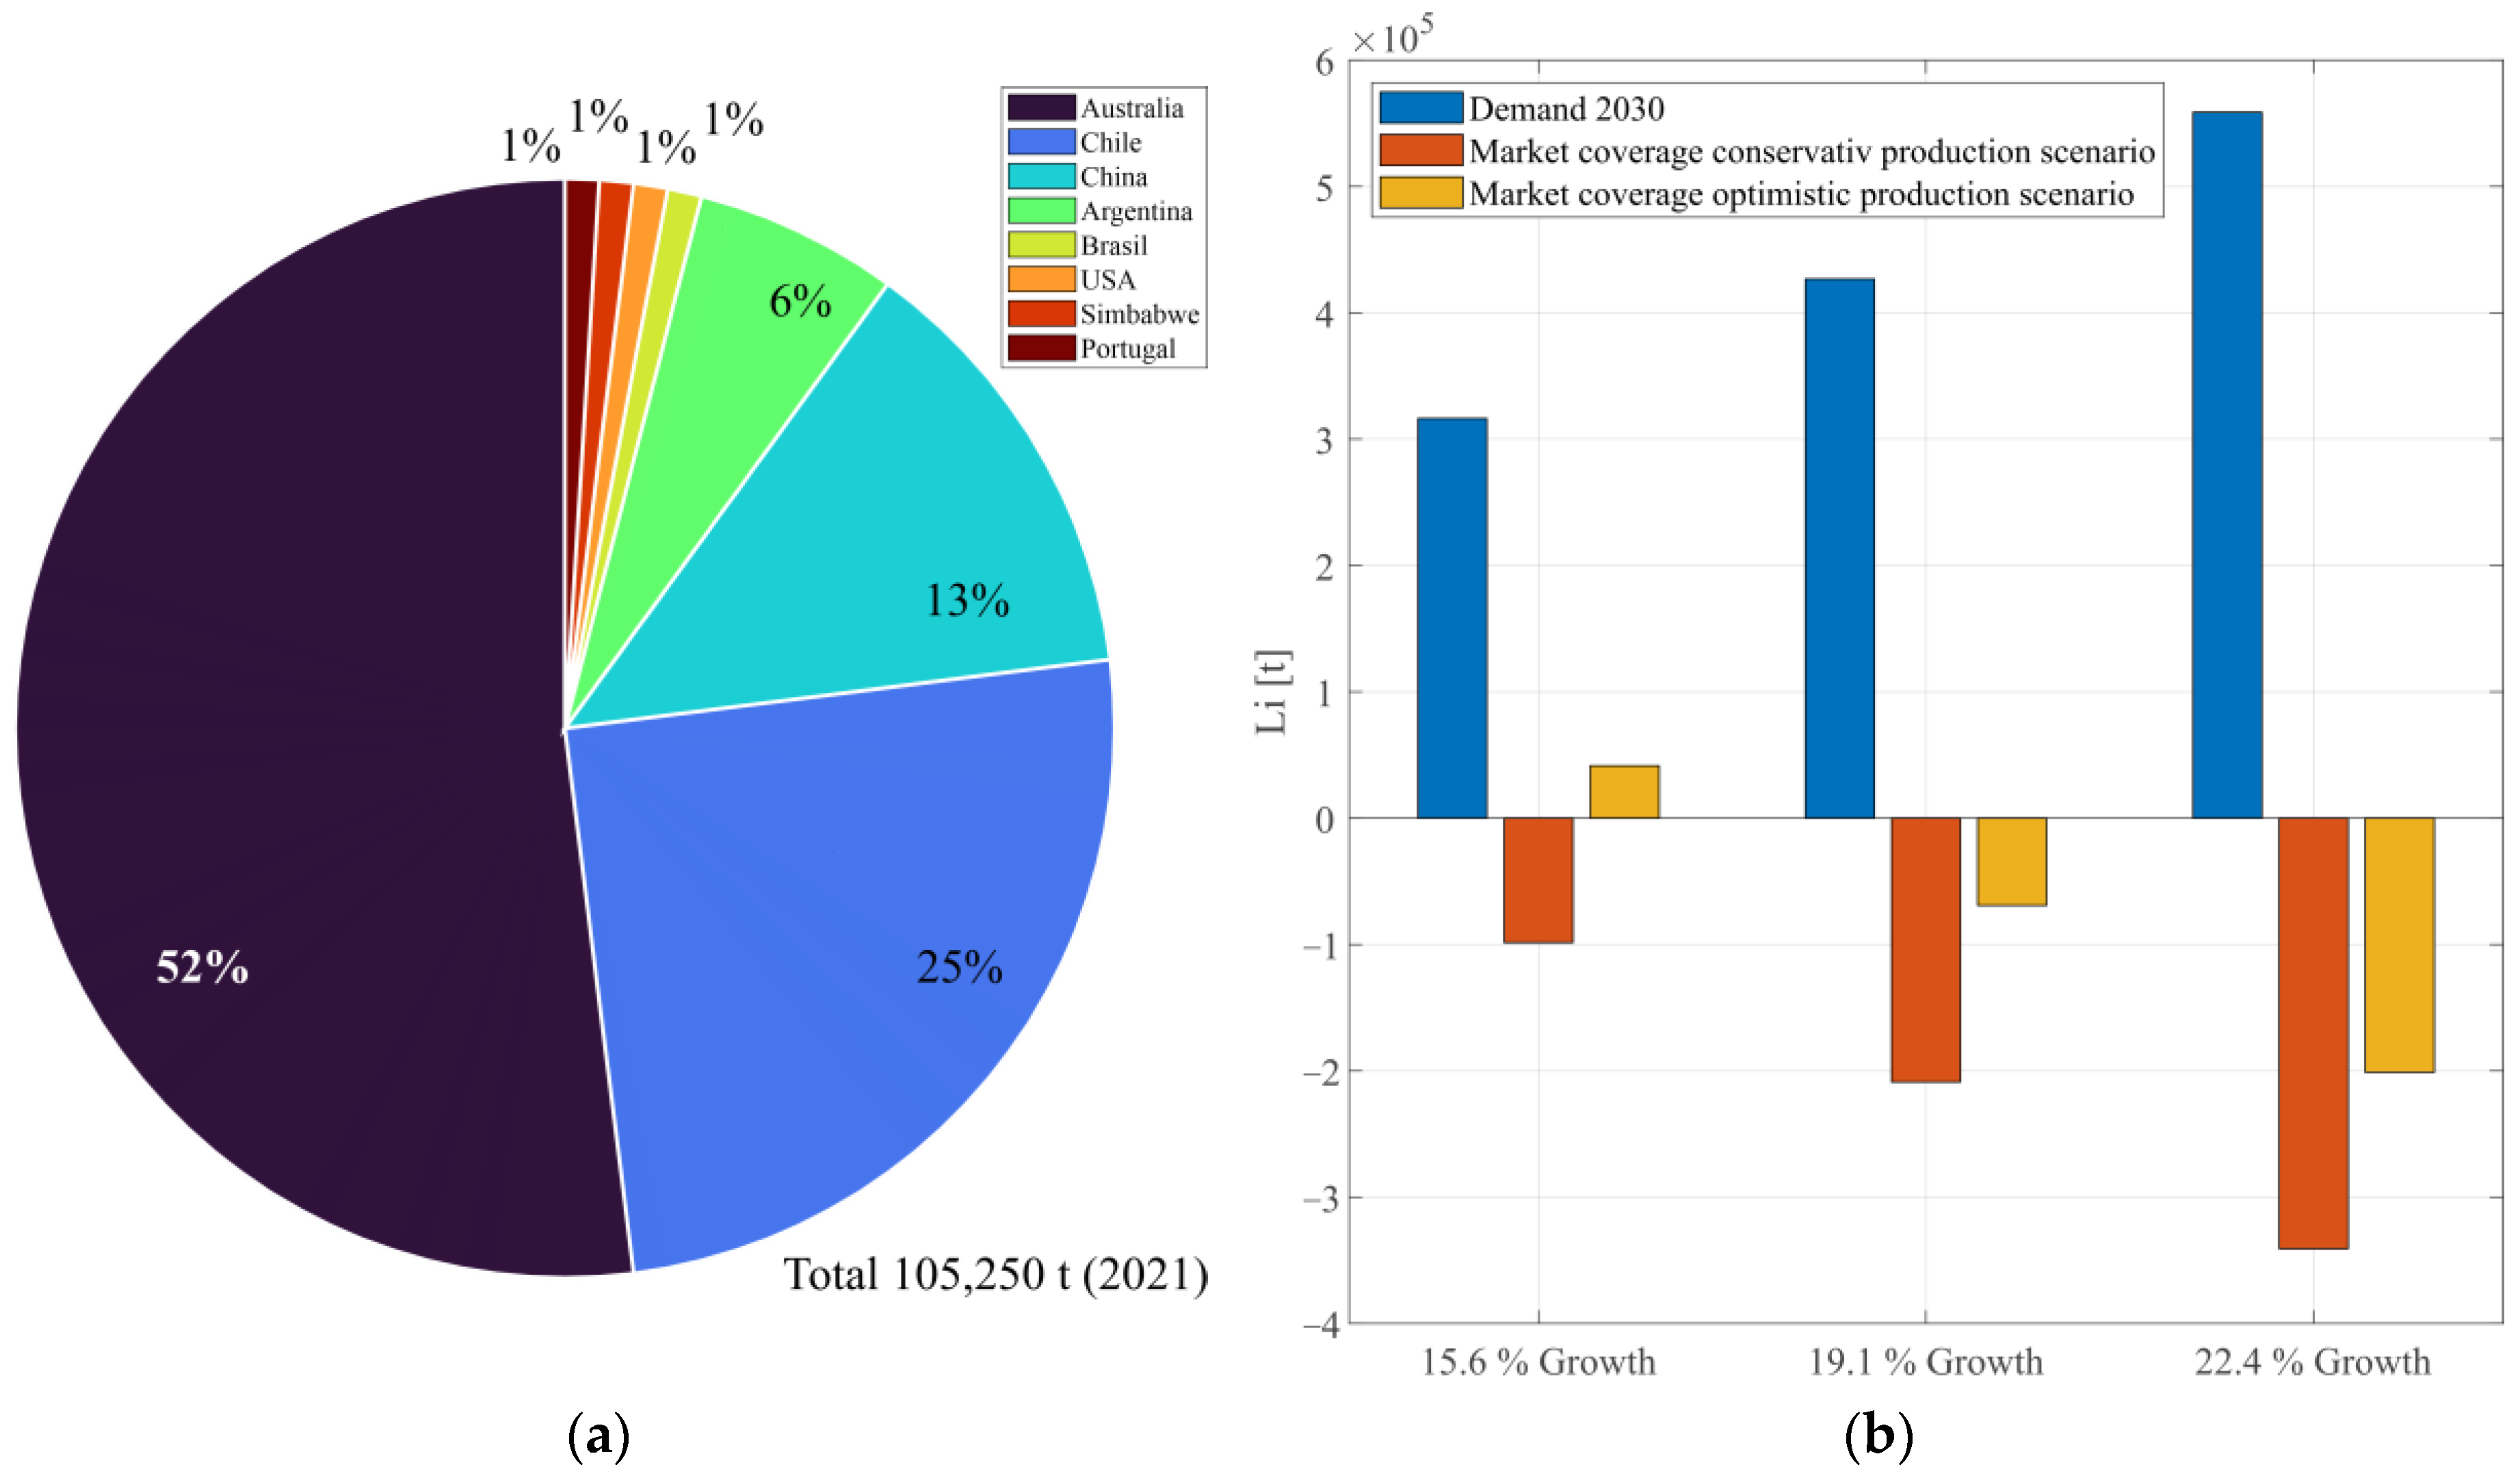
1.1. The Market and Projections

The production of Li, as well as its processing for battery production, is poorly diversified globally. China currently produces 76% of the global battery capacity and conducts 60% of the global refining of battery-grade Li [16]. The largest Li producer is Australia, where over 50% of the global Li supply is produced from hard rock mines (cf. Figure 1a). It is followed by Chile (25%) and China (13%), which has taken over more and more of the market share over the past years [1,2,8]. The only European producer of Li is Portugal, with only 1%. While, in 2021, global Li production was about 100,000 t, global demand is predicted to grow between 316,307 t and 558,780 t in 2030. Comparing global production scenarios, even including Li recycling, only with the combination of the lowest expected Li market growth and the most optimistic prediction of Li production will the Li market in 2030 be covered. All other scenarios result in a Li deficit (cf. Figure 1b) [2]. The forecasted production relies on primary production as well as on the secondary sector involving battery recycling. The primary supply is determined by considering current mining output, planned operational expansions, and upcoming mining projects, including their annual extraction capacities and projected production starting dates. The data for operational expansions are project numbers from mining and exploration companies. The demand scenarios are based on various forecasts of compound annual growth rates [2].
For Europe, the yearly demand in 2020 was 4600 t, while the prognosis predicts a demand between 77,000 and 195,000 t in 2030 [2,17]. The planned battery cell production at nine sites in Germany will require 7000 to 51,400 t/year, depending on the success and the speed of ramp-up [8,17]. Accordingly, to fulfill this goal, Europe, and especially Germany, will require large amounts of global Li production. Predictions for European Li production foresee, including recycling, production of 26.250 t in 2030 [2]. The existing geothermal plants in Germany could produce 490–880 t per year in an ideal scenario [5]. The large difference between the planned local Li production and the demand shows that current politics just shift the dependency from relying on battery imports to relying on Li (and other raw material) imports for supplying the European automotive industry. If no new Li exploration projects are started in Europe, or if the geothermal production and the associated access to Li-bearing reservoirs are not significantly pushed forward, there are no possibilities to improve this situation in the future.
The criticality becomes more apparent if prices and volatility of the market are considered. Developments of the past 20 years are described in more detail in previous studies [5]. Since 2020, due to the global high demand for e-mobility, prices have strongly increased, leading to an all-time high of up to USD 87,000/t for lithium carbonate equivalents Li2CO3 (LCE) in November 2022 [18,19]. Since then, prices have decreased to USD 47,000/t LCE [19]. Reasons for this decrease might be the inflation-caused regression of sales and insecurities in sales and production in China due to measures against the COVID pandemic [2]. This development shows the high volatility of the Li market. The current prognosis for the price of Li varies between USD 26,200 and 61,500/t LCE [20]. The high prices show great potential for local unconventional resources. However, the volatility over short periods in the past years also shows that robust economic planning is necessary, with price fluctuations of 50% within half a year.

1.2. Geothermal Reservoirs in the Upper Rhine Graben

The URG is a 300 km long and 30–40 km wide NNE-SSW-trending continental rift system [21,22]. The extension and subsidence of the system initiated during the Eocene (approx. 45 Ma) and are limited by two systems of main border faults, separating the graben shoulders from the sedimentary graben fill [22,23]. The Cenozoic sedimentary graben fill reaches thicknesses of up to 3500 m and covers the graben floor, consisting of Permian to Triassic formations in the north and Jurassic formations in the south, overlaying the Variscan crystalline basement [23].
The rifting process was accompanied by the subsidence and filling of the graben as well as the uplift of the graben shoulders, which led to the formation of an extensive fault system. The fracture network connects several fluid reservoirs, including reservoirs in the Paleozoic crystalline basement and those in the overlaying Permo-Mesozoic and Cenozoic rocks, with occasional contributions of surface waters as well [24]. Major reservoir targets occur in the sedimentary sandstones of the Triassic Buntsandstein. Fault systems in the sedimentary units of the Buntsandstein were explored by existing wells, e.g., in Cronenburg, Bruchsal, Insheim, and Brühl [25], and are also currently considered in newly planned or ongoing projects [26,27]. The geothermal play can be described as a non-magmatic extensional domain which is, for example, also found in the Great Basin in the United States and Western Turkey [28].
The brines of the URG, with salinities of up to 120 g/L are characterized as Na-Cl fluids and are dominated by high gas contents. In most fluids, CO2 is the dominant component, with gas–water ratios reaching up to 1.6:1 under standard conditions [24,29]. The geothermal exploited reservoirs of the URG are at depths of 2500–5000 m and show fluid temperatures between 120 and 200 °C. Existing deep wells produce flow rates between 28 and 80 L/s and Li concentrations of 160–190 mg/L [15,24,30].
The source of Li and other metals is yet not fully clear. Studies of the brines in the URG indicate an origin due to water–rock interaction in sandstone or granitic basements causing mica dissolution with further influences by illite, chlorite, or tosudite precipitation at high temperatures (225 ± 25 °C) [11,24]. Beyond the temperature influence, high salinities, especially high chloride concentrations, seem to correlate with high Li concentrations [31]. The high salinity could be derived from the evaporation of seawater, which also shows enrichment of Li in evaporation experiments [32]. However, several competing hypotheses regarding the origins of these kinds of brines are discussed, e.g., freshwater evaporation and dissolution of evaporites or influences of former high-temperature and high-pressure geothermal systems [11]. The genesis of the URG brines likely took place in a complex multi-stage mixing history of different fluids such as seawater, meteoric water, and saline brines from halite dissolution, with different precipitation and leaching events in different lithologies [33,34]. A final assessment of the provenance is currently the subject of research.
Regarding the sustainability of Li production from thermal waters, the question arises of how the Li concentration behaves over time and develops as a consequence of extraction. Tracer experiments in the Upper Rhine Graben reveal that the reinjected fluids may break through and can be at least partially reproduced at the production well. This observation is very site-specific and additionally dependent on the reservoir geometry and operation configuration. At the Soultz-Sous-Forêts site, 25% of the tracer was recovered at the production well after 90 days, and at the Rittershofen site, 0.2% after 25 days [35,36]. This has important implications for the long-term performance of future Li production. If a 100% Li-depleted brine were reinjected into the reservoir and no Li recharge occurred in the reservoir, the Li content would decrease equally to the tracer recovery at the production well. The remaining percentage represents the lateral inflow of fresh brine at the production well from the geothermally uninfluenced parts of the reservoirs.
Leaching experiments using rock material from geothermal reservoirs and saline brines showed that water–rock interaction processes can result in a Li release from minerals into the brines [31,37]. This suggests that there may also be a Li recharge from the reservoir during Li production. For a meaningful estimation of the recharge extension, long-term and time-resolved water–rock interaction experiments are needed. A definite statement on reservoir scale, however, will only be possible with full-scale long-term production.

1.3. Li Extraction from Geothermal Fluids

The product of produced flow rates and Li concentrations in geothermal plants in the URG defines the theoretic raw material potential of the geothermal systems. Considering these two factors only, the URG geothermal plants with high flow rates (70–80 L/s), such as Rittershoffen, Insheim, or Landau, circulate every year about 400 t of Li that could be used for the production of approx. 2100 t LCE. The research in the field of Li extraction from geothermal brines has been ongoing for almost 50 years [38,39]. Various approaches (e.g., liquid–liquid extraction, inorganic sorbents, electrochemical methods, and membrane technologies) are functional on a laboratory and small prototype scale (TRL 4/5); however, a full industrial implementation of DLE for geothermal brines is yet to be found worldwide [5,9,10,14].
Liquid–liquid extraction approaches aim for transferring one dissolved substance of a liquid medium to a liquid solvent. This approach requires that the two media can transfer the target elements but are not miscible for later separation. As such, organic solvents open up promising approaches for raw material extraction from high-salinity geothermal brines, such as tributyl phosphates (TBP) diluted with methyl isobutyl ketone or kerosene [40,41,42,43,44,45], the use of crown ethers [46,47], or the use of ionic liquids [42,48].
Regarding inorganic sorbents, different materials and approaches have been investigated for selective ion separation. Promising and currently widely discussed approaches are, for instance, titanium oxides, manganese oxides, or zeolites [10,49]. Typically, ion exchange, physical adsorption, and absorption are the extracting mechanisms. The raw material in the solution is bound to a solid that is added to or exposed to the fluid, in the first loading stage. After contact between the sorbent and the raw material to be recovered, a stripping stage follows, exchanging the initial solution with a recovery solution and desorbing the elements from the loaded sorbent [14].
Electrochemical extraction methods are based on the principle that positively charged Li cations are selectively attracted to a working electrode under the application of a voltage while anions and interfering elements are bound to a counter electrode [50,51,52]. The electrode material can be similar to inorganic sorbents built of manganese or titanium, with the major advantage of rapid electrochemical binding and desorption in this application [50]. A benefit is also that the methods are based on similar mechanisms as in the widely used lithium-ion batteries and are thus well understood [40].
Membrane processes are based on the use of lithium-selective membranes, separating by ion size, surface charge, or chemical and physical properties [10]. Beyond this, membranes can also be used for keeping other approaches as liquid–liquid extractions or sorbents stationary [53].
The described methods showed promising results, with individual positive and negative aspects for their industrial application. The technologies were overall able to extract 40–95% of the initially dissolved lithium from the brines under well-controlled laboratory conditions. This proportion describes how much of the total Li dissolved in the brine could in theory be extracted during the operation of a future plant and is further referred to as extraction efficiency [14].
In Germany and on the French site of the Upper Rhine Graben, several industrial and research projects are currently working on this topic with the aim of applying different technological approaches as well as scaling up the processes to an industrial scale [54,55,56,57,58]. The main challenges are the high flow rates in combination with the chemical composition of the fluids, leading to high scaling and corrosion potentials, which are typical challenges during geothermal energy production. The addition of chemical reaction agents, pH changes, degassing, cooling, or kinetic effects during extraction processes increase these challenges significantly and pose high demands on the extraction material, the process technology, as well as the construction materials [59]. The extraction efficiency will linearly lower the theoretically producible amount in comparison to the theoretically circulated Li amount, which is a function of Li concentration and flow rate. Further aspects that will decrease the Li output include, for instance, downtimes for maintenance work. From 400 t of circulated Li per year, only 180 to 320 t (950–1700 t LCE) will be extractable, depending on the success of the upscaling of the extraction processes [5]. The further markdowns which might occur over time due to the dilution of Li in the reservoir is quantified with the following model and simulation.

2. Methods

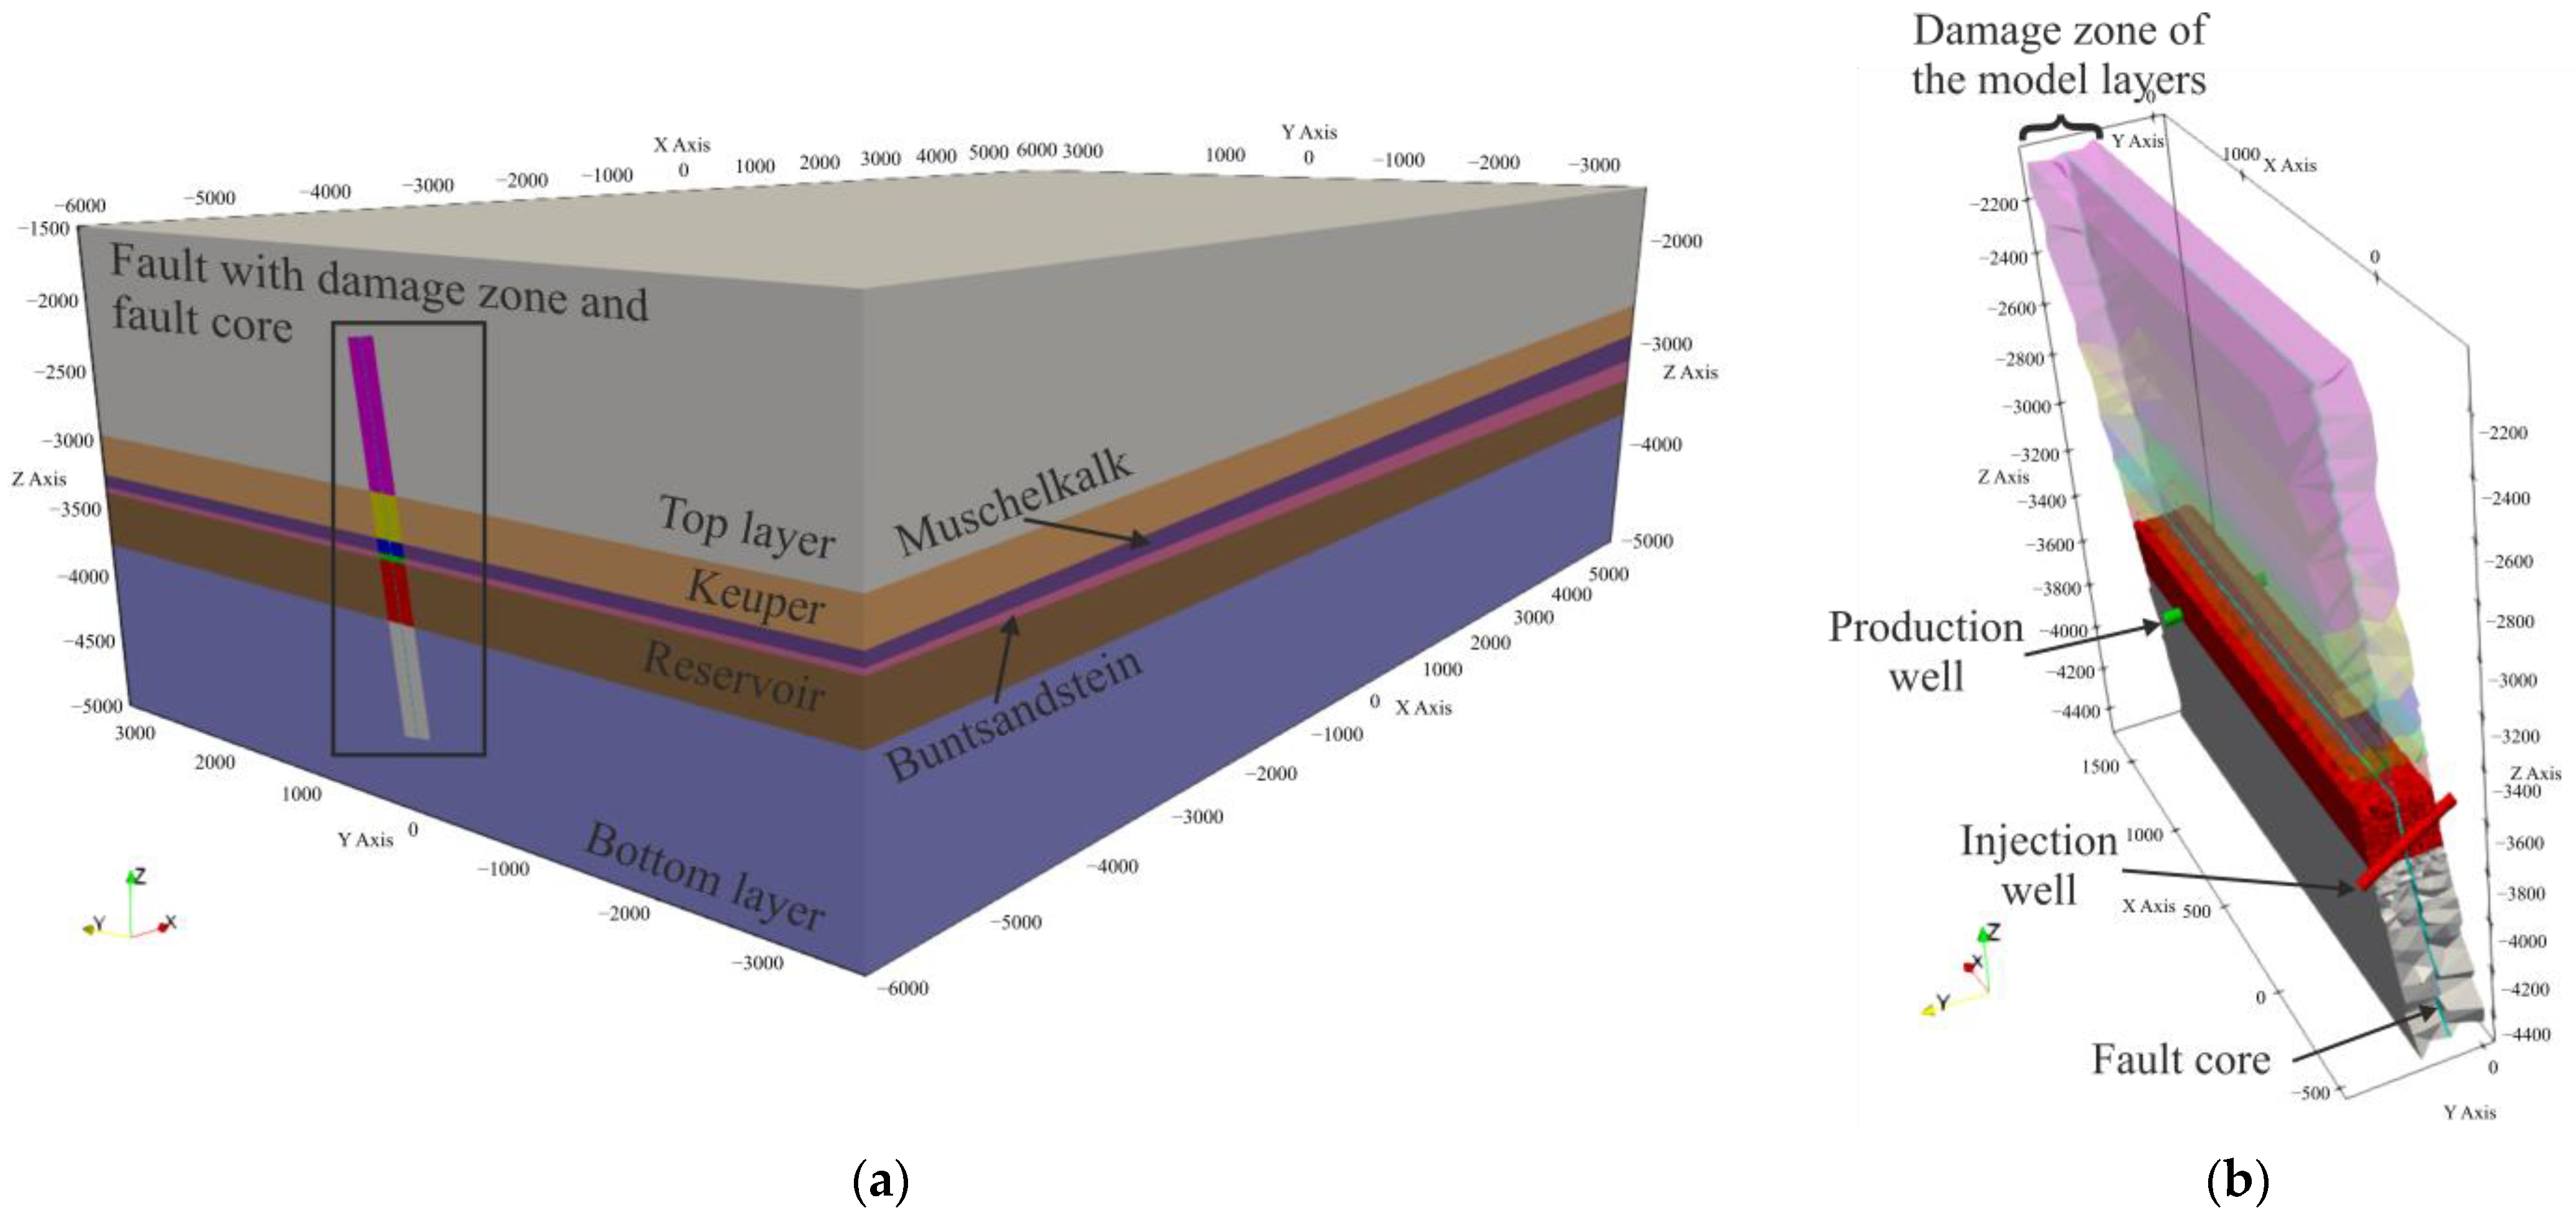
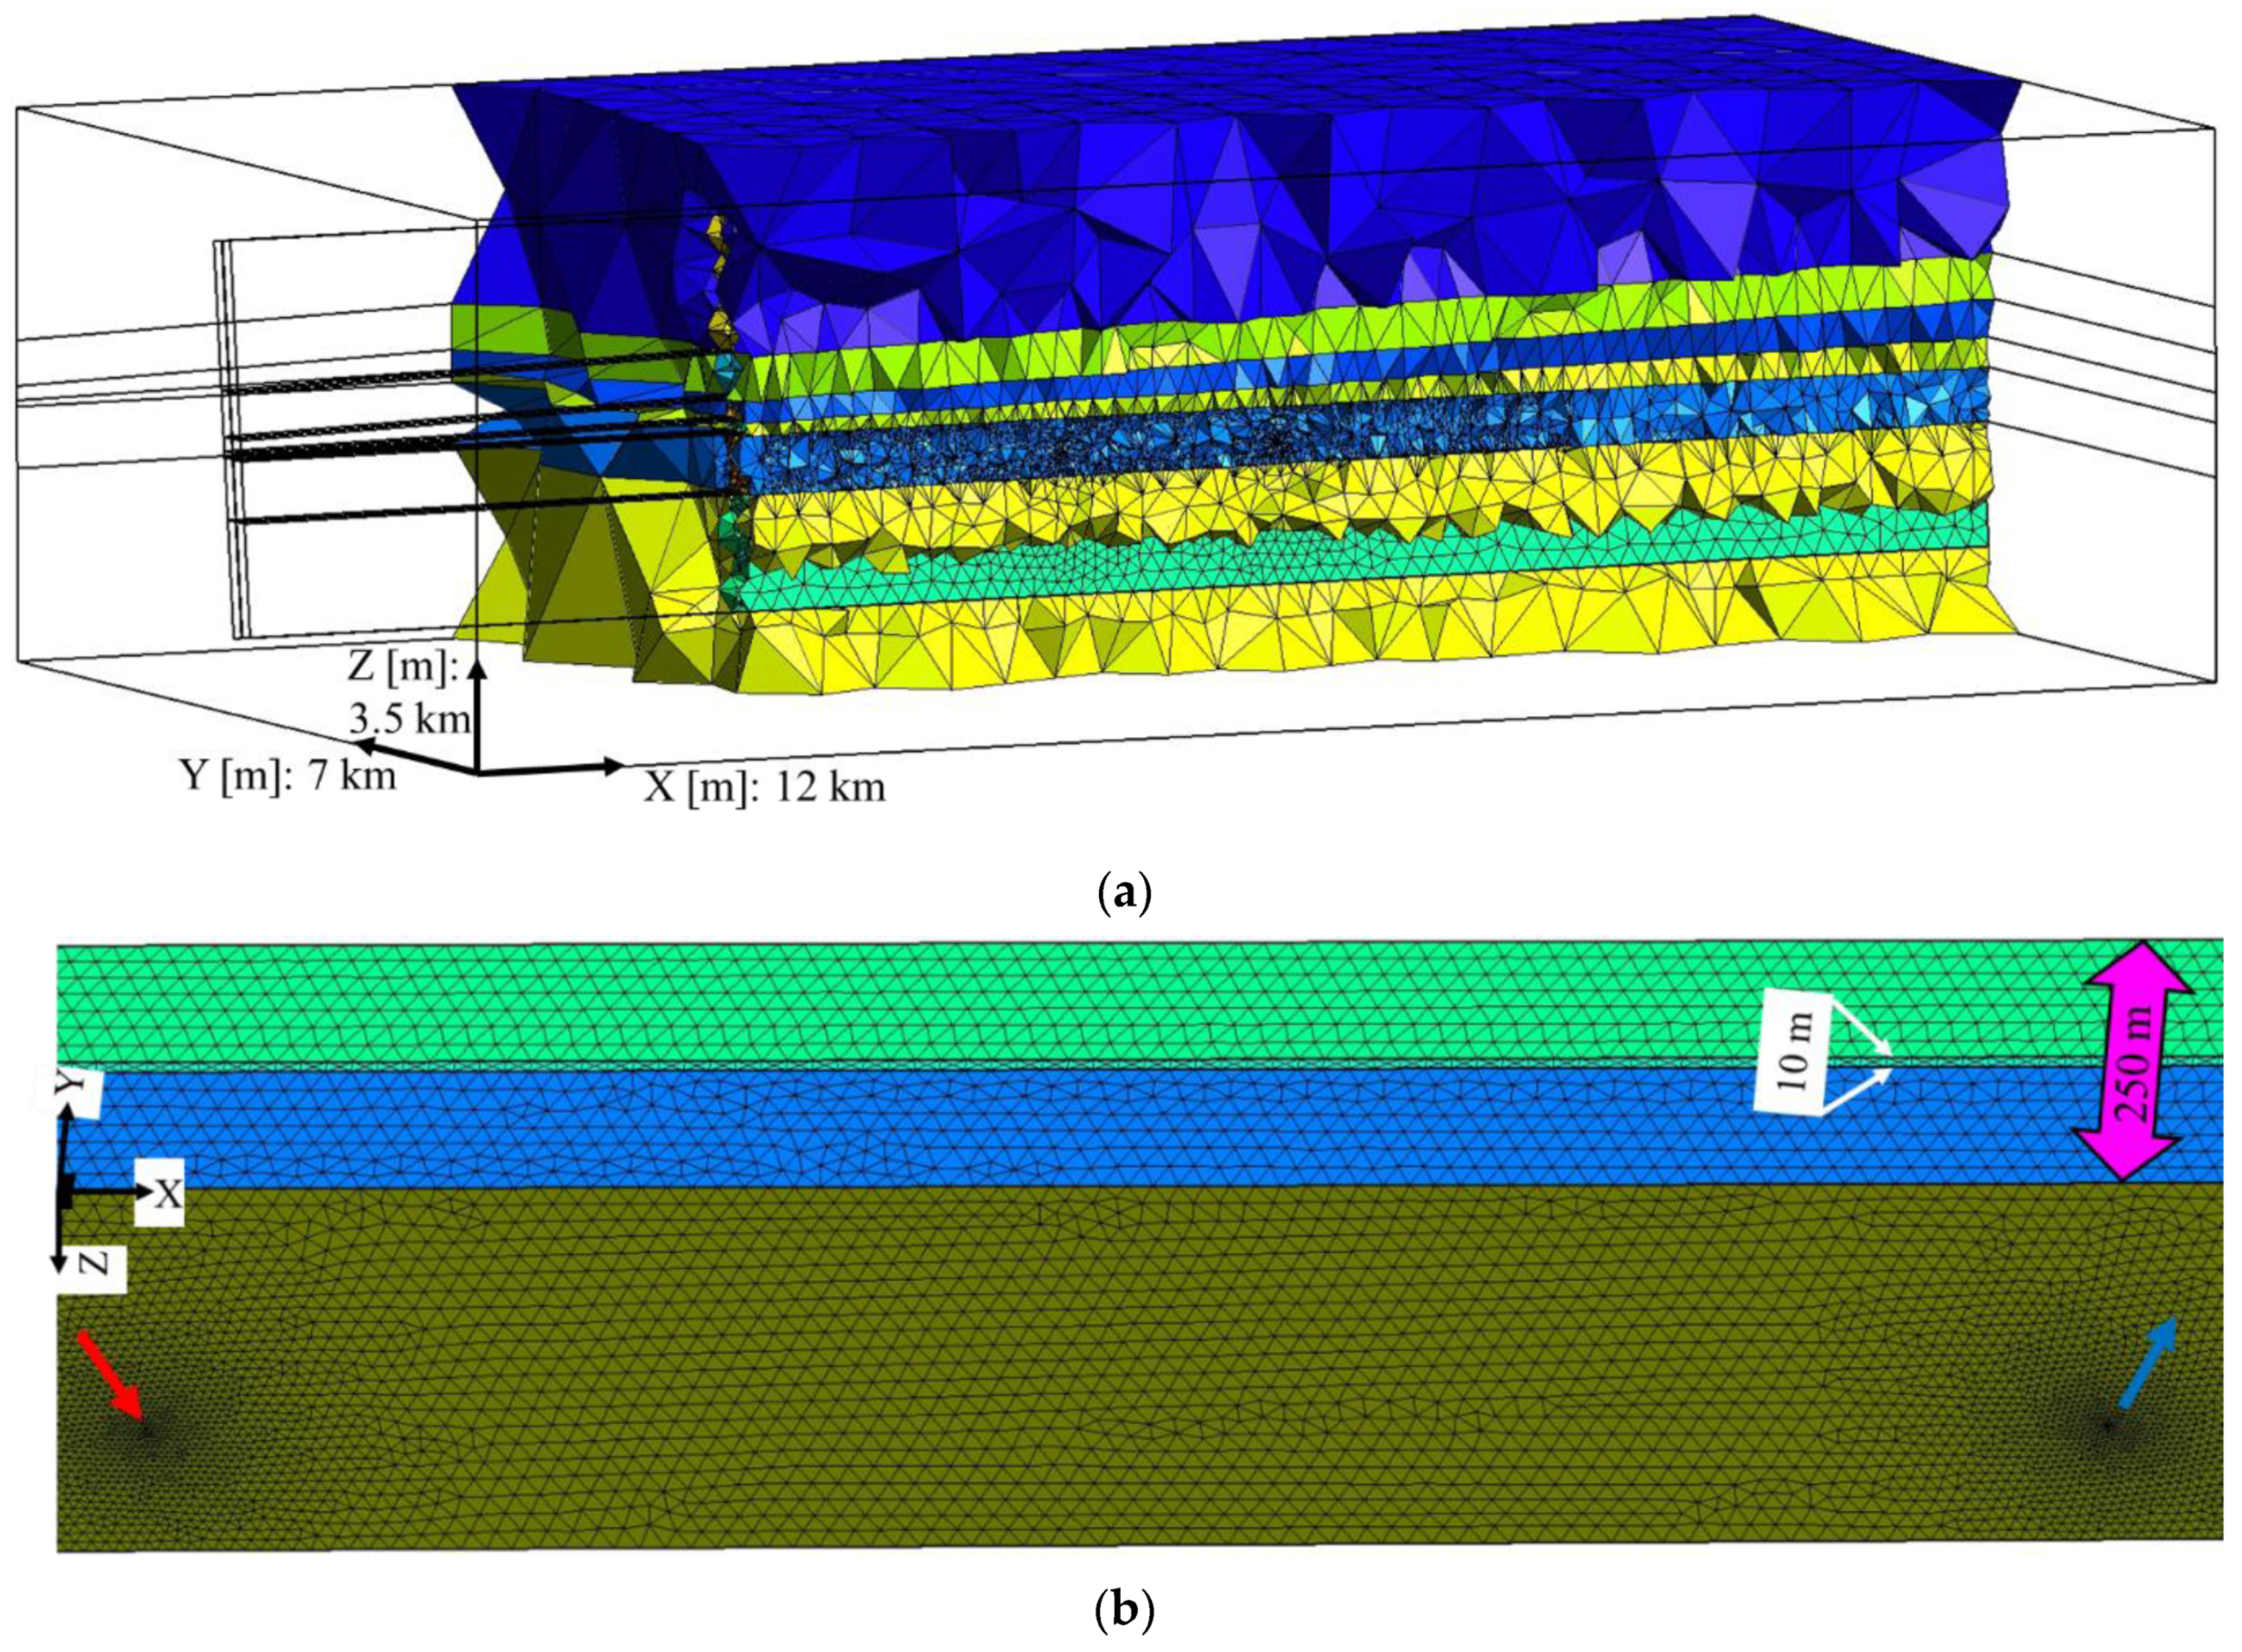
2.1. Geological Model

To assess the development of the Li concentration in the reservoir during raw material production, a generic model was developed, based on the existing geothermal settings in the URG (Figure 2a). The bottom layer with impermeable parameters represents the variscan crystalline basement and/or an aquitard. On top of the basement, a reservoir layer is defined (e.g., Buntsandstein). The reservoir is covered by further Triassic sediments (Upper Buntsandstein, Muschelkalk, Keuper) and the top layer displays Paleogene, Neogene, and Quaternary sediments. The model extends from the top layer in a depth of 1500 m down to 5000 m. In the center of the model, the top layer has a thickness of about 1300 m, Keuper approx. 300 m, Muschelkalk ca. 170, Upper Buntsandstein approx. 100 m, Buntsandstein (Reservoir) approx. 360 m, and a ground layer of about 1250 m. The thicknesses of the layers and the resulting inclination changes are based on published data for currently planned geothermal wells in the URG [60].
The fault zone crosscutting all layers is slightly inclined for representing one of the typical normal URG faults [23,25]. Fault cores in the Triassic sandstones can be fully or partly sealed [25,61]. In this simplified scenario, a uniform sealed core was assumed, with a thickness of 10 m following surface analogs [61]. Damage zones in the URG are reported to expand over several dozen meters from the fault core [25,61]. For the model, a damage zone of 125 m width in each direction from the fold core was assumed. The chosen width of the damage zone could result, independent of the lithology, from a fault displacement between 200 and 600 m [62], which is a realistic value for normal faults in the URG that could reach up to >2 km [23].
Only the open hole sections of the two geothermal wells are implemented in the model as the part hydraulically connected to the reservoir. Being deviated, the well’s open hole sections are separated by 700 m the top, and by 1690 m at the bottom hole depth. The open hole sections start at the top of the described reservoir layer on one side of the fault, crosscut the damage zones and the fault core, and reach their final depth at the bottom of the reservoir layer at 3735 m at the other side of the fault (Figure 2b).

2.2. Mesh Generation

For creating the mesh, the open-source mesh generator GMSH [63] was used. The model geometry is defined as a box with a lateral extension of 12 km × 7 km, large enough to avoid any effects of boundaries on simulation results (Figure 3a). The model comprises six geological formations with a total thickness of over 3500 m in the vertical direction. Two-dimensional flat planes represent the contact of the formations. The tilted fault damage/transmissive zone is recreated with a 3D element. In the middle of a damage zone, a 3D block with a width of 10 m represents the tight core zone. One-dimensional elements as shared edges are used to create the injection and production sections of the wells with deviated open-hole sections. The line elements are approx. 300 m long and have a given scale factor of 21.5 cm, representing an 8.5″ diameter borehole.
Due to the diversity and intersection of the geometrical elements (five 2D surfaces and several 1D lines passing through the two boxes), it is challenging to maintain mesh conformity where elements are arranged in a way that two of them intersect, sharing a face, an edge, or a node. The thick damage zone box splits into two zones due to the existence of the thin core zone in the middle. Each 2D flat plane generated as a boundary of the layers also splits into five ones due to intersecting the damage and core zones in the middle. Available functionalities such as Boolean operations in GMSH allow for a global intersection of the model taking care of the whole intersections, new elements generation, and embedment.
A multi-level mesh refinement in the model is carried out through several available functions in GMSH. Distance, Threshold, Constant, Restrict, and Box fields allow for a gradual mesh size increase of 4 to 750 m from the target points, lines, and surfaces toward the exterior. Figure 3 visualizes the refinement trend in the model. Mesh size in the damage and core zones and wells is forced to be kept as fine as possible. These fields are intermingled in a way that converges to the most efficient refinements with the least number of nodes and elements. The mesh contains 164,499 nodes and 1,181,197 elements.

2.3. Parametrization

The thermo-hydraulic parameters (cf. Table 1) are based on published reservoir model data from the URG [27,64]:
The fluid viscosity (0.00025 Pa.s) and density (1030 kg/m3) were defined for a fluid with a salinity of 150 g/L (comparable to the salinities in the URG) and the reservoir temperature based on data from the literature [66]. Solute diffusion was taken from tracer models in the URG (4e−10) [35]. The Li content was implemented as a solute representing a conservative tracer with an initial value of 100% in the fault zone and reservoir layer. Quantification of the Li production with the simulation results was later fulfilled by multiplying the output parameters of the solute dilution with Li concentrations between 160 and 200 mg/L, as measured in reservoirs of the Upper Rhine Graben [11]. For the initial pressure conditions, a function for the hydrostatic pressure was implemented, calculating a linear pressure increase as a function of depth. For the temperature, a depth-dependent temperature gradient was also applied and calibrated so that the production well has the typical URG production temperature of 160 °C [24]. The flow rate was set to 80 kg/s at both wells according to existing plants in the URG [15] and a lifetime of 30 years was projected.
For an outlook on the economics of future Li production in comparison to conventional geothermal heat extraction, a simplified scenario for energy output was calculated. For the specific heat capacity, a representative value for saline brines of 3600 J/kg·K was assumed [67,68]. Further, an availability of 90% (as for the Li extraction) of the plant and an efficiency of 90% for the heat transfer, as reported for geothermal heating plants [69], was assumed. The heat production was calculated based on the difference between the injection temperature (65 °C) and the temperature signal from the production well of the reference scenario as well as its mass flow.

2.4. Numerical Modeling

The thermo-hydro-chemical coupled simulations are performed using the finite element (FE) open-source application TIGER (THMC simulator for geoscientific research) [35,70]. The code is based on the MOOSE (multiphysics object-oriented simulation environment) framework [71] and has been previously successfully applied to multi-physical and multi-dimensional problems in geothermal reservoirs and wellbores [64,72,73].

2.5. Governing Equations

The approach solves the flow of reservoir brines coupled with the solute transport and heat in the geothermal reservoir and damage zone. It assumes a representative elementary volume (REV) for the porous media where interaction between the coupled processes and the liquid and solid phases can occur. The hydraulic field is solved for the pore pressure and using the balance of mass and momentum (Equations (1) and (2)) [74]:
b S P t + 𝛻 . b q = Q
q = k μ f 𝛻 P + ρ f g
where S is the mixture-specific storage [1/m]; P is the pore pressure [Pa]; t is the time [s]; Q is the source term for injection/production [kg/s]; q is the fluid or Darcy velocity vector [m/s]; k is the permeability tensor [m2]; μ f is the brine dynamic viscosity and combined known as the mobility term [Pa·s]; ρ f is the brine density [kg/m3]; g is the gravitational vector [m/s2]; and b is a scale factor [-] for considering missing dimensions in lower-dimensional elements such as fractures (2D) and wells (1D).
The non-reactive transport of Li and other dissolved minerals (Equation (3a)), as well as heat (Equation (3b)), is described by the well-known advection (-dispersion)-diffusion equation [74] and assumes thermal/concentration equilibrium between the liquid and solid phases:
b φ C t + b ( 𝛻 . D 𝛻 C + q 𝛻 . C ) = Q
b ρ C p T t + b ( 𝛻 . λ 𝛻 T + ( ρ C p ) f   q 𝛻 . T ) = Q
where C is the Li/solute concentration [-]; φ is the porosity [-]; and D is the sum of molecular diffusion and dispersion [m2/s] [75]. ρ C p and λ are the heat capacity [J/K] and thermal conductivity [W/m·K] of the mixture, respectively. ( ρ C p ) f represents the heat capacity of the fluid.
According to Equations (3a) and (3b), the dissolved Li moves by advection due to the brine flow and along this fluid propagation front, it mixes diffusively following the concentration gradient. The open-hole section of the borehole is included as a lower-dimensional feature sharing edges with the reservoir and representing the zone of active hydraulic connection to the reservoir. The flow rates are implemented as Dirac kernels on top of the open-hole section for injection and extraction. On the margins of the model function, Dirichlet boundary conditions are applied for temperature and pressure.
A reactive Li recharge or discharge (source or sink term) by water–rock interaction is not implemented in the model.

2.6. Model Scenarios
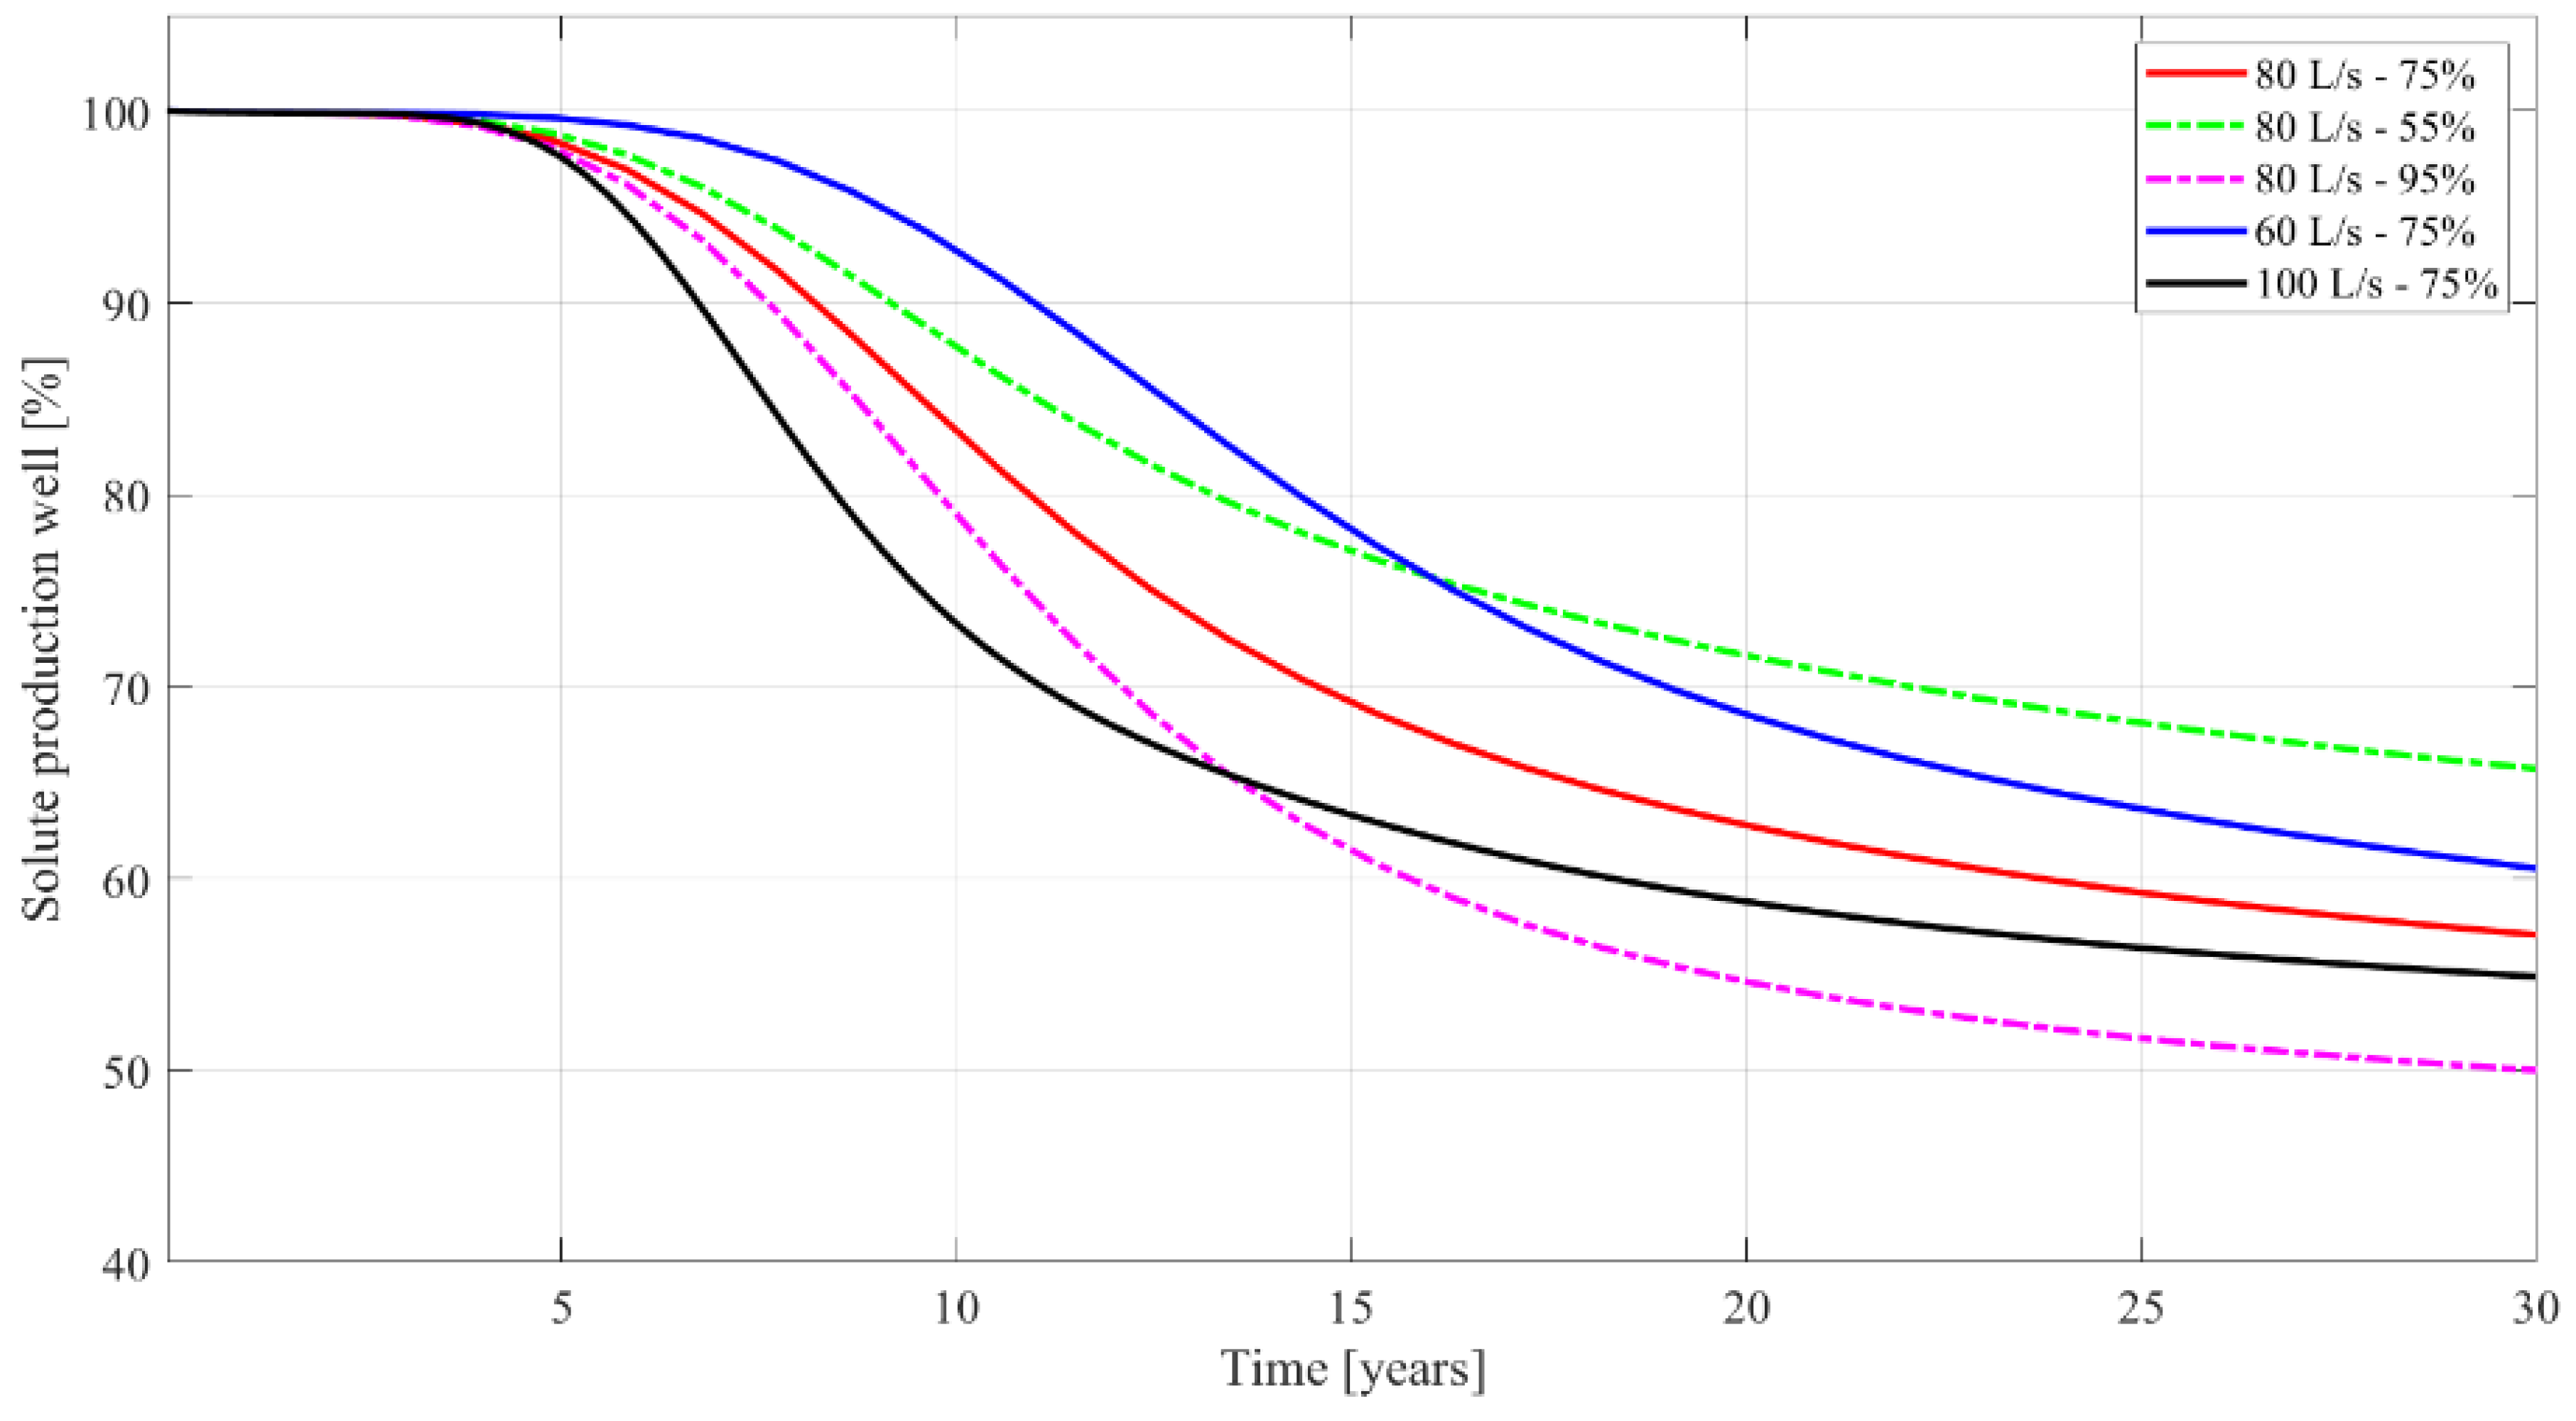
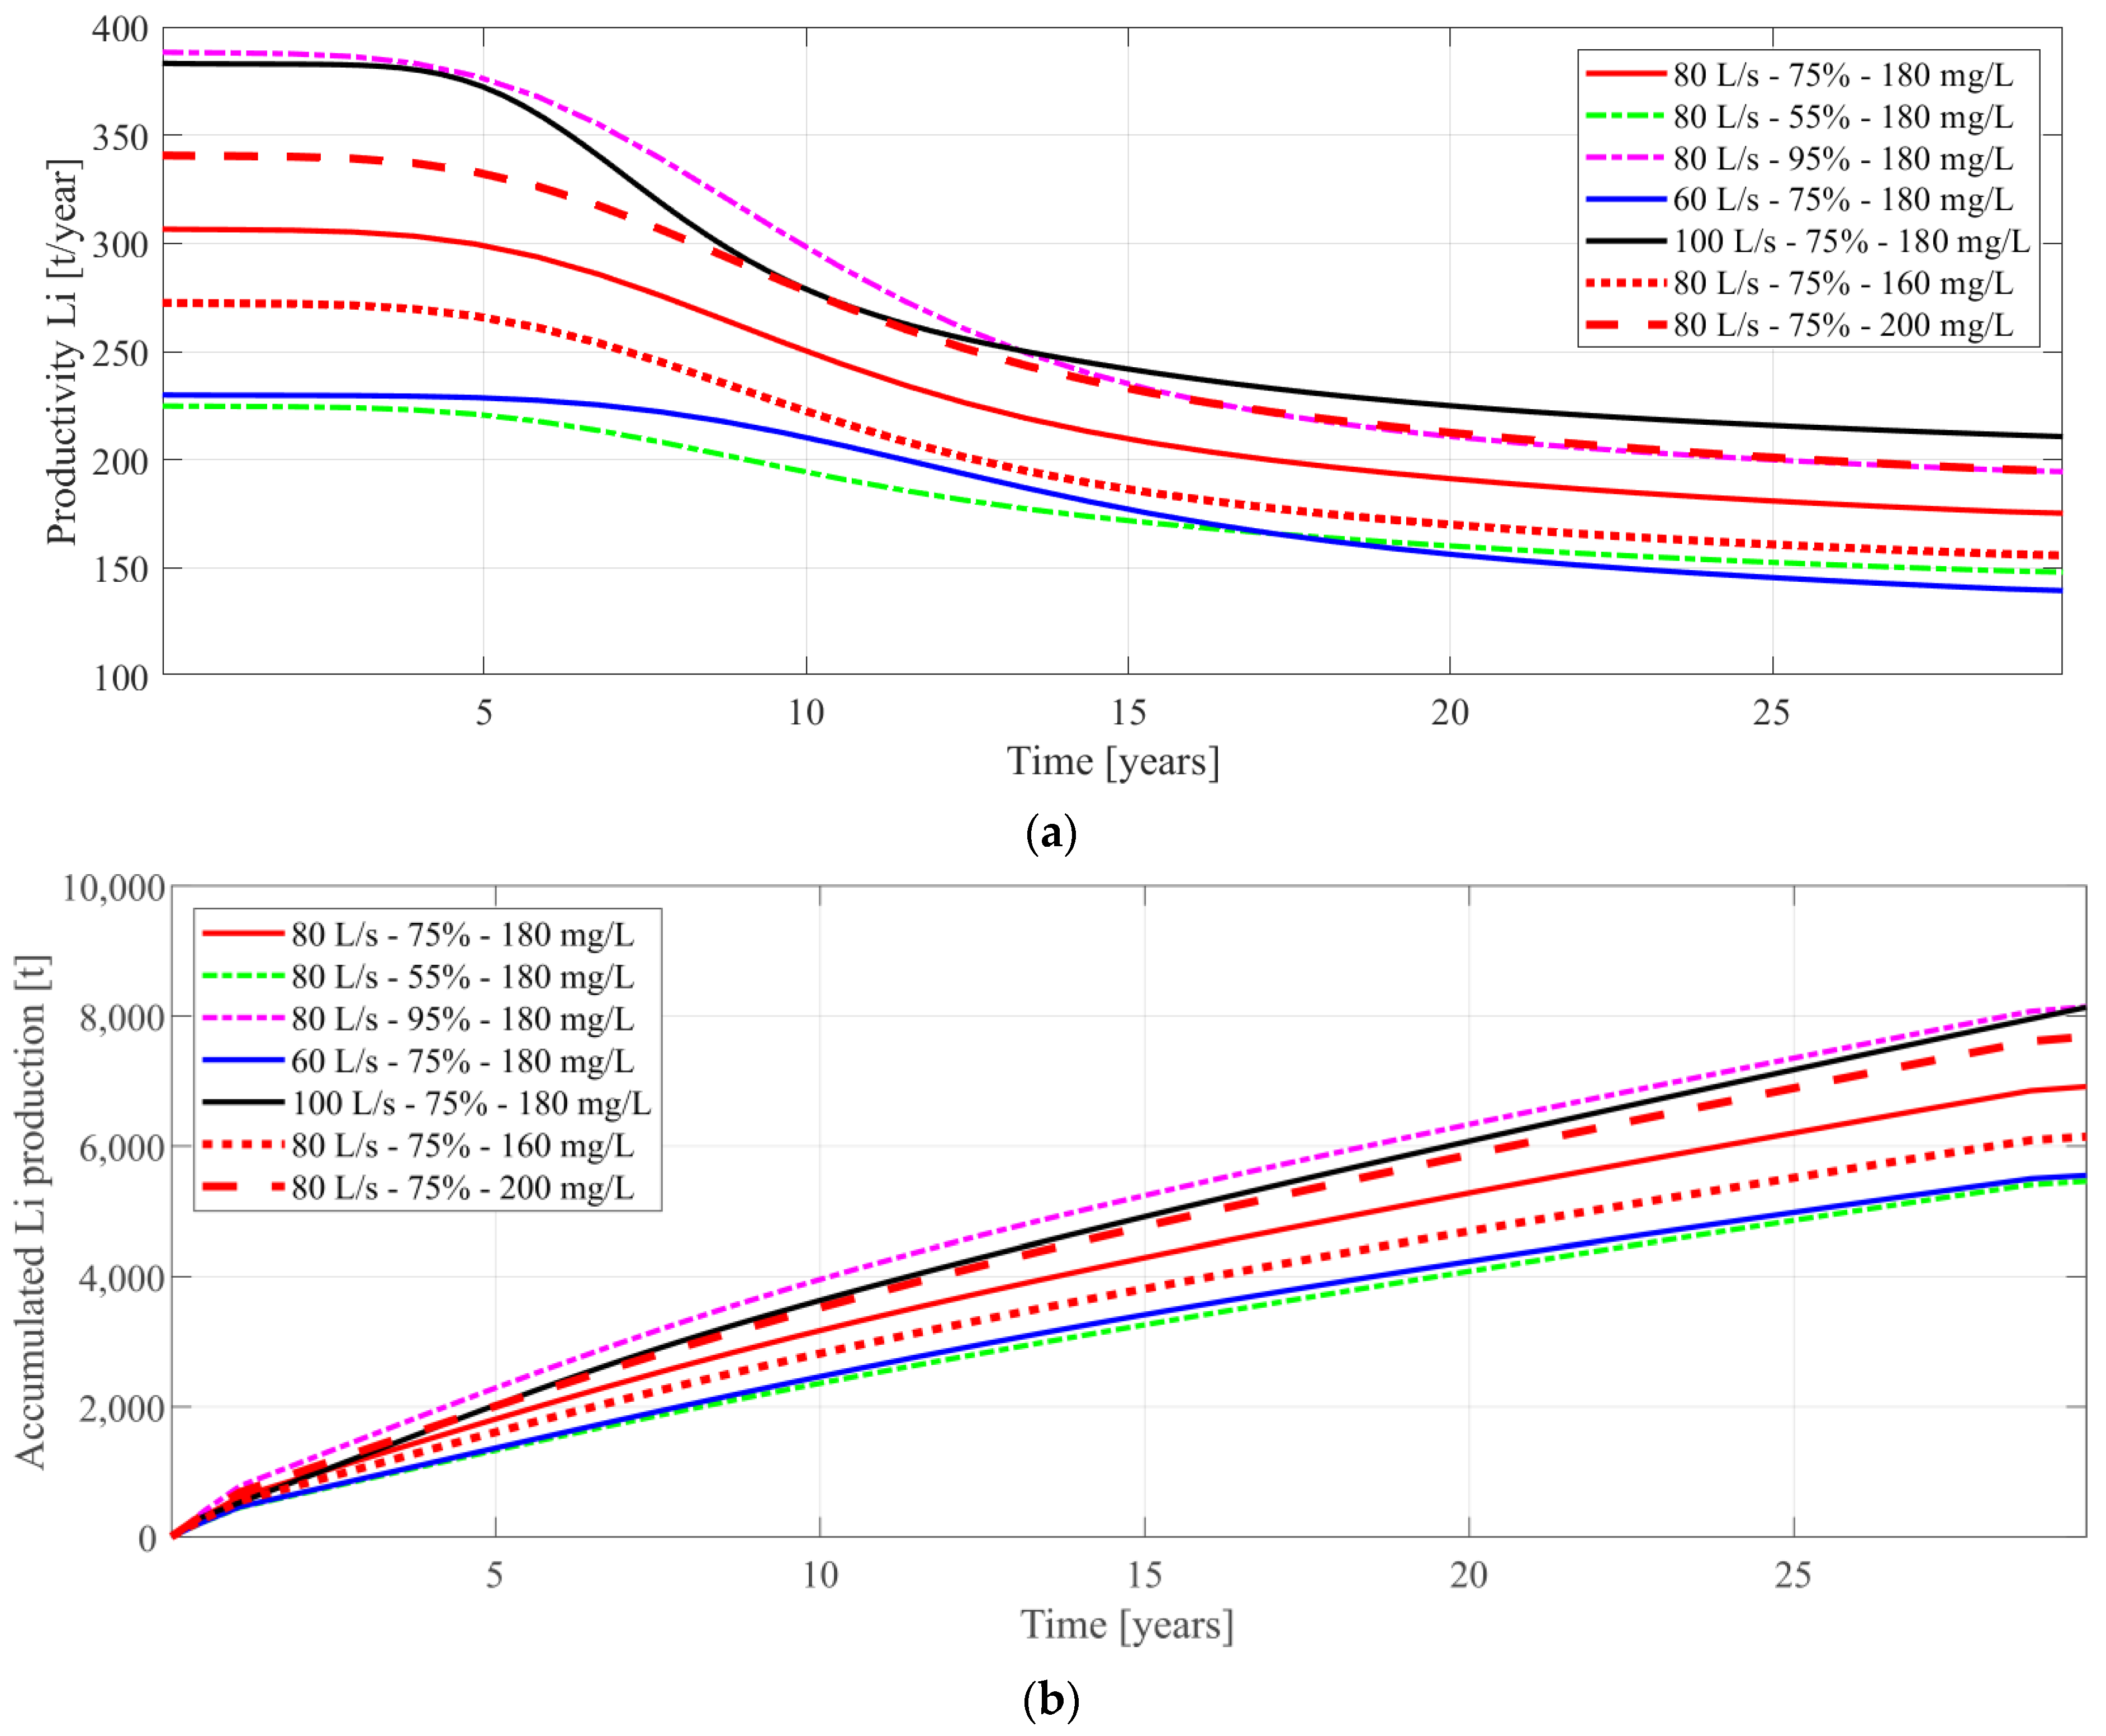
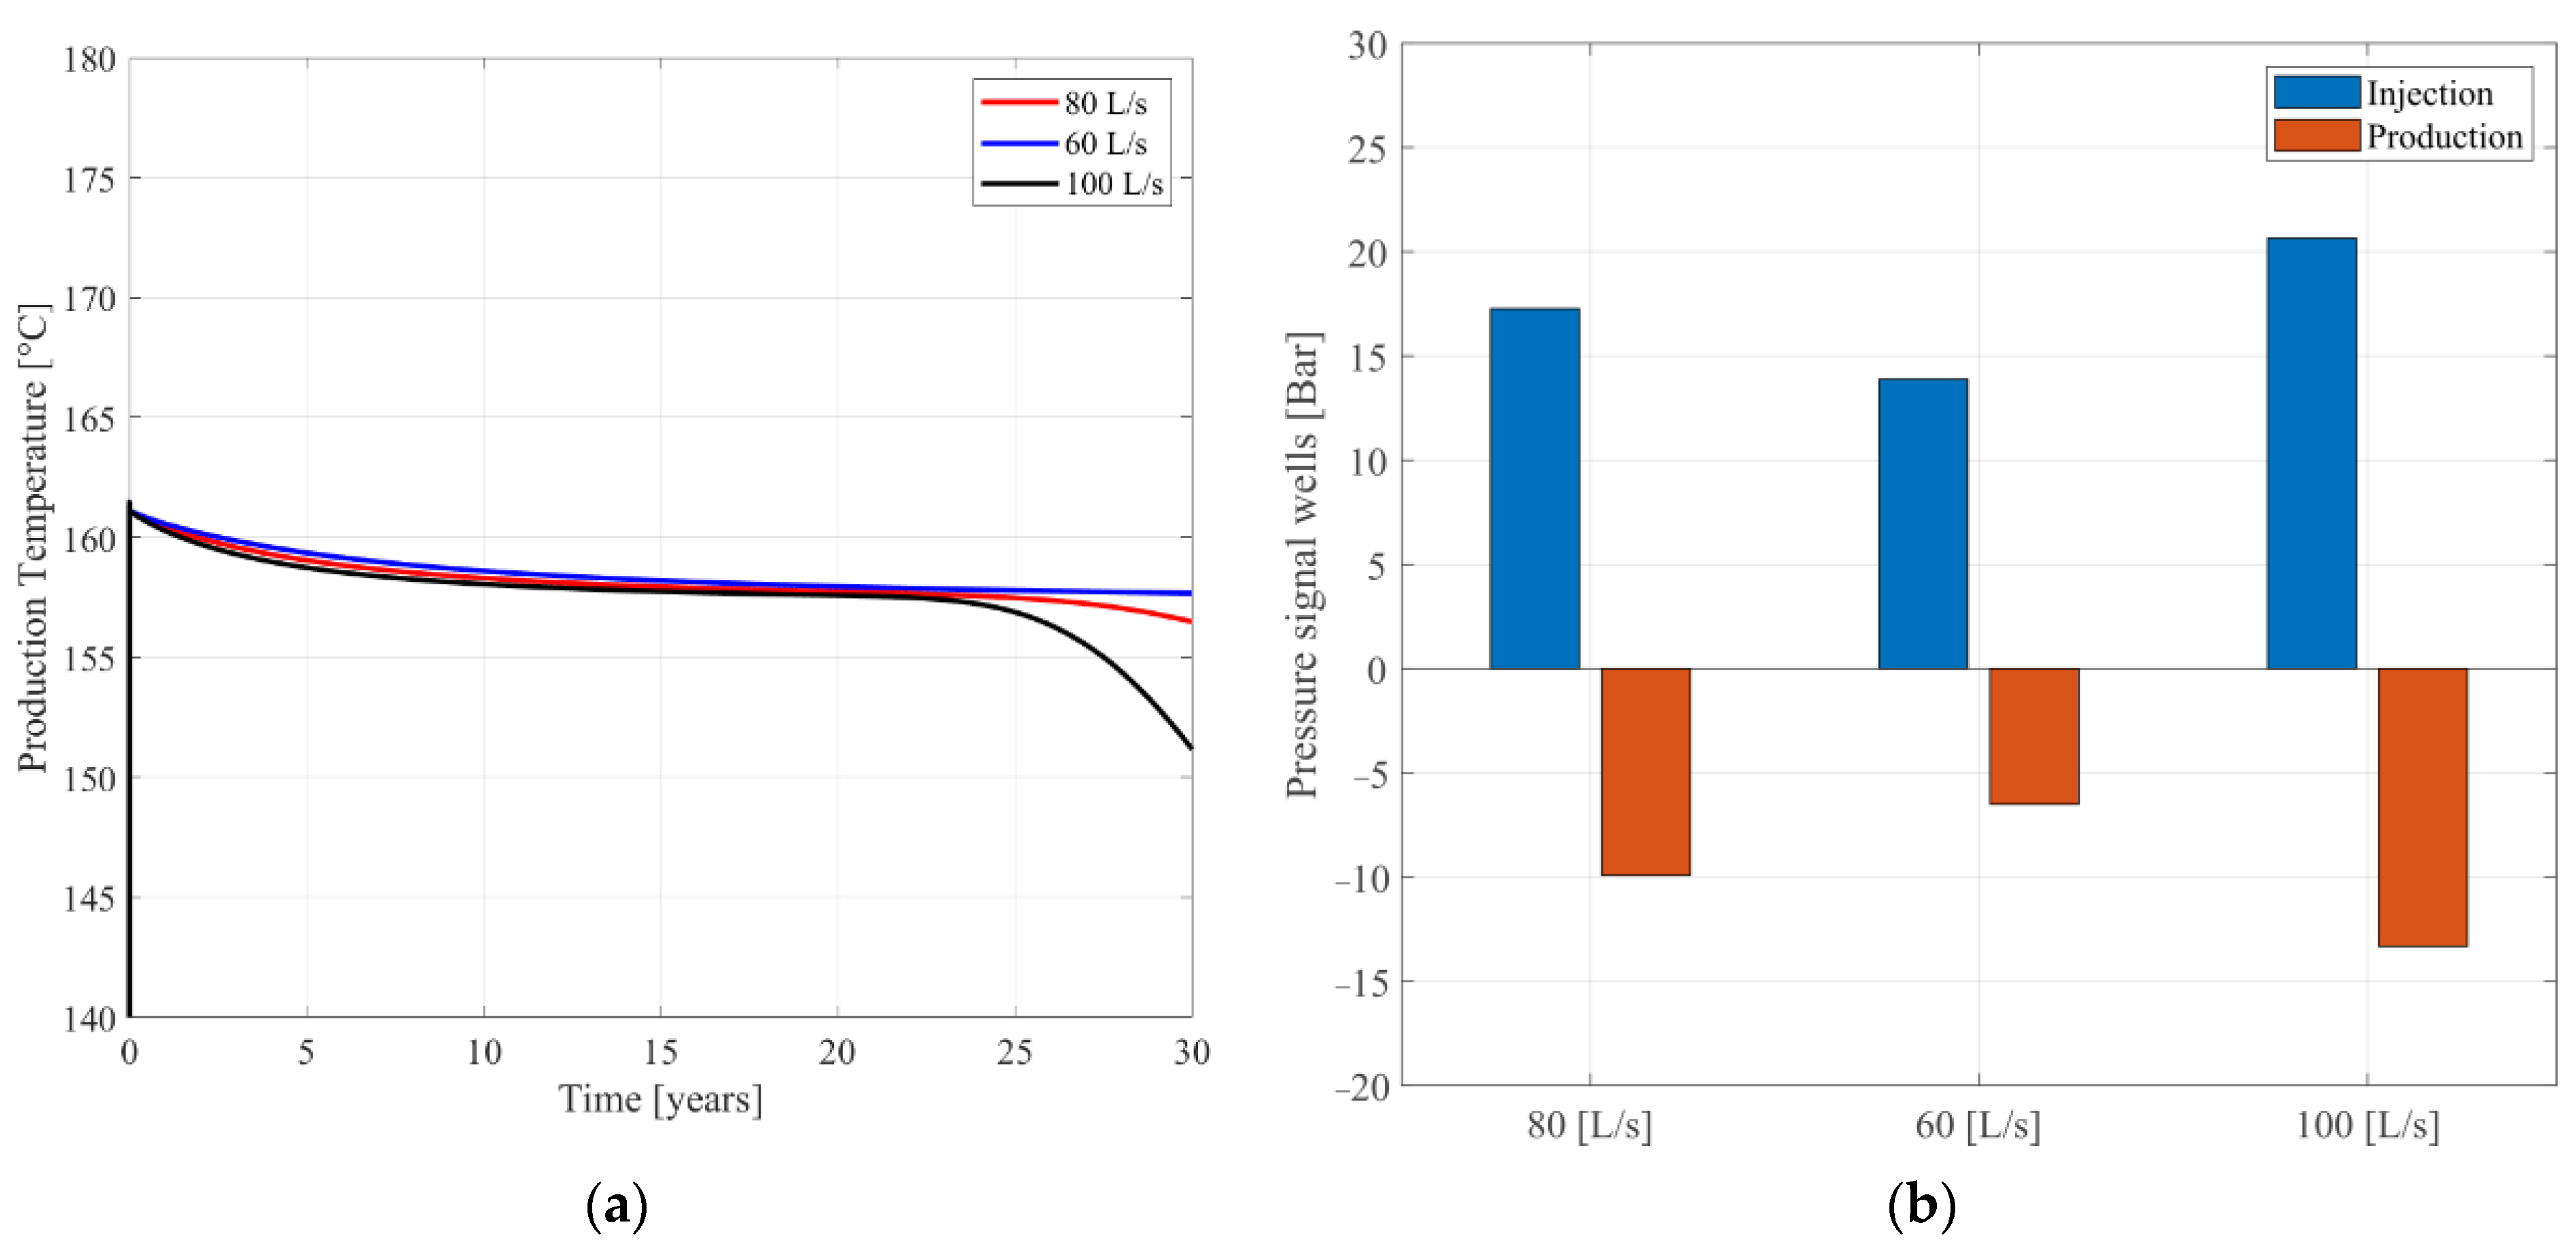
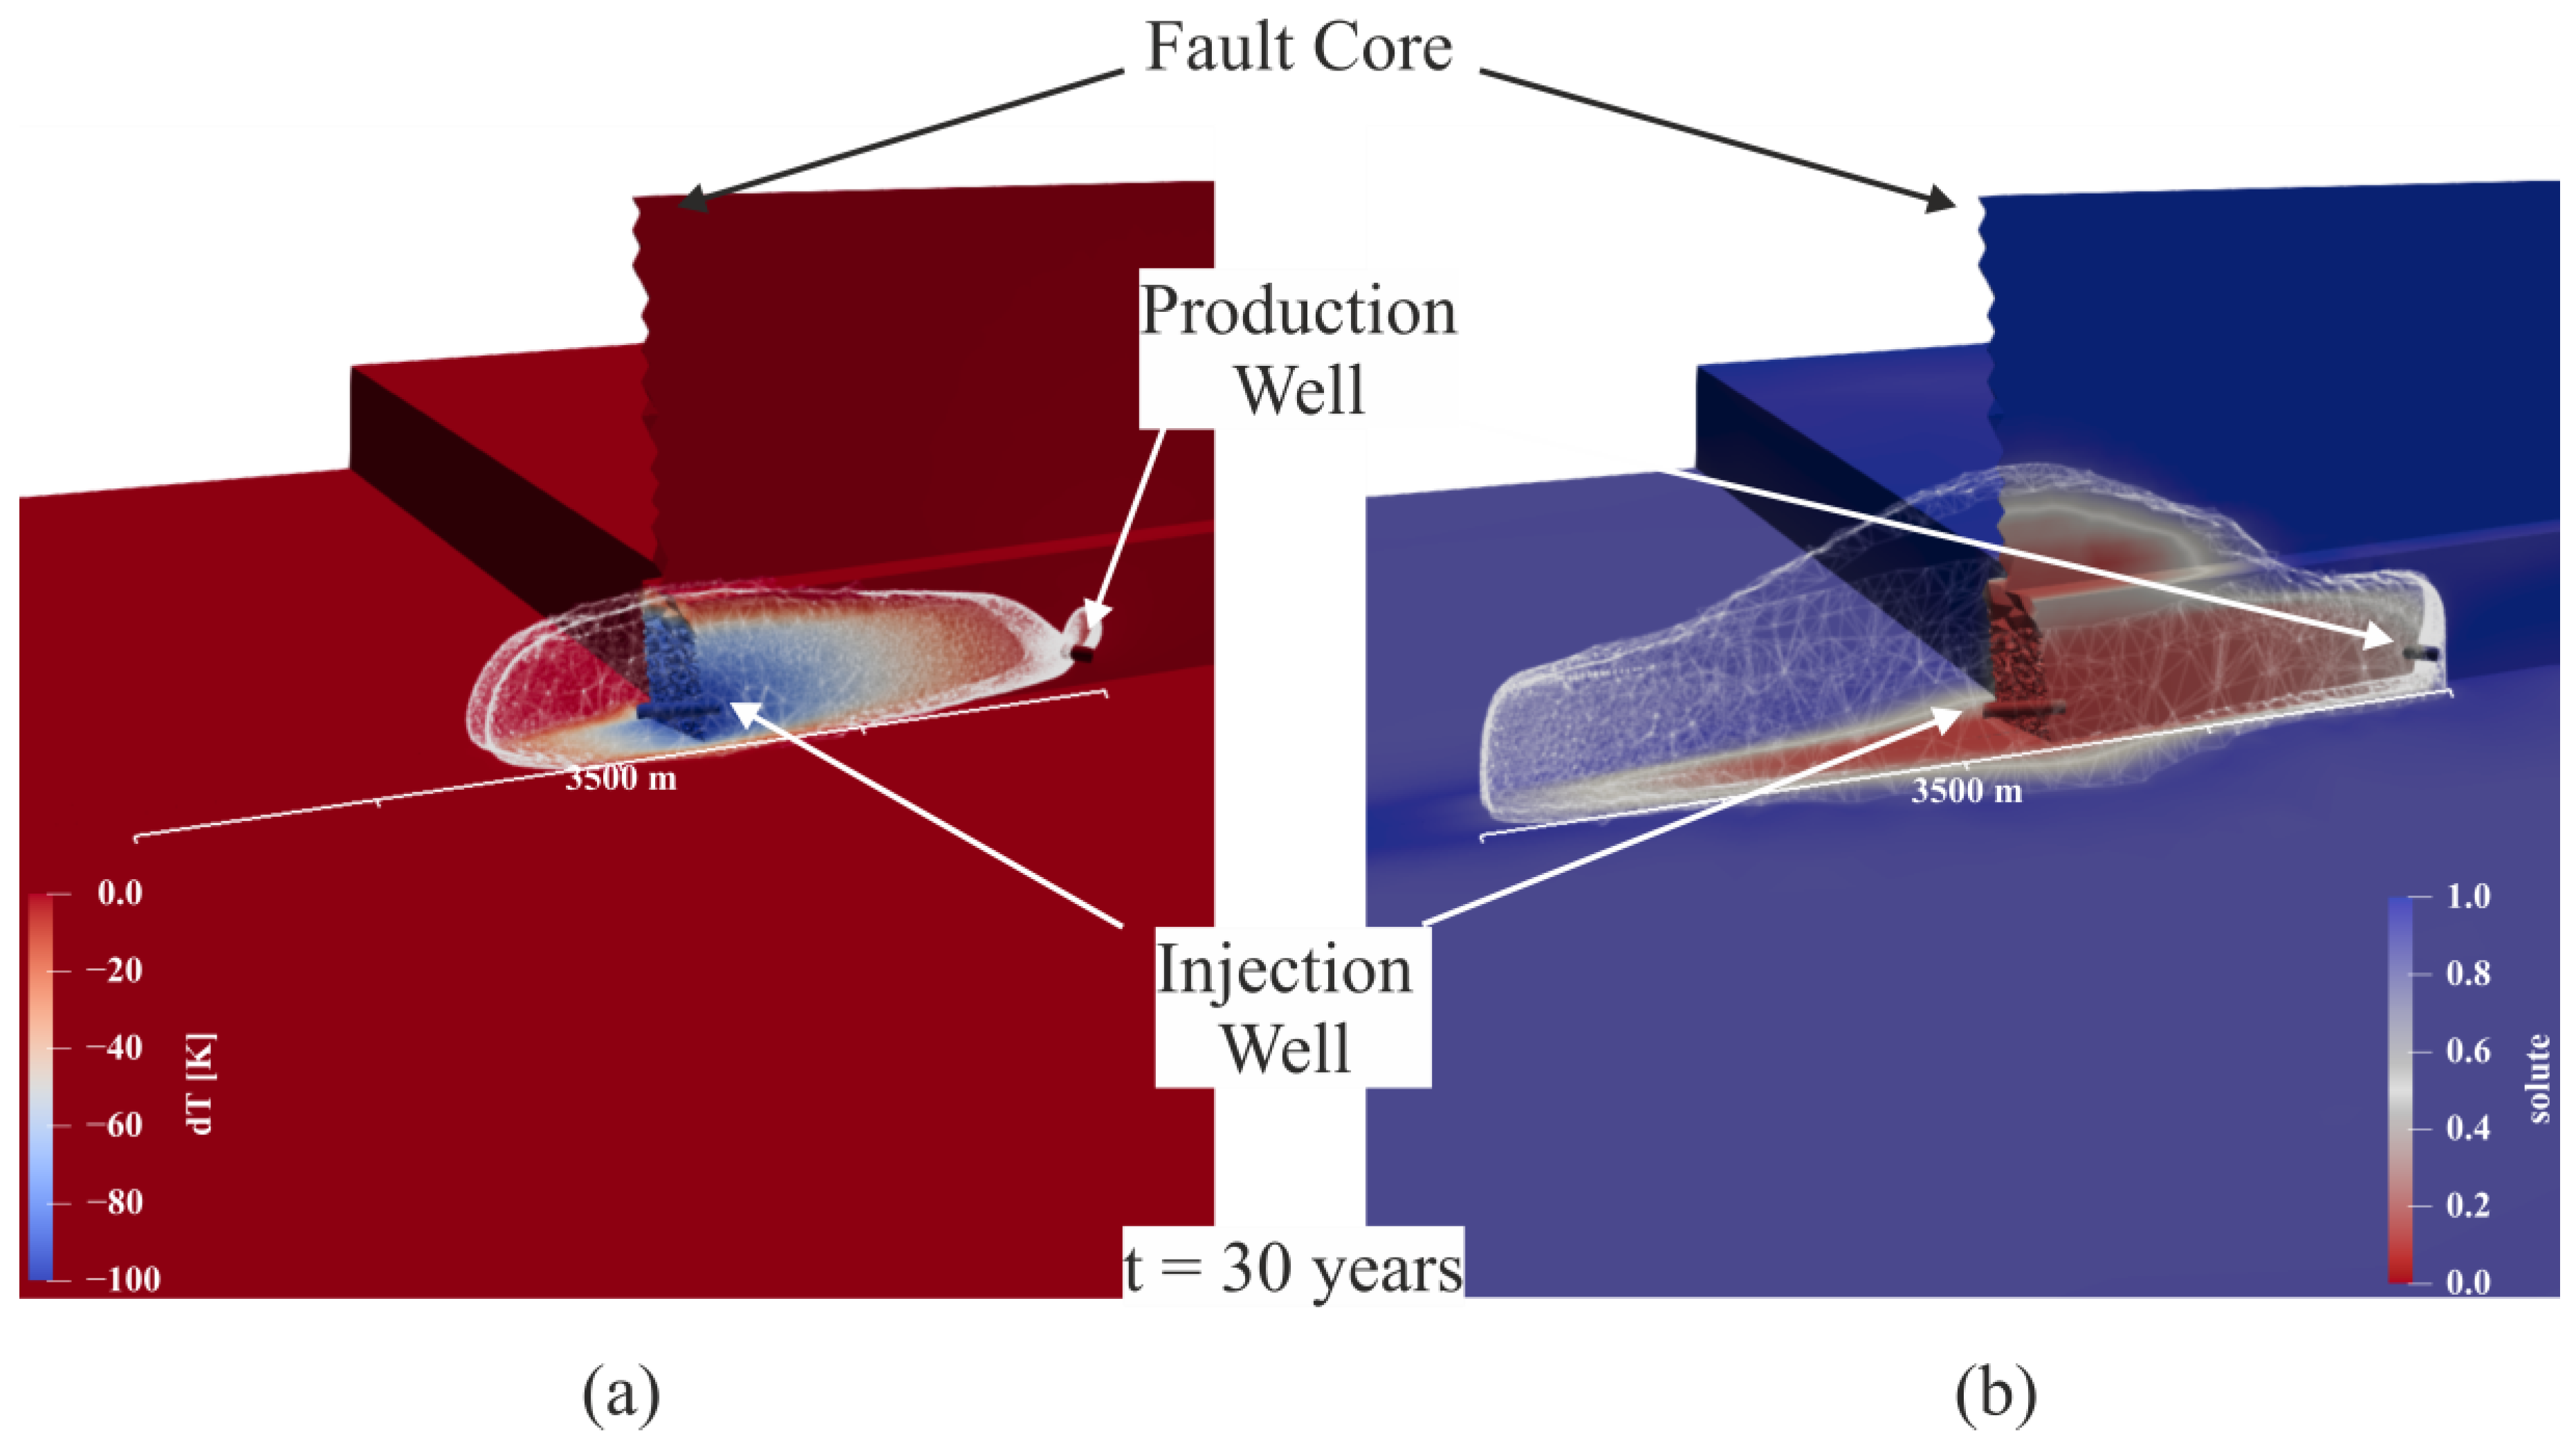
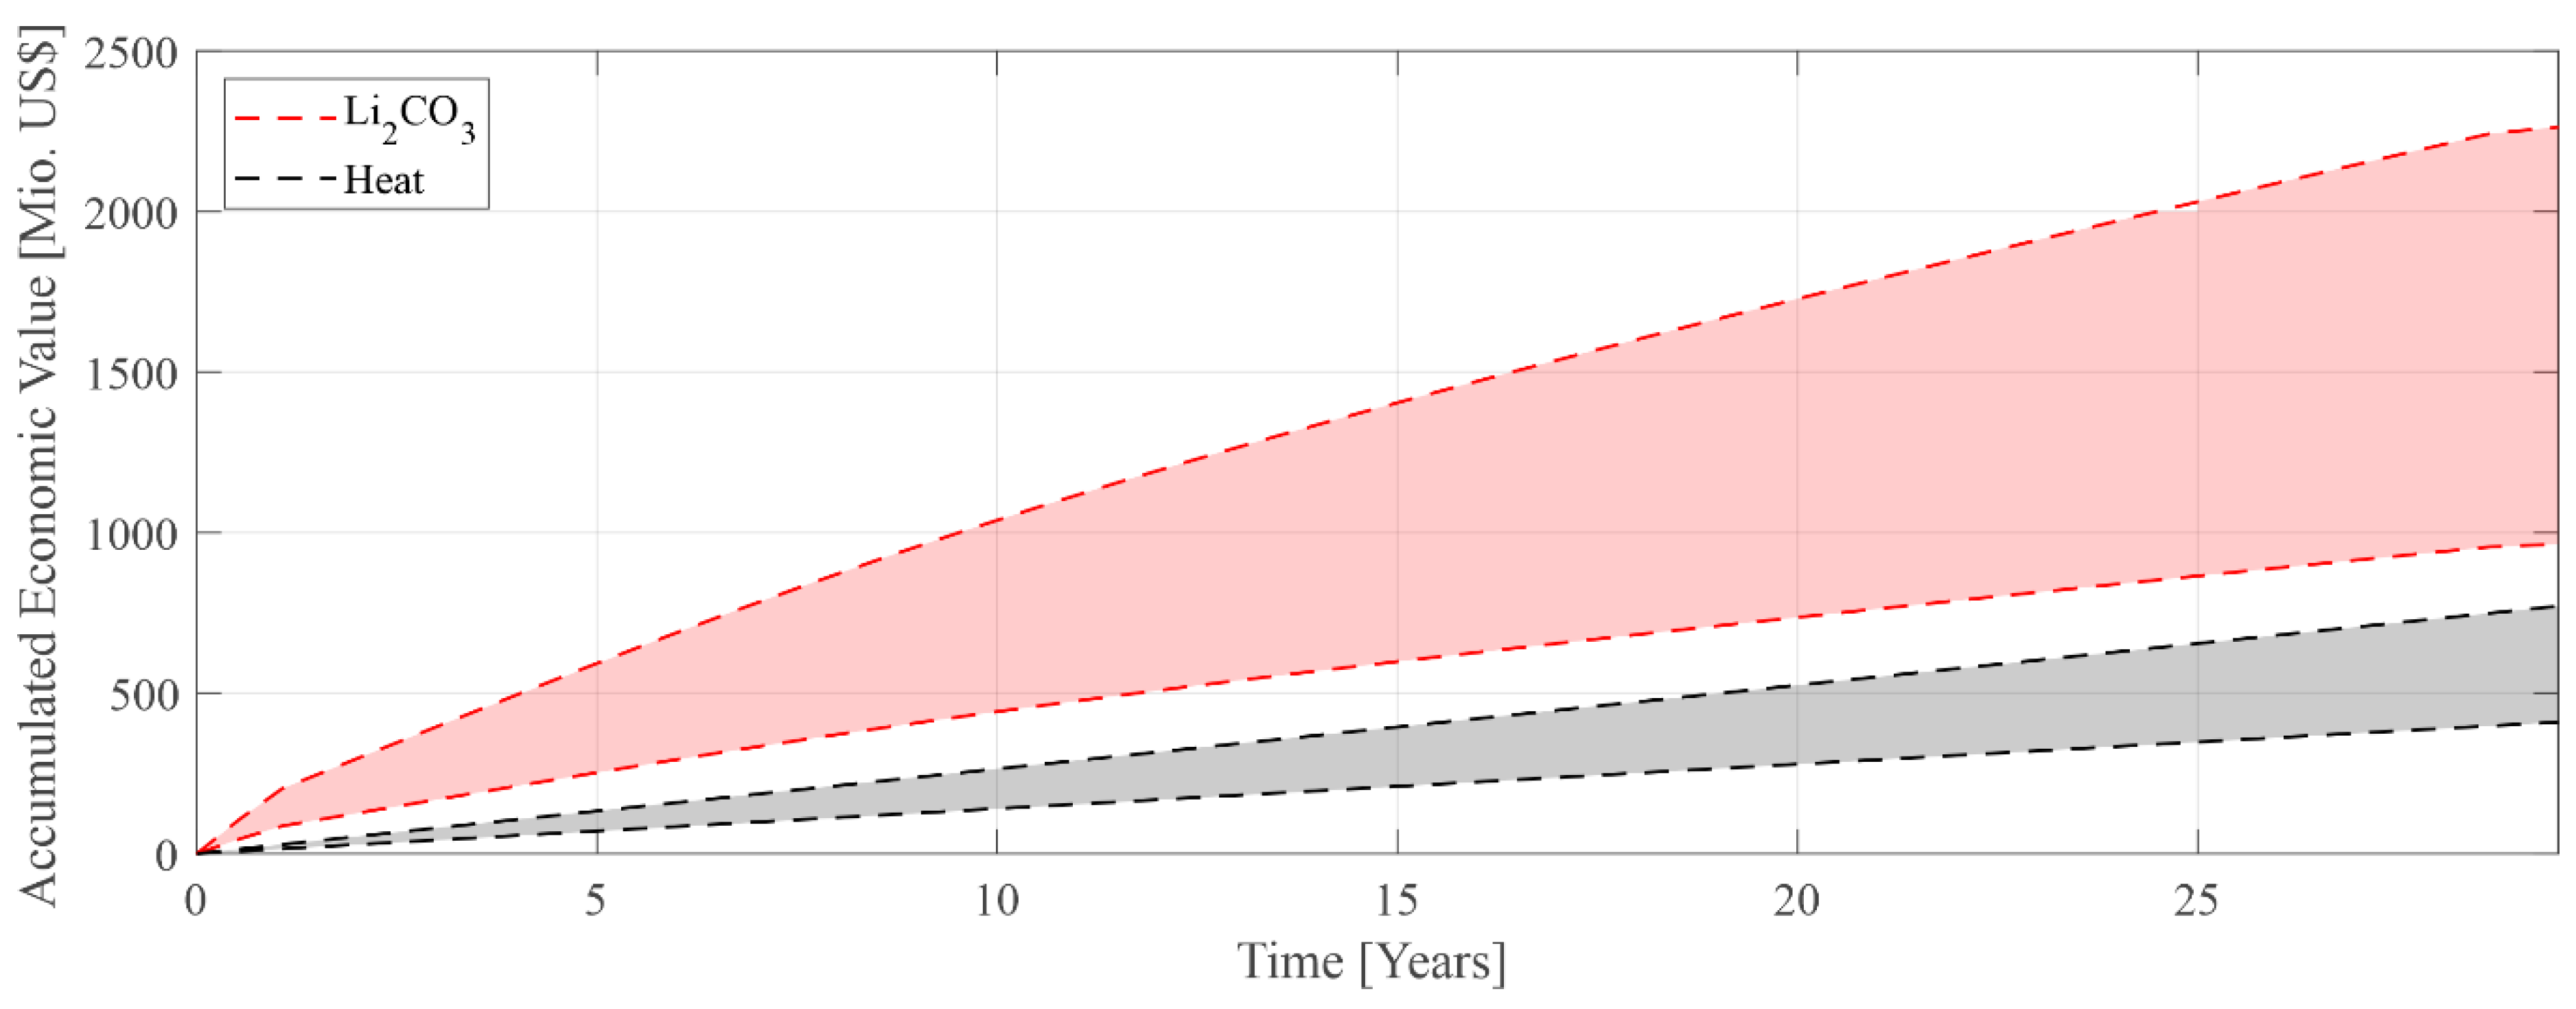
Different model scenarios are calculated to assess the sensitivity of operational parameters on the Li output (Table 2). The impact of extraction efficiency and flow rate are evaluated in separate simulations. Values for the extraction efficiency are varied based on the technological comparison (55, 75, and 95%) of prototype results in the intended environment [14] (see Section 1.3). For the flow rate, data covering the range of existing projects as well as predicted higher flow rates of future projects are used (60, 80, and 100 L/s) [15,26,27]. The sensitivity of the Li concentration is calculated by multiplying the solute output as a fraction of 100% from the reference case with varying Li concentration in the range of values measured in the URG (160, 180, and 200 mg/L) [11].

3. Results

The maximum overpressure at the injection well shows 17 bars for the reference scenario (80 L/s) and 14 and 21 bars for 60 and 100 L/s (Figure 4b). As expected, the pressure has a strong flow-rate dependence and is in the order of magnitude measured at hydraulic tests in the Upper Rhine Graben at similar flow rates [76]. Regarding the temperature, we see in all three scenarios initially a heating up at the production well, due to the water being drawn in from deeper reservoir domains being hotter due to the geothermal gradient. After reaching the aquitard at the bottom layer, the withdrawal also propagates more upward along the fault zone, causing a slight temperature decrease below the initial temperature after 2 years due to the influence of water intrusion from more shallow and subsequently cooler domains. Following this time step, the temperature is stable for two decades in all scenarios. After 22 years, we can see a clear thermal breakthrough in the 100 L/s scenario with the arrival of the injection-related cold temperature signal at the production well. Furthermore, in the 80 L/s scenario, a slight hydraulic breakthrough is observable at the end of an observation period of 30 years, while the 60 L/s scenario remains stable (Figure 4a). The temperature models are in good agreement with typical projected geothermal plant lifetimes of 20–30 years [13,73,77] in which no breakthrough of the injection temperature should occur. The calculation of the heat output of the reference scenario derives a thermal capacity of 21–22 MWTh, which is a typical value for a plant of this size.
If we compare the propagation of the temperature and the solute (representing the Li concentration) drawdown (Figure 5), it becomes apparent that the solute propagates faster than the temperature signal. Both signals propagate along the damage zone in the reservoir layer following the pressure gradient between the injection and the production well, but the solute shows a lower diffusion rate in comparison to the temperature. The damage zones between both wells are almost totally depleted in solute in the reference scenario after 30 years (Figure 5b). In the opposite lateral extension, the Li depletion signal propagates up to 2000 m along the fault zone. In comparison, the temperature signal (Figure 5a) only arrives at the end of the observation period at the production well. In the other direction, the temperature shows a far lower extension of just 1000 m lateral propagation along the fault zone. Especially in the temperature signal, the sealing effect of the fault core is further observable. Further, due to the impermeable parametrization of the bottom layer, vertical propagation of temperature and solute occur mainly upward.
In the first 5 years, there is only a minor solute concentration decrease at the production well (Figure 6) for all scenarios. After this period, the solute developments start to vary strongly. A decrease of 5%, for example, first occurs in the 100 L/s scenario after as little as 6 years, in the reference scenario after 7 years, and at 60 L/s after 9 years. For the first 13–16 years, the flow rate shows the largest influence on the solute concentration. Thereafter, the 95% Ex and the 55% Ex scenario form the margins of the predictions of solute development. The flow rate has a larger influence on the slope of the breakthrough front, but in the long run, the extraction efficiency shows a larger influence on the concentration. In the reference scenario, 57% residual solute concentration is predicted at the production well after 30 years. The 95% Ex scenario draws down to 50%, and the 55% Ex scenario stabilizes at 65%. The variation of the flow rate by 25% from the reference scenario causes a relative change of 5% in the final solute concentration. The extraction efficiency variation of 27% causes a 14% relatively higher value in the 55% Ex scenario and a 12% relatively lower concentration in the 95% scenario in comparison to the reference case.

4. Discussion

To make the numerical results comparable, the Li productivity and the accumulated producible Li amount were computed (cf. Table 3, Figure 7). To calculate the productivity, Equation (4) [5] was applied.
m = Q · A · c · q Q · ε
m = L i   m a s s t a
Q = F l o w   r a t e L s : Model specific
A = A v a i l a b i l i t y : Assumption 90% (329 days) [30,78]
c = L i t h i u m   c o n c e n t r a t i o n m g L : Input from numerical model and scenarios
q Q = E x p l o i t a b l e   p a r t i a l   f l o w   r a t e : Assumtion 100% [30,78]
ε = E x t r a c t i o n   e f f i c i e n c y : Model specific
The numerical model gives as an output the solute concentration of the production well in terms of the scenario analysis for flow rate and extraction efficiency. For all time steps, the difference between the solute concentration at the production well and the following injection is taken from the model as the function of the residual Li concentration in the reservoir and the extraction efficiency of the Li production. The solute difference is then multiplied with the different initial concentrations from the scenarios, the flow, and the availability, and is integrated over time and normed to tons per year (Figure 7a). Beyond the reference concentration of 180 mg/L, the influence of Li concentration differences in the reservoir was analyzed by using the numerical output from the reference scenario and two alternative concentrations (160 mg/L and 200 mg/L).
At the initial period, all scenarios show the same Li output as the shear static estimation of a function of flow rate, availability, extraction efficiency, and the initially measured Li concentration as previous calculations [5]. All parameters are linear factors in the productivity function (Table 3). The reference scenario shows an initial productivity of 307 t per year, and all parameters influence linearly with their initial variation from the extraction scenarios (see Table 2 and Table 3). At the time steps where the solute reduces, the dynamics and importance of the simulation becomes apparent as the productivity consequently decreases. With the stronger Li dilution in the 95% Ex scenario after 13 years, the 100 L/s scenario becomes the most productive one up to the end of the observation period. On the contrary, the performance of the 60 L/s scenario is overtaken by the 55% Ex scenario with the higher flow rate. While extraction efficiency shows the strongest influence on solute development, the flow rate has the highest influence on productivity. The initial productivity of the reference scenario decreases over time from 307 to 175 t/a Li (1630–930 t/a LCE) by 43%. The strongest decrease in productivity comes from the 95% scenario with 50%. The importance of the flow rate as a function of the reservoir connection also becomes apparent if we compare the 160 mg/L (80 L/s) scenario with the 60 L/s (180 mg/L) scenario. Over the whole observational period, the “lower quality brine” scenario with 160 mg/L scenario shows better performance than the “low flow” scenario with 60 L/s.
The accumulation of the produced Li over time (Figure 7) shows a similar tendency. The highest amount of Li is also produced in the 100 L/s scenario, slightly more than in the 95% Ex scenario. The head start of the “high extraction” scenario is just caught up at the end of the observational period. In a longer observation period, this difference would become larger. Again, it is shown that within the reported range of values for flow rates, Li concentrations, and extractions efficiencies, the Li concentration in the reservoir shows the lowest influence on the raw material output.
Over the observation period, the reference scenario produces 6920 t Li (36,834 t LCE). In the end, the higher extraction efficiency and flow rate result in an 18% higher output of 8150 t Li, while the lowering of both parameters at the same quantity causes a decrease of 20%. The results show that the output does not increase linearly with the improvement of the technical parameters (flow rate and extraction), but approaches a limited value.
From a technological point of view, high extraction scenarios are very challenging, causing higher retention times of the brine on the surface or higher material demand and accordingly higher operational costs [14]. With higher flow rates, better results are achieved in the long run and thus emphasize investing initially in reservoir exploitation rather than trying to increase the last percentage points of extraction efficiency. Moreover, these investments would also positively influence the energy output. Since existing wells showed the best-case flow rates of 70–80 L/s, the biggest lever for enhancing Li output is the number of wells.
A large uncertainty, which so far is not considered in the model, is a Li recharge from the rocks to the reinjected Li-depleted brine. Alteration experiments, with 2- molal NaCl-solution at 200 °C and granites from the Schwarzwald as a URG reservoir analog, showed a Li release of up to 3 mg/L after 36 days [31]. This indicates that there will be a Li recharge to some certain degree, but since there are no time-resolved data, it cannot be anticipated how much a transient recharge will affect the results in approx. 5 years from injection to the first arrival of the chemical signal at the production well. In addition, in comparison to the alteration experiments, the reinjection brine is not Li-free but remains at a Li concentration of 45 mg/L in the reference scenario, with 75% extraction efficiency and 180 mg/L Li initially. Considering also the highly complex genesis of the initial waters, the uncertainties were considered too large for implementing a recharge function in the model based on the current knowledge.
Along with this, the uncertainties related to the reservoir itself pose the largest dependencies. Faults between the two wells, as given, for example, in Bruchsal [25], or a connection of the fault into the crystalline basement could tremendously delay a solute breakthrough. Further, the presented models favor a strong fluid flow along the fault due to the permeability contrast between the matrix and the fault. A more homogenous permeability distribution in the reservoir would most likely also delay or weaken a Li breakthrough [79]. Nevertheless, with the temperature breakthrough after 30 years and pressure signals comparable to existing URG plants, the model is plausible from a geothermal energy point of view, but with the absence of Li recharge and the circulation of the brine on the same fault, it may be conservative from a Li extraction point of view. However, even in this scenario, a Li production over 30 years is possible without a total depletion of the resource. In comparison to the static model of constant Li concentration, flow rate, and extraction efficiency [5], the mean output of the reference scenario over 30 years is lowered by 24% (from 307 to 234 t/a Li) due to the decreasing Li concentration over time.
Comparing the new Li resource with other metal resources shows that the depletion or concentration decrease is common in raw material projects. Copper mines, for instance, regardless if they have high or low ore grades, show a decrease in the ore grades over the years. A comparative study of 25 copper mines shows an average copper ore grade decrease of 25% within 10 years, but decreases of up to 60% in just 6 years are also observed [80].
Furthermore, fluid-type deposits such as oil fields show similar behaviors. A ramping up of the production is followed by a plateau of constant oil output, followed by a long decline period down to the economic limit of production. However, the mechanisms in this sector are different. In the case of oil deposits, two different immiscible fluids (water and oil) are present. The depletion of the oil content can thus be compensated by an enhanced water injection. This leads to the observation that the decline in raw material concentration is observable quite early, while the decline in daily oil production is delayed due to the increase in the water cut. This enhancing method is not transferable to the geothermal sector, since here the raw material is dissolved in the water and thus adding more water would only dilute the concentration. The timeframe of reaching peak oil production after 7–10 years followed by declining production is similar to the presented Li depletion model [81]. Although the time frame is similar, the decline rates can be steeper. Within 10 years after the peak production, the daily output was observed to decrease up to 50–80% for fields in the U.S. and Denmark. [81]. Important aspects for improving the reservoir behavior are the field size, number of wells, enhancing methods, and the initial oil in place. For maintaining or improving a future Li output, these aspects should be transferred to the combined geothermal energy and Li production. For upcoming projects, concepts should be developed for a Li-in-place determination, enhanced Li recovery methods, as well as sustainable multi-well field development. Furthermore, in terms of multi-well field development, the value of the presented study becomes apparent. The outreach of the Li propagation signal (Figure 5b) indicates a reasonable distance if, for example, multiple wells should target one fault zone. Considering the chemical outreach of 2000 m, a proper safety distance to an adjacent doublet system should be ensured.
Transferring these aspects of established raw material processes to the new potential raw material resources of geothermal brines, different aspects become apparent. The Li depletion has to be taken into account for economic consideration; it is by no means a show-stopper for this promising raw material extraction approach, but shows that with the experience from the known extraction industries, meaningful project life cycles can be developed. A large benefit in comparison is that the combined geothermal energy and raw material extraction have, moreover, the advantage of additional energy output over the whole raw material extraction period.
For comparing the economic potentials of the “products”, energy and Li, the determined capacity of 22 MWTh was compared to the Li productivity. For deriving the economic value of the energy output, the produced energy over time for the specific capacities was calculated and multiplied with the historical mean annual low (6.88 ct/kWh—2005) and high (12.95 ct/kWh—2022) prices for district heating in Germany [82]. The prices were normed to USD (1 EUR = USD 1.06, 16 March 2023) making it comparable to the Li value (Figure 8). For simplified Li value estimations, the accumulated Li production of the reference scenario was calculated as LCE and multiplied with the current price predictions for Li in the future of USD 26,200/t LCE and USD 61,500/t LCE [20].
The consideration only displays the simplified economic value of theoretically producible Li and heat, without considering any production costs. It only demonstrates the high economic potential that Li bears, despite the decrease in Li productivity over time. Even in the worst price scenario, Li derives a value of USD 1 billion over 30 years, exceeding the economic value of the scenario with the highest energy prices of USD 800 million by 20%. Whether it will be more profitable is a question of technical feasibility, but the sheer economic value of the mineral offers great potential for the economics of geothermal energy and the domestic raw material sector.

5. Conclusions

The Li market situation will become more and more acute globally during the next decade. Europe and Germany in particular are plunging into new dependencies on international imports with the planned ramp-up of their battery industry without having significant Li production. Considering the importance of battery supply for the automotive sector, this has to be seen as critical. Raw material supply must be secured long-term to keep the industry crisis-proof and internationally competitive. Li extraction from geothermal brines could contribute to partial independence from the global market and could help to balance out price fluctuations, yet transient reservoir analysis of continuous combined energy and Li extraction were missing.
To analyze the influences on long-term productivity, this study presents the first 3D numerical reservoir case study based on geological features and geothermal production data from the URG. The geothermal model setup represents a typical non-magmatic extensional system. Therefore, the findings on the fluid behavior do not only apply to the URG, but could also be transferred to other geothermal regions with similar settings.
In the generic model, the temperature development only shows a clear breakthrough after 25 years in the 100 L/s scenario and a beginning breakthrough after 30 years in the 80 L/s scenario. Regarding the raw material output, the formulated hypothesis of a chemical Li breakthrough is confirmed in all scenarios under the given model assumptions. The breakthrough occurs between 5 and 10 years, causing a decrease in Li output over time, lowering the Li output up to 50%. In comparison to previous static scenarios based just on flow rate and a fixed Li concentration, the mean Li output is 24% lower in the given simulation. In terms of productivity, it is pointed out that higher flow rates are more decisive than higher initial Li concentrations. This draws attention to the detailed exploration for finding highly permeable structures as well as the necessity for more geothermal wells for enhancing resource availability. To improve the predictions on the long-term behavior, the research about the Li origin will be crucial, as well as analyzing Li recharge from the reservoir or recharge enhancing methods.
However, even without Li recharge and despite the chemical breakthrough, it is demonstrated that under the given model parameters, the production of Li from a geothermal reservoir can be possible in the long term in addition to constant energy production over 30 years. A mean output of 234 t Li, as in the reference scenario, could provide Li for about 17,000–23,000 electric vehicles per year (considering a Li demand of 10–14 kg per battery [83]). With this output, 30–220 geothermal doublets (60–440 wells) of this quality would be necessary for covering the whole predicted Li demand for Germany (7000–51,000 t/a [8,17]). At small or intermediate market developments, the coverage of a large market share with local Li could be achieved, providing 0.5–3% of market coverage with every doublet system of the given mean production per year. Every project potentially leads to more independence from global imports for this key element for electrification, and with the co-production of geothermal energy, also to more independence from imports of energy raw materials. If the upscaling of the extraction process is successful in terms of technical and economic feasibility, the resulting economic value of the accumulated LCE after 30 years ranges between USD 1 and 2.3 billion. This additional value could significantly improve the economics of geothermal plants and could be a pull factor for investments in this renewable energy technology.
To be able to investigate the long-term behavior, closely monitored long-term extraction tests on large volume flows within operating geothermal power plants are now needed. It became apparent that this new approach has indeed similarities with established raw material productions, but for a reasonable characterization and use of these resources, new approaches, as presented in this study, are necessary along the whole value chain. Only then can the potential of the combined heat and raw material production from thermal fluids be finally evaluated for Li, and potentially also for other dissolved elements.

Author Contributions

Conceptualization, V.G., R.E. and F.N.; Formal analysis, V.G.; Investigation, V.G., A.D. and B.B.; Data curation, V.G. and B.B.; Writing—original draft, V.G., A.D. and R.E.; Writing—review & editing, R.E., T.K. and F.N.; Visualization, V.G. and A.D.; Supervision, R.E., T.K. and F.N.; Funding acquisition, T.K. All authors have read and agreed to the published version of the manuscript.

Funding

The authors would like to thank the Helmholtz Association for research funding within the Geoenergy subtopic in the MTET (Materials and Technologies for the Energy Transition) program of the Energy research field. Further, the BMBF (Federal Ministry of Education and Research) is thanked for funding the BrineMine project (Grant Number 033R190B) in the Client II framework.

Data Availability Statement

Data available on request.

Acknowledgments

We would like to thank Bastian Welsch from the University of Applied Sciences Bochum for fruitful discussions and a lively exchange of ideas. Further, we want to thank the GDMB Society of Metallurgists and Miners for enabling lively discussions of this study. This paper is an extended and revised version of our article published in the Proceedings of the European Metallurgical Conference 2023, Düsseldorf, Deutschland, 11–14 June 2023. Finally, three anonymous reviewers are thanked for improving this manuscript through their intensive and constructive discussion.

Conflicts of Interest

The authors declare no conflict of interest.

References

  1. Schmidt, M. Rohstoffrisikobewertung—Lithium: Rohstoffinformationen 33; DERA-Deutsche Rohstoffagentur in der Bundesanstalt für Geowissenschaften und Rohstoffe: Berlin, Germany, 2017. [Google Scholar]
  2. Schmidt, M. Rohstoffrisikobewertung—Lithium: Rohstoffinformationen 54; DERA-Deutsche Rohstoffagentur in der Bundesanstalt für Geowissenschaften und Rohstoffe: Berlin, Germany, 2023; ISBN 9783943566031. [Google Scholar]
  3. Martin, G.; Rentsch, L.; Höck, M.; Bertau, M. Lithium market research—Global supply, future demand and price development. Energy Storage Mater. 2017, 6, 171–179. [Google Scholar] [CrossRef]
  4. Meng, F.; McNeice, J.; Zadeh, S.S.; Ghahreman, A. Review of Lithium Production and Recovery from Minerals, Brines, and Lithium-Ion Batteries. Miner. Process. Extr. Met. Rev. 2021, 42, 123–141. [Google Scholar] [CrossRef]
  5. Goldberg, V.; Nitschke, F.; Kluge, T. Herausforderungen und Chancen für die Lithiumgewinnung aus geothermalen Systemen in Deutschland—Teil 2: Potenziale und Produktionsszenarien in Deutschland. Grundwasser 2022, 27, 261–275. [Google Scholar] [CrossRef]
  6. Europäisches Parlament. Fit Für 55: Abgeordnete Unterstützen Ziel der Emissionsneutralität Für neue Autos und Lieferwagen ab 2035. 2022. Available online: https://www.europarl.europa.eu/news/de/press-room/20220603IPR32129/fit-fur-55-emissionsneutralitat-fur-neue-pkw-und-lieferwagen-ab-2035 (accessed on 1 March 2023).
  7. Europäische Kommission. Widerstandsfähigkeit der EU bei kritischen Rohstoffen: Einen Pfad hin zu größerer Sicherheit und Nachhaltigkeit abstecke; Mitteilung der Kommission an das Europäische Parlament, den Rat, den Europäischen Wirtschafts- und Sozialausschuss und den Ausschuss der Regionen; Version COM(2020) 474 final; Europäische Kommission: Brussels, Belgium, 3 September 2020. [Google Scholar]
  8. DERA. Batterierohstoffe Für die Elektromobilität; DERA Themenheft: Berlin, Germany, 2021. [Google Scholar]
  9. Reich, R.; Slunitschek, K.; Danisi, R.M.; Eiche, E.; Kolb, J. Lithium Extraction Techniques and the Application Potential of Different Sorbents for Lithium Recovery from Brines. Miner. Process. Extr. Met. Rev. 2022, 44, 261–280. [Google Scholar] [CrossRef]
  10. Stringfellow, W.T.; Dobson, P.F. Technology for the Recovery of Lithium from Geothermal Brines. Energies 2021, 14, 6805. [Google Scholar] [CrossRef]
  11. Sanjuan, B.; Gourcerol, B.; Millot, R.; Rettenmaier, D.; Jeandel, E.; Rombaut, A. Lithium-rich geothermal brines in Europe: An up-date about geochemical characteristics and implications for potential Li resources. Geothermics 2022, 101, 102385. [Google Scholar] [CrossRef]
  12. Rettenmaier, D.; Millot, R.; Blandine, G.; Sanjuan, B.; Elodie, J.; Sophie, L.; Clement, B.; Zorn, R. Rohstoff Lithium aus Geothermie—Und aus Europa (EuGeLi—European Geothermal Lithium); Der Geothermie Kongress: Essen, Germany, 2021. [Google Scholar]
  13. Bauer, M.; Freeden, W.; Jacobi, H.; Neu, T. Handbuch Tiefe Geothermie; Springer Spektrum: Berlin/Heidelberg, Germany, 2014; ISBN 9783642545108. [Google Scholar]
  14. Goldberg, V.; Kluge, T.; Nitschke, F. Herausforderungen und Chancen für die Lithiumgewinnung aus geothermalen Systemen in Deutschland—Teil 1: Literaturvergleich bestehender Extraktionstechnologien. Grundwasser 2022, 27, 239–259. [Google Scholar] [CrossRef]
  15. Dilger, G.; Deinhardt, A.; Reimer, D.; Link, K.; Zwicklhuber, K.; Götzl, G. Tiefe Geothermie-Projekte in Deutschland 2021/2022. Geotherm. Energ. Fachz. Für Geotherm. Forsch. Anwend. Dtschl. Osterr. Der Schweiz 2021, 30, 100. [Google Scholar]
  16. Bridge, G.; Faigen, E. Towards the lithium-ion battery production network: Thinking beyond mineral supply chains. Energy Res. Soc. Sci. 2022, 89, 102659. [Google Scholar] [CrossRef]
  17. Fraunhofer ISI. Geplante Gesamte Batteriezellproduktionskapazität [GWh]. BMBF-Geförderten Begleitmaßnahme BEMA 2020 II. 2022. Available online: https://www.isi.fraunhofer.de/de/presse/2022/presseinfo-17-Batteriezellfertigung-Verzehnfachung-2030.html (accessed on 15 March 2023).
  18. Trading Economics. Lithium. 2022. Available online: https://tradingeconomics.com/commodity/lithium (accessed on 14 November 2022).
  19. Trading Economics. Lithium Carbonate Prices. 2023. Available online: https://tradingeconomics.com/commodity/lithium (accessed on 15 March 2023).
  20. Steiger, K.; Hilgers, C.; Kolb, J. Lithiumbedarf Für Die Batteriezellen-Produktion in Deutschland Und Europa Im Jahr 2030; KIT: Karlsruhe, Germany, 2022. [Google Scholar]
  21. Geyer, O.F.; Gwinner, M.; Simon, T. Geologie von Baden-Württemberg, 5, Völlig neu Bearbeitete Auflage; Schweizerbart: Stuttgart, Germany, 2011; ISBN 978-3-510-65267-9. [Google Scholar]
  22. Eisbacher, G.H.; Fielitz, W. Karlsruhe und seine Region. In Sammlung Geologischer Führer Band 103; Gebrüder Borntraeger Verlagsbuchhandlung: Stuttgart, Germany, 2010. [Google Scholar]
  23. Grimmer, J.C.; Ritter, J.R.R.; Eisbacher, G.H.; Fielitz, W. The Late Variscan control on the location and asymmetry of the Upper Rhine Graben. Int. J. Earth Sci. 2017, 106, 827–853. [Google Scholar] [CrossRef]
  24. Sanjuan, B.; Millot, R.; Innocent, C.; Dezayes, C.; Scheiber, J.; Brach, M. Major geochemical characteristics of geothermal brines from the Upper Rhine Graben granitic basement with constraints on temperature and circulation. Chem. Geol. 2016, 428, 27–47. [Google Scholar] [CrossRef]
  25. Vidal, J.; Genter, A. Overview of naturally permeable fractured reservoirs in the central and southern Upper Rhine Graben: Insights from geothermal wells. Geothermics 2018, 74, 57–73. [Google Scholar] [CrossRef]
  26. Vulcan Energy Vulcan Zero Carbon LithiumTM Project Phase One DFS Results and Resources-Reserves Update. 2023. Available online: https://v-er.eu/vulcan-zero-carbon-lithium-project-phase-one-dfs-results-and-resources-reserves-update/ (accessed on 15 March 2023).
  27. Q-con GmbH; Deutsche Erdwärme GmbH Seismische Gefährdungsstudie für das Geothermieprojekt. 2020. Available online: https://www.graben-neudorf.de/index.php?id=382 (accessed on 15 March 2023).
  28. Moeck, I.S. Catalog of geothermal play types based on geologic controls. Renew. Sustain. Energy Rev. 2014, 37, 867–882. [Google Scholar] [CrossRef] [Green Version]
  29. Eggeling, L.; Herr, K.; Goldberg, V.; Siefert, D.; Köhler, J.; Kölbel, T.; Reith, S. Schlussbericht zum Verbundprojekt ANEMONA. Anlagenmonitoring als Schlüsseltechnologie für den erfolgreichen Betrieb von Geothermiekraftwerken in Deutschland; EnBW AG: Karlsruhe, Germany, 2018. [Google Scholar]
  30. Uhde, J. Welcome to the Geothermal Power Plant Insheim. In Proceedings of the 9th European Geothermal Workshop, Karlsruhe, Germany, 23–24 September 2021. [Google Scholar]
  31. Drüppel, K.; Stober, I.; Grimmer, J.C.; Mertz-Kraus, R. Experimental alteration of granitic rocks: Implications for the evolution of geothermal brines in the Upper Rhine Graben, Germany. Geothermics 2020, 88, 101903. [Google Scholar] [CrossRef]
  32. Bąbel, M.; Schreiber, B.C. Geochemistry of Evaporites and Evolution of Seawater. In Treatise on Geochemistry; Elsevier: Amsterdam, The Netherlands, 2014; Volume 9, pp. 483–560. ISBN 9780080983004. [Google Scholar]
  33. Burisch, M.; Walter, B.F.; Gerdes, A.; Lanz, M.; Markl, G. Late-stage anhydrite-gypsum-siderite-dolomite-calcite assemblages record the transition from a deep to a shallow hydrothermal system in the Schwarzwald mining district, SW Germany. Geochim. et Cosmochim. Acta 2018, 223, 259–278. [Google Scholar] [CrossRef]
  34. Aquilina, L.; Ladouche, B.; Doerfliger, N.; Seidel, J.L.; Bakalowicz, M.; Dupuy, C.; Le Strat, P. Origin, evolution and residence time of saline thermal fluids (Balaruc springs, southern France): Implications for fluid transfer across the continental shelf. Chem. Geol. 2002, 192, 1–21. [Google Scholar] [CrossRef]
  35. Egert, R.; Gholami Korzani, M.; Held, S.; Kohl, T. Implications on large-scale flow of the fractured EGS reservoir Soultz inferred from hydraulic data and tracer experiments. Geothermics 2020, 84, 101749. [Google Scholar] [CrossRef]
  36. Sanjuan, B.; Scheiber, J.; Gal, F.; Touzelet, S.; Genter, A.; Villadangos, G. Inter-well chemical tracer testing at the Rittershoffen geothermal site (Alsace, France). In Proceedings of the European Geothermal Congress 2016, Strasbourg, France, 19–24 September 2016. [Google Scholar]
  37. Regenspurg, S.; Feldbusch, E.; Norden, B.; Tichomirowa, M. Fluid-rock interactions in a geothermal Rotliegend/Permo-Carboniferous reservoir (North German Basin). Appl. Geochem. 2016, 69, 12–27. [Google Scholar] [CrossRef]
  38. Palmer, T.D.; Howard, J.H.; Lande, D.P. Geothermal Development of the Salton Trough, California and Mexico, UCRL-51775; U.S. Department of Commerce: Livermore, CA, USA, 1975. [Google Scholar]
  39. Bertold, C.E.; Baker, D.H. Lithium recovery from geothermal fluids, in: Lithium resources and requirements by the year 2000. Geol. Surv. Prof. Pap. 1976, 1005, 61–66. [Google Scholar]
  40. Liu, G.; Zhao, Z.; Ghahreman, A. Novel approaches for lithium extraction from salt-lake brines: A review. Hydrometallurgy 2019, 187, 81–100. [Google Scholar] [CrossRef]
  41. Nguyen, T.H.; Lee, M.S. A review on the separation of lithium ion from leach liquors of primary and secondary resources by solvent extraction with commercial extractants. Processes 2018, 6, 55. [Google Scholar] [CrossRef] [Green Version]
  42. Shi, C.; Jing, Y.; Xiao, J.; Wang, X.; Yao, Y.; Jia, Y. Solvent extraction of lithium from aqueous solution using non-fluorinated functionalized ionic liquids as extraction agents. Sep. Purif. Technol. 2017, 172, 473–479. [Google Scholar] [CrossRef]
  43. Xiang, W.; Liang, S.; Zhou, Z.; Qin, W.; Fei, W. Extraction of lithium from salt lake brine containing borate anion and high concentration of magnesium. Hydrometallurgy 2016, 166, 9–15. [Google Scholar] [CrossRef]
  44. Xiang, W.; Liang, S.; Zhou, Z.; Qin, W.; Fei, W. Lithium recovery from salt lake brine by counter-current extraction using tributyl phosphate/FeCl3 in methyl isobutyl ketone. Hydrometallurgy 2017, 171, 27–32. [Google Scholar] [CrossRef]
  45. Yu, X.; Fan, X.; Guo, Y.; Deng, T. Recovery of lithium from underground brine by multistage centrifugal extraction using tri-isobutyl phosphate. Sep. Purif. Technol. 2019, 211, 790–798. [Google Scholar] [CrossRef]
  46. Swain, B. Recovery and recycling of lithium: A review. Sep. Purif. Technol. 2017, 172, 388–403. [Google Scholar] [CrossRef]
  47. Zhang, Z.; Jia, Y.; Liu, B.; Sun, H.; Jing, Y.; Zhang, Q.; Shao, F.; Qi, M.; Yao, Y. Study on behavior of lithium ion in solvent extraction and isotope separation. J. Mol. Liq. 2021, 324, 114709. [Google Scholar] [CrossRef]
  48. Park, J.; Jung, Y.; Kusumah, P.; Lee, J.; Kwon, K.; Lee, C.K. Application of ionic liquids in hydrometallurgy. Int. J. Mol. Sci. 2014, 15, 15320–15343. [Google Scholar] [CrossRef] [PubMed]
  49. Reich, R.; Danisi, R.M.; Kluge, T.; Eiche, E.; Kolb, J. Structural and compositional variation of zeolite 13X in lithium sorption experiments using synthetic solutions and geothermal brine. Microporous Mesoporous Mater. 2023, 359, 112623. [Google Scholar] [CrossRef]
  50. Battistel, A.; Palagonia, M.S.; Brogioli, D.; La Mantia, F.; Trócoli, R. Electrochemical Methods for Lithium Recovery: A Comprehensive and Critical Review. Adv. Mater. 2020, 32, 1905440. [Google Scholar] [CrossRef] [Green Version]
  51. Calvo, E.J. Electrochemical methods for sustainable recovery of lithium from natural brines and battery recycling. Curr. Opin. Electrochem. 2019, 15, 102–108. [Google Scholar] [CrossRef]
  52. Romero, V.C.E.; Llano, K.; Calvo, E.J. Electrochemical extraction of lithium by ion insertion from natural brine using a flow-by reactor: Possibilities and limitations. Electrochem. commun. 2021, 125, 106980. [Google Scholar] [CrossRef]
  53. Li, X.; Mo, Y.; Qing, W.; Shao, S.; Tang, C.Y.; Li, J. Membrane-based technologies for lithium recovery from water lithium resources: A review. J. Memb. Sci. 2019, 591, 117317. [Google Scholar] [CrossRef]
  54. Adionics Adionics. 2021. Available online: http://www.adionics.com/en/homepage/markets/Lithium (accessed on 31 January 2022).
  55. Eramet Eramet. 2021. Available online: https://www.eramet.com/en/eramet-and-electricite-de-strasbourg-announce-success-first-pilot-test-extract-lithium-geothermal (accessed on 31 January 2022).
  56. Geolith Geolith. 2021. Available online: https://en.geolith.fr/copie-de-technologies (accessed on 31 January 2022).
  57. Unlimited Unlimited. 2021. Available online: https://www.geothermal-lithium.org/ (accessed on 31 January 2022).
  58. Wedin, F. Vulcan Energy Resources 2022 Corporate presentation Q1 2022. Available online: www.v-er.eu (accessed on 15 July 2022).
  59. Goldberg, V.; Winter, D.; Nitschke, F.; Held, S.; Groß, F.; Pfeiffle, D.; Uhde, J.; Morata, D.; Koschikowski, J.; Kohl, T. Development of a continuous silica treatment strategy for metal extraction processes in operating geothermal plants. Desalination 2023, 564, 116775. [Google Scholar] [CrossRef]
  60. Leiter, C.; Elsner, M. Geologische Vorausprofile der Bohrungen GN-Th-1 & GN-Th-2, Graben-Neudorf. Hauptbetriebsplan—Geotherm. Graben-neud. 2020. Available online: https://www.graben-neudorf.de/index.php?id=382 (accessed on 15 March 2023).
  61. Bauer, J.F.; Meier, S.; Philipp, S.L. Architecture, fracture system, mechanical properties and permeability structure of a fault zone in Lower Triassic sandstone, Upper Rhine Graben. Tectonophysics 2015, 647, 132–145. [Google Scholar] [CrossRef]
  62. Choi, J.H.; Edwards, P.; Ko, K.; Kim, Y.S. Definition and classification of fault damage zones: A review and a new methodological approach. Earth Sci. Rev. 2016, 152, 70–87. [Google Scholar] [CrossRef]
  63. Geuzaine, C.; Remacle, J.-F. Gmsh: A 3-D finite element mesh generator with built-in pre- and post-processing facilities. Int. J. Numer. Methods Eng. 2009, 79, 1309–1331. [Google Scholar] [CrossRef]
  64. Stricker, K.; Grimmer, J.C.; Egert, R.; Bremer, J.; Korzani, M.G.; Schill, E.; Kohl, T. The potential of depleted oil reservoirs for high-temperature storage systems. Energies 2020, 13, 6510. [Google Scholar] [CrossRef]
  65. Evans, J.P.; Forster, C.B.; Goddard, J.V. Permeability of fault-related rocks, and implications for hydraulic structure of fault zones. J. Struct. Geol. 1997, 19, 1393–1404. [Google Scholar] [CrossRef]
  66. Francke, H.; Thorade, M. Density and viscosity of brine: An overview from a process engineers perspective. Geochemistry 2010, 70, 23–32. [Google Scholar] [CrossRef] [Green Version]
  67. Ramalingam, A.; Arumugam, S. Experimental study on specific heat of hot brine for salt gradient solar pond application. Int. J. ChemTech Res. 2012, 4, 956–961. [Google Scholar]
  68. Toner, J.D.; Catling, D.C. A Low-Temperature Thermodynamic Model for the Na-K-Ca-Mg-Cl System Incorporating New Experimental Heat Capacities in KCl, MgCl2, and CaCl2 Solutions. J. Chem. Eng. Data 2017, 62, 995–1010. [Google Scholar] [CrossRef]
  69. Schneider, M. Geothermie Macht Unterhaching Unabhängig: Ein Dorf Braucht Keinen Gaspreisdeckel. Available online: https://www.merkur.de/wirtschaft/unterhaching-geothermie-germering-kosten-waerme-heizen-heizung-bayern-energiekrise-gaspreisdeckel-92017391.html (accessed on 17 March 2023).
  70. Gholami Korzani, M.; Held, S.; Kohl, T. Numerical based filtering concept for feasibility evaluation and reservoir performance enhancement of hydrothermal doublet systems. J. Pet. Sci. Eng. 2020, 190, 106803. [Google Scholar] [CrossRef]
  71. Permann, C.J.; Gaston, D.R.; Andrš, D.; Carlsen, R.W.; Kong, F.; Lindsay, A.D.; Miller, J.M.; Peterson, J.W.; Slaughter, A.E.; Stogner, R.H.; et al. MOOSE: Enabling massively parallel multiphysics simulation. SoftwareX 2020, 11, 100430. [Google Scholar] [CrossRef]
  72. Yan, G.; Busch, B.; Egert, R.; Esmaeilpour, M.; Stricker, K.; Kohl, T. Transport mechanisms of hydrothermal convection in faulted tight sandstones. EGUsphere 2022. [Google Scholar] [CrossRef]
  73. Egert, R.; Gholami Korzani, M.; Held, S.; Kohl, T. Thermo-hydraulic Modeling of an Enhanced Geothermal System in the Upper Rhine Graben Using MOOSE/TIGER. In Proceedings of the World Geothermal Congress (WGC 2021), Reykjavík, Iceland, 21–26 May 2021. [Google Scholar]
  74. Bear, J. Dynamics of Fluids in Porous Media; American Elsevier (Environmental science series): New York, NY, USA, 1972. [Google Scholar]
  75. Dashti, A.; Gholami Korzani, M.; Geuzaine, C.; Egert, R.; Kohl, T. Impact of structural uncertainty on tracer test design in faulted geothermal reservoirs. Geothermics 2023, 107, 102607. [Google Scholar] [CrossRef]
  76. Baujard, C.; Genter, A.; Dalmais, E.; Maurer, V.; Hehn, R.; Rosillette, R.; Vidal, J.; Schmittbuhl, J. Hydrothermal characterization of wells GRT-1 and GRT-2 in Rittershoffen, France: Implications on the understanding of natural flow systems in the rhine graben. Geothermics 2017, 65, 255–268. [Google Scholar] [CrossRef] [Green Version]
  77. Held, S.; Genter, A.; Kohl, T.; Kölbel, T.; Sausse, J.; Schoenball, M. Economic evaluation of geothermal reservoir performance through modeling the complexity of the operating EGS in Soultz-sous-Forêts. Geothermics 2014, 51, 270–280. [Google Scholar] [CrossRef]
  78. Faltlhauser, M. Zahlen und Fakten zur Stromversorgung in Deutschland 2016; Wirtschaftsbeirat Bayern: München, Germany, 2016; pp. 1–24. [Google Scholar]
  79. Ghergut, J.; Wiegand, B.; Behrens, H.; Sauter, M. Model-Independent, and Model- Dependent Aspects of ‘Geothermal Solute’ Co-Production Forecast for Hydrothermal vs. Petrothermal Reservoirs. In Proceedings of the 48th Workshop on Geothermal Reservoir Engineering, Stanford, CA, USA, 6–8 February 2023; pp. 1–9. [Google Scholar]
  80. Calvo, G.; Mudd, G.; Valero, A.; Valero, A. Decreasing Ore Grades in Global Metallic Mining: A Theoretical Issue or a Global Reality? Resources 2016, 5, 36. [Google Scholar] [CrossRef] [Green Version]
  81. Höök, M.; Davidsson, S.; Johansson, S.; Tang, X. Decline and depletion rates of oil production: A comprehensive investigation. Philos. Trans. R. Soc. A Math. Phys. Eng. Sci. 2014, 372, 20120448. [Google Scholar] [CrossRef]
  82. Destatis. Energiepreisentwicklung. 2023. Available online: https://www.destatis.de/DE/Themen/Wirtschaft/Preise/Publikationen/Energiepreise/energiepreisentwicklung-pdf-5619001.html (accessed on 15 March 2023).
  83. Xu, C.; Dai, Q.; Gaines, L.; Hu, M.; Tukker, A.; Steubing, B. Future material demand for automotive lithium-based batteries. Commun. Mater. 2020, 1, 10. [Google Scholar] [CrossRef]
Figure 1. (a) Preliminary global Li production for 2021 and its global distribution (Data: [2]). (b) Global demand prediction for Li in 2030 for different yearly growth predictions (316,300 t, 426,700 t, 558,800 t) in comparison to the predicted global production scenarios (conservative: 217,890 t, optimistic: 357,680 t) (Data: [2]).
Energies 16 05899 g001
Figure 2. (a) A 3D reservoir model with all implemented geological units. (b) Enlarged view of the fault zone and the wells. For clarity, the layers outside the damage zone and the damage zone of the reservoir are not displayed.
Energies 16 05899 g002
Figure 3. (a) A general overview of a cross-section of the model containing five layers and a damage and a core zone. The whole model is a box with 12 km × 7 km × 3.5 km extension in x, y, and z directions, respectively. (b) A closer view of the mesh size distribution adjacent to the injection (red arrow) and production (blue arrow) wells penetrating the damage zone with 250 m width. A 10 m core zone is highlighted in this subplot.
Energies 16 05899 g003
Figure 4. (a) Temperature change over time at the production well at different flow rates. (b) Maximum pressure changes at the injection and production well after 30 years.
Energies 16 05899 g004
Figure 5. (a) Temperature change around the injection well along the fault zone after 30 years in the reference scenario. For clarity, only parts of the fault, the reservoir, and the bottom layer are displayed. The white contour shows the propagation of a temperature drop of −5 K. (b) Solute distribution around the injection well along the fault zone after 30 years in the reference scenario. For clarity, only parts of the fault, the reservoir, and the bottom layer are displayed. The white contour shows the spread of a residual solute concentration of 10%.
Energies 16 05899 g005
Figure 6. Development of the solute concentration at the production well over time for different flow rates and extraction efficiencies.
Energies 16 05899 g006
Figure 7. (a) Productivity of the different scenarios in [t/year]. For all scenarios, the specific product, the amount of extracted Li, was calculated based on the solute concentration for each time step and normed to one year. (b) Accumulated Li2CO3 production over time. Based on the productivity and the differences in the time steps, the accumulated Li2CO3 production was determined.
Energies 16 05899 g007
Figure 8. Predicted economic values of the products heat and Li2CO3. Reference Li extraction scenario with 80 L/s, 180 mg/L Li initially, and an extraction efficiency of 75% and Li2CO3 prices between USD 26,200/t and USD 61,500/t. Heat extraction scenario from the same model for an initial temperature at the production well of 160 °C, reinjection temperature of 65 °C and 90% efficiency at direct heat use with market prices between 6.88 ct/kWh and 12.95 ct/kWh.
Energies 16 05899 g008
Table 1. Parametrization of the geological reservoir model based on [27]. * Data not given in the model and added under comparison with additional data source [64]. ** The fault core was implemented uniformly defined for all geological units as a tight, hydraulic impermeable unit. Data added under comparison with additional data sources [64,65].
LayersPorosity [%]Permeability [m2]Thermal Conductivity [W/(m.K)]Matrix Density [kg/m3]Specific Heat Capacity [J/(kg.K)]
Top layer4* 7 × 10−142.52400730
Top layer damage zone* 2.71 × 10⁻¹³
Keuper45.42 × 10−162.52400730
Keuper damage zone2.71 × 10−15
Muschelkalk31.29 × 10−1522400730
Muschelkalk damage zone6.46 × 10−15
Upper Buntsandstein92.3 × 10−1532300710
Upper Buntsandstein damage zone1.15 × 10−14
Buntsandstein (reservoir) 92.3 × 10−1532300710
Reservoir damage zone1.21 × 10−13
Basement0.53.45 × 10−183.42600900
Basement damage zone1.73 × 10−17
Core zone** 0.5** 3.45 × 10⁻¹⁸** 2.5** 2400** 730
Table 2. Parameter variation for the sensitivity analysis and their relative change in comparison to the reference scenario.
Model NameExtraction Efficiency [%]Flow Rate [kg/s]Li Concentration [mg/s]
Reference Model7580180
55% Ex55 (−27%)80180
95% Ex95 (+27%)80180
60 L/s7560 (−25%)180
100 L/s75100 (+25%)180
160 mg/L7580160 (−11%)
200 mg/L7580200 (+11%)
Table 3. Results of the different simulation scenarios and their relative influence on Li production parameters on the reference scenario.
Model NameInitial Productivity [t/a]Final Productivity [t/a]Accumulated Li Production [t]Mean Output over 30 Years [t/a]
Reference Model3071756920234
55% Ex225 (−27%)148 (−15%)5465 (−21%)185 (−21%)
95% Ex388 (+27%)194 (+11%)8148 (+18%)275 (+18%)
60 L/s230 (−25%)139 (−21%)5554 (−20%)188 (−20%)
100 L/s383 (+25%)210 (+20%)8150 (+18%)275 (+18%)
160 mg/L272 (−11%)156 (−11%)6151 (−11%)208 (−11%)
200 mg/L340 (+11%)195 (+11%)7689 (+11%)260 (+11%)
Disclaimer/Publisher’s Note: The statements, opinions and data contained in all publications are solely those of the individual author(s) and contributor(s) and not of MDPI and/or the editor(s). MDPI and/or the editor(s) disclaim responsibility for any injury to people or property resulting from any ideas, methods, instructions or products referred to in the content.

